Long-term bare-fallow soil fractions reveal thermo-chemical properties controlling soil organic carbon dynamics - Biogeosciences
←
→
Page content transcription
If your browser does not render page correctly, please read the page content below
Biogeosciences, 18, 1703–1718, 2021
https://doi.org/10.5194/bg-18-1703-2021
© Author(s) 2021. This work is distributed under
the Creative Commons Attribution 4.0 License.

Long-term bare-fallow soil fractions reveal thermo-chemical
properties controlling soil organic carbon dynamics
Mathieu Chassé1 , Suzanne Lutfalla2,3 , Lauric Cécillon2,4 , François Baudin5 , Samuel Abiven2,6,7 , Claire Chenu3 , and
Pierre Barré2
1 Sorbonne  Université, Muséum national d’Histoire naturelle, UMR CNRS 7590, IRD, Institut de minéralogie,
de physique des matériaux et de cosmochimie, IMPMC, 75005 Paris, France
2 Laboratoire de Géologie, École normale supérieure, CNRS, Université PSL, IPSL, 75005 Paris, France
3 Université Paris–Saclay, INRAE, AgroParisTech, UMR 1402 ECOSYS, 78850 Thiverval-Grignon, France
4 Laboratoire ECODIV, Univ. Normandie, UNIROUEN, INRAE, FR Scale CNRS 3730, 76000 Rouen, France
5 Sorbonne Université, CNRS UMR 7193, Institut des Sciences de la Terre de Paris (ISTeP), 75005 Paris, France
6 Department of Geography, University of Zurich, 8057 Zurich, Switzerland
7 Centre de recherche en écologie expérimentale et prédictive (CEREEP–Ecotron IleDeFrance), Département de biologie

de l’ENS, Université PSL, CNRS, 77140 St-Pierre-lès-Nemours, France

Correspondence: Mathieu Chassé (mathieu.chasse@normalesup.org)

Received: 19 May 2020 – Discussion started: 26 October 2020
Revised: 16 December 2020 – Accepted: 29 January 2021 – Published: 10 March 2021

Abstract. Evolution of organic carbon content in soils has       fractions (> 20 µm) are rich in centennially persistent organic
the potential to be a major driver of atmospheric greenhouse     carbon, representing ca. 20 % of the initial organic carbon
gas concentrations over the next century. Understanding soil     stock, due to the chemical recalcitrance of organic matter
carbon dynamics is a challenge due to a wide range of res-       in these fractions, dominated by pyrogenic organic carbon.
idence times of soil organic matter and limited constraints      A second pool of persistent organic carbon, representing ca.
on the mechanisms influencing its persistence. In particular,    15 % of the initial organic carbon stock, is associated with
large uncertainties exist regarding the persistence of pyro-     the clay fraction, indicating mechanisms of protection occur-
genic organic carbon in soils. In order to characterize or-      ring at the submicron scale (< 2 µm). This persistent organic
ganic matter with varying degrees of persistence and to dis-     carbon only represents 30 % of the organic carbon initially
tinguish pyrogenic organic carbon, we combined Rock-Eval         present in the clay fraction. Persistent organic carbon exhibits
analysis, a thermo-chemical method, with the benzene poly-       heterogeneous chemical signatures depending on the consid-
carboxylic acid molecular marker method and Raman spec-          ered pool but a consistent thermal signature demonstrating
troscopy to characterize samples from long-term bare-fallow      the relationship between thermal stability and biogeochemi-
experiments, progressively depleted in the most labile or-       cal stability of soil organic carbon. This gives the possibility
ganic carbon over time. Considering the heterogeneity of soil    of assessing the size of the persistent organic carbon pool
samples, size fractions have been separated to distinguish       in soils using thermal parameters. The persistence of pyro-
pools of organic carbon with distinct properties. We observe     genic organic carbon in the clay fraction is similar to the one
that organic carbon dynamics is dependent on granulome-          of total organic carbon. The different persistence of coarse
try. A pool of organic carbon with intermediate residence        and fine pyrogenic organic carbon resides in the highly con-
times, from years to a few decades, representing ca. 65 %        densed nature of sand-sized pyrogenic carbon, which may
of the bulk soil organic carbon stock, is mainly associated      result from burning temperatures over 700 ◦ C. Pyrogenic or-
with fine fractions (< 20 µm). With time under bare fallow,      ganic carbon is not inert but exhibits a consistent increase
this organic carbon is progressively transferred towards finer   in the level of condensation with time in all size fractions,
fractions through the breakdown of organic matter. Coarse        showing the role of chemical quality in pyrogenic organic

Published by Copernicus Publications on behalf of the European Geosciences Union.
1704                            M. Chassé et al.: Bare-fallow soil fractions reveal contrasted soil organic carbon dynamics

carbon persistence. Overall, this study helps improve the sep-      pected to be a major pool of persistent OC. However, PyOC
aration, evaluation and characterization of carbon pools with       residues are a mixture of chemical phases with distinct phys-
distinct residence times in soils and gives insight into the        ical states (Keiluweit et al., 2010). Depending on the degree
mechanistic origin of soil organic carbon dynamics.                 of aromaticity and substitution, PyOC can display contrasted
                                                                    properties (Wiedemeier et al., 2015). Studies on PyOC per-
                                                                    sistence in soil find a large range of residence time (Singh
                                                                    et al., 2012). The processes responsible for PyOC persistence
1   Introduction                                                    and its contribution to the persistent SOC pool remain to be
                                                                    determined (Lutfalla et al., 2017).
Improved management and forecast of soil organic carbon                The determination of SOC chemistry and of the charac-
(SOC) stock evolution is a crucial challenge to soil secu-          teristics of organo-mineral interactions leading to SOC per-
rity (e.g. Lal, 2004; Koch et al., 2013) as well as to climate      sistence is made difficult by the absence of a procedure to
change models and the associated mitigation strategies (e.g.        separate SOC with different residence times (Poeplau et al.,
Eglin et al., 2010; Ciais et al., 2014). A wide range of SOC        2018). Long-term bare-fallow (LTBF) field experiments are
residence times are observed in soils, from days to millen-         a simple and effective way to isolate centennially persistent
nia (Trumbore, 2000). The processes behind this remain elu-         SOC (Barré et al., 2010). In these field experiments, inputs
sive due to the varied chemical nature of organic compounds         of C to the soil were stopped decades ago, and samples from
and complex interactions with the mineral matrix and mi-            various plots were regularly collected and stored since the
crobial decomposers (e.g. Gleixner, 2013; Barré et al., 2014;       beginning of the experiment. With time, the most labile or-
Kögel-Knabner, 2017). Nonetheless, models simulate C out-           ganic compounds have been mineralized, leading to enrich-
puts resulting from SOC mineralization using different SOC          ments in persistent SOC. Among the methods available to
pools distinguished on the basis of C dynamics (e.g. Parton         study the biogeochemical stability of SOC, thermal analy-
et al., 1987; Coleman and Jenkinson, 1996). The accuracy            ses proved to be efficient due to the correlation between the
of the models is limited by insufficient constraints on the         energy required for thermal and biological oxidation (Gre-
size of these pools, in particular regarding the most persis-       gorich et al., 2015). In particular, the Rock-Eval (RE) method
tent one, hereafter referred to as the centennially persistent      has successfully emerged for studying the biogeochemical
SOC pool (e.g. Todd-Brown et al., 2013; Luo et al., 2016).          stability of soil OM (Barré et al., 2016) to quantify the size
   The challenge arises from the limited understanding of           of the persistent SOC pool (Cécillon et al., 2018) or to es-
the origin of long-term SOC persistence (Schmidt et al.,            timate the proportion of particulate OM (Soucémarianadin
2011). Persistence is expected to depend on three major pro-        et al., 2018). This method provides thermo-chemical mea-
cesses (Sollins et al., 1996): (i) physical protection (Bales-      surements from the sequential ramped pyrolysis and oxida-
dent et al., 2000), (ii) physico-chemical protection (von Lüt-      tion of a sample (Behar et al., 2001). In addition to ther-
zow et al., 2006) and (iii) chemical recalcitrance (Angst et al.,   mal characterization of SOC, information on OM chemistry
2016). (i) The physical protection is related to the accessibil-    can be obtained (Saenger et al., 2013). Chemical indices can
ity of SOC to decomposers, either depending on the distance         be derived from the analysis and related to OM stoichiom-
between SOC particles, limiting the likelihood of degrada-          etry (Disnar et al., 2003). Specifically, PyOC being a sub-
tion by microorganisms (Don et al., 2013), or on the forma-         stantial SOC component in several LTBF samples (Lutfalla
tion of clay-sized aggregates, entrapping SOC and making it         et al., 2017), it gives the possibility of focusing on the ori-
inaccessible to microorganisms (Chenu et al., 2009). (ii) The       gin of long-term persistence of PyOC compounds. The burn-
interaction between SOC and mineral particles determines            ing temperature of PyOC has been related to its long-term
an energy barrier inducing the physico-chemical protection          residence in soils (Zimmerman, 2010). This temperature can
of organic matter (OM) against decomposition (Mikutta and           be estimated using a Raman-based thermometer (Deldicque
Kaiser, 2011). (iii) Organic matter chemistry controls the          et al., 2016). The influence of burning temperature is related
chemical energy available for soil heterotrophic microor-           to the chemical quality of PyOC, which can also be influ-
ganisms, which can result in different rates of decomposi-          enced by the parent material and the conditions of PyOC
tion (Manzoni et al., 2010). Even if chemical recalcitrance         preservation in soils (Spokas, 2010). The chemical qual-
is regarded as a secondary parameter to explain bulk SOC            ity of PyOC depends on the aromaticity and the degree of
persistence (Amelung et al., 2008), it could be a relevant          aromatic condensation of the material, both described by
parameter for a specific form of SOC: pyrogenic organic             the benzene polycarboxylic acid (BPCA) molecular marker
carbon (PyOC; Schmidt et al., 2011). Also referred to as            method (Wiedemeier et al., 2015).
black carbon, charcoal or fire-derived OM, it is ubiquitous in         Thermo-chemical analyses are often limited to bulk LTBF
soils, representing ca. 15 % of the SOC on average (Reisser         samples, implicitly assuming homogeneous properties of
et al., 2016). It is a charred residue derived from the incom-      SOC within a soil sample. However, soil fractionation shows
plete burning of biomass. As PyOC mineralizes slowly com-           that functionally distinct OM pools can be distinguished
pared to the initial biomass (Lehmann et al., 2015), it is ex-      from bulk soil samples (von Lützow et al., 2007), and rare

Biogeosciences, 18, 1703–1718, 2021                                                   https://doi.org/10.5194/bg-18-1703-2021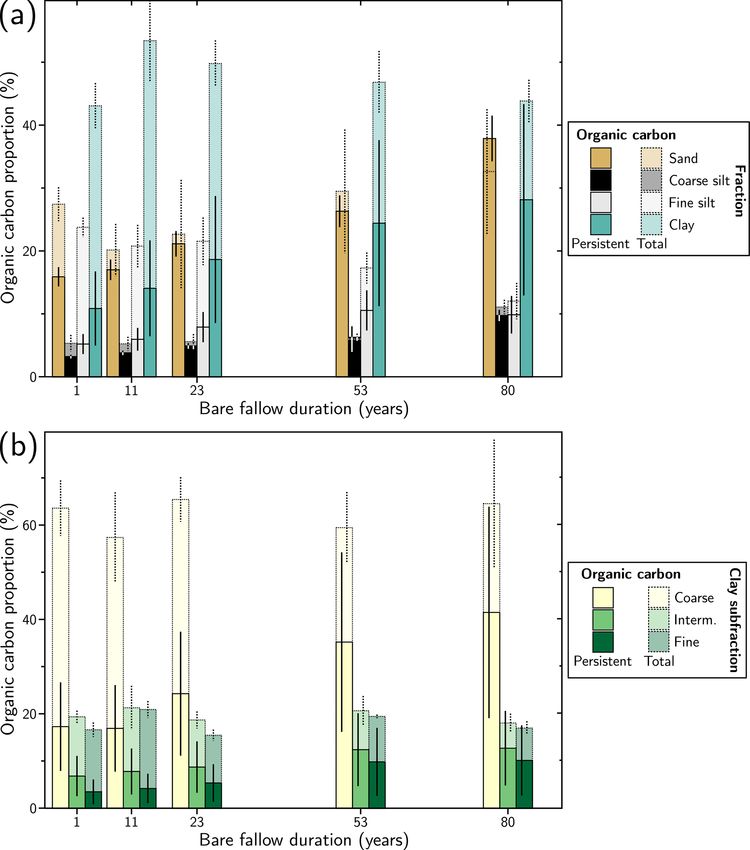
M. Chassé et al.: Bare-fallow soil fractions reveal contrasted soil organic carbon dynamics                                   1705

studies on fractionated LTBF samples indicate variations in        lowed the recovery of a clay-size fraction (< 2 µm) equiva-
OM quality (Plante et al., 2005). To provide new insight           lent in proportion to that achieved during standard particle-
into the thermo-chemical characteristics of SOC in relation        size fractionation (Balesdent et al., 1991). At that stage, the
to C dynamics, with emphasis on PyOC, we studied SOC               solution was centrifuged at 79 g for 12 min to isolate the clay
with contrasted persistence by combining RE analyses, Ra-          fraction and then at 5 g for 1 min to isolate the silt fractions.
man spectroscopy and the BPCA molecular marker method              Before weighing, sand and coarse silt fractions were oven-
on size-fractionated samples from the oldest, 80-year, LTBF        dried at 60 ◦ C, while the fine silt and clay fractions were
experiments in France. The objectives and hypotheses of this       freeze-dried. Total mass recovery was 99.1 % (standard de-
work are threefold. (i) We aim to identify SOC pools with          viation = 0.4 %).
distinct dynamics (i.e. persistence and decline of OC in the          As organo-mineral interactions occur at the submicron
soil and between soil compartments due to mineralization,          scale and induce variable SOC residence time depending on
leaching or transfer towards other soil fractions) as the het-     the size of clay subfractions (Balesdent et al., 1987), coarse,
erogeneous properties of the studied fractions should lead to      intermediate and fine clay subfractions ((0.2–2), (0.05–0.2)
varied SOC residence times, giving the opportunity to sep-         and < 0.05 µm) were obtained from the clay fraction (Lut-
arate SOC into distinct pools. (ii) We want to determine the       falla et al., 2018). Two grams of clay subsamples were sus-
thermo-chemical characteristics of each pool as their dynam-       pended in water and sonicated at 320 J mL−1 . The sonicated
ics is expected to depend on their stoichiometry (e.g. H and       suspension was then sequentially centrifuged at 23 056 g
O content), chemistry (e.g. aromaticity for PyOC) and ther-        for 61 min to isolate the fine fraction and at 5764 g for
mal stability. (iii) We wish to deduce the mechanistic origin      15 min 22 s to separate the intermediate and coarse fractions.
of their dynamics (i.e. the physical, chemical and biologi-        All clay subfractions were then freeze-dried. Mass recov-
cal mechanisms at stake). The correlations between SOC dy-         ery for the clay fractionation was 98.3 % (standard devia-
namics and thermo-chemical properties in a given pool will         tion = 1.7 %).
enlighten the nature of the underlying mechanisms explain-            A table containing the mass obtained for each fraction of
ing SOC persistence.                                               each sample is provided in the Supplement (Table S1).

                                                                   2.3   Rock-Eval measurements
2     Methods
                                                                   Thermo-chemical analyses were carried out on the differ-
2.1    Long-term bare-fallow experiments
                                                                   ent particle-size fractions of the four plot replicates for the
Studied soil samples were recovered from the archives of           five bare-fallow durations using a RE6 Turbo device (Behar
the Versailles LTBF experiment, France (Table 1). Detailed         et al., 2001, Vinci Technologies). The RE6 technique pro-
characteristics of the site are provided in Barré et al. (2010).   vided measurements from the sequential pyrolysis and oxi-
Archived samples were air-dried and kept in the dark.              dation of ca. 10 mg of the fine clay subfraction, of ca. 50 mg
Bulk soil density remained constant over the LTBF experi-          of the other clay subfractions and clay and fine silt fractions
ment (Barré et al., 2010). Four field-plot replicates were se-     and of ca. 200 mg of the coarse silt and sand fractions. The
lected. For each plot, samples from the first year of bare-        choice of different masses for C-poor and C-rich samples was
fallow treatment (1929) and after four bare-fallow periods         necessary to avoid reaching detector saturation or falling be-
(11, 23, 53 and 80 years) were chosen.                             low the detection limit. Volatile hydrocarbon effluents from
                                                                   pyrolysis were detected and quantified with flame ionization
2.2    Particle-size fractionation                                 detection (FID), while the evolution of CO and CO2 gases
                                                                   was quantified by infrared detection during both the pyrol-
Physical dispersion and particle-size fractionation were car-      ysis and oxidation stages. Pyrolysis was carried out from
ried out on soil samples (Lutfalla et al., 2018) to separate       200 to 650 ◦ C in an N2 atmosphere with a heating rate of
the sand fraction (> 50 µm), the coarse and fine silt fractions    30 ◦ C min−1 , while the oxidation was carried out from 300 to
((20–50) and (2–20) µm) and the clay fraction (< 2 µm) us-         850 ◦ C in the ambient laboratory air atmosphere with a heat-
ing the method proposed by Balesdent et al. (1998). Fifty          ing rate of 20 ◦ C min−1 . The RE6 technique generated five
grams of soil were shaken overnight with 20 glass beads in         thermograms per sample, giving the evolution of (1) volatile
180 mL deionized water to break up aggregates bigger than          hydrocarbon (HC) effluents during pyrolysis, (2) CO2 during
50 µm. The obtained suspension was then passed through a           pyrolysis, (3) CO2 during oxidation, (4) CO during pyrolysis
50 µm sieve, thereby preventing the disruption of particulate      and (5) CO during oxidation.
OM during the subsequent ultrasonic dispersion (Balesdent             Rock-Eval results were first used to measure C content. To
et al., 1991), and sonicated in an ice bath for a total input      evaluate the reliability of the measurements, the C concentra-
of 320 J mL−1 , using a digital sonifier (Sonics model 500W        tions obtained were compared to the C content measured by
operating at 20 kHz, maximum output = 120 W, probe with            dry combustion (Lutfalla et al., 2018) in a CHN autoanalyser
a flat tip of 2.5 cm diameter). The dispersion conditions al-      (Carlo Erba NA 1500). On average, the carbon yield of the

https://doi.org/10.5194/bg-18-1703-2021                                                   Biogeosciences, 18, 1703–1718, 2021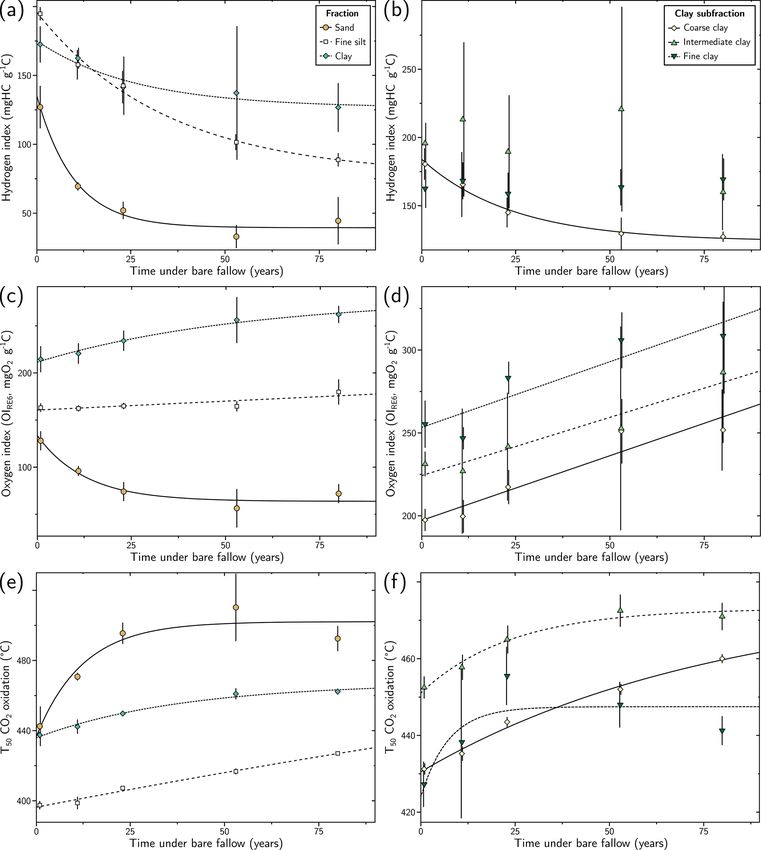
1706                               M. Chassé et al.: Bare-fallow soil fractions reveal contrasted soil organic carbon dynamics

Table 1. Selected characteristics of the Versailles long-term bare-fallow experiment.

                           Versailles, France
                           Coordinates                                                  48◦ 480 N, 02◦ 080 E
                           Beginning of the experiment                                  1928
                           Previous land use                                            Grassland
                           Mean annual temperature                                      10.7 ◦ C
                           Mean annual precipitation                                    628 mm
                           Soil texture and type (IUSS Working Group WRB, 2015)         Silty loam Luvisol
                           Sampling depth                                               25 cm
                           Sampling years                                               1929, 1939, 1951, 1981, 2008
                           Evolution of SOC (g kg−1 , ± 1.0) (Lutfalla et al., 2017)    18.5, 14.2, 12.1, 8.0, 6.3

Table 2. Parameters of the carbon yield curves of the Rock-Eval 6         timated by the RE6 Turbo device. For the three pyrolysis
analyses for each analysed fraction (n: number of analyses).              thermograms, signal integration started after an isotherm step
                                                                          of 200 s at 200 ◦ C. The temperature parameters are labelled
             Fraction                n    Slope      R2                   TX , where X represents the temperature corresponding to the
             Sand                   33     1.01   0.999
                                                                          evolution of X % of the amount of evolved gases for a given
             Coarse silt            35    0.912   0.919                   sample and a specific thermogram (HC, CO2 pyrolysis, CO2
             Fine silt              26    0.965   0.993                   oxidation, CO pyrolysis, CO oxidation).
             Clay                   33    0.944   0.991                      A table containing the RE6 parameters obtained for each
                                                                          sample with all relevant information on the samples is pro-
             Coarse clay            27    0.953   0.996
                                                                          vided in the Supplement (Table S2).
             Intermediate clay      25    0.955   0.990
             Fine clay              31     1.08   0.997
                                                                          2.4    Raman spectroscopy

                                                                          Raman spectra were obtained on a Raman micro-
RE6 analyses was about 101 %, 91.2 %, 96.5 % and 94.4 %                   spectrometer (Renishaw inVia). They were obtained on
for the sand, coarse silt, fine silt and clay fractions and about         micrometre-sized areas of raw (non-polished), hand-picked,
95.3 %, 95.5 % and 108 % for the coarse, intermediate and                 PyOC grains from the sand fraction. Ten to 15 grains were
fine clay subfractions (Table 2).                                         collected from each of the four distinct plots, amounting to
   Using the HC pyrolysis thermogram, the hydrogen index                  50 grains for each of the 1929 and 2008 samplings. Analy-
(HI, g HC kg−1 C) was determined. This index corresponds                  ses were performed on the centre of particles, using an argon
to the quantity of pyrolysed hydrocarbons relative to the to-             laser beam (514.5 nm, Spectra Physics) equipped with a LE-
tal SOC (TOCRE6 ) of the sample, reflecting SOC bulk chem-                ICA 50× magnification objective (0.5 numerical aperture)
istry. Using the CO and CO2 pyrolysis thermograms, we de-                 and using a circular polarization of the laser. The Raman-
termined another parameter reflecting SOC bulk chemistry,                 scattered light was dispersed by wavelength using a holo-
the oxygen index (OIRE6 , g O2 kg−1 C) corresponding to the               graphic grating with 1800 lines mm−1 and detected by a
oxygen yield as CO and CO2 during the thermal pyrolysis                   CCD camera. To avoid any sample heating (which can mod-
of soil OM divided by the TOCRE6 of the sample. The HI                    ify the spectral parameters or the structure of the analysed
correlates with the elemental H : C atomic ratio of SOC and               materials), the laser power on the sample was kept lower than
the OIRE6 correlates with the elemental O : C atomic ratio of             0.2 mW, i.e. less than 1 % of the nominal power. The spec-
SOC (Espitalié et al., 1977).                                             tra were recorded in the (900–2000) cm−1 range (first-order
   For each RE6 thermogram, we determined the tempera-                    spectrum).
tures corresponding to each incremental proportion of the                    All the Raman spectra of PyOC particles are character-
amount of gases that evolved during the pyrolysis and ox-                 ized by two broad D and G bands (Supplement Fig. S1). The
idation stages (Cécillon et al., 2018). Upper temperatures                background was extracted using a linear baseline. The burn-
of 850 ◦ C (CO oxidation thermogram), 650 ◦ C (HC pyroly-                 ing temperature (BT) of PyOC grains was determined using
sis thermogram), 611 ◦ C (CO2 oxidation thermogram) and                   the relative height of these two bands (x = HD /HG ) follow-
560 ◦ C (CO and CO2 pyrolysis thermograms) were cho-                      ing the equation established by Deldicque et al. (2016):
sen for signal integration, thereby excluding any interfer-
ence of soil carbonates (Behar et al., 2001). For each RE6
                                                                          BT(◦ C) = 17 173.76 · x 4 − 12 070.17 · x 3
thermogram, signal integration was performed on the offset-
corrected thermogram using sample-specific offset values es-                       + 25 628.07 · x 2 − 30 429.69 · x + 7984.018.     (1)

Biogeosciences, 18, 1703–1718, 2021                                                            https://doi.org/10.5194/bg-18-1703-2021
M. Chassé et al.: Bare-fallow soil fractions reveal contrasted soil organic carbon dynamics 1707
The selection of this thermometer is based on its robustness. this study compared to the four parameters in the model.
The type of organic precursor has negligible effects on tem- A modified two-pool model was thus selected, with better
perature estimates and the effect of residence time at the Akaike scores. In this model, an intermediate C pool is mod-
highest temperature of burning is weak. This thermometer elled using a mono-exponential decay and a C pool persistent
gives a ± 20 ◦ C estimate of burning temperature in the (600– over the timescale of the LTBF experiment is modelled using
900) ◦ C range for wood fires. a constant, assuming that the decay of this pool is negligi-
ble over an 80-year period. The following exponential decay
2.5 Benzene polycarboxylic acid analysis function is used (Fig. 1):
t
Pyrogenic OC contents were assessed with the BPCA OC(t) = OCi · e− MRT + OCp , (2)
method, a previously described state-of-the-art molecular
marker approach for PyOC analysis in environmental sam- with OCi the content of intermediate OC in g kg−1 , MRT the
ples (Wiedemeier et al., 2015). The analyses were performed mean-residence time of OC in years and OCp the persistent
on milled bulk (300 mg/analysis), sand (300 mg/analysis) OC content over the timescale of the LTBF experiment in
and clay (100 mg/analysis) fractions after 1, 23 and 80 years g kg−1 .
of experiment on the four field replicates. Samples were anal-
ysed in duplicate and analytical error was always < 10 %. 3 Results
For each analytical batch of soils, a laboratory reference soil
(Chernozem) was included to ensure the quality of the ana- 3.1 Organic carbon evolution in soil size fractions
lytical procedures. The BPCA method is known to provide a during bare fallow
conservative assessment of PyOC in soil. It targets pyrogenic
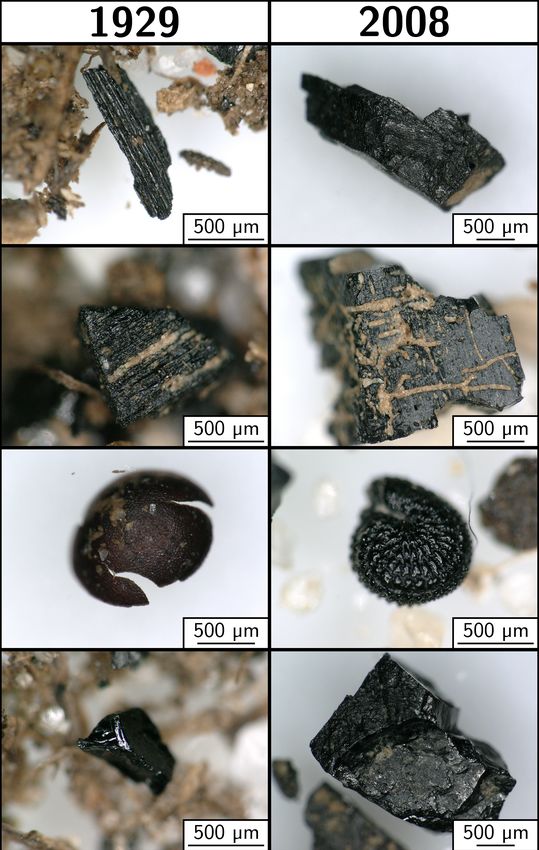
molecular markers only. The BPCA method is consistent but For the different fractions, the OC content in the fraction is
underestimates the absolute amount of PyOC (Glaser et al., decaying before reaching a plateau after several decades of
1998), and a conversion factor of 2.2717 has been proposed experiment (Fig. 1). The model used to fit the evolution of
to convert “BPCA-PyOC” to “total-PyOC”. We present un- OC content over time helps to assess the characteristics of
converted PyOC contents because only relative changes in this decay. Two pools of OC are considered: (i) an interme-
the PyOC content were of interest. We estimated the con- diate pool with a mean-residence time (MRT) characterizing
tent and evolution of PyOC in the silt fraction (coarse silt the average time an atom of C remains in this reservoir and
and fine silt) by difference between bulk PyOC on the one (ii) a persistent pool with a negligible decay at the timescale
hand and clay and sand PyOC on the other. Four types of of the experiment, thus considered inert at this timescale.
molecular markers are also identified, indicating different de- The MRT of intermediate OC is increasing with decreas-
grees of aromaticity, from the most condensed benzene hex- ing granulometry (Table 3, Fig. 1). The MRT of intermediate
acarboxylic acid (B6CA) to the less condensed benzene pen- OC is 8 years (standard deviation, SD = 5 years) for the sand
tacarboxylic, tetracarboxylic and tricarboxylic acids (B5CA, fraction, 13 years (SD = 7 years) for the coarse silt fraction,
B4CAs, B3CAs). 31 years (SD = 2 years) for the fine silt fraction and 40 years
A table containing the BPCA results obtained for each (SD = 28 years) for the clay fraction. The MRT of intermedi-
sample is provided in the Supplement (Table S3). ate OC is homogeneous in all clay subfractions considering
the standard deviation and comparable to the total clay frac-
2.6 Data analysis tion. Inputs of OC in the fine clay subfraction are evidenced
by the absolute increase in OC content after 10 years of ex-
Analyses were conducted using the free software environ- periment (Fig. 1b). Compared to the decreasing trend, such
ment for statistical computing R (http://www.r-project.org, an increase is also observed in the clay fraction and subfrac-
last access: 8 March 2021). tions. At first order, such input will have a negligible influ-
To assess quantitatively the characteristics of OC decay ence on the parameters of the model, as shown by the dis-
in the studied fractions, the data were fitted using different tance of the OC content of the clay fraction after 10 years of
decay models successfully applied to describe OC dynamics experiment compared to the trend of the model.
in LTBF experiments (Barré et al., 2010) (Supplement Ta- The persistent OC represents an estimate of the OC con-
ble S4). The nls function (“stats” package) was used. Data tent remaining in a soil fraction after almost a century of the
from the four replicates are fitted at once in order to take LTBF experiment. The concentration of persistent OC is sim-
into account all sources of error in the uncertainties of the ilar in the clay, fine silt and sand fractions (Table 3), with
model. A one-pool model with first-order kinetics did not 13 g kg−1 of clay fraction (SD = 11 g kg−1 ), 10 g kg−1 of fine
take proper account of the plateau reached by the OC content silt fraction (SD = 1 g kg−1 ) and 9 g kg−1 of sand fraction
along the experiment, as shown by the high Akaike score. (SD = 1 g kg−1 ). It is minimum in the coarse silt fraction,
A two-pool model with first-order kinetics did not converge with 1.1 g kg−1 of coarse silt fraction (SD = 0.1 g kg−1 ). In
due to the limited number of sampling dates considered in the clay subfractions, the amount of persistent OC is similar
https://doi.org/10.5194/bg-18-1703-2021 Biogeosciences, 18, 1703–1718, 20211708 M. Chassé et al.: Bare-fallow soil fractions reveal contrasted soil organic carbon dynamics
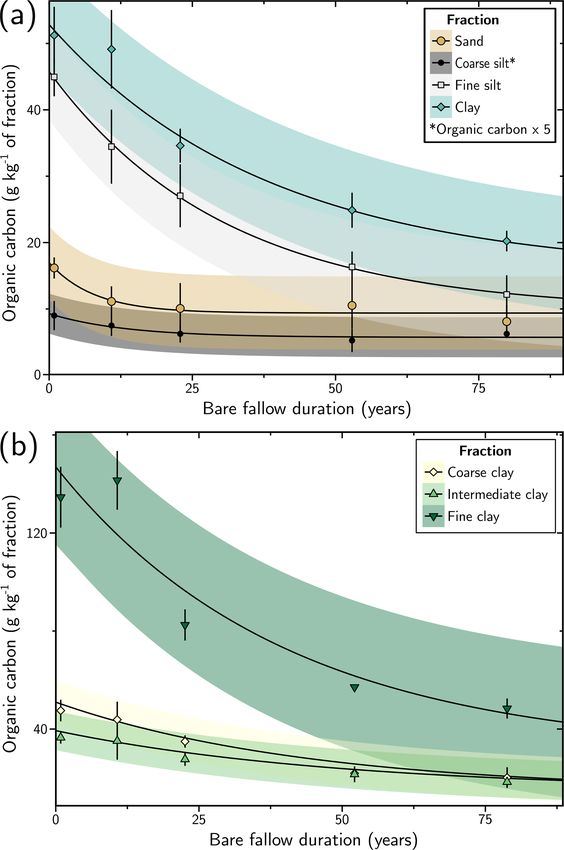
The OC budget contained in each fraction was obtained
from the measured OC content and the corresponding mass
proportion (Fig. 2). Most of the initial OC proportion is
shared between the sand and fine silt fractions (ca. 25 %
each) and the clay fraction (ca. 45 %), while the contribu-
tion of the coarse silt fraction is negligible (ca. 5 %). The
OC proportion is stable over time in the sand and clay frac-
tions (paired t tests initial/final: p values = 0.20 and 0.57),
increases in the coarse silt fraction (paired t test initial/final:
p value = 0.04) and decreases in the fine silt fraction (paired
t test initial/final: p value = 0.01, Fig. 2a). In terms of OC
persistence, at the beginning of the experiment, OC in the
clay and fine silt fractions was dominated by intermediate
OC, while in the sand and coarse silt fractions, the OC con-
tent was shared between intermediate and persistent OC. Per-
sistent OC is mostly present in the sand and clay fraction
(ca. 45 % and ca. 35 %, respectively), the coarse and fine silt
fractions sharing the remaining ca. 20 %.
Within the clay fraction (Fig. 2b), most of the OC was con-
tained in the coarse clay subfraction (ca. 65 %), which also
represented the major fraction in mass (ca. 65 wt %). The
rest was shared between the intermediate and fine clay sub-
fractions. The proportion of OC contained in the coarse clay
subfraction did not vary significantly during the LTBF ex-
periment (paired t test initial/final: p value = 0.49), while it
increased from ca. 15 % to ca. 20 % in the intermediate clay
subfraction (paired t test initial/final: p value = 0.02) and de-
creased from ca. 20 % to ca. 15 % in the fine clay subfraction
(paired t test initial/final: p value = 0.01). The relative pro-
portion of persistent and intermediate OC is similar between
the subfractions, with a 1 : 3 ratio. The coarse clay fraction
Figure 1. Evolution of the organic carbon content with duration contains about two-thirds of the persistent OC of the clay
of the long-term bare-fallow experiment for the size fractions stud- fraction, the remaining being shared equally between the in-
ied: (a) sand (> 50 µm), silt (coarse: (20–50) µm, fine: (2–20) µm) termediate and fine clay subfractions.
and clay (< 2 µm) fractions; (b) coarse ((0.2–2) µm), intermediate Overall, persistent OC represents about 35 % of the total
((0.05–0.2) µm) and fine (< 0.05 µm) clay subfractions. The organic SOC at the start of the experiment (Fig. 2), corresponding to
content is multiplied by 5 for the coarse silt fraction to clearly see 5.8 g kg−1 in the bulk soil.
the evolution. The error bars correspond to the standard deviation
between the four plot replicates. Where not visible, error bars are 3.2 Thermo-chemical evolution of organic carbon in
smaller than the symbol size. For each fraction, the evolution of the soil size fractions during bare fallow
organic carbon content with time is fitted by an exponential decay
t
function (OC(t) = OCi · e− MRT + OCp , OCi : intermediate organic The HI decreased with time under bare fallow in all
carbon content, MRT: mean-residence time and OCp : persistent or-
fractions (Fig. 3a). The HI decreased from ca. 130 to
ganic carbon content). The 95 % confidence interval obtained from
ca. 40 g HC kg−1 C in the sand fraction, from ca. 200 to
the standard deviation of the function parameters is represented by
the coloured areas. ca. 90 g HC kg−1 C in the fine silt fraction and from ca. 170
to ca. 130 g HC kg−1 C in the clay fraction. The decay rate
decreased with decreasing granulometry. The HI decrease in
to the total clay fraction, except for the fine clay subfraction, the coarse clay subfraction was similar to the trend observed
reaching 29 g kg−1 of fine clay subfraction (SD = 53 g kg−1 ). in the total clay fraction. No clear trend is visible for the other
Despite the large uncertainty in the model, after 80 years clay subfractions (Fig. 3b), the HI values remaining in the
of experiment, the high SOC concentration (ca. 50 g kg−1 250 to 150 g HC kg−1 C range.
of fraction) in the fine clay fraction compared to the other The OIRE6 exhibited contrasted variations (Fig. 3c). It
fractions (ca. 20 g kg−1 of fraction) confirms this difference decreased from ca. 130 to ca. 80 g O2 kg−1 C in the sand
(Fig. 1b). fraction. The OIRE6 was stable at ca. 160 g O2 kg−1 C
in the fine silt fraction and increased from ca. 210 to
Biogeosciences, 18, 1703–1718, 2021 https://doi.org/10.5194/bg-18-1703-2021M. Chassé et al.: Bare-fallow soil fractions reveal contrasted soil organic carbon dynamics 1709
t
Table 3. Parameters of the exponential decay function (OC(t) = OCi · e− MRT + OCp ) used to fit the evolution of organic carbon content
with duration of the long-term bare-fallow experiment for the different size fractions considered (OCi : intermediate organic carbon, MRT:
mean-residence time, OCp : persistent organic carbon). The standard deviation (SD) obtained for each parameter is given in the next column
to the right.
Fraction OCi SD MRT SD OCp SD
(g kg−1 of fraction) (year) (g kg−1 of fraction)
Sand 8 2 8 5 9 1
Coarse silt 0.7 0.2 13 7 1.1 0.1
Fine silt 36 1 31 2 10 1
Clay 41 10 40 28 13 11
Coarse clay 37 7 50 22 13 8
Intermediate clay 25 7 50 31 13 7
Fine clay 118 48 40 43 29 53
ca. 260 g O2 kg−1 C in the clay fraction. This parame-
ter increased in all clay subfractions, from ca. 200 to
ca. 250 g O2 kg−1 C in the coarse clay subfraction, from
ca. 230 to ca. 280 g O2 kg−1 C in the intermediate clay sub-
fraction and from ca. 250 to ca. 300 g O2 kg−1 C in the fine
clay subfraction (Fig. 3d). A slight decrease in the OIRE6 in
the finest clay subfraction occurred in the first 10 years of the
experiment.
Among the temperature parameters available from RE6
analysis, only the T50 CO2 oxidation parameter is shown, as
it is common (Barré et al., 2016). Nonetheless, other ther-
mal parameters such as T50 CO2 pyrolysis or T50 CO oxida-
tion reveal the same trend (see Supplement Fig. S3). Temper-
ature parameters, and thus OM thermal stability, increased
with LTBF duration. The T50 CO2 oxidation increased from
ca. 440 to ca. 500 ◦ C in the sand fraction, from ca. 400
to ca. 430 ◦ C in the fine silt fraction and from ca. 440 to
ca. 460 ◦ C in the clay fraction (Fig. 3e). The range of temper-
ature increased with increasing granulometry. Temperature
parameters also tended to increase with bare-fallow duration
in the clay subfractions (Fig. 3f). The T50 CO2 oxidation pa-
rameter increased from ca. 430 to ca. 460 ◦ C in the coarse
clay subfraction, from ca. 450 to ca. 470 ◦ C in the interme-
diate clay subfraction and from ca. 430 to ca. 440 ◦ C in the
Figure 2. Evolution of the organic carbon proportion contained fine clay subfraction. The fine clay subfraction exhibited a
in the studied size fractions with duration of the LTBF experi- distinct behaviour with a sharp increase in the first 25 years
ment: (a) sand (> 50 µm), silt (coarse: (20–50) µm, fine: (2–20) µm) of the experiment before decreasing.
and clay (< 2 µm) fractions; (b) coarse ((0.2–2) µm), intermediate
The RE6 parameters obtained for the coarse silt fraction
((0.05–0.2) µm) and fine (< 0.05 µm) clay subfractions. The error
bars, corresponding to 2 standard deviations, are calculated from the
are given in the Supplement (Fig. S2) considering the low
standard deviation of the organic carbon content and of the mass of OC content and OC proportion contained in the coarse silt
the fraction measured for the four plot replicates. The proportion of fraction. The evolution of these parameters was similar to
persistent organic carbon (dark colour) is obtained from exponen- the sand fraction discussed above.
tial decay fitting using the OCp (persistent organic carbon) param-
eter. The error bars, corresponding to 2 standard deviations, are es- 3.3 Evolution of pyrogenic organic carbon content in
timated from the standard deviation of the OCp parameter obtained soil size fractions during bare fallow
from the fit and the standard deviation of the mass of the fraction
measured for the four plot replicates. The evolution of PyOC content depended on the fraction con-
sidered (Fig. 4a). In the sand fraction, the PyOC content was
variable between plot replicates (relative standard deviation,
https://doi.org/10.5194/bg-18-1703-2021 Biogeosciences, 18, 1703–1718, 20211710 M. Chassé et al.: Bare-fallow soil fractions reveal contrasted soil organic carbon dynamics
Figure 3. Evolution of selected Rock-Eval 6 parameters with duration of the long-term bare-fallow experiment for the studied size fractions:
(a) and (b) hydrogen index, (c) and (d) OIRE6 oxygen index and (e) and (f) the temperature at which 50 % of organic carbon combusted during
the Rock-Eval 6 oxidation step (T50 CO2 oxidation). In (a), (c) and (e), the results for the sand (> 50 µm), silt (coarse: (20–50) µm, fine:
(2–20) µm) and clay (< 2 µm) fractions are given. In (b), (d) and (f), the results for the coarse ((0.2–2) µm), intermediate ((0.05–0.2) µm) and
fine (< 0.05 µm) clay subfractions are represented. The error bars correspond to 2 standard deviations calculated from the four plot replicates.
Where not visible, error bars are smaller than symbol size. For each fraction, the trend of each parameter as a function of bare-fallow duration
is fitted by either exponential decay, exponential recovery or linear functions to guide the reader.
%RSD = 20 %–40 %), but the PyOC quantity remained sta- from ca. 0.3 g kg−1 of silt fraction (SD = 0.2 g kg−1 ) to
ble during the 80 years of LTBF (paired t test initial/final: p ca. 0.1 g kg−1 of silt fraction (SD = 0.1 g kg−1 ).
value = 0.13). The average PyOC content of the sand frac- In the clay fraction, the variability of PyOC content be-
tion over the four field replicates and the three dates was tween the four plots was below 10 %. The PyOC con-
ca. 0.9 g kg−1 of the sand fraction (SD = 0.3 g kg−1 ), repre- tent decreased significantly over the 80 years (paired t test
senting 55 %–60 % of the bulk PyOC. initial/final: p value < 0.01), from ca. 1.0 g kg−1 of clay
In the silt fraction, the PyOC content was also vari- fraction (SD = 0.1 g kg−1 ) to 0.38 g kg−1 of clay fraction
able (%RSD = 45 %–80 %), representing ca. 25 % of the (SD = 0.03 g kg−1 ), representing ca. 15 % of the bulk PyOC.
bulk PyOC. The PyOC quantity decreases during the 80 The rate of PyOC decrease was similar to the one of SOC in
years of LTBF (paired t test initial/final: p value = 0.04), the clay fraction (ca. 25 % decrease in the first 22 years and
ca. 60 % decrease over the 80 years of experiment).
Biogeosciences, 18, 1703–1718, 2021 https://doi.org/10.5194/bg-18-1703-2021M. Chassé et al.: Bare-fallow soil fractions reveal contrasted soil organic carbon dynamics 1711
Figure 5. Box-and-whisker plot of burning temperature estimated
from Raman spectra obtained on individual grains of pyrogenic or-
ganic carbon in the sand fraction of long-term bare-fallow soils sam-
pled in 1929 and 2008 (PyOC: pyrogenic organic carbon). The box
is limited by the first and third quartiles of the data distribution. The
horizontal line represents the median, and the width of the adjacent
notches shows the 95 % confidence interval about the median. The
“whiskers” represent the last value before the 1.5 times mid-range
(the arithmetic mean of maximum and minimum values) beyond the
first or third quartile.
istic of chars created in the (350–500) ◦ C temperature range,
while PyOC condensation in the silt fraction corresponds to
reference chars from wood and grass produced at charring
temperatures around 600 ◦ C. However, the chemical quality
Figure 4. Evolution of selected results from benzene polycar- of the char can also be influenced by the preferential oxida-
boxylic analyses with duration of the long-term bare-fallow exper- tion of B3CAs and B4CAs or the preferential solubilization
iment for the studied size fractions: (a) pyrogenic organic carbon of B5CA.
content; (b) proportion of benzene hexacarboxylic acid (B6CA) Raman spectra obtained on PyOC grains from the sand
molecular marker. The error bars correspond to 2 standard devia- fraction (Supplement Fig. S5) also reflect the condensation
tions calculated from the four plot replicates. and aromaticity of PyOC, which can be translated into burn-
ing temperatures through the paleothermometer developed
by Deldicque et al. (2016). The median burning temperature
3.4 Characterization of pyrogenic organic carbon was ca. 710 and ca. 730 ◦ C for samples from 1929 and 2008,
chemistry respectively (Fig. 5). The distribution of burning tempera-
tures shows that high-temperature PyOC grains (> 750 ◦ C)
The BPCA method yields information about the chemi- were more frequent in the sand fraction from 2008. Half of
cal quality of the material. Isolated size fractions displayed the PyOC grain population analysed exhibited a burning tem-
PyOC with contrasted chemical signatures. In the sand frac- perature in the range 610 to 740 ◦ C in the sand fraction from
tion, PyOC was the most condensed, with more than 60 % 1929, while this range was 590 to 820 ◦ C in the sand fraction
of B6CA. In the clay fraction, PyOC was the less condensed from 2008.
(ca. 35 % of B6CA). In the silt fraction, the condensation was Different morphologies of PyOC grains were found in the
intermediate (ca. (40–55) % of B6CA). In all three fractions, sand fraction (Fig. 6). Nonetheless, mineral grains were of-
there was a significant evolution over 80 years of LTBF to- ten included in PyOC grains and morphological evidence of
wards more condensed material (paired t test initial/final, p former plant tissues was common, indicating that they were
value < 0.05). The relative proportion of BPCA can give an charcoal. Rare deep black grains may correspond to geolog-
estimate of the burning temperature by comparison with the ical coal (Fig. 6, bottom photographs).
distribution of BPCA obtained on the reference char mate-
rial (Wiedemeier et al., 2015). The results obtained indicate
burning temperatures exceeding 700 ◦ C in the sand fractions.
The condensation of PyOC in the clay fraction is character-
https://doi.org/10.5194/bg-18-1703-2021 Biogeosciences, 18, 1703–1718, 20211712 M. Chassé et al.: Bare-fallow soil fractions reveal contrasted soil organic carbon dynamics
observed as OC followed a smooth exponential decay (Barré
et al., 2010). Inputs must thus originate from transfers be-
tween size fractions. Inputs of OC were notable in the finest
fractions (fine silt, clay and clay subfractions) but absent
from the coarse fractions (sand and coarse silt), indicating
that OC transfer must occur from coarse fractions towards
finer ones. The progressive breakdown of OM leads to ever
smaller residues (Kögel-Knabner, 2017), which likely ex-
plains such transfers. Intermediate OC is preserved for longer
periods of time in the finest fractions as shown by the de-
creasing decay rates estimated with decreasing granulometry
(Table 3). Variations in the decay rate of intermediate OC in
the different fractions indicate that the speed of OM break-
down depended on its size. Residence time before breakdown
spanned from a decade for the coarse OM components to a
few decades for the finest OM particles. Breakdown of coarse
OM would lead to inputs of new OC with variable chemistry
in the clay subfractions. The scattering of the HI and OI val-
ues in the clay subfractions during the intermediate years of
the LTBF experiment strengthen this idea (Figs. 3b and d).
4.1.2 Most persistent organic carbon is associated with
sand- and clay-sized fractions
The proportion of persistent OC in the bulk soil, estimated
by addition of the persistent OC in the different fractions,
is about 35 % (Fig. 2), in the range expected for similar
soils (25 % to 56 %, Cécillon et al., 2018). This proportion
corresponds to 5.8 g kg−1 , close to the 6.2 g kg−1 of persis-
Figure 6. Optical microscope photographs showing the typical tent OC estimated for this site (Cécillon et al., 2018) and to
structure and morphology of the PyOC grains analysed by Raman the smallest concentration of OC measured in a single plot,
spectroscopy in the sand fraction. 5.5 g kg−1 (Barré et al., 2010). Considering the uncertainties
introduced by summing the estimates for each fraction, this
demonstrates the consistency of our estimates. Centennially
4 Discussion persistent OC was present in all fractions, OC content reach-
ing a plateau after several decades of experiment in the differ-
4.1 Distinct organic carbon dynamics between size
ent fractions (Fig. 1). It was not distributed evenly as ca. 75 %
fractions
of persistent OC was found in the sand and clay fractions,
On the timescale considered in this LTBF experiment, while these fractions only represent ca. 40 wt % of the soil
80 years, OC can be divided into two pools with distinct samples. Concentrations of persistent OC and proportion rel-
residence times in all size fractions: a pool of intermedi- ative to the SOC stock were comparable in these two frac-
ate OC with residence times ranging from years to several tions. Persistent OC in the sand fraction represents ca. 20 %
decades and a pool of persistent OC, preserved for more than of the SOC stock with a concentration of 9.4 g kg−1 of sand
100 years (Trumbore, 1997). fraction (SD = 0.9 g kg−1 ). In the clay fraction, persistent OC
represents ca. 15 % of the SOC stock with a concentration of
4.1.1 The intermediate pool of organic carbon is 13 g kg−1 of clay fraction (SD = 7 g kg−1 ). Two major pools
transferred towards fine fractions of persistent OC can thus be separated from this experiment,
a coarse (sand-sized) pool and a fine (clay-sized) one.
The pool of intermediate OC was distributed between the
fractions, explaining that part of the OC decayed in all frac- 4.1.3 Pyrogenic organic carbon exhibits contrasting
tions during the LTBF experiment (Fig. 1). Most of this in- dynamics between coarse and fine fractions
termediate OC was present in the fine silt and clay fractions
(Fig. 2). In the finest fractions, an input of OC during the first Size fractionation isolated two pools of PyOC displaying
years of the LTBF experiment was observed relative to the contrasted persistence (Fig. 4a). In the sand fraction, PyOC
decay trend (Fig. 1). No input to the global soil system was is centennially persistent as no significant evolution of the
Biogeosciences, 18, 1703–1718, 2021 https://doi.org/10.5194/bg-18-1703-2021M. Chassé et al.: Bare-fallow soil fractions reveal contrasted soil organic carbon dynamics 1713
absolute PyOC content was observed over time. In the clay This chemical difference is accounted for by the abundance
fraction, the PyOC content decreased with time and its dy- of PyOC in the sand fraction, detected through the BPCA
namics were similar to the dynamics of the total OC of the method (Fig. 4) and visible to the naked eye (Fig. 6). The
fraction (Fig. 1a). The contrasted persistence of PyOC in high aromaticity of these chemical compounds, consequently
the two size fractions led to distinct relative enrichments in O-poor compared to average soil OM, explains the evolu-
PyOC. The relative proportion of PyOC compared to total tion towards lower OI when the relative PyOC proportion
OC did not change significantly in the clay fraction, while increases with bare-fallow duration. Oxygen-rich OM is de-
it doubled in the sand fraction over the LTBF experiment. graded, leaving mainly O-poor PyOC (Poot et al., 2009). The
A significant proportion of the coarse pool of persistent OC inconsistency of this chemical parameter in the presence of
must thus be constituted of sand-sized PyOC material. PyOC suggests that it could be detected using RE-based pro-
The equivalent persistence of total OC and PyOC in cedures.
the clay fraction detected in this study contradicts most
of the literature stating that PyOC is more persistent than 4.2.2 Persistent organic carbon has high thermal
soil OC (Forbes et al., 2006). However, analyses of pub- stability
lished data show that PyOC persistence is less than previ-
ously expected (Abney and Berhe, 2018). Long-term field- The thermal signature of persistent OC was comparable
based studies show mean residence times ranging from 90 in all studied soil fractions (Fig. 3). It was characterized
to 1034 years (Singh et al., 2012). The average MRT for by an increased thermal stability compared to the initial
the intermediate OC pool in the clay fraction was estimated pool of OC confirming bulk soil observations (Barré et al.,
at 40 years (SD = 15 years) from this study, and PyOC de- 2016). Despite marked chemical differences between the OM
crease was following the same trend. Therefore, this study from the different fractions, the established correlation be-
suggests that MRT of the finest PyOC particles may even be tween biogeochemical and thermal stability (Gregorich et al.,
shorter than the lowest bulk estimates. These results agree 2015) remained valid. The variability of thermal parameters
with incubation experiments which demonstrated that pyro- was also less than the one of chemical parameters (OIRE6 :
genic material can decrease at similar rates to total OC in the %RSD = 12 %, HI: %RSD = 9.3 % and T50 CO2 oxidation:
first phases of biodegradation (Hilscher et al., 2009). The bal- %RSD = 1.0 %). This confirms the robustness of OC ther-
ance between centennially persistent coarse PyOC particles mal stability as a proxy of its biogeochemical stability in
and more labile fine PyOC fraction would lead to centennial soils (Cécillon et al., 2018).
residence time, consistent with residence times found for nat-
ural pyrogenic carbon in field experiments (182 to 541 years, 4.2.3 Persistent pyrogenic organic carbon is highly
Hammes et al., 2008). This is also consistent with previ- condensed
ous studies of PyOC persistence in bulk samples from LTBF
showing limited MRT differences with total OC, of the order In the sand fraction, the persistence of PyOC was associ-
of the century (Lutfalla et al., 2017). ated with a more condensed form as indicated by the pro-
portion of B6CA consistently higher than in finer fractions
4.2 Thermo-chemical signature of the persistent (Fig. 4). This high level of PyOC condensation may result
organic carbon from high burning temperatures, exceeding 700 ◦ C, as esti-
mated by comparison with reference char materials (Wiede-
4.2.1 Persistent organic carbon hydrogen signature is meier et al., 2015) and confirmed here by Raman spec-
consistent but oxygen content depends on the troscopy (Fig. 5). The abundant and condensed individual
fraction pieces of char (Fig. 6) show that the material present in
these fractions was probably not created during wildfires,
As shown by Barré et al. (2016) for bulk samples, persis- as the temperatures in these natural events rarely exceed
tent OC has low HI compared to the initial OC in all SOC 500 ◦ C (Turney et al., 2006; Campbell et al., 2007). Nonethe-
size fractions (Fig. 3). On the other hand, no clear OI signa- less, mineral inclusions in PyOC grains and the morphologi-
ture of persistent OC in bulk soil samples could be evidenced cal remnants of plant tissues indicate that at least part of the
from LTBF experiments. This may be accounted for by the PyOC present in this soil resulted from occupational burn-
existence of two persistent OC pools with distinct chemistry. ing. The presence of material resembling geological coal also
One pool, mainly found in the coarse fraction, has low OI suggests that part of the PyOC in the sand fraction could also
compared to initial OC, while the other, found in the clay come from pieces of geological coal used in heating systems.
fraction, has increased OI. With bare-fallow duration, OI can The clay fraction contained much less condensed PyOC,
increase, decrease or remain constant in the bulk soil depend- similar to chars created in the 350 to 500 ◦ C temperature
ing on the relative proportion of these two chemical pools. range (Wiedemeier et al., 2015). Two hypotheses may ex-
This also accounts for the stability of the OI in the fine silt plain the observed difference with coarse PyOC. (i) Fine
fraction, exhibiting mixed contribution from these two pools. PyOC could correspond to material created through natural
https://doi.org/10.5194/bg-18-1703-2021 Biogeosciences, 18, 1703–1718, 20211714 M. Chassé et al.: Bare-fallow soil fractions reveal contrasted soil organic carbon dynamics
burning of biomass (wood and grass), likely to have occurred than the one of the clay fraction. Considering the fractiona-
on this experimental site before the start of the bare-fallow tion protocol used in this study (Lutfalla et al., 2018), pre-
experiment. (ii) The temperature was inhomogeneous during served physical aggregates are smaller than 2 µm (Chenu
burning, the seat of the fire leaving high-temperature, highly et al., 2009) and thus absent from the sand fraction. This
condensed, sand-sized PyOC material, which is persistent persistent OC pool must only result from the preservation
and preserved in the sand fraction. Further from the seat of of highly condensed PyOC. After 80 years of experiment,
the fire, low-temperature PyOC material, possibly finer or the PyOC content measured by BPCA only represented
easier to break down, would explain the dominance of low- 10 % of the OC content of the sand fraction. The BPCA
condensation fine PyOC material in the clay fraction. method is known to consistently underestimate the PyOC
Evolution with time of the chemistry of the pyrogenic ma- content (Glaser et al., 1998). It suggests that the conversion
terial was similar in all fractions (Fig. 4b). A consistent evo- factor between “BPCA-PyOC” and “total-PyOC” may be
lution of PyOC quality towards more condensed forms was close to 10. This study contradicts previous work which finds
observed. The distribution of burning temperature of sand- that coarse PyOC material disappears more quickly than fine
sized PyOC was also shifted towards higher temperature be- PyOC particles, either because of fragmentation or because
tween the first and last sampling dates of the LTBF experi- of preferential protection of PyOC in micro-aggregates in the
ment (Fig. 5). It confirmed that high condensation, correlated finer fractions (e.g. Hilscher and Knicker, 2011). Nonethe-
with high burning temperature, increases PyOC persistence less, Nocentini et al. (2010) also found that the smaller PyOC
in soil. This result is in line with previous works which find particles were less condensed and more reactive than the
good correlations between PyOC persistence and its degree coarser ones. This suggests that high-temperature, coarse
of condensation (e.g. Singh et al., 2012). PyOC material can be resistant to both fragmentation and
degradation due to high condensation, possibly combined
4.3 Inferences on the mechanisms controlling soil with peculiar physical properties. Despite not being detected
organic carbon dynamics in this study, the apparent persistence of PyOC material in the
sand fraction may be reinforced by inputs of pyrogenic ma-
4.3.1 Physical or physico-chemical protection controls terial during the bare fallow, as suggested by Lutfalla et al.
organic carbon dynamics in fine fractions (2017).
The increasing MRT of intermediate OC with decreasing 4.3.3 Specific surface area and chemical recalcitrance
granulometry of the fractions (Fig. 1a and Table 3) is ac- control pyrogenic organic carbon dynamics
counted for by the expected mechanisms of OM preserva-
tion demonstrated in a number of studies (e.g. Balesdent By contrast with this persistent PyOC pool, a low-
et al., 1987; von Lützow et al., 2006). Physical protection re- condensation, intermediate PyOC pool is evidenced in the
sults from restricted accessibility of organic matter to decom- clay fraction. Different mechanisms can explain the de-
posers in small pores and aggregates and mainly affects fine- crease in PyOC content in the clay fraction: biotic degrada-
size OM fractions (Balesdent et al., 2000). Physico-chemical tion, vertical and horizontal transport or erosion and photo-
protection depends on the establishment of organo-mineral oxidation. Due to twice-yearly tillage, photo-oxidation, im-
interactions which increases with the specific surface area, pacting PyOC material situated at the soil surface, can occur
greater in the finest soil fractions. In parallel, OC inputs from despite the sampling depth (25 cm) of this study. All plots
coarser fractions through the breakdown of OC may also con- from the experimental setup of the LTBF experiment were
tribute to artificially increase the MRT of the finest fraction. fenced in the late seventies, limiting horizontal losses of OC
By contrast, in the clay subfractions, the similar proportion and more specifically of PyOC by erosion from this date. Ear-
and decay of intermediate OC (Fig. 2 and Table 3) indicate lier horizontal losses can account for PyOC decrease. Verti-
that, at first order, no significant difference in the mecha- cal transport cannot be excluded either from this setup. Ver-
nisms involved in OM protection can be evidenced between tical transport should however affect both coarse and fine
the clay subfractions. PyOC particles. The content in sand-sized PyOC particles
remaining stable for the duration of the experiment, erosion
4.3.2 Chemical recalcitrance controls organic carbon and transport of PyOC must be limited. In addition, poten-
persistence in sand-sized fractions tial losses of PyOC by solubilization are minor compared to
biological degradation (Abiven et al., 2011; Maestrini et al.,
The second pool of persistent OC present in the sand frac- 2014; Schiedung et al., 2020). In general, biological or biotic
tion must result from distinct mechanisms of protection as degradation is demonstrated to be the predominant degrada-
the specific surface area of coarse particles is small compared tion pathway for PyOC (Santos et al., 2012). The observed
to the fine ones. Organo-mineral interaction and physico- loss of PyOC must thus result mainly from biotic processes.
chemical protection are thus unlikely to be important in Two factors influencing the biodegradability of PyOC must
the sand fraction, while the persistent OC content is higher control its persistence in the clay fraction: (i) the size and
Biogeosciences, 18, 1703–1718, 2021 https://doi.org/10.5194/bg-18-1703-2021You can also read