The whale shark genome reveals patterns of vertebrate gene family evolution - bioRxiv
←
→
Page content transcription
If your browser does not render page correctly, please read the page content below
bioRxiv preprint first posted online Jun. 28, 2019; doi: http://dx.doi.org/10.1101/685743. The copyright holder for this preprint
 (which was not peer-reviewed) is the author/funder, who has granted bioRxiv a license to display the preprint in perpetuity.
                               It is made available under a CC-BY-NC 4.0 International license.
The whale shark genome reveals patterns
of vertebrate gene family evolution
Milton Tan1*, Anthony K. Redmond2, Helen Dooley3, Ryo Nozu4, Keiichi Sato4,5, Shigehiro
Kuraku6, Sergey Koren7, Adam M. Phillippy7, Alistair D.M. Dove8, Timothy D. Read9
1. Illinois Natural History Survey at University of Illinois Urbana-Champaign, Champaign, IL,
USA.
2. Smurfit Institute of Genetics, Trinity College Dublin, Dublin, Ireland.
3. University of Maryland School of Medicine, Institute of Marine & Environmental Technology,
Baltimore, MD, USA.
4. Okinawa Churashima Research Center, Okinawa Churashima Foundation, Okinawa, Japan.
5. Okinawa Churaumi Aquarium, Motobu, Okinawa, Japan
6. RIKEN Center for Biosystems Dynamics Research (BDR), RIKEN, Kobe, Japan.
7. National Human Genome Research Institute, Bethesda, MD, USA.
8. Georgia Aquarium, Atlanta, GA, USA.
9. Department of Infectious Diseases, Emory University School of Medicine, Atlanta, GA, USA.
Keywords: fish, Elasmobranchii, Chondrichthyes, Cartilaginous Fishes, Gnathostomata,
comparative genomics, innate immunity, gigantism
Abstract
Due to their key phylogenetic position, cartilaginous fishes, which includes the largest fish
species Rhincodon typus (whale shark), are an important vertebrate lineage for understanding
the origin and evolution of vertebrates. However, until recently, this lineage has been
understudied in vertebrate genomics. Using newly-generated long read sequences, we
produced the best gapless cartilaginous fish genome assembly to date. The assembly has
fewer missing ancestral genes than Callorhinchus milii, which has been widely-used for
evolutionary studies up to now. We used the new assembly to study the evolution of gene
families in the whale shark and other vertebrates, focusing on historical patterns of gene family
origins and loss across early vertebrate evolution, innate immune receptor repertoire evolution,
and dynamics of gene family evolution size in relation to gigantism. From inferring the pattern of
origin of gene families across the most recent common ancestors of major vertebrate clades, we
found that there were many shared gene families between the whale shark and bony
vertebrates that were present in the most recent common ancestor of jawed vertebrates, with a
large increase in novel genes at the origin of jawed vertebrates independent of whole genome
duplication events. The innate immune system in the whale shark, which consisted of diverse
pathogen recognition receptors (PRRs) including NOD-like receptors, RIG-like receptors, and
Toll-like receptors. We discovered a unique complement of Toll-like receptors and triplication of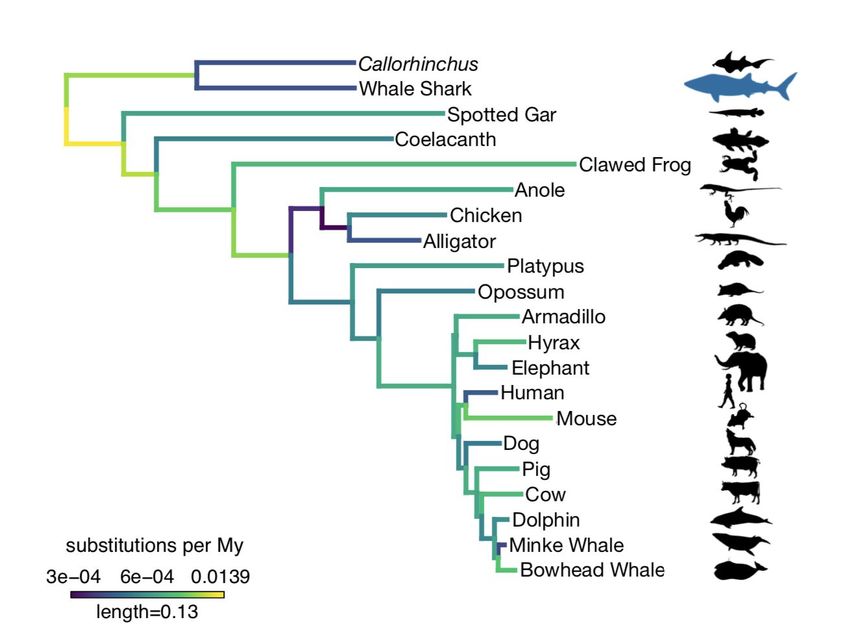
bioRxiv preprint first posted online Jun. 28, 2019; doi: http://dx.doi.org/10.1101/685743. The copyright holder for this preprint
(which was not peer-reviewed) is the author/funder, who has granted bioRxiv a license to display the preprint in perpetuity.
It is made available under a CC-BY-NC 4.0 International license.
NOD1 in the whale shark genome. Further, we found diverse patterns of gene family evolution
between PRRs within vertebrates demonstrating that the origin of adaptive immunity in jawed
vertebrates is more complicated than simply replacing the need for a vast repertoire of germline
encoded PRRs. We then studied rates of amino acid substitution and gene family size evolution
across origins of vertebrate gigantism. While we found that cartilaginous fishes and giant
vertebrates tended to have slower substitution rates than the background rate in vertebrates,
the whale shark genome substitution rate was not significantly slower than Callorhinchus.
Furthermore, rates of gene family size evolution varied among giants and the background,
suggesting that differences in rate of substitution and gene family size evolution relative to
gigantism are decoupled. We found that the gene families that have shifted in duplication rate in
whale shark are enriched for genes related to driving cancer in humans, consistent with studies
in other giant vertebrates than support the hypothesis that evolution of increased body size
requires adaptations that result in reduction of per cell cancer rate.
Introduction
Jawed vertebrates (Gnathostomata) comprise two extant major groups, the cartilaginous
fishes (Chondrichthyes) and the bony vertebrates (Osteichthyes, including Tetrapoda)1.
Comparison of genomes between these two groups not only provides insight into early jawed
vertebrate evolution and the emergence of various biological features, but also enables
inference of ancestral jawed vertebrate traits2. While the availability of sequence data from
many species across phylogeny is key to the success of such analyses, until very recently
genomic data from cartilaginous fishes was significantly underrepresented compared to other
vertebrate linages. The first cartilaginous fish genome, that of Callorhinchus milii (known
colloquially as ghost shark, elephant shark, or elephant fish), was used to study the early
evolution of genes related to bone development and emergence of the adaptive immune
system2. However, concerns were raised that Callorhinchus, being a member of the Holocephali
(chimaeras, ratfishes) – one of the two major groups of cartilaginous fishes – and separated
from the Elasmobranchii (sharks, rays, and skates) for approximately 420 million years3 may not
be representative of cartilaginous fishes as a group4.
Until recently, only scant genetic resources have been available for the whale shark5
specifically, and elasmobranchs in general. The first elasmobranch genome published was for a
male whale shark ("Norton") by Read et al.6 . Famously representing one of Earth's ocean
giants, the whale shark is by far the largest of all fishes reaching a maximum confirmed length
of nearly 19 meters in length7. Despite their large body size, endangered status, and appeal to
both scientists and the general public, relatively little is known about their biology8–10. Due to its
phylogenetic position among vertebrates, the scarcity of shark genomes, and its unique biology,
the whale shark genome can be used to address questions related to vertebrate genome
evolution11,12, the relationship of gene evolution in sharks and unique shark traits11,12, as well as
the evolution of gigantism13. As expected, Read et al. found that whale shark genome was most
closely related among sequenced fish genomes (at the time) to Callorhinchus. They also
discovered a TLR similar to TLR21 in the whale shark thus suggesting that TLR21 was derived
in the most recent common ancestor of jawed vertebrates. While this represented an important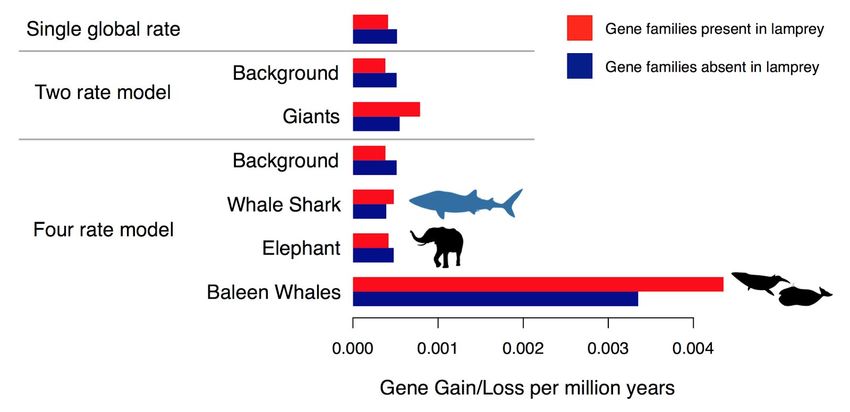
bioRxiv preprint first posted online Jun. 28, 2019; doi: http://dx.doi.org/10.1101/685743. The copyright holder for this preprint
(which was not peer-reviewed) is the author/funder, who has granted bioRxiv a license to display the preprint in perpetuity.
It is made available under a CC-BY-NC 4.0 International license.
step forward for elasmobranch genomics, the genome was fragmentary, and substantial
improvements to the genome contiguity and annotation were expected from reassembling the
genome using PacBio long-read sequences6.
More recent work has focused upon further sequencing, assembling, and analyzing of
generated novel elasmobranch genome
the whale shark nuclear genome6,11,13. Hara et al.11
assemblies for the brown-banded bamboo shark (Chiloscyllium punctatum) and cloudy catshark
(Scyliorhinus torazame). They also reassembled the published Read et al. whale shark genome
data, supplementing it with transcriptome sequence from blood cells sampled from a different
male individual. Their comparative genomic study confirmed a reduced evolutionary rate in
cartilaginous fish genomes11, a conclusion previously drawn from only a handful of genes14,15.
then reported on a whale shark genome assembly from a third male individual and
Park et al.13
compared genomic characteristics from animals to yeast to identify correlates of longevity and
genome traits. They found that much of the increase in the gene length in the whale shark
genome was due to relatively large introns that were enriched for CR1-like LINEs. Finally, in a
white shark genome paper, Marra et al.12 studied rates of positive selection across
protein-coding genes in the white shark and whale shark genomes. Like Park et al., they
identified an abundance of LINEs in both the white shark and whale shark genomes, proposing
this characteristic contributes to genomic stability. They also confirmed the reduced olfactory
receptor diversity in cartilaginous fishes first reported by Hara et al.11, and determined genes
related to genome integrity and ubiquitination, as well some related to wound healing, were
evolving under positive selection in both shark species.
Long read sequencing is an important factor in assembling longer contigs to resolve
repetitive regions16,17, which comprise the majority of vertebrate genomes. Herein we report on
the best gapless assembly of the whale shark genome thus far, based on de novo assembly of
long reads obtained with the PacBio single molecule real-time sequencing platform. We used
this assembly and new annotation in a comparative genomic approach to investigate the origins
and losses of gene families to identify patterns of gene family evolution associated with major
early vertebrate evolution. We also focused on gene family evolution of innate immune
pathogen recognition receptor (PRR) types. Immune protection in vertebrates is usually
classified into two types; innate and adaptive. The innate system is evolutionary ancient and
based upon germline-encoded receptors, known as pattern recognition receptors (PRRs). By
contrast, the adaptive system, found in vertebrates alone, overlays the innate system and is
based upon somatically rearranging receptors (variable lymphocyte receptors in jawless
vertebrates; immunoglobulins and T cell receptors in jawed vertebrates). Greatly expanded PRR
repertoires have been reported in several deuterostome invertebrate genomes compared to
conserved repertoires in their jawed vertebrates homologs, leading to the proposal that the
acquisition of adaptive immunity negated the need for vast PRR repertoires, or somehow
constrained PRR expansion18,19. Despite cartilaginous fishes, including whale shark, providing a
good model to test this by virtue of being the oldest extant jawed vertebrate lineage relative to
mammals to possess both innate and adaptive systems20,21, genomic investigations into shark
immunity have been limited by the paucity of genomic resources2,4. Using the new whale shark
genome assembly, we investigated the repertoires of three major PRR families: NOD-like
receptors, RIG-like receptors, and Toll-like receptors. Finally, we compared the rates of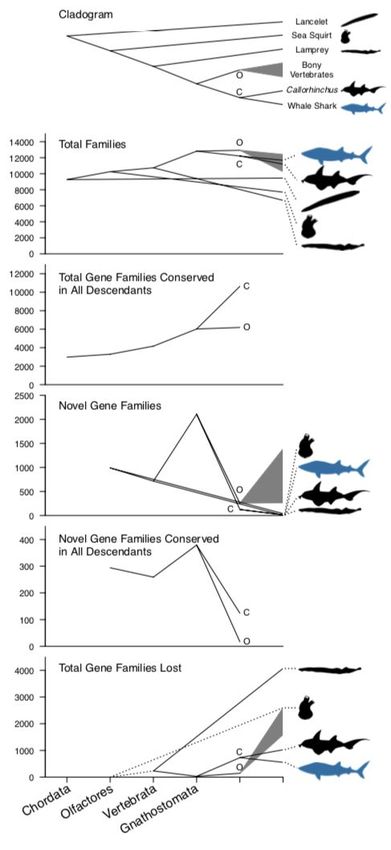
bioRxiv preprint first posted online Jun. 28, 2019; doi: http://dx.doi.org/10.1101/685743. The copyright holder for this preprint
(which was not peer-reviewed) is the author/funder, who has granted bioRxiv a license to display the preprint in perpetuity.
It is made available under a CC-BY-NC 4.0 International license.
functional genomic evolution in multiple independent lineages of vertebrates that have
experienced gigantism, including the whale shark, to test for relationships between gigantism
and genomic evolution among vertebrates. Further, larger-bodied organisms tend to have lower
cancer rates than expected given their increased numbers of cells relative to smaller-bodied
organisms22, suggesting genes involved in cancer suppression may evolve differently in
vertebrate giants. Supporting this hypothesis, recent research in giant mammals such as
elephants and whales have identified selection or duplication of various gene families that are
related to causing cancer in humans23–25, supporting the role of evolution in cancer-related
genes in the evolution of gigantism. Hence, we studied whether gene families that have shifted
in gene duplication rates were enriched for orthologs of known cancer genes.
Results and Discussion
Gapless Genome Assembly. The new "Norton" whale shark genome assembly represents the
best gapless assembly to date for the whale shark (Supplementary Note 1; Supplementary
Table 1). The total length of the contigs of the new assembly was 2.93 Gbp. This number is
smaller than a non-sequencing based estimate of the whale shark genome size of 3.73 Gbp by
, which suggests that sections of the genome, potentially comprising primarily
Hara et al.11
repetitive elements, are still missing. The new assembly had 57,333 contigs with a contig N50 of
144,422 bp. The assembly had fewer contigs than the number of scaffolds of previous
assemblies, and a higher contig N50, representing a dramatic improvement in contiguity
compared to the existing whale shark genome assemblies (Supplementary Table 1). This higher
contiguity at the contig level (vs. scaffold level) was also better than the published
Callorhinchus, brownbanded bamboo shark, cloudy catshark, and white shark genomes2,11,12.
Although the BUSCO score of Callorhinchus is higher than in whale shark (which is expected as
Callorhinchus was used in selecting the conserved ortholog set for BUSCO), when considering
gene families across vertebrates rather than simply the set in BUSCO (See Ancestral Vertebrate
Genome Evolution below and Supplementary Note 2), we infer more gene families are missing
from Callorhinchus than the whale shark, suggesting that either the whale shark has a greater
conservation of the gene families from the ancestral cartilaginous fish than Callorhinchus, or
that the whale shark has fewer missing gene families in its assembly than Callorhinchus. When
evaluating gene completeness using a rigid 1-to-1 ortholog core vertebrate gene set26
(implemented in gVolante27), we found 85% core vertebrate genes were complete and found
97.4% core vertebrate genes included partial genes, which compares favorably to other
sharks11. Thus, the gene content of the whale shark is quite complete for a cartilaginous fish
genome and will be informative for questions regarding vertebrate gene evolution.
Ancestral Vertebrate Genome Evolution. We sought to use the new whale shark genome
assembly to infer the evolution of gene families (i.e. orthogroups) of protein-coding genes
across vertebrates. So-called orthogroups are a unit of comparison in comparative genomics
defined as all genes descended from a single gene in the common ancestor of species
considered28; hence, they are dependent on the phylogenetic breadth of species included. We
inferred the origin of gene families in vertebrate evolution and compared the ancestral genomes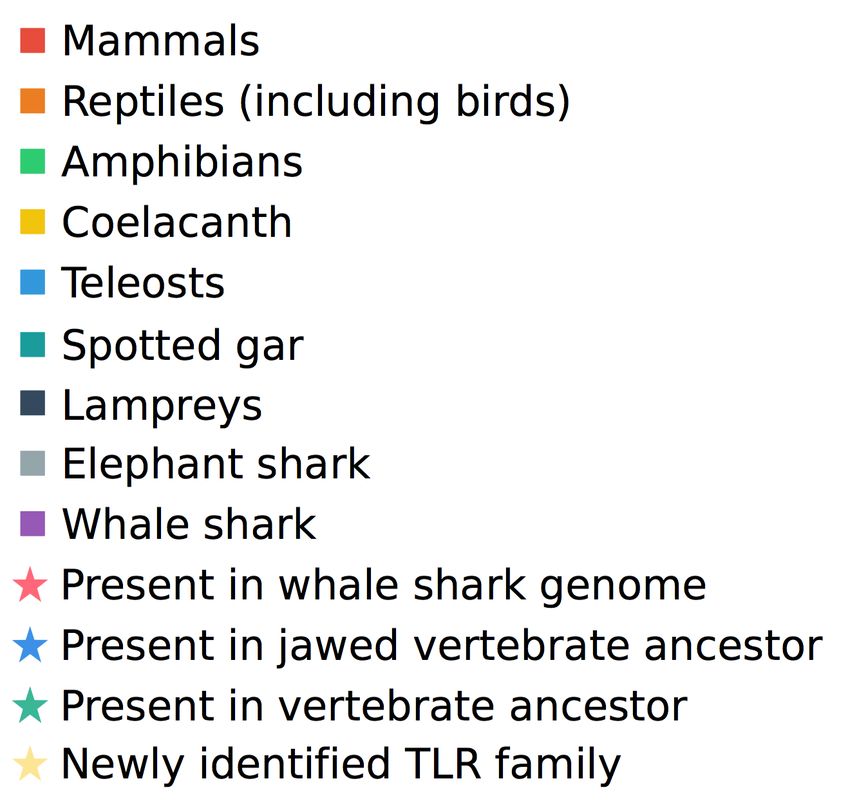
bioRxiv preprint first posted online Jun. 28, 2019; doi: http://dx.doi.org/10.1101/685743. The copyright holder for this preprint
(which was not peer-reviewed) is the author/funder, who has granted bioRxiv a license to display the preprint in perpetuity.
It is made available under a CC-BY-NC 4.0 International license.
at major nodes in vertebrate phylogeny. This has relevance for the origin of biological functions
in vertebrate evolution and informs the generality of genetic studies across taxa. Furthermore,
inferred gene family losses may also relate to functional genomic evolution of lineages that
inherit those losses29. We determined chordate-level gene families from proteomes for 24
chordates, including 22 representative vertebrates, sea squirt (Ciona) , and lancelet
(Branchiostoma) , and inferred the history of gene family origin and loss by comparing the
presence and absence of gene families across species. The lancelet Branchiostoma has some
of the highest retention of gene families from both chordate and pre-animal ancestors30,31,
supporting its use as an outgroup for understanding the origins of novel genes within the
vertebrate clade relative to other animals.
When comparing the number of gene families within the ancestral genomes of major
chordate clades, we found a consistent increase in the total number of gene families from the
most recent common ancestor (MRCA) of chordates to the MRCA of Gnathostomata (e.g.
10,255 gene families in the MRCA of Olfactores (Urochordata + Vertebrata) to 12,815 in the
MRCA of Gnathostomata; Figure 1, Supplementary Note 2, Supplementary Figure 3). After the
peak in the MRCA of Gnathostoma, there was a further increase in number of gene families to
the ancestor of bony vertebrates and a decrease to the ancestor of cartilaginous fishes. In
addition, there was an increase in the number of gene families conserved in all descendants of
each ancestor; we inferred 3,291 gene families in the MRCA of Olfactores were conserved in all
Olfactores studied, but 6,022 gene families in the MRCA of Gnathostomata were conserved in
all gnathostomes studied. While marginally more gene families are conserved across all bony
vertebrates (6,187 gene families), far more gene families are conserved between both
cartilaginous fishes studied (10,631 gene families), which is likely a relatively high number due
to only considering two species. We also found an increase in the number of novel gene
families (989 in the MRCA of Olfactores to 2,106 in the MRCA of Gnathostomata). We found a
variable number of novel gene families in vertebrate ancestors were retained in all descendants,
with 294 retained from the MRCA of Olfactores, 259 retained from the MRCA of Vertebrata, and
379 retained from the MRCA of Gnathostomata; however, here, the Gnathostomata still had the
largest number of conserved novel gene families. The MRCAs of Osteichthyes and
Chondrichthyes both had larger numbers of conserved gene families and far lower numbers of
novel gene families than earlier vertebrate ancestors (255 novel gene families in bony
vertebrates, 124 novel gene families in cartilaginous fishes). Thus, the ancestor of jawed
vertebrates had more novel gene families, and more novel gene families were retained from the
jawed vertebrate ancestor in all descendants, relative to earlier ancestors in chordate history.
Overall, this implies the origin of jawed vertebrates established a large proportion of novel gene
families of both bony vertebrates and cartilaginous fishes.
Many studies have found evidence that two rounds (2R) of whole genome duplication
occurred early in vertebrate evolution, resulting in gene duplicates referred to as ohnologs32–35.
Gene copies arising from genome duplication should belong to the same gene family, but it is
possible that the large number of novel gene families we found at the ancestor of jawed
vertebrates was artefactually inflated by ohnologs split across multiple gene families. To
estimate the extent of this potential oversplitting, we compared the 2,106 gene families inferred
as novel at the base of jawed vertebrates to a strict set (1,381) and a relaxed set (2,642) ofbioRxiv preprint first posted online Jun. 28, 2019; doi: http://dx.doi.org/10.1101/685743. The copyright holder for this preprint
(which was not peer-reviewed) is the author/funder, who has granted bioRxiv a license to display the preprint in perpetuity.
It is made available under a CC-BY-NC 4.0 International license.
ohnolog families previously determined using a synteny-aware method by Singh et al.34. We
found that between 140 (strict) and 460 (relaxed) of the novel jawed vertebrate gene families
included any human genes assigned to any ohnolog families identified by Singh et al., indicating
a minority of the gene families we identified corresponded to duplicated gene families.
Furthermore, we found much agreement between how novel jawed vertebrate genes were
assigned to gene families or to ohnologs; for the strict set, 110 ohnolog families matched to
gene families we determined, while for the relaxed set, 288 ohnolog families matched to gene
families we determined. There were relatively few discrepancies, but they tended to be ohnolog
families split into multiple gene families. 13 strict ohnolog families corresponded to 30 gene
families, and 67 relaxed ohnolog families corresponded to 153 gene families. Rarely, our gene
families clustered multiple ohnologs as single gene families, although this is not necessarily
erroneous, and may be due to our greater taxon sampling than used by Singh et al. In
summary, this supports that only a small proportion of the gene families we identified are
potentially spuriously split ohnologs. This reinforces the importance of the origin of jawed
vertebrates for genomic novelty, not just for the vertebrate 2R whole genome duplication, but
additional novel gene families as well.
We then tested whether gene families that were gained or lost during vertebrate
evolution were enriched for certain GO, IPR, or Pfam annotations (Supplementary Note 2),
which might indicate functional genomic shifts preceding the origin of these clades. We found an
enrichment of connexin function in gene families that originated at the MRCA of Olfactores
(Supplementary Table 5). These intercellular channels act as part of gap junctions36, and this
enrichment of novel connexin function in the MRCA of Olfactores is consistent with the
identification of connexins in sea squirt that are orthologous to vertebrate connexins37, their
absence in lancelet38, and the origin of intercellular signaling function in the MRCA of Olfactores.
In both the MRCA of vertebrates and jawed vertebrates, we consistently found enrichment in
novel genes for G-protein coupled receptors and immunoglobulin domains (Supplementary
Tables 6–7). We also found enrichment for hormone activity but only in the MRCA of jawed
vertebrates (Supplementary Tables 7). This indicates a relatively large gain of signaling
molecules in the origins of these clades, implying increasing sophistication required increased
regulation. Hence, not only did many hormones with a role in mammal homeostasis originate in
the MRCA of jawed vertebrates – as previously shown in comparisons of shark genomes to
other vertebrates11 – but signaling was a dominant function of the novel gene families that
originating in the MRCA of all vertebrates as well as jawed vertebrates. Additionally, in the
MRCA of jawed vertebrates, we found enrichment for immune response and of various
immune-related domains (Supplementary Table 7), consistent with the origin of mammalian-like
adaptive immunity in jawed vertebrates.
Differences between bony vertebrates and cartilaginous fishes might arise through the
function of gene families specific to each lineage. We found no enrichment for function or
domain terms among the 124 gene families derived in the MRCA of cartilaginous fishes. By
contrast, the 255 gene families derived in the MRCA of bony vertebrates were enriched for
G-protein coupled receptor domains, immunoglobulin domains, and olfactory receptor domains
(Supplementary Table 8), which may indicate further overrepresentation for novelty in gene
families functioning in signaling in bony vertebrates, but not in cartilaginous fishesbioRxiv preprint first posted online Jun. 28, 2019; doi: http://dx.doi.org/10.1101/685743. The copyright holder for this preprint
(which was not peer-reviewed) is the author/funder, who has granted bioRxiv a license to display the preprint in perpetuity.
It is made available under a CC-BY-NC 4.0 International license.
(Supplementary Table 9). The addition of novel G-protein coupled receptor domain proteins in
bony vertebrates is consistent with the relative paucity of these receptors noted in previous
comparisons of cartilaginous fishes and bony vertebrates12. However, it should be noted that the
lack of enrichment for functions among gene families that were novel in cartilaginous fishes may
also be explained by the difference in the proportion of genes with annotations: only 86 of the
124 (69.4%) gene families that were novel to cartilaginous fishes were annotated, while 232 of
the 255 (91.0%) gene families novel to bony vertebrates were annotated, indicating that the
novel gene families in cartilaginous fishes were less likely to possess known protein domains or
functions.
Biological differences between bony vertebrates and cartilaginous fishes might also be
explained by differences in lost gene functions relative to the jawed vertebrate ancestor. We
found no enrichment for functional terms for the 145 gene families lost in bony vertebrates, but
the 729 gene families lost in cartilaginous fishes were enriched for a variety of domains. Even
though we only included two cartilaginous fishes, we found olfactory receptor function was
prominent among the gene families lost within cartilaginous fishes, which is also consistent with
the low number of olfactory receptors noted in cartilaginous fishes previously11,12,39. We also
found enrichment of losses of gene families associated with certain transposable elements
including DDE superfamily endonuclease domains and L1 family transposase. The enrichment
for a loss of L1 transposase domain in cartilaginous fishes is consistent with the absence of full
L1 transposons that we noted in whale shark (Supplementary Note 1B) and noted previously for
Callorhinchus40 . Specific to the evolution of the whale shark, relative to the cartilaginous fish
ancestor, we inferred 13 novel gene families and a loss of 554 gene families. Neither of these
sets of gene families were enriched for any functional terms relative to jawed vertebrate genes
overall. However, as sequencing effort and taxon sampling varies among these clades, it is
possible that the lack of functional enrichment in losses may have been due to random loss due
to variable levels of genome sequencing completeness. On the other hand, the lack of
functional enrichment in groups of gene families lost between elasmobranchs, holocephalans,
and bony vertebrates could also suggest that the biological differences evolved between these
groups were not driven by differential gene family loss.
Thus, our analyses imply a dynamic history of gene family gain and loss across early
vertebrate evolution. Of particular importance is the number of gene families gained in the
MRCA of jawed vertebrates in establishing the gene families present in bony vertebrates and
cartilaginous fishes. Although increasing numbers of gene families originated over time, many of
these novel gene families among vertebrates, jawed vertebrates, and bony vertebrates were not
conserved across all descendants, suggesting pervasive loss of novel genes as well. We also
found enrichment for certain functions among these gene families, specifically G-protein
coupled receptors, immunoglobulin domains, hormones, and olfactory receptors. These
analyses demonstrate the ancestry of many of the major genomic functions in bony vertebrates
preceded their origin, as illuminated by these gene families being shared with their cartilaginous
fish sister group. The whale shark genome therefore provides an important additional resource
to study the origins of gene families in vertebrates.
Evolution of innate immunity in the whale sharkbioRxiv preprint first posted online Jun. 28, 2019; doi: http://dx.doi.org/10.1101/685743. The copyright holder for this preprint
(which was not peer-reviewed) is the author/funder, who has granted bioRxiv a license to display the preprint in perpetuity.
It is made available under a CC-BY-NC 4.0 International license.
Using the new whale shark genome assembly, we investigated the repertoires of three
major PRR families: NOD-like receptors (NLRs), RIG-like receptors (RLRs), and Toll-like
receptors (TLRs). Our analyses (see Methods; Supplementary Note 3) allowed us to explore
ancestral vertebrate and jawed vertebrate PRR diversity, while searching for evidence of
vertebrate PRR expansions. NOD-like receptors (NLRs) are intracellular receptors that detect a
wide array of PAMPs (Pathogen associated molecular pattern) and DAMPs (Damage/Danger
associated molecular pattern)41–45. Typified by the presence of a NACHT domain (although most
also possess C-terminal leucine rich-repeats), NLRs are further divided into three subfamilies;
the NODs, NLRPs (NALPs), and IPAF. We identified 43 NLR sequences, 23 of which contained
a clearly-identifiable NACHT domain (Supplementary Table 11, Figure 2, Supplementary Figure
3). Unusually, we found three copies of NOD1 in whale shark (ultrafast bootstrap support,
UFBOOT=100; Figure 2), all containing NACHT domains and occupying unique genomic
locations. We hypothesize that this potentiates broader bacterial recognition or more nuanced
responses to different pathogens. NLRPs are vital for the induction of inflammatory responses
(through activation of a multi-protein complex called the inflammasome)46, yet strikingly, we
identified only a single NLRP-like sequence (lacking a detectable NACHT domain) in whale
shark. Interestingly, we also identified a novel NLR gene family that appears to be closely
related to the NLRPs (UFBOOT=67) in zebrafish and whale shark (UFBOOT=92), that has
undergone significant expansion in the latter (whale shark clade UFBOOT=100; Figure 2,
Supplementary Figure 3). It seems likely that this large repertoire of NLRP-related genes
compensates for the paucity of true NLRPs in whale shark, thereby offering alternative routes
for inflammasome activation. Interestingly, each of the vertebrate species examined have
independently expanded a different NLR family, with NLRP genes expanded in human (clade
UFBOOT=99; Supplementary Figure 3), and the ‘fish-specific’ FISNA in zebrafish (clade
UFBOOT=86; Supplementary Figure 3), for which we surprisingly found a whale shark ortholog
(UFBOOT=74). This suggests that NLR repertoire expansions may be as common in
vertebrates as in deuterostome invertebrates, contradicting the idea that the presence of an
adaptive immune system influences this.
RIG-like receptors (RLRs) are cytosolic PRRs that detect viral nucleic acid and initiate
immune responses through Mitochondrial Antiviral Signaling Protein (MAVS)47,48. Bony
vertebrates have three RLR proteins; RIG-1, MDA5, and LGP2. All contain a DEAD-helicase
domain, a C-terminal RNA recognition domain, and an N-terminal CARD domain pair that
mediate their interaction with MAVS47,48. We identified four candidate RLR genes in the whale
shark; two non-overlapping, partial MDA5-like sequences, and one each for RIG-1 and LGP2
(Supplementary Table 11). Phylogenetic reconstruction of DEAD-Helicase domains of whale
shark MDA5, RIG-1, and LGP2 (Figure 2; Supplementary Figure 4) support that all three RLRs
had already diverged in the last common ancestor of extant jawed vertebrates. Further, and
consistent with past findings, we found that MDA5 and LGP2 are the result of a vertebrate
specific duplication, while RIG-1 split from these genes prior to the emergence of vertebrates48.
CARD domain analyses designed to include MAVS confirmed the presence of this protein in
whale shark, Callorhinchus, and despite difficulties identifying a sequence previously49,
coelacanth (UFBOOT=100; Supplementary Figure 4). Together, our results show that the
mammalian RLR repertoire (and MAVS) was established prior to the emergence of extant jawedbioRxiv preprint first posted online Jun. 28, 2019; doi: http://dx.doi.org/10.1101/685743. The copyright holder for this preprint
(which was not peer-reviewed) is the author/funder, who has granted bioRxiv a license to display the preprint in perpetuity.
It is made available under a CC-BY-NC 4.0 International license.
vertebrates and, likely due to its importance in antiviral immunity, has been near ubiquitously
conserved since.
Toll-like receptors (TLRs) are probably the best known of all innate immune PRRs. Past
evolutionary studies suggest that the vertebrate TLR repertoire is highly conserved in
vertebrates, with only small changes between species35,49–53. In contrast, large lineage-specific
expansions have been observed in several invertebrates18,19. We identified 13 unique putative
TLR sequences in whale shark (Supplementary Table 11), 11 of which are orthologous to
TLR1/6/10, TLR2/28 (x2), TLR3, TLR7, TLR8, TLR9 (x2), TLR21, TLR22/23, and TLR27. The
remaining two, along with a coelacanth sequence, represent a novel ancestral jawed vertebrate
TLR gene family related to TLR21, for which we propose the name TLR29. This TLR repertoire
is a unique combination compared to all other vertebrates previously studied, formed from a mix
of mammalian, teleost, and ‘living-fossil’ TLRs (i.e. present in sharks, coelacanths, gars; TLR27,
TLR29). Our analyses indicate that the ancestor of extant vertebrates possessed at least 15
TLRs, while the ancestor of jawed vertebrates possessed at least 19 TLRs (including three
distinct TLR9 lineages), both larger repertoires than possessed by modern 2R species (Fig 2;
Supplementary Figure 5). Unlike invertebrates where both loss and expansion of TLRs are
extensive, our data suggest that the vertebrate TLR repertoire is probably primarily expanded
through early genome duplication events (although a few new TLRs have arisen independently)
followed by slow differential gene loss.
In summary, different levels of evolutionary constraint are apparent both within and
between species and PRR families following the emergence of vertebrates. Such unique
evolutionary histories suggest that PRR repertoire evolution is driven by specific functional
needs on a case-by-case basis. Further, rather than a simple replacement scenario, where the
acquisition of adaptive immunity supplanted the need for vast repertoires of PRRs in
vertebrates, the ability to interact with the adaptive system, in a safe (i.e. limiting autoimmunity)
and effective manner, is likely the major force restraining the proliferation of certain vertebrate
PRRs.
Rates of functional genomic evolution and gigantism. Rates of genomic evolution vary
considerably across vertebrates, either across clades or in relationship to other biological
factors such as body size. We compared rates in two different aspects of genomic evolution with
potential functional relationship to gigantism in the whale shark to other vertebrates: rates of
amino acid substitution in protein-coding genes, and rates of gene family size evolution. For
these analyses, we determined vertebrate-level gene families by inferring gene families for the
representative vertebrates and excluding lancelet and sea squirt (see Methods).
Substitution rates across a set of single-copy orthologs varied across vertebrate
genomes, and these rates were relatively low in the whale shark compared to most other
vertebrates (Fig. 3). We used the two-cluster test to test for different rates of substitution among
vertebrate clades54. Previous use of the two-cluster test, comparing the Callorhinchus genome
to other vertebrates, supported that Callorhinchus has a slower substitution rate than
coelacanth, teleosts, and tetrapods2. Although the whale shark was estimated to have a slower
rate than Callorhinchus, this difference was not significant (p = 0.7114). Indeed, we found that
cartilaginous fishes evolved more slowly than bony vertebrates overall, as well as more specificbioRxiv preprint first posted online Jun. 28, 2019; doi: http://dx.doi.org/10.1101/685743. The copyright holder for this preprint
(which was not peer-reviewed) is the author/funder, who has granted bioRxiv a license to display the preprint in perpetuity.
It is made available under a CC-BY-NC 4.0 International license.
lineages including gar, coelacanth, and tetrapods (all tests p = 0.0004). We found no evidence
for the node-density artefact that can bias these analyses due to sparse taxon sampling55. The
decreased rate of substitution in protein-coding genes in both Callorhinchus and whale shark
relative to the bony vertebrates is concordant with an overall decreased rate of synonymous
substitutions previously found in cartilaginous fishes11.
We then tested whether rates of molecular substitution differed on branches leading to
gigantism in vertebrates when compared to the background rate of molecular evolution in
vertebrates. The origins of gigantism in elephants, whales, and whale sharks has previously
been shown to correspond to shifts in the rate or mode of body size evolution56–58. We estimated
time-varying rates of body size evolution in cartilaginous fishes, and consistent with previous
research58, found that gigantism in whale shark corresponds to a discrete shift in the rate of
body size evolution to five times the background in cartilaginous fishes (Supplementary Note 4;
Supplementary Figure 6)58. We thus compared rates of genomic evolution in vertebrate giants –
represented by African elephant, minke whale, bowhead whale, and whale shark – to other
vertebrates. We found that rates of amino acid substitution on branches leading to the whale
shark, elephant, and baleen whales were significantly slower than the background rate of
molecular evolution in vertebrates (log-likelihood ratio test p < 0.0001), consistent with earlier
evidence that larger-bodied taxa have lower rates of protein evolution59,60. However, given that
the whale shark genome does not appear to evolve significantly more slowly than the
Callorhinchus genome (as noted above), or other small-bodied sharks as found previously when
focusing on fourfold degenerate sites11, there does not appear to be a compounded effect on
substitution rates in the whale shark genome as both a vertebrate giant and a cartilaginous fish.
This implies that substitution rates and body size may be decoupled within cartilaginous fishes,
which are already overall slowly-evolving, unlike the pattern seen in other vertebrates.
Rates of change in gene family sizes, due to gain and loss of gene copies within gene
families, can also vary across species61. Therefore, this represents another axis of functional
genomic evolution potentially independent from rates of molecular substitution. We estimated
rates for gene family size evolution separately for 6,898 gene families present in lamprey and
jawed vertebrates and 6,181 gene families present in jawed vertebrates but absent in lamprey,
because an assumption of the method used is that gene families are present in the MRCA of all
taxa included62. Average global rates of gene gain and loss in vertebrates were estimated to be
0.0004–0.0005 gains/losses per million years (Figure 4). However, we found that the rate of
gene family size evolution in giant vertebrates was significantly faster than in the remaining
branches both for gene families present in lamprey (p < 0.01) and gene families absent in
lamprey (p = 0.02). Additionally, when we estimated rates independently for each origin of
gigantism, rates of gene gain and loss were estimated to be roughly an order of magnitude
greater in baleen whales than the other giant lineages and the background, implying that baleen
whales have a different pattern of gene family evolution than other vertebrates. That the rate of
gene family size evolution in different vertebrate giants demonstrates that gigantism may not
have the same relationship with overall patterns of gene family size evolution as it does on rates
of amino acid substitution in gene families across the genome, and suggests that substitution
rates and rates of gene duplication and loss may be decoupled.bioRxiv preprint first posted online Jun. 28, 2019; doi: http://dx.doi.org/10.1101/685743. The copyright holder for this preprint
(which was not peer-reviewed) is the author/funder, who has granted bioRxiv a license to display the preprint in perpetuity.
It is made available under a CC-BY-NC 4.0 International license.
Replicated shifts in rates of gene family size evolution for specific gene families across
independent giant lineages might indicate the repeated effect of selection related to gigantism.
We inferred that 2,375 gene families had a rate shift in gene family size evolution on at least
one branch in the vertebrate phylogeny (Supplementary File 8, 9). For these gene families that
had a rate shift, on average, ~5 independent rate shifts occurred among the vertebrate species
considered, indicating the potential for independent rate shifts corresponding to independent
origins of gigantism. We found only three gene families that independently shifted in gene family
size evolution rate along the branches leading to the whale shark, elephant, and baleen whales:
HIST1H4, HIST1H1, and a family formed by NF1A, NF1C, and NF1X. HIST1H4 is a known
cancer-related genes listed by the Cancer Gene Census63,64, supporting that evolution of cancer
suppression may play a role in the evolution of gigantism in histone proteins. Although NF1A,
NF1C, and NF1X are not listed as cancer genes, they are related to a cancer-related gene
NF1B63. Though it is already known that elephants and baleen whales differ in the
cancer-related gene families that have duplicated, the overlap of duplicated cancer-related gene
families across multiple origins of gigantism is compelling. However, a caveat is that these three
gene families have also shifted in rate along other branches among vertebrates, and thus
gigantism is not required for a rate shift: HIST1H4 shifted in rate 18 branches in vertebrate
evolution, HIST1H1 shifted along 13 branches, and NF1 shifted along seven branches, and so
these rate shifts may occur for other adaptations besides gigantism.
We also looked at rate shifts in gene family size evolution restricted to the whale shark,
as duplication in cancer-related gene families is not necessarily expected to occur in all
independent origins of gigantism. For example, in elephants, the duplication of tumor
suppressor protein TP53 has been implicated in reduced cancer rates in elephants relative to
other mammals23,24, while in baleen whales this gene is not duplicated. We confirmed a rate shift
in gene family size evolution in TP53 in the lineage leading to elephant but did not find this gene
family to have shifted in rate along the whale shark branch or the baleen whale branches. We
also did not infer a rate shift in gene families previously suggested to be duplicated in cetaceans
related to longevity or cancer suppression, such as PCNA, LAMTOR1, DLD, KCNMB1, and
PDCD525,65; this may be because while the elephant has twelve copies of TP53, the other
duplications in cetaceans resulted in fewer extra copies, suggesting that focusing on gene
families with a significant rate shift associated with a branch will result in a conservative
identification of candidate gene families. We still found 188 gene families that have shifted in
rate along the branch leading to the whale shark. This set of gene families was enriched for
gene families that included human orthologs that are listed in the Cancer Gene Census63,64. 16
gene families included human orthologs that are related to cancer, representing a significant
enrichment over all gene families tested (odds ratio = 2.022, p = 0.0117). These 16 gene
families included 21 cancer-related human orthologs: AKAP9, CDH10/CDH11, CNTNAP2,
COL1A1/COL2A1/COL3A1, CSMD3, CYSLTR2, DNMT3A, ELN, H3F3A/B, HLA-A, KMT2C/D,
LRP1B, NBEA, PTPRD, SLC34A2, and SRGAP3. This supports that the evolution of cancer
suppression or longevity in the whale shark may relate to gene duplication. However, these
cancer genes are not exclusive to certain tumor types, tissue type, or roles in cancer.
Additionally, these gene families were not enriched for any GO function, nor were any annotated
for any cancer-relevant GO functions (e.g. regulation of cell cycle, apoptosis), suggesting thatbioRxiv preprint first posted online Jun. 28, 2019; doi: http://dx.doi.org/10.1101/685743. The copyright holder for this preprint
(which was not peer-reviewed) is the author/funder, who has granted bioRxiv a license to display the preprint in perpetuity.
It is made available under a CC-BY-NC 4.0 International license.
shifts in gene family size evolution in the whale shark for cancer suppression genes were not
directed at specific functions.
We acknowledge that attempting to identify genomic evolution specific to the whale
shark lineage is hampered a lack of data for smaller-bodied elasmobranchs, because the
lineage separating the whale shark and Callorhinchus also includes evolutionary history that is
not specifically attributed to the whale shark's evolution of gigantism. Hence, identification of
patterns common to the lineage leading to whale shark, elephant, and baleen whales is partially
subdued by intervening divergences between elephant shark, whale shark, and other
elasmobranchs. Future genome sequencing efforts including more elamosbranchs will help to
better clarify genomic evolution specific to the whale shark.
Conclusions
The whale shark is a large, charismatic species and is, by far, the largest species of fish. As a
cartilaginous fish, a lineage for which only few genomes have thus far been sequenced, the
whale shark genome represents an important resource for vertebrate comparative genomics.
The new long read-based genome assembly reported in this paper provides the best gapless
genome assembly thus far among cartilaginous fishes. Comparison of the whale shark to other
vertebrates not only expands the number of shared gene families that were ancestral to jawed
vertebrates, but implies a burst in novel genes at this time of early vertebrate evolution. These
early gene families are involved in a diversity of functions including reproduction, metabolism,
and development. Specifically, with respect to innate immunity genes, we found divergent
patterns of gene gain and loss between NLRs, RIGs, and TLRs, and provide insight into their
repertoires in the jawed vertebrate ancestor. These results rejected a scenario where the
importance of PRRs is muted in vertebrates by the presence of adaptive immunity, rather
indicating their necessity as part of a highly regulated, hybrid immune system. Finally, we
demonstrated that the relationship between rates of gene family size evolution and rates of
substitution to gigantism are decoupled, and explored the role of cancer-related gene evolution
in gigantism in the whale shark and other vertebrate giants. The whale shark genome helps to
build a foundation in shark and vertebrate comparative genomics useful to answer questions of
broader vertebrate evolution and convergent evolution of distinctive traits. A continued increase
in fully-sequenced elasmobranch genomes will continue to enhance research from finding
unique, whale-shark specific evolutionary change to illuminating broader patterns of vertebrate
evolution.
Acknowledgements
The sequencing service was provided by the Norwegian Sequencing Centre
(www.sequencing.uio.no), a national technology platform hosted by the University of Oslo and
supported by the "Functional Genomics" and "Infrastructure" programs of the Research Council
of Norway and the Southeastern Regional Health Authorities". We thank F. Thibaud-Nissen for
assistance with genome annotation through NCBI RefSeq. We thank B. Morgan and the HighbioRxiv preprint first posted online Jun. 28, 2019; doi: http://dx.doi.org/10.1101/685743. The copyright holder for this preprint
(which was not peer-reviewed) is the author/funder, who has granted bioRxiv a license to display the preprint in perpetuity.
It is made available under a CC-BY-NC 4.0 International license.
Performance Computing oversight committee for access and assistance with the Center for
Advanced Science Innovation and Commerce (CASIC) supercomputer at Auburn University, the
rest of the staff of Laboratory of Phyloinformatics in RIKEN BDR for transcriptome sequencing,
and R. A. Petit III for assistance with computing at Emory University. Inference of gigantism in
the whale shark was made possible by body size data kindly provided by C. Mull. We are
thankful for funding provided from the Georgia Aquarium and the Emory School of Medicine
Development. S. Koren and A.M. Phillippy were supported by the Intramural Research Program
of the National Human Genome Research Institute, National Institutes of Health.
Author Contributions
M.T. contributed writing of the manuscript, experimental design, and implementing analyses of
genome polishing, phylogenomics, orthology determination, gene family evolution, RNAseq
mapping, and submission of genomic data to NCBI for accessioning and annotation by RefSeq.
A.K.R. and H.D. performed analyses and wrote the results, supplementary text, and methods
sections on innate immune genes. S.Koren and A.P. assembled the genome using Canu. R.N.,
K.S., and S.Kuraku generated whale shark blood transcriptome data. T.D.R. and A.D.M.D.
initiated and managed the genome project. All authors provided feedback on the manuscript.bioRxiv preprint first posted online Jun. 28, 2019; doi: http://dx.doi.org/10.1101/685743. The copyright holder for this preprint
(which was not peer-reviewed) is the author/funder, who has granted bioRxiv a license to display the preprint in perpetuity.
It is made available under a CC-BY-NC 4.0 International license.
FiguresbioRxiv preprint first posted online Jun. 28, 2019; doi: http://dx.doi.org/10.1101/685743. The copyright holder for this preprint
(which was not peer-reviewed) is the author/funder, who has granted bioRxiv a license to display the preprint in perpetuity.
It is made available under a CC-BY-NC 4.0 International license.
Figure 1. Phenograms visualizing the change in gene family numbers across vertebrate
evolution. The first panel shows the cladogram for vertebrate nodes pictured in the phenograms.
The cladogram is then projected in the subsequent plots such that the y-axis position of each
node and tip corresponds to the number of gene families estimated. Ancestral nodes are
labeled on the x-axis as they differ in relative time, except for the ancestral nodes for bony
vertebrates (marked with "O") and cartilaginous fishes (marked with "C"). The range of counts
inferred for bony vertebrates is indicated by a gray triangle, which includes nineteen bony
vertebrate species. Panels indicate the total number of gene families at each ancestral node
and each tip, the total number of gene families at an ancestral node that are conserved in all
descendant taxa considered, the number of novel gene families that originated at each node,
the number of novel gene families that originated at each node and are conserved in all
descendant taxa considerd, and the total number of gene families lost at each node and tip (for
the total number of gene families lost, we did not sample distant outgroups to determine how
many gene families were lost between the origin of Chordata and Olfactores, hence the dotted
lines). Note the large number of total gene families, novel gene families, novel gene families
conserved in all descendants, and small number of lost gene families at the jawed vertebrate
(Gnathostomata) ancestor. For more detail, see text, Supplementary Note 2, and
Supplementary Figure 3. Silhouettes via Phylopic: lancelet CC BY-SA by Bennet McComish,
photo by Hans Hillewaert; sea squirt CC BY-NC by Mali'o Kodis, photograph by Melissa Frey;
lamprey CC BY by Gareth Monger; Callorhinchus CC BY-SA by Milton Tan, originally by Tony
Ayling; whale shark CC BY-SA by Scarlet23 (vectorized by T. Michael Keesey).bioRxiv preprint first posted online Jun. 28, 2019; doi: http://dx.doi.org/10.1101/685743. The copyright holder for this preprint
(which was not peer-reviewed) is the author/funder, who has granted bioRxiv a license to display the preprint in perpetuity.
It is made available under a CC-BY-NC 4.0 International license.bioRxiv preprint first posted online Jun. 28, 2019; doi: http://dx.doi.org/10.1101/685743. The copyright holder for this preprint
(which was not peer-reviewed) is the author/funder, who has granted bioRxiv a license to display the preprint in perpetuity.
It is made available under a CC-BY-NC 4.0 International license.
Figure 2. PRR repertoires of the whale shark among vertebrates. Nodes supported ≥95%
UFBOOT indicated with a dot. a) NLRs among whale shark, zebrafish, and human. NLRs in
whale shark with a NACHT domain are indicated by a dot at the tip. b) RLR domain trees for
DEAD (left) and CARD (right) domains among vertebrates. Branches are colored by gene,
except for RLRs in whale shark which are colored distinctly and each labeled by a dot at each
tip. c) TLRs among vertebrates. Each clade represents a separate TLR, families found within
TLR13 labeled a (TLR13a), b (TLR32), and c (TLR33). TLR families are also labeled by stars
indicating whether they were present in the whale shark genome, present in jawed vertebrate
ancestor, present in the vertebrate ancestor, and novel to this study. For more detail, see
Supplementary Figures 3–5.
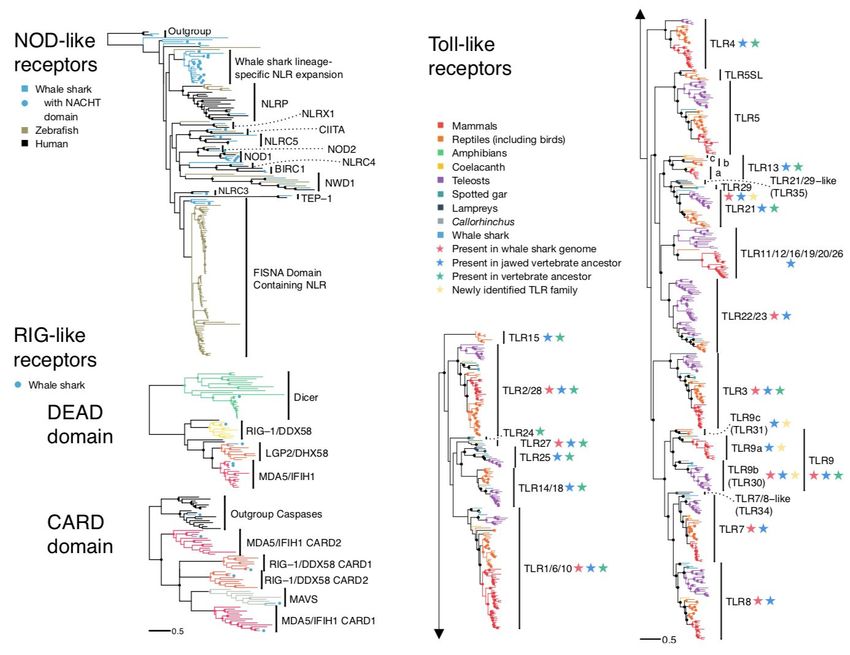
Figure 3. Amino acid substitution rate variation among jawed vertebrates. Branches are colored
based on rates quantified by substitutions per site per million years of the maximum likelihood
tree compared to a time-calibrated tree. Together, the whale shark and Callorhinchus have a
significantly slower rate of molecular evolution than spotted gar and coelacanth, but not
tetrapods. Furthermore, vertebrate giants – including the whale shark, elephant, and whales –
have significantly lower rates of molecular evolution than other vertebrates. Note, color scale is
on normalized reciprocal-transformed data, which emphasizes changes between smaller values
of substitution per My. Silhouettes via Phylopic: Callorhinchus, CC BY-SA by Milton Tan,bioRxiv preprint first posted online Jun. 28, 2019; doi: http://dx.doi.org/10.1101/685743. The copyright holder for this preprint
(which was not peer-reviewed) is the author/funder, who has granted bioRxiv a license to display the preprint in perpetuity.
It is made available under a CC-BY-NC 4.0 International license.
originally by Tony Ayling; whale shark, CC BY-SA by Scarlet23 (vectorized by T. Michael
Keesey); spotted gar, CC BY-NC-SA by Milton Tan; coelacanth, CC BY-NC-SA by Maija Karala;
clawed frog, anole, platypus, opossum, elephant, CC BY by Sarah Werning; alligator, CC
BY-NC-SA by Scott Hartman; mouse, CC BY-SA by David Liao; dolphin, CC BY-SA by Chris
Huh; chicken, armadillo, hyrax, human, dog, pig, cow, minke whale, bowhead whale, public
domain.
Figure 4. Estimated relative rates of gene family size evolution across giant vertebrates. Rates
were estimated separately for gene families present in lamprey (n = 6898) and gene families
absent in lamprey (n = 6181). Average global rates of gene gain and loss in vertebrates under a
single global rate were estimated to be 0.0004 in gene families present in lamprey and 0.0005
gains/losses per million years in gene families absent in lamprey. Rates of gene gain and loss in
giant vertebrates were significantly faster than in the remaining branches for gene families
present (p < 0.01) and gene families absent in lamprey (p = 0.02) as estimated in the two-rate
model. This greater rate in giants appears to be due primarily to a rate increase specific to
baleen whales, as demonstrated in the four rate model where rates were estimated
independently across giant lineages. Silhouttes via Phylopic: whale shark, CC BY-SA by
Scarlet23 (vectorized by T. Michael Keesey); elephant, CC BY by Sarah Werning; whales,
public domain.
Methods
Genome sequence assembly and assessment. To improve on our earlier efforts to sequence
and assemble the whale shark genome6, we generated PacBio long read sequences from the
same DNA sample. These sequences are available on NCBI SRA under the accession
SRX3471980. This resulted in 61.8 Gbp of sequences, equivalent to ~20x fold coverage. ThebioRxiv preprint first posted online Jun. 28, 2019; doi: http://dx.doi.org/10.1101/685743. The copyright holder for this preprint
(which was not peer-reviewed) is the author/funder, who has granted bioRxiv a license to display the preprint in perpetuity.
It is made available under a CC-BY-NC 4.0 International license.
initial assembly was performed using Canu 1.217 with adjusted parameters to account for the
lower input coverage:
canu -p asm -d shark genomeSize=3.5g corMhapSensitivity=high corMinCoverage=2
errorRate=0.035
Illumina reads were aligned to the genome using BWA-MEM66 v0.7.12-r1039 with default
parameters and alignments were used as input into Pilon v1.1867 to correct errors in the draft
assembly. We performed assembly-free estimation of genome size, heterozygosity, and repeat
content and also assessed gene completeness both with conserved orthologs and by mapping
RNA-seq reads (Supplementary Note 1).
Transcriptome sequencing. Approximately 30 million short read pairs for whale shark
transcripts were obtained with paired-end 127 cycles from blood cells of a male and a female by
the Illumina HiSeq 1500 as describe previously11. Animal handling and sample collections at
Okinawa Churaumi Aquarium were conducted by veterinary staff without restraining the
individuals, in accordance with the Husbandry Guidelines approved by the Ethics and Welfare
Committee of Japanese Association of Zoos and Aquariums. Downstream handling of nucleic
acids were conducted in accordance with the Guideline of the Institutional Animal Care and Use
Committee (IACUC) of RIKEN Kobe Branch (Approval ID: H16-11). Transcriptome sequence
data are available at NCBI BioProject ID PRJDB8472 and DDBJ DRA ID DRA008572.
Gene prediction. Genes were predicted by RefSeq using their genome annotation pipeline68.
This annotation included alignments of RNAseq data from grey bambooshark Chiloscyllium
griseum kidney and spleen, nurse shark Ginglymostoma cirratum spleen and thymus, and
brownbanded bambooshark Chiloscyllium punctatum retina, as well as protein alignments from
Actinopterygii, and RefSeq protein sequences for Asian arowana Scleropages formosus,
coelacanth, spotted gar, zebrafish, clawed frog, and human. Based on the RefSeq annotations,
orthology, and synteny, we manually annotated the whale shark Hox gene clusters. After
preliminary orthology determination, we determined additional genes absent in whale shark
conserved among vertebrates, which we annotated by aligning protein sequences from
representative vertebrates to whale shark using genBLAST69,70 (Supplementary Note 1D,
Supplementary File 3).
Orthology inference. We identified orthologs from the whale shark genome by comparison to
publicly available chordate genomes. Chordate genomes were downloaded from RefSeq and
Ensembl for 22 species representing major vertebrate clades, the sea squirt Ciona intestinalis,
and lancelet Branchiostoma floridae (Supplementary Table 3). In selecting representative
vertebrates, we specifically included the African elephant, as well as two baleen whale
genomes, the minke whale and the bowhead whale, and the most closely-related genomes
available for these taxa (rock hyrax and bottlenose dolphin, respectively). These ortholog
clusters were used for the identification of origins of gene families in chordate evolution and
genes that originated in the most recent common ancestor of jawed vertebrates, and studying
enrichment or changes in functional annotation associated with these orthogroups (i.e. for
analyses for the section titled "Ancestral Vertebrate Genome Evolution") (Supplementary File 5).You can also read