Methane emissions from contrasting production regions within Alberta, Canada: Implications under incoming federal methane regulations
←
→
Page content transcription
If your browser does not render page correctly, please read the page content below
O’Connell, E, et al. 2019. Methane emissions from contrasting production
regions within Alberta, Canada: Implications under incoming federal methane
regulations. Elem Sci Anth, 7: 3. DOI: https://doi.org/10.1525/elementa.341
RESEARCH ARTICLE
Methane emissions from contrasting production regions
within Alberta, Canada: Implications under incoming
federal methane regulations
Elizabeth O’Connell*, David Risk*, Emmaline Atherton*, Evelise Bourlon*, Chelsea
Fougère*, Jennifer Baillie*, David Lowry† and Jacob Johnson*
Aggressive reductions of oil and gas sector methane, a potent greenhouse gas, have been proposed in
Canada. Few large-scale measurement studies have been conducted to confirm a baseline. This study used
a vehicle-based gas monitoring system to measure fugitive and vented gas emissions across Lloydminster
(heavy oil), Peace River (heavy oil/bitumen), and Medicine Hat (conventional gas) developments in Alberta,
Canada. Four gases (CO2, CH4, H2S, C2H6), and isotopic δ13CCH4 were recorded in real-time at 1 Hz over
a six-week field campaign. We sampled 1,299 well pads, containing 2,670 unique wells and facilities, in
triplicate. Geochemical emission signatures of fossil fuel-sourced plumes were identified and attributed
to nearby, upwind oil and gas well pads, and a point-source gaussian plume dispersion model was used to
quantify emissions rates. Our analysis focused exclusively on well pads where emissions were detected
>50% of the time when sampled downwind. Emission occurrences and rates were highest in Lloydminster,
where 40.8% of sampled well pads were estimated to be emitting methane-rich gas above our minimum
detection limits (m = 9.73 m3d–1). Of the well pads we found to be persistently emitting in Lloydminster,
an estimated 40.2% (95% CI: 32.2%–49.4%) emitted above the venting threshold in which emissions
mitigation under federal regulations would be required. As a result of measured emissions being larger
than those reported in government inventories, this study suggests government estimates of infrastruc-
ture affected by incoming regulations may be conservative. Comparing emission intensities with available
Canadian-based research suggests good general agreement between studies, regardless of the measure-
ment methodology used for detection and quantification. This study also demonstrates the effectiveness
in applying a gaussian dispersion model to continuous mobile-sourced emissions data as a first-order leak
detection and repair screening methodology for meeting regulatory compliance.
Keywords: Methane; Fugitive and vented emission; Monitoring; Oil and gas; Vehicle-based; Regulation
Introduction 2016). Although proposed venting allowances are differ-
Methane is a short-lived greenhouse gas with a radiative ent amongst federal and provincial jurisdictions, both
heating potential 28–34 times that of carbon dioxide over regulatory approaches will impose new emission caps to
a 100-year timespan, and is the main constituent of energy achieve their reduction goals. To-date, industry has not
sector emissions (Rella et al., 2015; Gasser et al., 2017). In been required to routinely measure and record emissions,
energy developments, methane is emitted during flaring, thus the assumed policy baseline is predicated on emis-
venting (reported and unreported), fugitive leakage, com- sion factor estimates (US EPA, 2013; Barkley et al., 2017)
bustion, storage and handling losses, and accidental releases from 2011, extrapolated to present (Environment and
(Canadian Association of Petroleum Producers, 2004). Climate Change Canada, 2015). U.S. studies have shown
The Canadian government aims to reduce oil and gas that inventory estimates based on emission factors tend
methane emissions 40–45% from 2012 levels by 2025 to show downward bias (Miller et al., 2013; Allen, 2014;
(Government of Canada, 2018), with the province of Brandt et al., 2014), and that emissions from U.S. develop-
Alberta setting a parallel target (Government of Alberta, ments are higher than previous Environmental Protection
Agency (EPA) estimates (Katzenstein et al., 2003; Karion
* St. Francis Xavier University, Department of Earth Sciences, et al., 2013; Miller et al., 2013; Pétron et al., 2014; Peischl
Antigonish Nova Scotia, CA et al., 2016). Most recently, Alvarez et al. (2018) estimates
†
Royal Holloway University of London, Department of Earth that measured emissions from the U.S. oil and natural gas
ciences, Egham, UK
S supply chain are ~60% higher than current EPA inventory
Corresponding author: Elizabeth O’Connell (eoconnel@stfx.ca) estimates. In Canada, measurements are sparse, but recent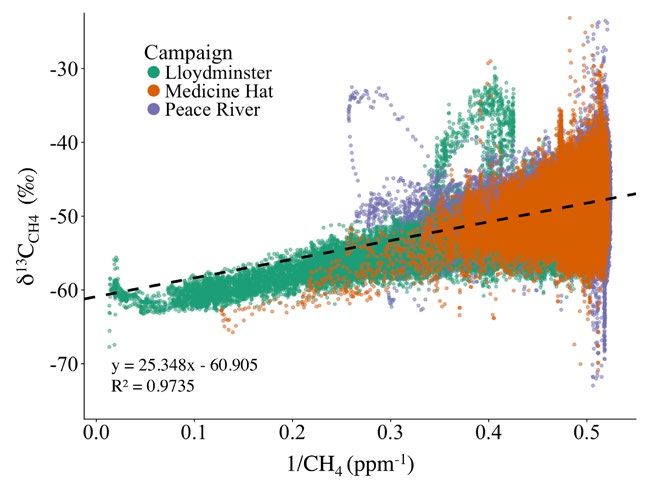
Art. 3, page 2 of 13 O’Connell et al: Methane emissions from contrasting production regions
within Alberta, Canada
studies have documented higher methane emissions than Energy, 2015). Our aims were to (i) broadly describe meth-
those which are reported, or presently reflected in inven- ane mole fractions and drivers of variation across several
tories (GreenPath Energy Ltd., 2016; Atherton et al., 2017; developments; (ii) quantify vented and fugitive emis-
Johnson et al., 2017; Zavala-Araiza et al., 2018). A recent sions frequency and severity from well pads with varied
ground-based study recorded total measured methane infrastructure; (iii) determine the proportion of sites that
emissions that were 15 times higher than total reported exceed the emissions threshold (combined volume of
emissions in Red Deer, Alberta (Zavala-Araiza et al., 2018), hydrocarbon gas that is vented, destroyed, or delivered)
and an aircraft mass balance study suggests that emis- of 40,000 m3 year–1 (~110 m3 day–1), in which venting
sions within the Alberta Lloydminster region are 3.6 times must be limited to 15,000 m3 year–1 (~41 m3 day–1) under
greater than inventory estimates (Johnson et al., 2017). If Canadian federal methane regulations (Government of
Alberta’s oil and gas sector releases 25–50% more meth- Canada, 2018), and (iv) test the effectiveness in applying a
ane than currently reported, as suggested in the aforemen- gaussian dispersion model to continuous, mobile-sourced
tioned study (Johnson et al., 2017), total wasted methane emissions data for leak detection and repair (LDAR)
represents annual losses of ~$213 million CAD in natural screening applications.
gas sales for industry, and ~$17 million CAD in royalties
for government (Pembina Institute, 2018). Methodology
In any cap-based regulatory system, the mitigation eco- a) Survey locations
nomics depend on the proportion of infrastructure emit- Peace River (heavy oil/bitumen), Lloydminster (heavy oil),
ting above the established threshold, and the costs for and Medicine Hat (conventional gas) were chosen as field
fixing the affected infrastructure. Aircraft studies lack the sites for this project due to their contrasting operation
fine-scale resolution to quantify emissions from specific practices, production types, and the extensive oil and gas
classes of infrastructure (Allen, 2014), but vehicle-based development within each region (Figure 1). These areas
emission surveys (Phillips et al., 2013; Brantley et al., 2014; are representative of several hydrocarbon production
Eapi et al., 2014) are well suited for this purpose and can types in Canada.
cover more ground than Optical Gas Imaging (OGI)-based Cold Heavy Oil Production with Sand (CHOPS) is prev-
campaigns. Relative to the U.S., few ground-based studies alent in the Lloydminster Region, and to a lesser extent
have been conducted in Canada, and detailed measure- in Peace River, where thermal recovery is also common.
ments are urgently needed to guide industry and inform CHOPS wells produce water, sand, oil, and associated gas,
policy development. which get separated at the surface via battery production
This study describes vehicle-based surveys across three facilities. Excess associated gas, deemed uneconomic to
upstream energy developments in Alberta; Canada’s larg- capture or re-inject, is typically flared or vented at these
est oil and gas producing and exporting province (Alberta batteries (Johnson and Coderre, 2012; Alberta Energy
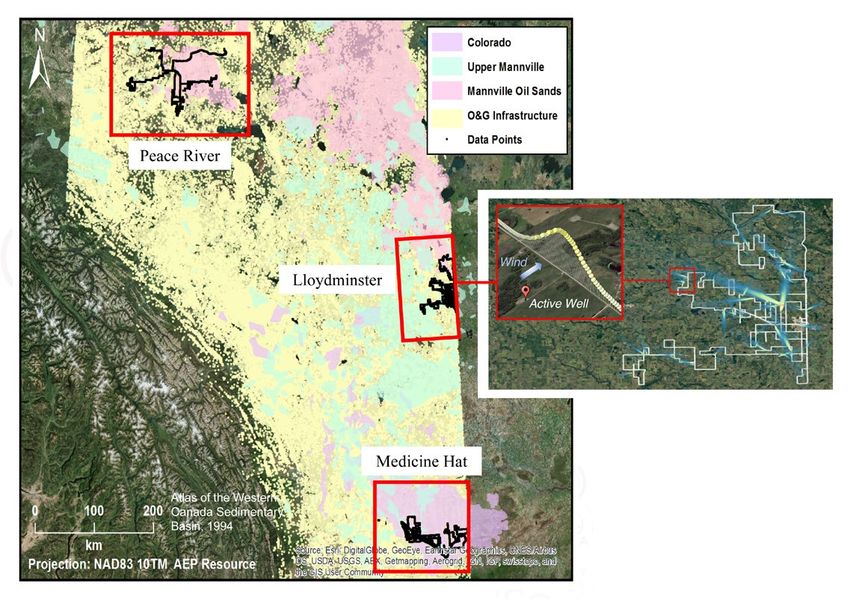
Figure 1: Survey locations in Alberta, Canada. Major geological formations are shown. Survey routes are depicted
in black. DOI: https://doi.org/10.1525/elementa.341.f1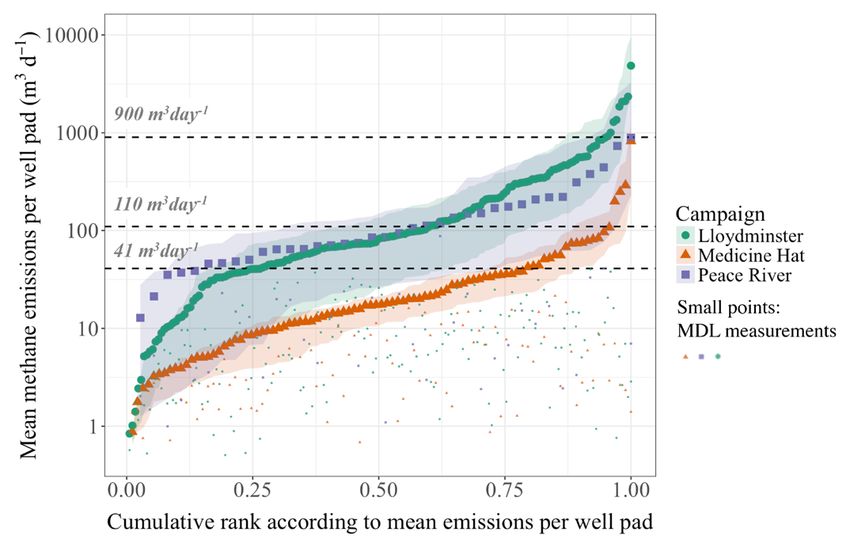
O’Connell et al: Methane emissions from contrasting production regions Art. 3, page 3 of 13 within Alberta, Canada Regulator, 2017a). As a result, CHOPS sites commonly observed anomalies to probable sources – as described in emit large and irregular amounts of methane. Atherton et al. (2017). Only active and suspended infra- Air quality has historically been a concern in Peace River, structure types were considered for this study. We iden- where the oil sands bitumen deposits have higher levels tified wells by their Unique Well Identifiers (UWI), and of sulphur and aromatic compounds than other areas of facilities by their unique facility IDs. A facility in this the province, prompting frequent public odour-related paper encompasses all types of infrastructure in our data- complaints. Following a 2014 report, ‘Recommendations base that has an associated facility ID. These are: batter- on Odours and Emissions in the Peace River Area (Alberta ies, meter stations, regulator stations, injection plants, gas Energy Regulator, 2014), the Alberta Energy Regulator gathering systems, pump stations, gas processing plants, (AER) finalized Directive 084 in 2017, which requires heavy compressor stations, satellites, tank farms, and central oil and bitumen operations in the area to flare, incinerate, treating plants. We defined methane-rich areas as ones in or conserve all casing and tank-top gas, effectively eliminat- which mole fractions of CH4 were enriched above back- ing venting in the area (Alberta Energy Regulator, 2017b). ground levels – where ratios of super-ambient (excess gas, Alberta’s first discovery of natural gas occurred in the written here as ‘e’) CO2 and CH4 (eCO2:eCH4) were highly Medicine Hat region during the early 1880’s. The larg- depressed relative to the global atmospheric average of est natural gas pool in the province, the Medicine Hat ~215 (Atherton et al., 2017). Specifically, we looked for sandstone produces sweet gas and a minor amount of ratios
Art. 3, page 4 of 13 O’Connell et al: Methane emissions from contrasting production regions
within Alberta, Canada
the triplicated routes, which excluded all sites that were types on a well pad. We then averaged this population of
only surveyed once from analysis. Throughout the three estimates to arrive at one emission rate estimate per well
developments we sampled downwind of well pads on pad. Well pad specific maximum and minimum emission
3,973 unique occasions, enumerating 3,574 plumes that rates were calculated assuming the emissions originated
met these criteria. Emissions frequencies presented in this exclusively from the tallest sources present on a pad, or
study are conservative due to the fact our method does the shortest, respectively. For simplicity, this manuscript
not consider episodic or short-lived plumes detected on focuses on mean emission rates, but maximum and mini-
50% or less of our survey passes. Instead, the focus of this mum emission rates for each well pad are presented in the
study is on well pads we found to be persistently emitting, supporting documentation S2.Volumetric_Data.xlsx. In a
in which we can have higher confidence due to repeat small number of cases we found ourselves proximal to
measurements. well pads where tall pieces of infrastructure were situated
For each emitting well pad, the maximum eCH4 mole such as storage tanks, and where our position fell within
fraction measured during an observed plume was fed the theoretical GDM downwash zone, thus underneath
into a point-source Gaussian Dispersion Model (GDM) a hypothetical plume emitted from that source, where
(De Visscher, 2013) to estimate source emission rate, there is a non-Gaussian wake effect. In these situations,
corrected to a standard temperature and pressure. Input we excluded the particular source from the calculated well
parameters to the GDM were: wind speed, distance, esti- pad emission rate average.
mated source emission height, and estimates of Pasquill
atmospheric stability, with downwind sigma values based d) Uncertainty
on Turner (1994) emission rate estimates. Our GDM fol- Mobile-based campaigns are akin to remote sensing,
lowed a ‘screening’ approach comparable to EPA’s ISCST3 and inherently incorporate uncertainty related to both
(US EPA, 2017). Outputs from ISCST3 are proven to be the detection and attribution of plumes. Using control
within 0–2% of EPA’s AERMOD dispersion model (US routes and the same processing techniques as this study,
EPA, 2003), which is the Alberta government’s recom- Atherton et al. (2017) estimated the rate of false positive
mended dispersion model for refined assessment (Alberta plume detections for this type of northern Canadian land-
Government, 2013). Using an empirical formula derived scape, with the conclusion that we can have >99% con-
from laboratory experiments, raw gas mole fractions were fidence in emission detection. In this study, we also used
corrected for factors that damp the instruments response geochemical verification (target gas ratios and Keeling
function, such as averaging filters in the instrument soft- plot intercepts, (Keeling, 1958)) to demonstrate certainty
ware, pulse broadening in the tubing, or dilution that in that we are detecting reservoir-sourced gases. In addi-
occurs within the gas analyzer measurement cavity when tion to g eochemical analysis of data recorded by the truck-
our vehicle may be transiting a plume for only a few sec- based analyzers, we conducted a follow-up field study in
onds, resulting in a mole fraction peak that is smaller than Lloydminster during autumn of 2017 in which 31 grab
the true mole fraction. We determined the magnitude of samples were collected in Flexfoil bags (SKC Ltd.) within
these effects by introducing gas of known composition plumes downwind of emitting well pads. These samples
at the inlet for increasing duration and measuring the were later analyzed at Royal Holloway University of London
corresponding depression in plume centreline response. for species mole fractions using Picarro 1301, LGR EGGA,
Volumetric emission rates presented in this study were and UMEA instruments, and for δ13CCH4 by a CF-GC-IRMS
the average of 1–7 downwind plume transect passes, (Fisher et al., 2006). Source δ13CCH4 signatures were calcu-
depending on the well pad. For each emitting well pad, lated using Keeling plots with background composition
we used the GDM to test whether the average volumet- fixed by ambient air samples collected on the same days.
ric emission rate for a well pad exceeded the 110 m3 day–1 Our plume detection confidence is high, however back-
(40,000 m3 year–1) venting threshold to trigger mitiga- trajectory analysis for attributing plumes to emission
tion under incoming federal regulations (Government sources incorporates more uncertainty because a plume’s
of Canada, 2018). We also estimated an emissions rate origin may be difficult to estimate under certain circum-
Minimum Detection Limit (MDL) at each emitting loca- stances. Uncertainty in plume attribution is introduced
tion using the 5th percentile of excess methane mole frac- by a) ‘shadow’ plumes originating in the distance and not
tions for attributed plumes within each campaign, and a from the most proximal well pad which is what our cur-
source height of 1 m. Sensitivity testing described further rent method assumes to be emitting, b) regions with high
in SM-S3.2, showed that emission release height was the infrastructure density where well pads are closely spaced,
largest source of GDM uncertainty, as many emitting well and c) sources other than those we have considered, such
pads were comprised of an infrastructure distribution as pipelines, etc. We estimated attribution confidence by
with varying possible emission source heights. As emis- considering the assumed emitting well pad relative to all
sions data were recorded while in continuous movement, potential emitting sites for that plume (any site upwind
our method does not have the specificity to pin-point the and within the considered distance for each campaign).
exact emission sources on an emitting well pad. To address Attribution confidence was 74.7%, 92.5%, and 78.5% for
this, we calculated a weighted mean emission rate per well Lloydminster, Peace River, and Medicine Hat respectively.
pad. A range of emission heights were incorporated in the High-density regions such as Lloydminster and Medicine
GDM parameterization, dependent on the distribution Hat led to lower confidence in plume attribution, but
of emissions source heights of individual infrastructure overall rates of attribution suggest that the sources wereO’Connell et al: Methane emissions from contrasting production regions Art. 3, page 5 of 13
within Alberta, Canada
clearly defined on most occasions. In certain cases, it is distances, it is possible to measure emissions from taller
possible that actual emissions were not detected, most (>1 m) sources. Because we cannot be sure of the exact
likely because we were upwind, or the emitting source emitting source on a well pad, we have given equal weight
was too high and not detected based on our proximity, to all possible sources. For improved height parameteriza-
or that it was emitting below our MDL. As a result, our tion accuracy, additional data such as optical gas imagery
emission persistency estimates are likely conservative to would be needed to precisely determine emission point
some degree. source heights.
There are several sources of emissions rate uncertainty
that should be considered in this study including meth- Results and Discussion
odological uncertainty, GDM field data parameterization We sampled a total 1,431 wells and 1,239 facilities oper-
uncertainty, and other considerations such as the impact ated by 59 unique companies of varying sizes. Each site
of obstructions on our modeled emissions rates. These are was sampled downwind at least twice on survey routes
discussed in detail in SM-S3. Previous ground based mobile that we replicated three times on different days, and at
dispersion studies have recorded uncertainty estimates different hours. Survey route statistics by campaign are
ranging from 50–350% (Caulton et al., 2017). To quantify shown in Table 1.
methodological uncertainty in this study, we conducted
a series of controlled release experiments at the Carbon a) Emission geochemistry
Management Canada Research Institutes Field Research Average ambient methane values for Lloydminster, Peace
Station near Brooks, AB, described further in SM-S3.2. River, and Medicine Hat were 2.41 ppm (n = 186,121),
Mean measured emissions rates for populations of trip- 1.97 ppm (n = 148,391), and 2.03 ppm (n = 147,450)
licate measurements were found to have an upwards bias respectively, with all regions more enriched than the
of 30%, in contrast to median measured emission rates current global mean of ~1.85 ppm (National Ocean and
which displayed a downward bias of 18%. The mean meas- Atmospheric Administration, 2018). For context, a simi-
ured rates were influenced by a small number of high lar mobile surveying study conducted by Atherton et al.
emitting outliers. True emissions rates are likely to fall (2017) in the British Columbia Montney recorded a mean
within the mean and median estimates, and as a result, methane value of 1.90 ppm (s = 0.084, n = 444,585),
we have presented both within the SM and Dataset S2. which was very similar to global background values and
Future LDAR screening campaigns should consider these indicative of lower infrastructure density and/or smaller
uncertainties when flagging a well pad with a potential emissions. In dense developments such as the Barnett
emissions exceedance. Yet despite these uncertainties, Shale, recorded background methane values are as high as
we can be confident in our ability to reliably discriminate 11.9 ppm, (s = 63.58) (Rich et al., 2014). Summary ambient
expected, or below regulatory emissions, from regulatory gas statistics are shown in SM – S4.
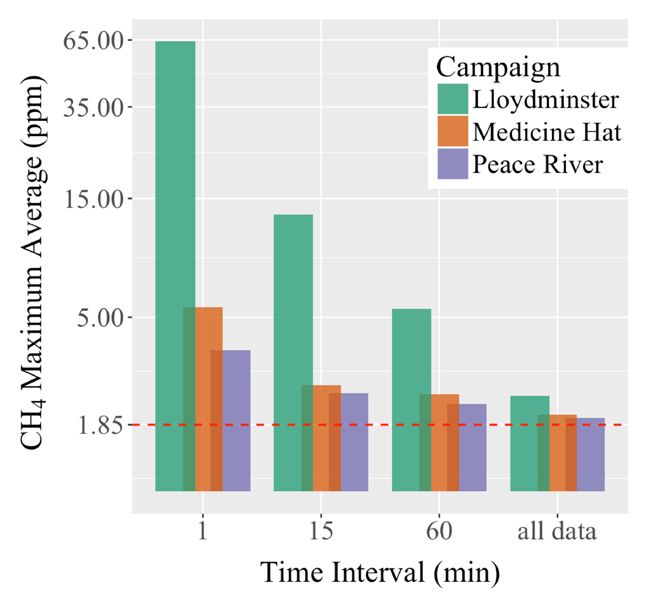
exceedances that are orders of magnitude larger. Mole fraction duration analyses illustrate how raw
In this study, emission rate uncertainty is primarily a methane mole fractions were sustained over different
function of emission height uncertainty. At many sites, time intervals (Figure 2). Individual surveys from each
a multiplicity of well and facility point sources may have campaign were combined and running averages of the
contributed to the plumes we detected on-road, which is methane time series were computed for 1-min., 15-min.,
why we calculated and averaged multiple emission rate and 60-min. intervals. The highest 60-minute averaged
values for each emitting well pad, based on the assumed value reflects the most severe regional scale anomaly
emission heights from all wells and facilities on-site. The observed, which was 5.40 ppm, 2.24 ppm, and 2.45 ppm in
extreme maximum and minimum values for each site Lloydminster, Peace River, and Medicine Hat respectively.
represent a worst-case range of emission rate uncertainty The ‘all data’ column is the arithmetic average methane
specific to that well pad. It should be noted that vehicle- mole fraction over all 15 surveys combined. A large 1-min-
based data collection is somewhat biased toward emis- ute running average methane value, seen left of the bar
sion sources close to the ground and may not always fully chart in Figure 2 suggests that disproportionately large,
capture emissions from taller infrastructure, such as tanks or many emission sources may exist locally. The horizontal
and flares. Our average detection distance for the three red line represents the global atmospheric methane back-
campaigns ranged from 137–220 meters, and at these ground mole fraction of 1.85 ppm (National Ocean and
Table 1: Summary route statistics. DOI: https://doi.org/10.1525/elementa.341.t1
Lloydminster Peace River Medicine Hat
Total km surveyed 2,684 2,881 2,784
Total surveys 15 15 15
Geolocated datapoints collected 2,593,304 2,064,258 2,051,518
Sampled well pads 434 131 734
Total wells on sampled pads 474 219 738
Total facilities on sampled pads 627 246 366Art. 3, page 6 of 13 O’Connell et al: Methane emissions from contrasting production regions
within Alberta, Canada
Figure 3: Keeling plot of δ13CCH4 versus inverse meth-
ane from all surveys (n = 45). Results from the
follow-up isotopic study conducted in Lloydminster are
represented by the trend line. All recorded datapoints
Figure 2: Methane plume mole fraction vs. duration. are presented, no outliers have been removed. DOI:
Individual surveys from each campaign were combined https://doi.org/10.1525/elementa.341.f3
and running averages of the methane time series were
computed for 1-min., 15-min., and 60-min. intervals. calculations (trend line shown in black, Figure 3). Both
The maximum average mole fractions observed over the keeling plot and grab sample results show that meas-
these periods is observed on the logarithmic y-axis. DOI: urements recorded within plumes from upstream oil and
https://doi.org/10.1525/elementa.341.f2 gas infrastructure were representative of known produced
fluid ratios, which show a combined biogenic (δ13CCH4) and
Atmospheric Administration, 2018). We traverse energy thermogenic (C2H6) fingerprint.
developments at speeds of 60 km/hr to 80 km/hr, so the Compositional analysis demonstrates that one can
aforementioned moving averages also reflect mole frac- recover produced fluid ratios through air sampling of
tions over space. A 1-minute moving average might reflect fugitive and vented emissions near oil and gas infrastruc-
a spatial domain of some hectares, thus a local-scale, ture. It also highlights the fact that δ13CCH4 is an imper-
whereas a 1-hour moving average could reflect average fect tracer for many oil and gas production environments,
mole fractions across many square kilometers, covering a as processes such as biodegradation via methanogen-
regional-scale. Lloydminster is the anomaly amongst the esis often obscure distinctive isotopic signals of origin,
three campaigns, having by far the highest methane mole particularly common in shallower formations with low
fraction over all timescales. thermal maturity (Jones et al., 2008). Past literature has
Keeling plots of raw atmospheric gas mole fractions shown δ13CCH4 fossil fuel signatures for ground-sourced
acquired directly by the Picarro analyzer in the truck methane in oil and gas developments that are enriched
(Figure 3) suggest that δ13CCH4 signatures of hydrocarbon relative to the atmosphere (~–45‰ to –41‰), with a
point sources are approximately –63.5‰, –63.6‰, and time averaged, globally weighted mean fossil-fuel δ13CCH4
–47.9‰ for Lloydminster, Medicine Hat, and Peace River of –44.0 ‰ (Schwietzke et al., 2016). It is apparent that
respectively (indicated by the y-intercept in Figure 3). several Albertan developments depart strongly from this
Lloydminster isotopic values fall within published values mean. A δ13CCH4 depleted source component is common
for the Mannville Group strata underlying Lloydminster in several prolific Canadian petroleum reservoirs (Lopez
(δ13CCH4 = –70‰ to –60‰), which are equivalent to val- et al., 2017).
ues observed in the overlying Cretaceous Colorado Group
associated with both Lloydminster and Medicine Hat b) Emission detection and attribution – patterns and
(Rowe and Muehlenbachs, 1999). All three sample regions comparisons across developments
are characterized by immature, biodegraded reservoirs In total, 177 well pads within the Lloydminster heavy
(Deroo and Powell, 1978; Canadian Society of Petroleum oil region, 37 within the Peace River heavy oil/bitumen
Geologists, 1994), and we expected the Peace River keel- region, and 95 around the Medicine Hat shallow gas field
ing intercept to be more depleted in δ13CCH4 as a result. were flagged as emitting. Frequencies of emissions were
However, it falls within the range (–52‰ to –47‰) of 40.8%, 28.2%, and 12.9% in Lloydminster, Peace River,
δ13CCH4 compositions from degraded Peace River oil reser- and Medicine Hat, respectively. Table 2 presents a break-
voir gases measured by Jones et al. (2008). down of well and facility classes most commonly found on
From the follow-up grab sample campaigns in sampled and emitting well pads. For simplicity, suspended
Lloydminster, plumes downwind of 31 emitting well pads and active wells of all categories (gas, oil, etc.) have been
showed an average δ13CCH4 of –60.9‰ (s = 1.25), and 0.84% combined. It should be noted that in some cases, emis-
C2H6 (s = 0.55) which matches well with our mobile-based sions from well pads with suspended infrastructure mayO’Connell et al: Methane emissions from contrasting production regions Art. 3, page 7 of 13
within Alberta, Canada
Table 2: Breakdown of most commonly observed infrastructure (classes that were sampled >10 times total) on sampled
and emitting well pads, ordered by occurrence. DOI: https://doi.org/10.1525/elementa.341.t2
Infrastructure Class Present at Present at
Sampled Sites (n) Emitting Sites (n)
Lloydminster Battery 585 272
Suspended Well 278 112
Active Well 193 99
Total Well Pads 434 177
Peace River Battery 190 68
Active Well 174 60
Suspended Well 37 11
Meter and/or Regulator Station 23 4
Satellite 19 5
Total Well Pads 131 37
Medicine Hat Active Well 629 69
Battery 289 130
Suspended Well 58 11
Commingled Well 51 5
Compressor Station 26 13
Meter and or Regulator Station 25 15
Total Well Pads 734 95
originate from gas migration, old associated pipelines, or multiply by our emission frequency of 40.8%. This value
other infrastructure not considered here. is ~50% lower than the emission rate of 195 m3 day–1
Well pads with persistent emissions, and thus those per well pad that Johnson et al. (2017) estimated for
flagged as an emitting group on every survey pass, were the Lloydminster area. To make this comparison, we re-
most likely to contain batteries onsite in all develop- calculated the total number of well pads in the Johnson
ments. Additionally, multi-infrastructure sites were prone et al. (2017) study area using the centroid provided, our
to larger emissions in all cases, when compared to single infrastructural databases, and the same method of iden-
infrastructure well pads. We saw episodic emissions in tifying well pads as described earlier. We then divided the
all campaigns, but emissions in Lloydminster and Peace study’s oil and gas sector methane emission rate for the
River displayed the highest degree of spatiotemporal region by the number of well pads (n = 4381). This result
variability, suggesting a need for monitoring technologies is in-line with our expectation that a vehicle-based study
that can capture and quantify long-term variability within would lead to lower emission intensity estimates because
a range of emission intensities. Using the Conventional vehicle-based data collection is somewhat biased toward
Volumetric Information report publicly available by emission sources close to the ground and may not always
Petrinex (2018), we performed a regression analysis to fully capture emissions from taller infrastructure, pipe-
compare reported oil (Lloydminster and Peace River) lines and other leaks, or service events. Additionally, our
and gas (Medicine Hat) daily production volumes for the emissions frequencies are conservative because well pads
month of our study to our measured emissions rates on a at which we detected emissions from 50% or less of the
per-site basis. There were no statistically significant rela- times they were surveyed from have been omitted from
tionships between measured emissions and production analysis. Episodic sources exist yet were excluded in our
for any of the three developments. analysis as they are not the focus of our study.
Lloydminster is an anomaly amongst Canadian develop- We saw appreciable emission rate variability in
ments. This is reflected in provincial flaring and venting Lloydminster, with s = 512, range = 0.840–4,850 m3 day–1,
inventories (Alberta Energy Regulator, 2017a), a 2017 air- and a 75th percentile of 247 m3 day–1, indicating that a
borne study (Johnson et al., 2017), and additionally in our small number of high emitting sources are skewing the
measurements, through elevated emission frequencies and mean intensity values. In Lloydminster, plumes were
regional background CH4. The mean emission intensity for detected on-road at an average distance of 137 m from
the development was also high at 249 m3 day–1 (95% CI: source at an average MDL of 9.73 m3 day–1. On emitting
173–325 m3 day–1) per emitting well pad. Considering not pads, 42.7% of the infrastructural population that could
all well pads in the development are emitting, our aver- have been contributing to emissions were assumed to
age emission rate per well pad is 102 m3 day–1, once we originate from ground level sources, and 51.2% of theArt. 3, page 8 of 13 O’Connell et al: Methane emissions from contrasting production regions
within Alberta, Canada
sources were from higher emission sources (i.e. tanks). rate estimates from repeat downwind passes showed
Overall, the majority of emitting well pads in Lloydminster appreciable variability. In SM-S3.2 a) Methodological
included tall emission sources, most often tanks. Uncertainty, we describe two approaches, one which con-
In oil-producing regions such as Lloydminster, the siders the mean of repeat downwind measurements at a
impact of tank vents on overall emissions inventories site, the other which considers the median. Had we used
could be significant. In this study, 500 active and sus- the more conservative of the two (higher probability of
pended wells and facilities on 177 unique well pads underestimation), inferred development-average rate
potentially contributed to the measured emissions, with estimates for emitting sites would have been ~60 m3 day–1
batteries and active wells being the most prevalent infra- lower, which lies at the lower edge of confidence intervals
structure types on-site. A study by Lyon et al. (2016) used presented above. For other developments our approach
aerial surveys across seven U.S. oil-producing basins to to variability mattered less because differences in mean
conclude that oil storage tanks were responsible for >90% and median rates over multiple passes were not signifi-
of CH4 emissions. Unreported venting from sources such cant. In Peace River, we suspect that operational vari-
as pneumatic instrument vent gas and tanks are a major ability and topography both contributed to increased
contributor to the discrepancy between government and measurement variability.
recent measurement-based inventories in this region Due to accessibility constraints, Peace River cam-
(Johnson et al., 2017), and should be included in future paigns sampled >300 fewer sites than Lloydminster and
inventories. Incoming federal legislation aims to reduce Medicine Hat. In total, 37 plumes originating from emit-
venting from CHOPS sites, but the stochastic nature of ting well pads in Peace River were enumerated from an
these emissions poses significant methane regulation average detection distance of 220 m, at an average MDL
compliance challenges for operators in this area. of 12.4 m3 day–1. Since 2014, operators in the affected
In Peace River, active wells made up the majority of regions of the Peace River area have implemented infra-
sampled wells in the region (174), which contributed to structure improvements in response to AER regulatory
the 28.2% of well pads flagged as emitting. The calcu- requirements including tank top vapour recovery sys-
lated emission frequency was lower in comparison to that tems, flares for system upset and tank top volumes, addi-
of Lloydminster, the other oil development sampled, and tional compression to gather casing gas for injection into
emission severity was intermediate, with a mean emis- the gathering system, and capacity expansion for exist-
sion rate of 158 m3 day–1 (95% CI: 97.6–217 m3 day–1, ing gas gathering systems. Beginning in 2015, the AER
s = 186, range = 12.8–891 m3 day–1) and a 75th percen- has reported substantial reductions in gas venting from
tile of 176 m3 day–1 per emitting well pad. Relative to oil and bitumen batteries, as documented on the Peace
Lloydminster, Peace River had fewer extreme emitters, as River Performance Dashboard of the AER website (Alberta
seen by the emissions distribution in Figure 4. Emission Energy Regulator, 2018). Thus, regulatory action taken by
Figure 4: Mean emission rate per emitting well pad, colored by development. Regulatory thresholds of interest
are the volumes in which affected infrastructure need to comply under existing and future federal venting regula-
tions, and are labelled by dashed lines at 900 m3 day–1, 110 m3 day–1, and 41 m3 day–1. The small points are individual
MDL measurements, coloured by campaign. The shadow for each campaign represents the range of possible emis-
sions, based on maximum and minimum heights. Please note the logarithmic scale on the y-axis. DOI: https://doi.
org/10.1525/elementa.341.f4O’Connell et al: Methane emissions from contrasting production regions Art. 3, page 9 of 13 within Alberta, Canada AER in Peace River over the past four years is presumed procedure mentioned above by Zavala-Araiza et al. (2018) to be partially responsible for the relatively low incidence This process, explained further in SM-S3.3, enables us to of hydrocarbon plumes within the region, as Bulletin more readily compare emissions across developments, as 2014–17’s recommendations focus on the reduction of we apply the same lognormal fit assumptions across all venting and flaring in the area (Alberta Energy Regulator, campaigns. Due to the lack of an unbiased dataset upon 2014). AER’s directive 084 released in early 2017 will have which to compare our GDM estimates, the fitted distribu- operators conserve at least 95 per cent of all solution gas tion has not been corrected for a high-emitter bias. The (Alberta Energy Regulator, 2017b), and we expect emis- derived development-wide emission rate means are sum- sions in this region to continually decline as new emission marized in SM-Table S1. management practices are implemented. Therefore, we While OGI and mobile-based measurement have dif- can infer from our results that increased historic scrutiny ferent sensitivities and operate on varied scales, we can and more stringent regulation may have already contrib- draw qualitative comparisons with the 2016 Greenpath uted to the low eCH4 incidence in Peace River, demonstrat- Alberta Fugitive and Vented Emissions Inventory Study, ing the effectiveness (and future potential) of regulation which occurred in nearby regions within three months of in improving environmental performance. Despite posi- our mobile measurement campaign. Here, OGI detection tive efforts in emission management by industry, Peace was used for 676 inspections at 395 distinct facility loca- River also recorded the highest H2S of all campaigns, as tions across six geographical areas (GreenPath Energy Ltd., expected due to the sulfurous nature of the underlying 2016). In the OGI study, an average of eight leaks or vents deposits. Alberta’s ambient air quality objectives for H2S were visible via the thermal imaging cameras for every ten state that concentrations must not exceed a one-hour facilities inspected. In Bonnyville AB, a CHOPS heavy oil average of 10 ppbv, or 24-hour average of 3 ppbv (Alberta development north of Lloydminster, 225 leaks or vents Government, 2017). Although our recorded values surpass were detected over 102 locations, 99% of which were such limits, we cannot classify this as an accurate exceed- from venting related sources. An emissions incidence in ance due to the ‘point in time’ nature of mobile surveying, Bonnyville of 2.2, described as emissions detected/sites as opposed to stationary collection. However, our results surveyed, is contrasted to the mere 0.11 observed in do indicate a possibility of exceedances in the area, and Medicine Hat, where 7 emissions were detected over 63 further stationary monitoring is recommended to ensure locations. Similar to our study, the CHOPS development compliance with ambient air quality guidelines. has an emissions incidence several factors higher than the Active wells were the predominant class of infrastruc- conventional gas development in Medicine Hat. Because ture surveyed in Medicine Hat, with 85.2% of all wells the average OGI inspection takes ~2.7 hours per well- considered sampled classified as active. Favorable wind pad (ICF International, 2015), and an on-road survey can conditions and a dense development allowed us to survey sweep several hundred pieces of infrastructure within 734 well pads 2 to 9 times each over the course of 15 sur- a day (at MDL’s as low as ~0.30 m3 day–1, depending on veys. Attributed plumes in this region had an average MDL source proximity, emission strength, height, etc.), indus- of 5.50 m3 day–1. Infrastructure groupings containing only try could experience significant time and cost savings if facilities were nearly three times more likely to emit than truck-based screening is adopted as a first-order monitor- well-exclusive sites. Detected from an average distance of ing technique, triggering OGI inspections only at identi- 138 m, 93 plumes that we attributed to sites upwind emit- fied sites. As the move from emission estimates (factors) to ted methane at an average rate of 40.6 m3 day–1 (95% CI: emission measurements becomes enforced, a multi-scale, 21.8–59.8 m3 day–1, s = 93.8, range = 0.87–820 m3 day–1), triage approach will be fundamental to efficient monitor- with a 75th percentile of 35.8 m3 day–1. In Medicine Hat ing on an operational scale. and adjacent regions, the majority of facilities do not use Currently, the AER enforces solution gas flaring/vent- pneumatic pumps or controls, and wells generally have a ing conservation requirements on sites (defined as a pipe-in/pipe-out configuration with no surface facilities single-surface lease where gas is flared or vented) that such as separators. As a result, there are limited emissions emit over 900 m3 day–1 (Alberta Energy Regulator, 2016). from pneumatic devices (GreenPath Energy Ltd., 2016), Commencing in 2023, federal regulations will limit vent- which in-part explains why Medicine Hat had the lowest ing to ~41 m3 day–1 (15,000 m3 year–1) on qualifying plume incidence and magnitude amongst the three devel- facilities that vent over 40,000 m3 year–1 (~110 m3 day–1) opments (Figure 4). (Government of Canada, 2018). While this is not pres- The mean emission intensity for each development ently a legislated threshold, we can still consider the pos- fell near the range observed from seven previous inde- sible implications for mitigation. As regulations tighten, pendent ground-based studies at energy production sites thousands of infrastructural retrofits will be required to across North America, where mean emissions intensity meet conservation requirements. Of emitting well pads, per-site determined from a central emission factor drawn 40.2% (95% CI: 32.2–49.9%), 43.2% (24.3–54.1%), and from a probability distribution function specific to each 4.3% (3.23–10.75%) of sites in Lloydminster, Peace River, region ranged from 42–258 m3 day–1 (Zavala-Araiza et al., and Medicine Hat respectively exceeded the 110 m3 day–1 2018). It should be noted that Lloydminster and Medicine threshold to trigger emissions reduction compliance. Hat are on the high and low range of the distribution, Nine detected plumes in Lloydminster, or 5.2% of the respectively. To account for emissions that fall below our total plumes, exceeded the current AER Directive 60 MDL, we have re-calculated development-wide means threshold for per-site emissions. We did not detect emis- from a fitted lognormal distribution, following a similar sion rate exceedances of 900 m3 day–1 in Medicine Hat or
Art. 3, page 10 of 13                                    O’Connell et al: Methane emissions from contrasting production regions
                                                                                                        within Alberta, Canada

Peace River. All campaigns were characterized by a heavy       varied largely by development, but were the most signif-
tail emissions distribution, in which 74.8%, 57.6%, and        icant in terms of frequency and magnitude in the Lloy-
72.4% of cumulative emissions in Lloydminster, Peace           dminster region. The relatively low incidence of hydrocar-
River, and Medicine Hat respectively originated from 20%       bon plumes detected in Peace River are presumed to be
of emitting sites.                                             in part due to gas conservation regulations and resulting
   Considering both the emission frequencies and the           management practices implemented in recent years, thus
volumetric distributions for each campaign, we extrap-         demonstrating the effectiveness and potential of regula-
olated our results to estimate the approximate pro-            tion in mitigating emissions.
portion of well pads that would be affected under the             The application of a gaussian dispersion model to con-
venting mitigation threshold of ~110 m3 day–1 through-         tinuous, mobile-sourced emissions measurement data was
out a ~25,000 km2 region within each development.              found to be an effective technique for flagging high emit-
Using these assumptions, we estimate 2,668 of 16,267;          ting sites with potential regulatory exceedances, and for
or 16.4% sites within the Lloydminster region, 418 of          characterizing emissions occurrences, rates, and patterns.
3,433; or 12.2% sites within the Peace River region, and       The large-scale efficiency benefits of the vehicle-based
283 of 51,016; or 0.55% of sites within the Medicine Hat       technique are in part offset by the increased uncertainty
region would be emitting over 110 m3 day–1 according to        inherent with mobile techniques. Effective LDAR pro-
our mobile surveying results. The estimated proportion         grams will involve additional technologies with greater
of infrastructure that would require mitigation based on       specificity to refine emissions estimates and pin-point the
the 110 m3 day–1 threshold is low in Medicine Hat, yet         exact emission on a well pad once a screening campaign
the infrastructure count is high, especially relative to the   is conducted. As the first large-scale mobile emissions
low rates of hydrocarbon production. Comparatively, a          study in Alberta, this work demonstrates the effectiveness
considerably larger proportion of sites in Lloydminster        of vehicle-based techniques as a first-order screening tool
could be affected, yet the development is smaller and          to meet regulatory leak detection and repair compliance.
more productive per well. The Canadian Government              When properly combined with standard approaches such
predicts a total 7,590 sites across the country will be        as OGI, the application of alternative LDAR technologies
affected by the incoming venting regulations, which con-       such as satellite, drone, mobile techniques, etc. pose prom-
siders all existing and new facilities between 2018–2035       ising time and economic advantages. This is important, as
(Government of Canada, 2018). Applying our measured            we suggest a greater number of sites then expected will
emissions distribution to the extrapolated region, our         be affected under the new regulations. Future ambient
analysis above estimates approximately ~3,300 sites            monitoring is needed to quantify the impact of the regula-
total could require mitigation in the Lloydminster, Peace      tions on air quality once implemented, and this study has
River, and Medicine Hat regions alone. We do acknowl-          provided a development-specific baseline against which
edge that not all of the facilities in the above extrapo-      to compare.
lation region would meet the potential to emit criteria           Methane cannot be managed without the accurate col-
outlined in the Federal regulations which is a condition       lection of widespread, defensible measurements, and as
for venting restrictions to apply, but based on our results,   additional data are collected in Alberta, a better statisti-
it is likely that government estimates of affected infra-      cal understanding of emission norms and variance will
structure are conservative as a result of measured emis-       develop over time, leading to refined estimates of affected
sions being larger than those reported in government           infrastructure and associated mitigation costs.
inventories. Quantifying the extent to which estimates
are conservative would require emissions data recorded         Data Accessibility Statement
in additional developments across Canada and is beyond         Datasets produced in this work are available as online
the scope of this paper. However, Canadian industry and        supplemental material accompanying this publication.
policymakers are still assessing the impact of the incom-      Dataset S1 contains emission source heights used in the
ing regulations, and in that context studies like this offer   GDM. Dataset S2 contains a unique ID for each emitting
useful insight.                                                well pad in which we calculated a volumetric emission
                                                               rate, the mean emissions rate, the median emissions rate,
Conclusion                                                     MDL, standard deviation, standard error, and maximum
Patterns presented by different research groups working        and minimum volumetric emissions rates per individual
independently of one another show that Canadian-based          well pads.
studies thus far (emissions rates, frequencies, inventory
validity by development style) are generally consistent        Supplemental files
regardless of methodology applied (GreenPath Energy            The supplemental files for this article can be found as follows:
Ltd., 2016; Atherton et al., 2017; Johnson et al., 2017;
Zavala-Araiza et al., 2018), suggesting reasonable agree-         • Dataset S1. Infrastructure heights for GDM. DOI:
ment between varying measurement approaches. In many                https://doi.org/10.1525/elementa.341.s1
developments, measured emissions are higher than emis-            • Dataset S2. Volumetric emissions data. DOI: https://
sion factor-based inventory estimates, though discrep-              doi.org/10.1525/elementa.341.s2
ancies are development specific (Atherton et al., 2017;           • Text S1–5. Supplemental material. DOI: https://doi.
Johnson et al., 2017; Zavala-Araiza et al., 2018). Emissions        org/10.1525/elementa.341.s3
O’Connell et al: Methane emissions from contrasting production regions Art. 3, page 11 of 13
within Alberta, Canada
Acknowledgements ca/air/air-quality-modelling/documents/AirQuali-
The authors would like to thank Alex Marshall and Tara tyModelGuideline-Oct1-2013.pdf.
Hanlon for the help with data collection, and Altus Alberta Government. 2017. Ambient Air Monitoring
Geomatics for the GIS database assistance. Performance Specification Standards. Available at:
http://aep.alberta.ca/air/legislation-and-policy/
Funding information air-monitoring-directive/documents/HydrogenSul-
Funding for this work was provided by the Petroleum phide-TRS-Jun26-2017.pdf.
Technology Alliance of Canada (Alberta Upstream Petro- Allen, DT. 2014. Methane emissions from natural
leum Research Fund) and the Atlantic Canada Opportuni- gas production and use: reconciling bottom-up
ties Agency (Atlantic Innovation Fund). and top-down measurements. Curr Opin Chem
Eng 5: 78–83. DOI: https://doi.org/10.1016/J.
Competing interests COCHE.2014.05.004
The authors declare no competing financial interests. The Alvarez, RA, Zavala-Araiza, D, Lyon, DR, Allen, DT,
research presented in this manuscript was exclusively Barkley, ZR, Brandt, AR, Davis, KJ, Herndon,
done under the contracts to the authors’ academic affili- SC, Jacob, DJ, Karion, A, Kort, EA, Lamb, BK,
ations. There is no overlap or relationship between the Lauvaux, T, Maasakkers, JD, Marchese, AJ,
funding organizations of this study, and any work that Omara, M, Pacala, SW, Peischl, J, Robinson, AL,
authors EO, DR, and EA have been conducting with their Shepson, PB, Sweeney, C, Townsend-Small, A,
private company, Arolytics Inc. Wofsy, SC and Hamburg, SP. 2018. Assessment of
methane emissions from the U.S. oil and gas supply
Author contributions chain. Science 361(6398): 186–188. DOI: https://
• Contributed to conception and design: EO, DR, EA doi.org/10.1126/science.aar7204
• Contributed to acquisition of data: EO, JB, DL, JJ Atherton, E, Risk, D, Fougère, C, Lavoie, M, Marshall,
• Contributed to analysis and interpretation of data: A, Werring, J, Williams, JP and Minions, C. 2017.
EO, DR, EA, EB, CF, DL, JJ Mobile measurement of methane emissions from
• Drafted and/or revised the article: EO, DR, EA, EB, CF, natural gas developments in northeastern Brit-
JB, DL, JJ ish Columbia, Canada. Atmos Chem Phys 17(20):
• Approved the submitted version for publication: EO, 12405–12420. DOI: https://doi.org/10.5194/
DR, EA, EB, CF, JB, DL, JJ acp-17-12405-2017
Barkley, ZR, Lauvaux, T, Davis, KJ, Deng, A, Miles, NL,
References Richardson, SJ, Cao, Y, Sweeney, C, Karion, A,
Alberta Energy. 2015. Conventional Oil Statistics. Avail- Smith, M, Kort, EA, Schwietzke, S, Murphy, T,
able at: http://www.energy.alberta.ca/Oil/Pages/ Cervone, G, Martins, D and Maasakkers, JD. 2017.
default.aspx. Accessed 2018 Mar 20. Quantifying methane emissions from natural gas
Alberta Energy Regulator. 2014. Report of Recommen- production in north-eastern Pennsylvania. Atmos
dations on Odours and Emissions in the Peace River Chem Phys 17(22): 13941–13966. DOI: https://doi.
Area. Available at: https://www.aer.ca/documents/ org/10.5194/acp-17-13941-2017
decisions/2014/2014-ABAER-005.pdf. Brandt, AR, Heath, GA, Kort, EA, O’Sullivan, F, Petron,
Alberta Energy Regulator. 2016. Directive 060: Upstream G, Jordaan, SM, Tans, P, Wilcox, J, Gopstein, AM,
Petroleum Industry Flaring, Incinerating, and Vent- Arent, D, Wofsy, S, Brown, NJ, Bradley, R, Stucky,
ing. Available at: https://www.aer.ca/documents/ GD, Eardley, D and Harriss, R. 2014. Methane
directives/Directive060.pdf. Leaks from North American Natural Gas Systems.
Alberta Energy Regulator. 2017a. Upstream Petroleum Science 343(6172): 733–735. DOI: https://doi.
Industry Flaring and Venting Report Industry Per- org/10.1126/science.1247045
formance for Year Ending ST60B-2017. Available at: Brantley, HL, Thoma, ED, Squier, WC, Guven, BB and
https://www.aer.ca/documents/sts/ST60B-2017. Lyon, D. 2014. Assessment of methane emissions
pdf. Accessed 2018 Apr 25. from oil and gas production pads using mobile
Alberta Energy Regulator. 2017b. Directive 084: measurements. Environ Sci Technol 48(24): 14508–
Requirements for Hydrocarbon Emission Controls 14515. DOI: https://doi.org/10.1021/es503070q
and Gas Conservation in the Peace River Area. Avail- Canadian Association of Petroleum Producers.
able at: https://www.aer.ca/documents/directives/ 2004. A National Inventory of Greenhouse Gas,
Directive084.pdf. Criteria Air Contaminant and Hydrogen Sulphide
Alberta Energy Regulator. 2018. Peace River Perfor- Emissions by the Upstream Oil and Gas Indus-
mance Dashboard. Available at: https://www.aer. try Volume 1, Overview of the GHG Emissions
ca/protecting-what-matters/reporting-on-our-pro- Inventory. Available at: https://www.capp.ca/~/
gress/taking-action-in-peace-river/peace-river-per- media/capp/customer-portal/publications/86220.
formance-dashboard. Accessed 2018 Aug 20. pdf?modified=20161201134457. Accessed 2018
Alberta Government. 2013. Alberta Environment and Mar 8.
Sustainable Resource Development Air Quality Canadian Society of Petroleum Geologists. 1994. Geo-
Model Guideline. Available at: http://aep.alberta. logical Atlas of the Western Canada SedimentaryArt. 3, page 12 of 13 O’Connell et al: Methane emissions from contrasting production regions
within Alberta, Canada
Basin, Cretaceous Colorado-Alberta Groups. ICF International. 2015. Economic Analysis of Meth-
Available at: http://www.cspg.org/documents/ ane Emission Reduction Opportunities in the U.S.
Publications/Atlas/geological/atlas_20_creta- Onshore Oil and Natural Gas Industries. Available
ceous_colorado-alberta_groups.pdf. at: https://www.edf.org/sites/default/files/meth-
Caulton, DR, Li, Q, Bou-Zeid, E, Lu, J, Lane, HM, Fitts, ane_cost_curve_report.pdf.
JP, Buchholz, B, Golston, LM, Guo, X, McSpiritt, Johnson, MR and Coderre, AR. 2012. Opportunities for
J, Pan, D, Wendt, L and Zondlo, MA. 2017. Improv- CO2 equivalent emissions reductions via flare and
ing Mobile Platform Gaussian-Derived Emission vent mitigation: A case study for Alberta, Canada.
Estimates Using Hierarchical Sampling and Large Int J Greenh Gas Control 8: 121–131. DOI: https://
Eddy Simulation. Atmos Chem Phys Discuss, 1–39. doi.org/10.1016/J.IJGGC.2012.02.004
DOI: https://doi.org/ doi.org/10.5194/acp-2017-96 Johnson, MR, Tyner, DR, Conley, S, Schwietzke, S and
Deroo, G and Powell, TG. 1978. The oil sands of Alberta: Zavala-Araiza, D. 2017. Comparisons of Airborne
their origin and geochemical history. Available at: Measurements and Inventory Estimates of Methane
https://web.anl.gov/PCS/acsfuel/preprint archive/ Emissions in the Alberta Upstream Oil and Gas Sec-
Files/22_3_MONTREAL_06-77_0183.pdf. tor. Environ Sci Technol 51(21): 13008–13017. DOI:
De Visscher, A. 2013. Air Dispersion Modelling: Founda- https://doi.org/10.1021/acs.est.7b03525
tions and Applications. First Edit. Philadelphia: John Jones, DM, Head, IM, Gray, ND, Adams, JJ, Rowan,
Wiley & Sons, Inc. AK, Aitken, CM, Bennett, B, Huang, H, Brown,
Eapi, GR, Sabnis, MS and Sattler, ML. 2014. Mobile A, Bowler, BFJ, Oldenburg, T, Erdmann, M and
measurement of methane and hydrogen sulfide at Larter, SR. 2008. Crude-oil biodegradation via
natural gas production site fence lines in the Texas methanogenesis in subsurface petroleum reser-
Barnett Shale. J Air Waste Manag Assoc 64(8): 927– voirs. Nature 451(7175): 176–180. DOI: https://doi.
944. DOI: https://doi.org/10.1080/10962247.2014 org/10.1038/nature06484
.907098 Karion, A, Sweeney, C, Pétron, G, Frost, G, Hardesty,
Environment and Climate Change Canada. 2015. MR, Kofler, J, Miller, BR, Newberger, T, Wolter,
National Inventory Report 1990–2014: Greenhouse S, Banta, R, Brewer, A, Dlugokencky, E, Lang,
Gas Sources and Sinks in Canada Part 1. Available P, Montzka, SA, Schnell, R, Tans, P, Trainer, M,
at: http://publications.gc.ca/collections/collec- Zamora, R and Conley, S. 2013. Methane emissions
tion_2016/eccc/En81-4-1-2014-eng.pdf. estimate from airborne measurements over a west-
Fisher, R, Lowry, D, Wilkin, O, Sriskantharajah, S and ern United States natural gas field. Geophys Res Lett
Nisbet, EG. 2006. High-precision, automated sta- 40(16): 4393–4397. DOI: https://doi.org/10.1002/
ble isotope analysis of atmospheric methane and grl.50811
carbon dioxide using continuous-flow isotope-ratio Katzenstein, AS, Doezema, LA, Simpson, IJ, Blake,
mass spectrometry. Rapid Commun Mass Spectrom DR and Rowland, FS. 2003. Extensive regional
20(2): 200–208. DOI: https://doi.org/10.1002/ atmospheric hydrocarbon pollution in the south-
rcm.2300 western United States. Proc Natl Acad Sci U S A
Gasser, T, Peters, GP, Fuglestvedt, JS, Collins, WJ, 100(21): 11975–9. DOI: https://doi.org/10.1073/
Shindell, DT and Ciais, P. 2017. Accounting for pnas.1635258100
the climate-carbon feedback in emission metrics. Keeling, CD. 1958. The concentration and isotopic abun-
Earth Syst Dyn 8(2): 235–253. DOI: https://doi. dances of atmospheric carbon dioxide in rural areas.
org/10.5194/esd-8-235-2017 Geochim Cosmochim Acta 13(4): 322–334. DOI:
Government of Alberta. 2016. Reducing methane emis- https://doi.org/10.1016/0016-7037(58)90033-4
sions. Available at: https://www.alberta.ca/climate- Lopez, M, Sherwood, OA, Dlugokencky, EJ, Kessler,
methane-emissions.aspx. Accessed 2018 Mar 10. R, Giroux, L and Worthy, DEJ. 2017. Isotopic sig-
Government of Canada. 2018. Regulations Respect- natures of anthropogenic CH4 sources in Alberta,
ing Reduction in the Release of Methane and Canada. Atmos Environ 164: 280–288. DOI: https://
Certain Volatile Organic Compounds. Canada doi.org/10.1016/J.ATMOSENV.2017.06.021
Gazette, Part II. Available at: http://gazette.gc.ca/ Miller, SM, Wofsy, SC, Michalak, AM, Kort, EA,
rp-pr/p2/2018/2018-04-26-x1/pdf/g2-152x1.pdf. Andrews, AE, Biraud, SC, Dlugokencky,
Accessed 2018 May 11. EJ, Eluszkiewicz, J, Fischer, ML, Janssens-
GreenPath Energy Ltd. 2016. GreenPath 2016 Alberta Maenhout, G, Miller, BR, Miller, JB, Montzka, SA,
Fugitive and Vented Emissions Inventory Study. Nehrkorn, T and Sweeney, C. 2013. Anthropogenic
Available at: http://www.greenpathenergy.com/wp- emissions of methane in the United States. Proc Natl
content/uploads/2017/03/GreenPath-AER-Field- Acad Sci 110(50): 20018–20022. DOI: https://doi.
Survey-Results_March8_Final_JG.pdf. org/10.1073/pnas.1314392110
Hurry, J, Risk, D, Lavoie, M, Brooks, B-G, Phillips, CL National Ocean and Atmospheric Administration.
and Göckede, M. 2016. Atmospheric monitoring 2018. Global Greenhouse Gas Reference Network,
and detection of fugitive emissions for Enhanced Trends in Atmospheric Methane. Available at:
Oil Recovery. Int J Greenh Gas Control 45: 1–8. DOI: https://www.esrl.noaa.gov/gmd/ccgg/trends_
https://doi.org/10.1016/J.IJGGC.2015.11.031 ch4/. Accessed 2018 Mar 25.You can also read