Interactions between the large-scale radio structures and the gas in a sample of optically selected type 2 quasars
←
→
Page content transcription
If your browser does not render page correctly, please read the page content below
Astronomy & Astrophysics manuscript no. AAQSO2-2021                                                                  ©ESO 2021
                                               March 12, 2021

                                                     Interactions between the large-scale radio structures
                                                  and the gas in a sample of optically selected type 2 quasars
                                                        M. Villar Martín1 , B. H. C. Emonts2 , A. Cabrera Lavers3,4 , E. Bellocchi5 , A. Alonso Herrero5
                                                                    A. Humphrey6 , B. Dall’Agnol de Oliveira7 , T. Storchi-Bergmann7,8

                                                    1
                                                      Centro de Astrobiología, CSIC-INTA, Ctra. de Torrejón a Ajalvir, km 4, 28850 Torrejón de Ardoz, Madrid, Spain
                                                    2
                                                      National Radio Astronomy Observatory, 520 Edgemont Road, Charlottesville, VA 22903, USA
                                                    3
                                                      GRANTECAN, Cuesta de San José s/n, E-38712 , Breña Baja, La Palma, Spain
                                                    4
                                                      Instituto de Astrofísica de Canarias, Vía Láctea s/n, E-38200 La Laguna, Tenerife, Spain
arXiv:2103.06805v1 [astro-ph.GA] 11 Mar 2021

                                                    5
                                                      Centro de Astrobiología, CSIC-INTA, ESAC Campus, E-28692, Villanueva de la Cañada, Madrid, Spain
                                                    6
                                                      Instituto de Astrofísica e Ciências do Espaço, Universidade do Porto, CAUP, Rua das Estrelas, PT4150-762 Porto,
                                                    Portugal
                                                    7
                                                      Departamento de Astronomia, Universidade Federal do Rio Grande do Sul, IF, CP 15051, 91501-970 Porto Alegre,
                                                    RS, Brazil
                                                    8
                                                      Harvard-Smithsonian Center for Astrophysics, 60 Garden St., Cambridge, MA 02138, USA
                                                    e-mail: villarmm@cab.inta-csic.es

                                                                                                          ABSTRACT

                                                    Context. The role of radio mode feedback in non radio-loud quasars needs to be explored in depth to determine its
                                                    true importance. Its effects can be identified based on the evidence of interactions between the radio structures and the
                                                    ambient ionised gas.
                                                    Aims. We investigate this in a sample of 13 optically selected type-2 quasars (QSO2) at z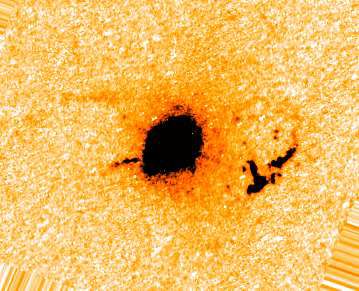
A&A proofs: manuscript no. AAQSO2-2021

rates and the fact that only ∼10-15% QSO2 are radio loud         over, even in systems where the radio emission appears to
(RL) (Lal & Ho 2010; Zakamska & Greene 2014). For this           be dominated by star formation, this does not exclude the
same reason, the role of radio mode feedback, where the          existence of jets.
bulk of the energy is ejected in kinetic form through jets           Radio mode feedback has been observed in Seyferts and
coupled to the galaxies’ gaseous environment, has been of-       RQQ for decades (e. g. Wilson & Ulvestad 1983; Whittle
ten considered irrelevant.                                       1992; Leipski et al. 2006; Mullaney et al. 2013; Husemann et
     The nature of the radio emission in radio quiet quasars     al. 2013; Tadhunter et al. 2014; Alatalo et al. 2015; Aalto
(RQQ) is still a matter of debate, whether it is dominated       et al. 2020). Radio jets have now been identified even in
by star formation in the host galaxy (Padovani et al. 2011;      galaxies which host weakly active or silent super-massive
Bonzini et al. 2013; Condon et al. 2013; Kellermann et al.       black holes (SMBH), including the Milky Way (Baldi et
2016) or by non thermal emission due to mechanisms driven        al. 2018; Issaoun et al. 2019). SMBH driven jets may thus
by the nuclear activity (e.g. Maini et al. 2016; Herrera Ruiz    exist in many galaxies, even with such low levels of nuclear
et al. 2016; Zakamska et al. 2004, 2016). The relative contri-   activity that they are considered inactive.
bution of AGN related processes appears to increase with             Different works suggest that the most kinematically ex-
radio luminosity (Kimball et al. 2011; Kellermann et al.         treme nuclear ionised outflows in AGN with low/modest
2016).                                                           radio luminosities (log(P1.4 )< ∼31.0), including QSO2, are
     Zakamska & Greene (2014) studied the radio luminos-         triggered by compact (<   ∼few kpc) radio jets (Mullaney et al.
ity of 568 objects out of the entire sample of QSO2 at           2013; Villar Martín et al. 2014; Molyneux et al. 2019). Stud-
z several kpc from the AGN, well beyond
al. 2000) selected by Reyes et al. (2008). The median red-       the nuclear region) radio induced feedback in non-radio
shift is zmed =0.397. The authors conclude that the origin of    loud QSO, including QSO2, are very scarce (Husemann et
the radio emission for those with FIRST (Faint Images of         al. 2013; Villar-Martín et al. 2017; Jarvis et al. 2019). Re-
the Radio Sky at Twenty-Centimeters) detections (∼65%)           cently, we discovered radio-induced feedback across large
is unlikely due to star formation, but to AGN related pro-       scales in the Beetle galaxy, which is a radio-quiet QSO2 at
cesses instead (see also Lal & Ho 2010).                         z=0.1 (Villar-Martín et al. 2017). Even though the radio
     The authors inferred a median monochromatic 1.4 GHz         emission in the Beetle was classified as compact based on
luminosity log(P1.4 )=log(P1.4 GHz /erg s−1 Hz−1 )=30.851 .      archival survey data, deep VLA imaging revealed an ex-
When compared with the general population of RL AGN,             tended radio structure with hot-spots stretching almost 50
this value is surprisingly high for an object class often re-    kpc. The extended radio emission was detected only at the
ferred to as predominantly radio-quiet (see also Kellermann      mJy level, and thus too faint to be detected in surveys.
et al. 2016). Best et al. (2005) identified ∼2100 RL AGN in      Still, this faint radio source interacts with the circumgalac-
the second data release of the SDSS (zmed ∼0.1). At least        tic gas far outside the galaxy. The Beetle galaxy revealed
30% have log(P1.4 ) below the QSO2 median monochro-              that radio jets of modest power can be a relevant feedback
matic luminosity. Radio AGN with log(P1.4 )<      ∼31.5 (the     mechanism acting across large scales, even in non-radio loud
range spanned by most QSO2) currently attract great inter-       QSOs.
est concerning the role of mechanical feedback in galaxies           The purpose of our current work is to investigate
since, as shown by Best et al. (2005), they greatly outnum-      whether extended, low-power radio sources, analogue to
ber their high luminosity counterparts.                          what we previously observed in the Beetle galaxy, can be
     Therefore, independently of the classification in terms     hiding in radio-quiet QSO2, and provide a source of feed-
of radio-loudness, and the fact that the radio emission of       back across large scales. We investigate this in a sample
optically selected QSO2 is low or modest relative to the         of optically selected QSO2 at z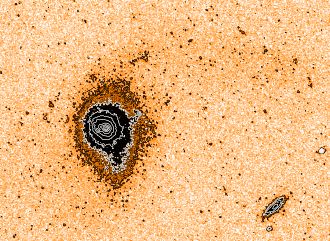
Villar-Martín et al.: Radio mode feedback in SDSS QSO2

we also included the Teacup in this sample to map the               that expected from star formation and, therefore, they have
morphology of the giant (∼110 kpc) nebula discovered by             a significant AGN contribution (Villar Martín et al. 2014).
Villar-Martín et al. (2018). The extended radio emission            This is the case for seven of the nine objects with measured
of this QSO2 has been studied in detail by Harrison et al.          q, while the radio emission is consistent with star formation
(2015) and Jarvis et al. (2019).                                    in two (J1108+06 and J1316+44). Notice that this does not
                                                                    discard the existence of AGN driven radio structures. As an
                                                                    example, the Beetle QSO2 has q=1.89±0.10 and it is asso-
2.1. Optical properties                                             ciated with a ∼4 kpc jet and a large scale (∼46 kpc) radio
Our main interest is to investigate radio induced feedback          source (Villar-Martín et al. 2017).
across galactic and extragalactic scales. For this mechanism
to operate and be detectable, the radio source must interact
with widely spread gas. For this reason, the z    00
2.2.1. Radio-loudness
                                                                                                                 FIRST
                                                                                                                Sint
The objects were selected to have FIRST and NRAO VLA                (2008), who calculated log(θ2 ), with θ=     FIRST ,
                                                                                                                Speak
                                                                                                                           and ∆t =
Sky Survey (NVSS) 1.4 GHz detections and, in some cases,                        FIRST
                                                                               Sint
to show solid or tentative evidence for extended AGN driven         −2.5 × log S NVSS . θ gives a dimensionless source concentra-
radio sources (see below). The range of monochromatic ra-           tion on ∼5 scale. Sources with log(θ2 )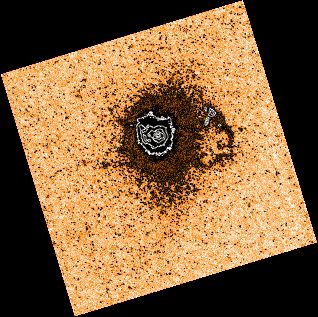
A&A proofs: manuscript no. AAQSO2-2021

                                33.0                                                                      Hα Tunable filter (TF) images were obtained with the
                                                                                                       OSIRIS instrument2 mounted on the 10.4m GTC. This is
                                                                            o   l oud
                                32.5                                R adi                              an optical imager and spectrograph that offers broad band
                                                                                                       photometry, tunable filter imaging and both multi-object
                                32.0                                                                   and long slit spectroscopy. OSIRIS consists of a mosaic of
 log (P 5GHz / erg s-1 Hz-1 )

                                                                                         ediate
                                                                                   interm              two 2048 × 4096 Marconi CCD42-82 (with a 9.4” gap be-
                                                                       Radio
                                31.5                                                                   tween them) and covers the wavelength range from 0.365 to
                                                                                                       1.05 µm with a field of view of 7.80 × 7.80 and a pixel size of
                                31.0                                                                   0.12700 . However, the OSIRIS standard observation modes
                                                                                                       use 2×2 binning, hence the effective pixel size during our
                                30.5                                                        quiet      observations was 0.25400 .
                                                                                    Radio                 When using OSIRIS TF imaging mode the wavelength
                                30.0                                                                   observed changes relative to the optical centre following the
                                                                                                       formula given by:
                                29.5

                                29.0                                                                   λ = λ0 − 5.04 ∗ r2                                         (2)
                                                                                                           where r is the distance in arcmin to the optical centre.
                                28.5
                                                                                                           For this reason, for each QSO2 a filter FWHM of 20
                                       41.5   42.0          42.5            43.0                43.5   Å was used at the QSO2s z centred on the redshifted Hα
                                                     log (L[OIII] / erg s-1 )
                                                                                                       and taking into account the dependence of the wavelength
                                                                                                       observed with the red TF with distance relative to the op-
   Resolved (≥10 kpc)                          Resolved (~3-9 kpc) Unresolved
                                                                                                       tical centre described above. Also, to sample the contin-
      J0841+01                                   J0948+25              J0802+25                        uum near the Hα+[NII] complex in each QSO we took one
      J0853+38                                   J1108+06              J1316+44                        continuum image using an appropriate OSIRIS Red Order
      J0907+46                                   J1437+30
                                                                                                       Sorter (OS) filters. These are medium-band filters (17 nm
      J0945+17                                   J1517+33          Jarvis et al. (2019)
                                                                                                       wide) initially used to isolate different interference orders
      J1000+12                                                     Reyes et al. (2008)
                                                                                                       within the TF, but that can also be used alone to produced
      J1356+10
                                                                                                       direct imaging if needed. Both in direct TF and continuum
      The Teacup
                                                                                                       (OS) imaging a 3-dither pattern was used by moving the
                                                                                                       telescope ±1500 in RA and Dec to correct for ghost images
Fig. 1. Location of the object sample (large symbols) in the
[OIII]λ5007 vs. monochromatic 5.0 GHz luminosity plane (Xu
                                                                                                       and cosmic rays. Total exposure times and corresponding
et al. 1999). Triangles are used for radio sources with total sizes                                    order filters used are described in Table 3, where the details
dR                                               R                                                     on the observations are summarised. The seeing size during
 max ≥10 kpc (see Table 5), squares for 3≤ dmax ≤9 kpc and
circles for spatially unresolved or marginally resolved objects.                                       the observations was in the range ∼0.9-1.400 depending on
The vertical small bar shows the expected uncertainty of the                                           the object.
radio luminosities due to the unknown spectral index α. Jarvis et                                          A detailed description on the TF reduction process can
al. (2019) objects not included in our sample are also shown for                                       be found in Villar-Martín et al. (2017). Briefly, the TF and
comparison. The small pink circles are QSO2 at z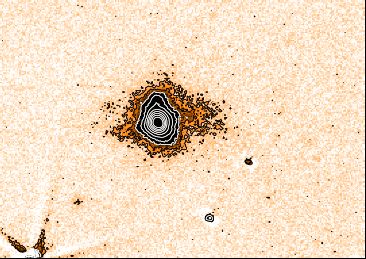
Villar-Martín et al.: Radio mode feedback in SDSS QSO2

Table 1. The sample. General properties. (6) L[OIII] is the [OIII]λ5007 luminosity; (7) P1.4 GHz is the monochromatic luminosity
at 1.4 GHz inferred from the NVSS flux; (8) q is a quantitative measure of the FIR/radio flux-density ratio; q ≤1.8, suggests that
the the radio flux has a significant AGN contribution (see text); (9) shows the classification of the object in radio quiet (RQ) or
radio intermediate (RI) (there are no radio loud objects) based on Fig. 1. The ambiguous classification of several targets (RQ/I)
reflects the vague division between classes. ‘-’ is shown when the information is not available.

           Source          RA             Dec         z      Scale       log(L[OIII] )   log(P1.4 GHz )       q            RQ/I/L
                                                             kpc/00        erg s−1       erg s−1 Hz−1
           (1)              (2)            (3)        (4)     (5)            (6)               (7)            (8)           (9)
           J0802+25     08:02:52.93    +25:52:55.6   0.080   1.491          42.44             30.67       1.39±0.06         RQ
           J0841+01     08:41:35.09    +01:01:56.3   0.110   1.982          42.45             30.32            -            RQ
           J0853+38     08:53:19.48    +38:52:39.0   0.127   2.246          42.08             31.24            -            RI
           J0907+46     09:07:22.36    +46:20:18.1   0.167   2.827          42.18             31.55            -            RI
           J0945+17     09:45:21.34    +17:37:53.3   0.128   2.261          42.63             31.28       1.35±0.10        RQ/I
           J0948+25     09:48:25.24    +25:06:58.0   0.179   2.991          42.36             30.42            -            RQ
           J1000+12     10:00:13.14    +12:42:26.2   0.148   2.556          42.68             31.30       1.08±0.09        RQ/I
           J1108+06     11:08:51.03    +06:59:00.5   0.182   3.031          42.39             31.01       1.97±0.07         RQ
           J1316+44     13:16:39.75    +44:52:35.1   0.091   1.675          42.23             30.08       2.35±0.04         RQ
           J1356+10     13:56:46.11    +10:26:09.1   0.123   2.185          42.79             31.39       1.23±0.04        RQ/I
           Teacup       14:30:29.88    +13:39:12.0   0.085   1.576          42.66             30.67       1.18±0.11         RQ
           J1437+30     14:37:37.85    +30:11:01.1   0.092   1.692          42.40             31.15       0.43±0.02        RQ/I
           J1517+33     15:17:09.21    +33:53:24.7   0.135   2.366          42.49             31.76       0.36±0.18         RI

Table 2. Classification of the QSO2 VLA sample according to the possible existence of extended (500 ) radio emission based on
Kimball & Ivezić (2008). (1) Source name; (2) FIRST peak flux density. The quoted error is the RMS is the noise in the FIRST
map (mJy/beam); (3) FIRST integrated flux density for the source;
                                                              r (4) NVSS integrated flux density with the mean error. N/A
                                                                          FIRST
                                                                         Sint
means that there is no NVSS flux available; (5) log(θ2 ), with θ=         FIRST
                                                                         Speak
                                                                                  . Sources with log(θ2 )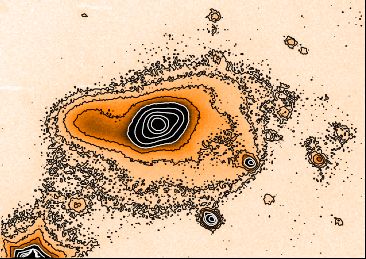
A&A proofs: manuscript no. AAQSO2-2021

Table 3. Log of GTC observations. λTF is the wavelength used to tune the TF, taking into account the shift to the blue of the
central wavelength seen by the TF as the distance to the optical centre increases (see Sect. 3.1). The superscripts TF and cont refer
to the narrow band (TF) and continuum images respectively. The seeing sizes correspond to the FWHM.

            Source             Date      λTF     Filtercont        ∆λ          tTF
                                                                                exp         tcont
                                                                                             exp     SeeingTF     Seeingcont
                                                                                                        00            00
                                          Å                         Å          sec           sec
            J0802+25     17/Feb/2020     7102       f680/43     6098-6498     3×900        3×200     1.40±0.10    1.42±0.15
            J0841+01     16/Feb/2020     7296       f694/44     6057-6454     3×900        3×200     0.94±0.02    1.02±0.02
            J0853+38     16/Feb/2020     7408       f754/50     6090-6489     3×900        3×200     1.20±0.04    0.97±0.03
            J0907+46     16/Feb/2020     7665       f738/46     6126-6521     3×900        3×200     0.99±0.09    0.89±0.08
            J1000+12     16/Feb/2010     7543       f709/45     5979-6370     3×900        3×200     1.07±0.02    1.09±0.03
            J1316+44     17/Feb/2020     7168       f680/43     6037-6433     3×900        3×200     1.15±0.15    1.24±0.16
            J1356+10     23/Jun/2019     7379       f694/44     5987-6379     3×900        3×200     0.90±0.04    0.87±0.03
            Teacup       16/Feb/2010     7128       f666/36     5947-6345     7×900        3×120     1.16±0.06    1.33±0.05
            J1437+30     16/Feb/2010     7175       f680/43     6031-6427     3×900        3×200     0.95±0.04    1.07±0.05

Table 4. VLA information about the A and B-configuration observations.
                                                                                                          GHz †         GHz ‡
          Source       tA
                        exp    tB
                                exp         BeamA                 BeamB           SA
                                                                                   total    SB
                                                                                             total   S1.4
                                                                                                      core         S1.4
                                                                                                                    extended
                       min     min       arcsec2      PA       arcsec2      PA    mJy       mJy      mJy bm−1         mJy
          J0802+25      31      88     1.21×1.10      -84     5.52×4.60     -80     28       29          28             −∗
          J0841+01      40      68     1.35×1.18      -16     5.27×4.13     -15    4.5       6.3       0.5∗∗            5.8
          J0853+38      36      72     1.29×1.10      -82     4.72×4.47     64      33        68         17             51
          J0907+46      36      89     1.23×1.04      -84     4.63×4.35     67      44        45         18             27
          J0945+17      30      60     1.21×1.11      -58     6.16×4.19     58      44        43         26             17
          J0948+25      15      45     1.26×1.13      -72     6.03×4.34     65     1.8       2.0         1.1            0.9
          J1000+12      30      77     1.23×1.13      -43     6.19×4.34     54      32        34         19             15
          J1108+06      28      42     1.22×1.03      -22     6.40×4.23     -48    8.1       8.1         3.8            4.3
          J1316+44      27      64     1.25×0.97      78      4.57×4.32     -76    3.3       3.8         2.8        (1.0)∗∗∗
          J1356+10      28     170     1.31×1.24      69      5.21×4.44     44      58        59         52             7§
          J1437+30      30      60    0.78×0.72§§     -81     4.97×4.50     67      55        58         40          (18)§§§
          J1517+33      30      60     1.26×1.08      -71     4.91×4.30     84     116       115         69             46
†
   Peak flux density at the location of the core in the A-configuration data.
‡
   Total intensity of the source in B-configuration, excluding the peak flux density in A-configuration.
∗
   Unresolved, with A- and B-configuration intensity consistent within the 10% uncertainty of the flux calibration.
∗∗
    Assumed to be the weakest, most Eastern of the three central blobs in Fig. A.1.
∗∗∗
     Very uncertain, only marginally resolved in A-configuration.
§
   Of which 6 mJy reflects the extension found in the A-configuration data, and 1.0 mJy is the integrated flux density of the
emission found on large scales in the B-configuration data.
§§
    A-configuration data imaged with super-uniform weighting.
§§§
    Only marginally resolved with super-uniform weighting.
All positions angles (PA) in the paper are quoted North to East.

subsequently imaged in CASA using the task tclean (Mc-               refer the reader to the Appendix A for detailed descriptions
Mullin et al. 2007; CASA Team et al. in prep).                       and results of the individual QSO2. The information on the
    For imaging, we used a natural weighting for the B-              sizes and nature of the radio structures and the large scale
configuration data and Briggs weighting with robustness              ionised gas for all objects are summarised in Tables 5 and
parameter 0.5 for the A-configuration data (Briggs 1995).            6 and Figs. 9 and 10.
For the field of J1437+30, we also produced a map with
super-uniform weighting in order to resolve bright radio
structures on the smallest scales. To mitigate the effects           4.1. Size, morphology and origin of the radio structures
from sidelobes of strong radio sources in the field, we im-          The contribution of an AGN component to the total ra-
aged the full primary beam before doing the primary beam             dio luminosity is confirmed in 11/13 QSO2, all except
correction. However, because our target sources were lo-             J0948+25 and J1316+44. For these two objects, the avail-
cated at the pointing centre, we did not need to use the             able information does not allow to discern the origin (AGN
wide-field imaging techniques to recover their structure and         and/or SF).
flux density.
                                                                         Out of these 11 QSO2, the AGN radio component is
    Upper limits on the sizes of unresolved sources are given
                                                                     spatially unresolved in J0802+25 and J1108+06 (see Ap-
by the beam sizes in Table 4.
                                                                     pendix A). The remaining 9 show extended AGN related
                                                                     radio structures with sizes that range between dmax ∼few
4. Results                                                           kpc at the spatial resolution of our data and up to almost
                                                                     500 kpc (Table 5, Fig. 9). The relative contribution of these
We will present in this section the general properties of the        extended radio structures to the total radio luminosity at
radio and ionised gas in our sample. We also present in Figs.        1.4 GHz is in most cases in the range 30% to 90% (Table
2 to 8, the overlays between the radio and Hα maps. We               4).
Article number, page 6 of 32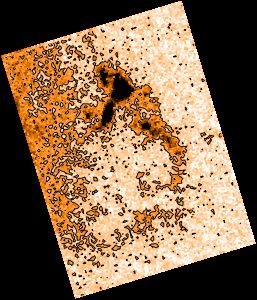
Villar-Martín et al.: Radio mode feedback in SDSS QSO2

Table 5. General properties of the radio structures. (2) dR  max : radio source size in kpc. Upper limits are provided for spatially
unresolved or marginally resolved (J1316+44) sources; (3) Are there radio structures related to the nuclear activity, at least
partially?; (4) morphological classification of prominent radio features; (5) Is there evidence for jet/gas interactions?; (6) Relevant
references: R10: Rosario et al. (2010); V14: Villar Martín et al. (2014); H15: Harrison et al. (2015); B16: Bondi et al. (2016); R17:
Ramos Almeida et al. (2017); J19: Jarvis et al. (2019). The Teacup is shown separately because it was not part of our VLA sample.
The radio information comes from H15 and J19. ∗ According to Bondi et al. (2016) the extended radio emission in J1108+06 is
due to star formation and the radio core is associated with one of the two AGN.

  Source       dR
                max     Related to AGN?                                     Nature of                                  JGI?          Ref.
                kpc                                                      radio features
  (1)           (2)             (3)                                            (4)                                     (5)
  J0802+25      60 kpc              Yes
                                                          SF in spiral arms; distant patches
           J0907+46      68      46               Nebula (∼13 kpc) tracing the inner radio source              No?
                                                                    tidal tail, TDGC
           J0945+17      25      15                 Giant bubble candidate (∼10 kpc), filaments                No?            S18
           J1000+12     112      90      Blob, jet-like feature (∼9kpc), giant bubble candidate (∼10 kpc)      No             J19
                                             extension tracing the NW radio source, tidal tail, TDGC
           J1316+44      92      53                          Tidal bridge, distant patches                     Yes
                                                           widely spread SF in host galaxy
           J1356+10     119      92                     Giant bubbles and shells (∼12-30 kpc)                  Yes       G12,J19
                                         large asymmetric nebula (∼70 kpc), tidal brige/filament, TDGC
           Teacup       132      90         Giant bubble (∼10 kpc), giant (∼115 kpc×87 kpc) nebula             Yes      K12,VM18
                                        arc (edge brightened cavity?), filament (∼30 kpc), distant patches
           J1437+30      22      12        SF knot, low surface brightness asymmetric ∼12 kpc nebula           Yes            F18

    Structures reminiscent of, or confirmed to be jets are              curately image this emission. The structure of the extended
identified in all but J1437+33 (see also Jarvis et al. 2019).           radio source in J1437+33 (dmax ∼2.5 kpc) is unknown, but,
The jet sizes are in the range 1-few kpc (J0945+17,                     as we argue in Appendix A, it is most likely related to the
J1000+12, J1356+10, the Teacup), ∼10 kpc (J1517+33),                    nuclear activity.
several tens of kpc (J0841+01, J0853+38, J0907+46).
Additional extended AGN related radio structures (e.g.
lobes or radio bubbles, plumes, hot spots) are detected
in J0853+38 (472 kpc), J0841+01 (40 kpc), J1000+12 (43
kpc), J1356+10 (160 kpc), the Teacup (19 kpc). The radio
component at ∼11 kpc from the AGN in J0945+17 may be                        Therefore, this sample shows a high fraction of AGN
a jet or a lobe. The lobe emission from the 160 kpc radio               related radio sources that extend for at least typical effec-
source in J1356+10 is extremely faint, and additional ob-               tive radii of the spheroidal component of galaxies (Urbano-
servations are necessary to unambiguously confirm and ac-               Mayorgas et al. 2019) and often much more.
                                                                                                              Article number, page 7 of 32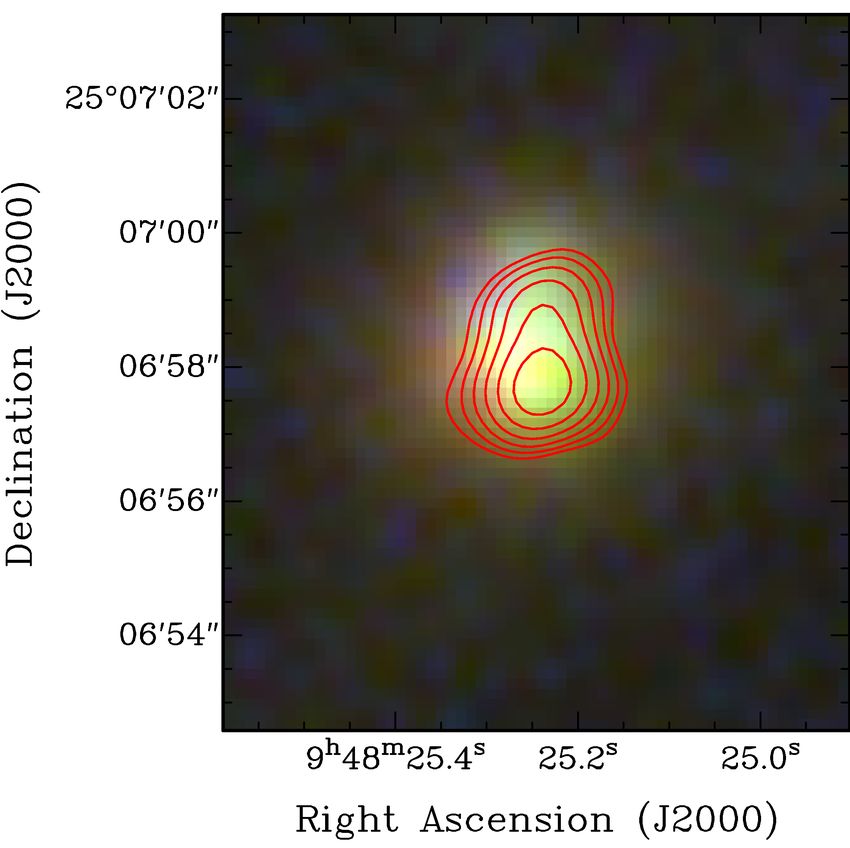
A&A proofs: manuscript no. AAQSO2-2021

                 J0841+01

                                                   GTC                                                                                   PA1rad
                                                                                                                       LR:B
                                                                                                                                          PA1opt

                                                                                                                                cloud

            PA1rad=PA1opt
                                                                                                                                bubble

                                                                                                            LR:A
                                                            PA2rad
                                                                                     5 kpc
      HST
                                                           PA2opt
                                            10 kpc

                                                                     Fig. 5. HST/WFC FR551N (containing [OIII]) image of
       5 kpc                                                         J0945+17, with overlaid contours of the VLA A (red) and B-
                                                                     configuration (grey) data. Contour levels start at 0.45 (0.5)
Fig. 2. GTC Hα image of J0841+01 on a log scale, with overlaid       mJy bm−1 for the A (B) configuration data, and increase by
contours of the VLA A-configuration (red) and B-configuration        factor 2. LR:A and LR:B are the radio components identified by
(grey) data. Contour levels are the same as in Fig. A.1. The         Jarvis et al. (2019). Radio and Hα axes as in Fig. 2.
inset shows the contours of the VLA A-configuration data over-                                               PA1rad=PA1opt
                                                                                                                              PA3optPA3rad
laid onto the smoothed HST [OIII]λ5007 continuum subtracted                                   J1000+12
image from Storchi-Bergmann et al. (2018). In these and other
radio-Hα overlays the directions of the axes used to measure                                      GTC
the degree of alignment between the radio (solid lines) and the
ionised gas (dashed lines) structures are indicated. The same
colour is used for axes on the same side of the AGN (see Sect.
4.3).
                 J0853+38

                                                                                                              PA2rad
                                                                                HST
                                                                                                                              10 kpc
                                                                                    LR:B             LR:D
                                                                                                            PA2opt
                                                                                   LR:A

                                                     20 kpc
                                                                                           LR:C
                                                                                                  10 kpc

                                                                     Fig. 6. GTC Hα image of J1000+12, with overlaid contours
                                                                     of the VLA A (red) and B-configuration (grey) data. Contour
Fig. 3. GTC Hα image of J0853+38, with overlaid contours of          levels are the same as in Fig. A.12. The inset shows the con-
the VLA A-configuration (red) and B-configuration (grey) data.       tours of the VLA A-configuration data overlaid onto the HST
Contour levels are the same as in Fig. A.3, and features indicated   WFC3/FQ508N narrow-band filter that contains [OIII] emis-
as image artefacts in the B-configuration data of Fig. A.3 have      sion. The dashed black rectangle marks the approximate loca-
been omitted.                                                        tion of the giant [OIII] bubble proposed by Jarvis et al. (2019).
                                                                     The narrow extension of radio emission at this location, which
               J0907+46                                              we coloured light-red in the small panel, is most likely dominated
                                                                     by artefacts of the snap-shot imaging. LR:A to LR:D indicate
                                PA1rad=PA1opt
                                                                     the main radio components with the same nomenclature as in
                                                                     Jarvis et al. (2019). Radio and Hα axes as in Fig. 2.

                                                                     4.2. Size, line luminosity and nature of the large scale ionised
                                                                          gas
                  15 kpc                                  PA3rad
                                                PA1rad=PA1opt        We have found that QSO2 undergoing interaction/merger
                                                                     events appear to be invariably associated with ionised gas
                                                                     spread over large spatial scales, often well outside the main
                                                                     body of the galaxies, with maximum distances from the
Fig. 4. GTC Hα image of J0907+46, with overlaid contours             AGN in the range rmax ∼12-92 kpc, with a median value
of the VLA A-configuration (red) and B-configuration (grey)          of 46 kpc. The most spectacular case is the Teacup, which
data. Contour levels start at 0.08 (0.2) mJy bm−1 for the A (B)      is associated with a ∼115×87 kpc nebula (Fig. A.16). The
configuration data, and increase by factor 2. Radio and Hα axes      Hα luminosities of the extended structures are in the range
as in Fig. 2.                                                        Lext                40
                                                                                            erg s−1 (median 3.5×1041 erg s−1 )
                                                                       Hα =(2.5-235)×10

Article number, page 8 of 32
Villar-Martín et al.: Radio mode feedback in SDSS QSO2
J1356+10 Table 7. Luminosities of the extended Hα structures
Object Lext
Hα
×10 erg s−1
40
J0802+25 8.1±0.5
J0841+01 43.5±4.2
J0853+38 28.4±1.3
20 kpc J0907+46 17.4±0.9
J0945+26 207±49
J1000+12 203±4
J1316+44 17.8±3.6
J1356+10 235±9
Teacup 139±9†
J1437+30 2.5±0.3
†
This value includes also the contribution of the ionised
bubbles. The nebula alone has LHα ∼(4.1±0.3)×1041 erg s−1 .
13
12
11
10
9
5 kpc 8 7
7 J0841 (40)
PA1rad
6 J0853 (472)
5 J0907 (76)
PA1opt 4 J0945 (11)
3 J1000 (43) 2 2
Fig. 7. J1356+10. GTC Hα image of J1356+10, with overlaid
contours of the VLA A-configuration in red, and the extended 2 J1356 (160) J1437 (2.5) J0802 (
<
nr
U
J1437+30
Fig. 9. Classification of the 11 QSO2 in our 13 QSO2 sam-
ple with confirmed AGN related radio emission according to
the maximum size of the AGN component (in brackets). This
coincides with dR
max (Table 5) except for J1108+06. It is high-
PA1rad
lighted with * because, although the radio source is extended
for dR
max ∼9 kpc, the AGN component is a compact core (Bondi
et al. 2016).
PA1opt
2 kpc
same range as our QSO2 sample. These have Lext Hα =(15-
389)×1040 erg s−1 (median 1.0×1042 erg s−1 ). Although
this comparison sample is small, the Hα luminosities of the
extended nebulae appear to be higher in the radio-loud sam-
Fig. 8. J1437+30. HST/ACS image taken with the FR551N fil- ple.
ter (covering [OIII]λ5007) with overlaid contours of the VLA A- All QSO2 in our sample except J0907+46 show unam-
configuration data with super-uniform weighting from Fig. A.21. biguous evidence for mergers/interactions based on the dis-
The HST image is contaminated by continuum, but the high SB torted optical continuum morphologies and the presence of
features trace the ionised gas morphology accurately (Fischer et prominent tidal continuum features. The Hα image con-
al. 2018). Radio and Hα axes as in Fig. 2.
firms this is also the case for J0907+46 (Fig. A.7). Many of
the large scale (>∼10 kpc) ionised features identified in our
(Table 7)3 . We show in Fig. 10 the classification of the most sample are remnants of the interaction/process. In some
interesting extended ionised features and the objects where cases, they trace entire or partial tidal tails, bridges or
they have been identified. For comparison, Balmaverde et shells (e.g. J0841+01, J0907+46, J1000+12, J1316+44 and
al. (2021) measured Lext J1356+10; see also Villar-Martín et al. 2010, 2017). The ex-
Hα for a sample of 37 3C low z ra-
dio galaxies. Six have nuclear [OIII] luminosities in the tended ionised gas frequently overlaps partially with wide
large and amorphous scale continuum halos clearly associ-
3
Some contamination by [NII]λλ6548,6583 is expected, al- ated with a merging or interaction event (e.g. J0802+25,
thoughA&A proofs: manuscript no. AAQSO2-2021
Classification of main extended ionized features
13
12
11 10
10 J0802
9 J0841
8 J0853
7 J0907
6 J0945 5 5 5
5 J1000 J0841 J0802 J0841
4 J1356 J0945 J0853 J0907 3 3
3 J1437 J1000 J1000 J1000 J0853 J0853
2 Teacup J1356 J1356 J1316 J1316 J1316
1 J1517 Teacup Teacup J1356 Teacup J1437
c) e
es
n
s
G /
kp ula
D s
io
le
ct s
ns
/T ge
ch
ra a
at
bb
35 eb
te t/g
io
at
ils rid
rm
bu
in Je
(> t n
tp
ta l b
fo
nt
n
n
da
ar
ia
ta
ia
St
G
is
Ti
G
D
Fig. 10. The most interesting extended ionised features identified in the 13 QSO2 of our sample are classified in this histogram.
"Giant nebulae" are large continuous reservoirs of gas with sizes >35 kpc not identified with bubbles, tidal features (bridges or
tails), with star formation (e.g. spiral arms) or with detached features (e.g. distant patches). "Jet-gas interactions" refer to emission
line features that are closely correlated with the radio morphology. This correlation indicates an interaction between the gas and
the radio source. "Star formation" encompasses detached compact knots and SF in spiral arms. "Distant patches" refer to detached
patches of ionised gas located at large distances from the AGN (tens of kpc).
Five QSO2 in our sample present firm or tentative evi- Degree of alignment between the radio and ionized gas axes
dence for giant bubbles of ionised gas: J0841+01, J0945+17, 15
J1000+06, J1356+10 and the Teacup. The sizes ∼10±2 14
kpc are similar in all of them. The Teacup (Keel et al. 13
2012), with clear morphological evidence, and J1356+10 12
11
and J1000+12, based on kinematic evidence, have been dis- 11
cussed by other authors (Greene et al. 2012; Jarvis et al. 10
2019). 9
J0841 (1)
8
We have proposed that J0841+01 and J0945+17 are also 7
J0907 (2)
associated with giant ionised bubbles. We have identified a J0945 (1)
6 J1000 (3)
∼10 kpc edge-brightened bubble on the W side of J0945+17 5 Teacup (1)
and, possibly, a counter-bubble to the E (Appendix A, Fig. 4 J1437 (1)
A.10). The radio source is currently impacting on the west- 3 J1517(2) 2 2
ern bubble and is enhancing the optical line emission at 2 J0841 (1) Teacup (1)
the location of the “cloud” identified by Storchi-Bergmann 1 J1356 (1) J1517 (1)
et al. (2018). A past radio activity episode or a wide an- < 10° 10°-20° 20°-30°
gle wind could have inflated the bubble(s). J0841+01 is a
dubious case. A striking set of ionised filaments is located Fig. 11. Relative angles ∆PA=|PArad -PAopt | between the radio
between the two merging galaxies (Storchi-Bergmann et al. and ionised gas axes measured in the eight QSO2 indicated in
2018, Appendix A, Fig. A.2). Based on the morphology and this plot (see text). They have been grouped in three bins ac-
filamentary appearance, we have proposed that this is a gi- cording to ∆PA < 10◦ , 10◦ ≤ ∆PA < 20◦ and 20 ≤ ∆PA < 30◦ .
ant (∼8 kpc) ionised edge brightened bubble. The apparent For each object, the number of radio-Hα angles in that specific
spatial overlap and similar size as the radio source (Fig. 2) bin is shown in brackets. The radio and gas axes are in general
suggests that it has been inflated by it. A wide angle wind very closely aligned. For seven objects (first bin), the axes are
cannot be discarded. Spectroscopy would be very useful to identical or almost identical (∆PA < 10◦ ) at least on one side
confirm or discard the nature of these bubble candidates. of the AGN.
A scenario in which a radio jet (∼few kpc) has inflated
the bubbles has been also proposed for the Teacup (but see ity that this feature is an ionised gas shell, remnant of the
also Zakamska & Greene 2014), J1000+06 and the southern galactic interactions, cannot be discarded.
bubble of J1356+10 (Jarvis et al. 2019).
Tidal dwarf galaxy (TDG) candidates have been identi-
In addition to the ionised bubble candidates already re- fied as continuum and emission line compact objects at the
ported in J1356+44 (Greene et al. 2012; Jarvis et al. 2019), tip of tidal tails in J0907+46, J1000+12, J0841+01 and
we have found morphological tentative evidence for one J1356+10. The formation of these recycled objects in the
more giant (∼20 kpc) Hα bubble in this system (see Ap- debris of merging/interacting systems has been observed
pendix A). It may be part of the giant (∼40 kpc) expanding frequently and is predicted by simulations of colliding galax-
structure discussed by Greene et al. (2012). The possibil- ies (e.g. Bournaud et al. 2004; Lelli et al. 2015).
Article number, page 10 of 32Villar-Martín et al.: Radio mode feedback in SDSS QSO2
Table 8. Degree of alignment ∆PA=|PArad -PAopt | between the approximate location of the AGN) and run across such fea-
Hα and radio axes. Positive and negative PA values are mea- tures. The optical axes of objects with wide area, diffuse
sured N to E and N to W respectively.
ionised gaseous structures (e.g. giant bubbles, amorphous
Axis 1 halos, cones) were defined as the axes that start at the AGN
Source PA1rad PA1opt ∆PA1 location and bisect these regions. One axis only is identified
(◦ ) (◦ ) (◦ ) if gas is detected on just one side of the optical nucleus.
J0841+01 77 77 0 To define the radio axes we followed a similar method.
J0907+46 29 29 0 Axes were identified at one or both sides of the radio core,
J0945+17 -67 -75 8 depending on the one or two sided radio morphology. All
J1000+12 10 10 0 axes start at the core and extend up to bright compact
J1356+10 -157 -172 15 radio features (e.g. hot spots) or along structures clearly
The Tecup 65 65 0 elongated in a preferential direction. In the most complex
J1437+30 -98 -104 5 cases, the radio source shows a preferential direction closer
J1517+33 117 109 8 to the AGN and bends sharply further out (e.g. J0907+46
(Fig. 4) and J1000+12 (Fig. 6)). This means that more than
Axis 2 one radio axis can be identified at one side of the radio core.
Source PA2rad PA2opt ∆PA2 The different radio and Hα axes are shown in Figs. 2 to
J0841+01 -105 -118 13 8 and their PA are in Table 8. The relative angles |PArad -
J0907+46 -151 -151 0 PAopt | at each side of the AGN are also shown in this table.
J1000+12 150 157 7 We have found that the radio and Hα axes are very
The Tecup -99 -126 27 closely aligned at both sides of the AGN in all objects (Ta-
J1517+33 -77 -70 7 ble 8 and Fig. 11). Out of the 15 relative radio/optical
angles measured, 11 form an angle |PArad -PAopt | < 10◦ .
◦ ◦
Axis 3 In the remaining 4 cases, 13 ≤ |PArad -PAopt | ≤30 , which
Source PA3rad PA3opt ∆PA3 also imply close alignments.
J0907+46⊗ -74 N/A N/A Such close alignments show that the Hα morphologies
J1000+12 -31 -26 5 atA&A proofs: manuscript no. AAQSO2-2021
also reported in J0802+25, whose radio source is unresolved ies to QSO2 samples of lower radio luminosities (Keller-
in our maps. Such evidence was based on the extreme kine- mann et al. 2016). We also selected objects with a rich and
matics and relatively strong line emission of the nuclear wide spread CGM which may increase the probability of de-
ionised outflow (Villar Martín et al. 2014). tecting large scale radio sources since the interaction with
Evidence for radio-gas interactions in J0948+25, the ambient gas can enhance the radio emission, although,
J1108+06 and J1316+44 cannot be confirmed or discarded. given the high incidence of merger/interaction signatures in
QSO2 (70-75%; Bessiere et al. 2012; Urbano-Mayorgas et
al. 2019) this criterion may not introduce a very restrictive
5. Discussion bias.
5.1. Origin, properties and frequency of the radio sources
5.2. Jet gas interactions
As explained in Sect. 1 the frequency of jets and related
structures (e.g. hot spots, lobes) in QSO2 and, more gen- There is evidence for radio-gas interactions in 10 of the 13
erally, non radio loud quasars (RQ and RI) is unknown. zVillar-Martín et al.: Radio mode feedback in SDSS QSO2
J1356+10, J1000+06 and the Teacup (see also Lansbury (Heckman et al. 2004). Subsequent studies of SDSS QSO2
et al. 2018). Based on the morphological correlation with confirm this dependence and suggest that there is a maxi-
the radio emission, this may also the case in J0841+01 and mal radial size of the NLR of RNLR ∼6-8 kpc beyond which
J0945+17 although this cannot be confirmed with the avail- the relation flattens (Hainline et al. 2014). The authors es-
able data (Appendix A). timate this size using a cosmology-independent measure-
ment, which is the radius where the SB corrected for cos-
mological dimming falls to SBmax =10−15 erg s−1 cm−2
5.3. Origin of the large scale ionised gas arcsec−2 . They propose that beyond this distance there is
We have found that QSO2 in interaction/merger systems either not enough gas or the gas is over-ionised and does not
are in general associated with ionised gas spread over tens produce detectable [O III]λ5007 emission. Other works sug-
of kpc well outside the main body of the galaxies (Sect. 4.2). gest instead a smooth continuation of the size-luminosity
A high fraction of these large scale ionised features are a relation out to large radii or a much larger break radius as
consequence of such interaction processes, since they are previously proposed (e.g. Fischer et al. 2018; Husemann et
morphologically related to tidal remnants. Given the high al. 2019).
incidence of merger/interaction signatures in QSO2 (∼70- Different works, including our current study demon-
75%; Bessiere et al. 2012; Humphrey et al. 2015; Urbano- strate that much larger (tens of kpc) reservoirs of ionised
Mayorgas et al. 2019), this kind of features are expected to gas are frequently associated with AGN in the quasar
be very frequent in QSO2 in general. regime. This includes radio loud and radio quiet, type 1
and type 2 quasars and strong line powerful radiogalaxies
These results are consistent with Stockton & MacK-
(Sect. 5.3; see also Villar-Martín et al. 2018). These fea-
enty (1987), who found a correspondence between the inci-
tures often have very low SB ∼few×10−17 erg s−1 cm−2
dence of strong extended ionised nebulae among QSO1 and
arcsec−2 . At the median redshift of the sample studied by
the presence of overt signs of strong galactic interactions,
Hainline et al. (2014) (z =0.56), such features would have
such as close companion galaxies and continuum tails or
SB∼10−17 erg s−1 cm−2 arcsec−2 taking into account cos-
bridges. This is also the case of powerful strong line radio
mological dimming, which is
SBmax .
galaxies. Recent results based on wide field integral field
The high SB gas within RNLR most likely traces gas
spectroscopy of 3C radio galaxies at zA&A proofs: manuscript no. AAQSO2-2021
with the well known radio-quiet J1356+10 QSO2. In most quasars, to constrain their sizes and morphologies and eval-
cases, the radio source extends beyond the typical size of uate their impact on the surrounding environment. Ulti-
the spheroidal component of the galaxy and often well into mately, this will provide a deeper knowledge on the role of
the circumgalactic medium. radio mode feedback in quasars in general.
• QSO2 undergoing galaxy interaction/merger events
appear to be invariably associated with ionised gas spread
over large spatial scales, often well outside the main body of Acknowledgments
the galaxies. Given the high incidence of merger/interaction Based on observations made with the Gran Telescopio Ca-
signatures in QSO2, this is expected to be frequent in QSO2 narias (GTC), installed in the Spanish Observatorio del
in general. The maximum distances from the AGN are in Roque de los Muchachos of the Instituto de Astrofísica de
the range rmax ∼12-90 kpc, with a median value of 46 kpc. Canarias, in the island of La Palma. Based also on data ob-
The line luminosities are in the range LHα = (2.5 − 235) × tained with the Karl G. Jansky Very Large Array (VLA).
1040 erg s−1 . The nature is diverse including giant ionised The National Radio Astronomy Observatory is a facility
bubbles, tidal features, giant (>
∼35 kpc) nebulae, tidal dwarf of the National Science Foundation operated under coop-
galaxy candidates and distant patches at tens of kpc from erative agreement by Associated Universities, Inc. We have
the AGN. also used Hubble Space Telescope archive data. We thank
• The axis of the ionised gas at ∼several kpc), they are fre- SDSS Web Site is http://www.sdss.org/; 3) the Cosmol-
quently deflected. Therefore, the effects of the interactions ogy calculator by Wright (2006); 4) the NASA/IPAC Ex-
are sometimes also obvious in the radio sources. The obsta- tragalactic Database (NED), which is operated by the Jet
cle posed by the widely spread gas and the modest radio Propulsion Laboratory, California Institute of Technology,
power in comparison with powerful radio galaxies and radio under contract with the National Aeronautics and Space
loud quasars favour the deflection of the radio sources. Administration.
Although this sample cannot be considered representa-
tive of the general population of QSO2 it reinforces the idea
that low/modest power large spatial scale radio sources can References
exist in radio-quiet QSO2, and provide a source of feedback
Aalto, S., Falstad, N., Muller, S., et al. 2020, A&A, 640, A104
on scales of the spheroidal component of galaxies and much Alatalo, K., Lacy, M., Lanz, L., et al. 2015, ApJ, 798, 31
beyond well into the circumgalactic medium, in systems Baldi, R. D., Williams, D. R. A., McHardy, I. M., et al. 2018, MNRAS,
where radiative mode feedback is expected to dominate. 476, 3478
High resolution, high sensitivity radio observations and Balmaverde, B., Capetti, A., Marconi, A., et al. 2018, A&A, 612, A19
2-dim wide-field integral field spectroscopy of larger QSO2 Balmaverde, B., Capetti, A., Marconi, A., et al. 2021, A&A, 645, A12.
doi:10.1051/0004-6361/202039062
samples, specially with lower radio luminosities, will be Baum, S. A., Zirbel, E. L., & O’Dea, C. P. 1995, ApJ, 451, 88
very valuable to determine how frequent jets and related Bellocchi, E., Villar Martín, M., Cabrera-Lavers, A., et al. 2019, A&A,
structures are in the general population of non-radio loud 626, A89
Article number, page 14 of 32Villar-Martín et al.: Radio mode feedback in SDSS QSO2
Bennert, N., Falcke, H., Schulz, H., et al. 2002, ApJ, 574, L105 Molyneux, S. J., Harrison, C. M., & Jarvis, M. E. 2019, A&A, 631,
Bessiere, P. S., Tadhunter, C. N., Ramos Almeida, C., et al. 2012, A132G
MNRAS, 426, 276 Mukherjee, D., Bicknell, G. V., Sutherland, R., et al. 2016, MNRAS,
Best, P. N., Kauffmann, G., Heckman, T. M., et al. 2005, MNRAS, 461, 967
362, 9 Mullaney, J. R., Alexander, D. M., Fine, S., et al. 2013, MNRAS, 433,
Bondi, M., Pérez-Torres, M. A., Piconcelli, E., et al. 2016, A&A, 588, 622
A102 Müller-Sánchez, F., Nevin, R., Comerford, J. M., et al. 2018, Nature,
Bonzini, M., Padovani, P., Mainieri, V., et al. 2013, MNRAS, 436, 556, 345
3759 Nardini, E., Wang, J., Fabbiano, G., et al. 2013, ApJ, 765, 141
Boselli, A., Cuillandre, J. C., Fossati, M., et al. 2016, A&A, 587, A68 O’Brien, A. N., Norris, R. P., Tothill, N. F. H., et al. 2018, MNRAS,
Bournaud, F., Duc, P.-A., Amram, P., et al. 2004, A&A, 425, 813 481, 5247
Briggs D. S., 1995, PhD thesis, New Mexico Institute of Mining and Ochsenbein, F., Bauer, P., & Marcout, J. 2000, A&AS, 143, 23
Technology Padovani, P., Miller, N., Kellermann, K. I., et al. 2011, ApJ, 740, 20
Cabrera-Lavers, A., Bongiovanni, A., Cepa, J. Rutten, R.G.M., 2014, Panessa, F., Baldi, R. D., Laor, A., et al. 2019, Nature Astronomy, 3,
Canarian Observatory Updates (CUps), 1, 214 387
Clark, N. E., Axon, D. J., Tadhunter, C. N., et al. 1998, ApJ, 494, Ramos Almeida, C., Piqueras López, J., Villar-Martín, M., et al. 2017,
546 MNRAS, 470, 964
Comerford, J. M., Pooley, D., Barrows, R. S., et al. 2015, ApJ, 806, Reyes, R., Zakamska, N. L., Strauss, M. A., et al. 2008, AJ, 136, 2373
219 Rosario, D. J., Shields, G. A., Taylor, G. B., et al. 2010, ApJ, 716,
Condon, J. J. 1992, ARA&A, 30, 575 131
Condon, J. J., Kellermann, K. I., Kimball, A. E., et al. 2013, ApJ, Ryle, M. & Windram, M. D. 1968, MNRAS, 138, 1
768, 37 Shen, Y., Liu, X., Greene, J. E., et al. 2011, ApJ, 735, 48
Dopita, M. A., & Sutherland, R. S. 1995, ApJ, 455, 468
Shopbell, P. L., Veilleux, S., & Bland-Hawthorn, J. 1999, ApJ, 524,
Duc, P.-A. & Renaud, F. 2013, Lecture Notes in Physics, Berlin
L83
Springer Verlag, 327. doi:10.1007/978-3-642-32961-6_9
Stockton, A., & MacKenty, J. W. 1987, ApJ, 316, 584
Fabian, A. C., Sanders, J. S., Allen, S. W., et al. 2011, MNRAS, 418,
Storchi-Bergmann, T., Dall’Agnol de Oliveira, B., Longo Micchi, L. F.,
2154
Fabian, A. C. 2012, ARA&A, 50, 455 et al. 2018, ApJ, 868, 14
Fanaroff, B. L. & Riley, J. M. 1974, MNRAS, 167, 31P Sun, A.-L., Greene, J. E., & Zakamska, N. L. 2017, ApJ, 835, 222
Fischer, T. C., Kraemer, S. B., Schmitt, H. R., et al. 2018, ApJ, 856, Tadhunter, C., Morganti, R., Rose, M., et al. 2014, Nature, 511, 440
102 Tadhunter, C. 2016, A&A Rev., 24, 10
Gagne, J. P., Crenshaw, D. M., Kraemer, S. B., et al. 2014, ApJ, 792, Tingay, S. J., & Wayth, R. B. 2011, AJ, 141, 174
72 Tumlinson, J., Peeples, M. S., & Werk, J. K. 2017, ARA&A, 55, 389
Giacintucci, S. & Venturi, T. 2009, A&A, 505, 55 Urbano-Mayorgas, J. J., Villar Martín, M., Buitrago, F., et al. 2019,
Greene, J. E., Zakamska, N. L., Ho, L. C., et al. 2011, ApJ, 732, 9 MNRAS, 483, 1829
Greene, J. E., Zakamska, N. L., & Smith, P. S. 2012, ApJ, 746, 86 van Dokkum, P. G. 2001, PASP, 113, 1420
Hainline, K. N., Hickox, R. C., Greene, J. E., et al. 2014, ApJ, 787, Villar-Martín, M., Tadhunter, C., Pérez, E., et al. 2010, MNRAS, 407,
65 L6
Harrison, C. M., Alexander, D. M., Mullaney, J. R., et al. 2014, MN- Villar-Martín, M., Humphrey, A., Delgado, R. G., et al. 2011, MN-
RAS, 441, 3306 RAS, 418, 2032
Harrison, C. M., Thomson, A. P., Alexander, D. M., et al. 2015, ApJ, Villar Martín, M., Emonts, B., Humphrey, A., et al. 2014, MNRAS,
800, 45 440, 3202
Heckman, T. M., Kauffmann, G., Brinchmann, J., et al. 2004, ApJ, Villar-Martín, M., Arribas, S., Emonts, B., et al. 2016, MNRAS, 460,
613, 109 130
Heesen, V., Croston, J. H., Harwood, J. J., et al. 2014, MNRAS, 439, Villar-Martín, M., Emonts, B., Cabrera Lavers, A., et al. 2017, MN-
1364 RAS, 472, 4659
Helou, G., Soifer, B. T., & Rowan-Robinson, M. 1985, ApJ, 298, L7 Villar-Martín, M., Cabrera-Lavers, A., Humphrey, A., et al. 2018, MN-
Herrera Ruiz, N., Middelberg, E., Norris, R. P., et al. 2016, A&A, 589, RAS, 474, 2302
L2 Weilbacher, P. M., Duc, P.-A., & Fritze-v. Alvensleben, U. 2003, A&A,
Hodge, J. A., Becker, R. H., White, R. L., et al. 2008, AJ, 136, 1097 397, 545
Humphrey, A., Villar-Martín, M., Ramos Almeida, C., et al. 2015, Whittle, M. 1992, ApJS, 79, 49
MNRAS, 454, 4452 Wilson, A. S., & Ulvestad, J. S. 1983, ApJ, 275, 8
Husemann, B., Wisotzki, L., Sánchez, S. F., et al. 2013, A&A, 549, Wills, K. A., Morganti, R., Tadhunter, C. N., et al. 2004, MNRAS,
A43 347, 771
Husemann, B., Bennert, V. N., Jahnke, K., et al. 2019, ApJ, 879, 75 Wright, E. L. 2006, PASP, 118, 1711
Issaoun, S., Johnson, M. D., Blackburn, L., et al. 2019, ApJ, 871, 30 Xu, C., Livio, M., & Baum, S. 1999, AJ, 118, 1169
Jarvis, M. E., Harrison, C. M., Thomson, A. P., et al. 2019, MNRAS, York, D. G., Adelman, J., Anderson, J. E., et al. 2000, AJ, 120, 1579
485, 2710 Yoshida, M., Yagi, M., Ohyama, Y., et al. 2016, ApJ, 820, 48
Keel, W. C., Chojnowski, S. D., Bennert, V. N., et al. 2012, MNRAS, Zakamska, N. L., Strauss, M. A., Heckman, T. M., et al. 2004, AJ,
420, 878 128, 1002
Kellermann, K. I., Sramek, R. A., Schmidt, M., et al. 1994, AJ, 108, Zakamska, N. L., & Greene, J. E. 2014, MNRAS, 442, 784
1163 Zakamska, N. L., Lampayan, K., Petric, A., et al. 2016, MNRAS, 455,
Kellermann, K. I., Condon, J. J., Kimball, A. E., et al. 2016, ApJ, 4191
831, 168 Zhang, R. & Guo, F. 2020, ApJ, 894, 117
Kimball, A. E. & Ivezić, Ž. 2008, AJ, 136, 684
Kimball, A. E., Kellermann, K. I., Condon, J. J., et al. 2011, ApJ,
739, L29
King, A., & Pounds, K. 2015, ARA&A, 53, 115
Lal, D. V., & Ho, L. C. 2010, AJ, 139, 1089
Lansbury, G. B., Jarvis, M. E., Harrison, C. M., et al. 2018, ApJ, 856,
L1
Leipski, C., Falcke, H., Bennert, N., et al. 2006, A&A, 455, 161
Lelli, F., Duc, P.-A., Brinks, E., et al. 2015, A&A, 584, A113
Liu, X., Greene, J. E., Shen, Y., et al. 2010, ApJ, 715, L30
Maini, A., Prandoni, I., Norris, R. P., et al. 2016, A&A, 589, L3
Miley, G. K., Perola, G. C., van der Kruit, P. C., et al. 1972, Nature,
237, 269
Mao, M. Y., Sharp, R., Saikia, D. J., et al. 2010, MNRAS, 406, 2578
McMullin J. P., Waters B., Schiebel D., Young W., Golap K., 2007,
ASPC, 376, 127
Article number, page 15 of 32A&A proofs: manuscript no. AAQSO2-2021
Appendix A: Results on individual objects similar size of the bubble and the triple radio source. The
bubble could be ionised by the QSO2 (Storchi-Bergmann et
We present here detailed descriptions and results for the al. 2018) and/or by shocks induced by the outflow. The hot
QSO2 in our VLA sample and the Teacup, grouped by ra- shocked gas may also produce the soft X rays. Although
dio source physical size. The main results regarding the projection effects cannot be discarded, the bubble seems
sizes and nature of the radio structures and the large scale to reach the western companion galaxy which may thus be
ionised gas for all objects are summarised in Tables 5 and also affected by the giant outflow. Spatially resolved spec-
6 respectively. They are complemented with results from troscopy would be essential to investigate this scenario fur-
other studies in the literature. ther.
The large GTC collecting area allows to detect addi-
Appendix A.1: Large scale radio sources (>10 kpc from the tional faint ionised gas spread over a large area beyond
AGN) the main bodies of both galaxies (Fig. A.2, middle panel).
The existence of ionised gas all over the place, including
By “large” we mean extended >10 kpc from the AGN, which locations well outside the putative AGN ionisation cones,
is significantly larger than the typical effective radius of the suggests that local excitation mechanisms unrelated to the
spheroidal component of QSO2 hosts (Urbano-Mayorgas et AGN are at work at some positions.
al. 2019). Thus, these sources may affect volumes as large Hα emission is detected towards the NE up to a max-
as galaxy spheroids and beyond. imum distance rmax ∼21 kpc from the QSO2 and up to
• J0841+01 (z=0.110) ∼14 kpc to the SW of the companion nucleus. The max-
This dual or offset AGN system consists of two galaxies imum distance between the detected ionised gas features
with distorted morphologies undergoing a major merger. is dmax ∼42 kpc. These structures are reminiscent of tidal
They are separated by ∼400 or 8 kpc (e.g. Greene et al. features. Most show no or very faint identifiable continuum
2011; Comerford et al. 2015). counterpart at the sensitivity of the GTC image. The Hα
The GTC continuum and Hα images are presented knot at the tip of Eastern tail is an exception. The spatial
in Fig. A.2. The interacting galaxies are clearly seen in location, the compact morphology and the relatively strong
both. The HST image obtained with the WFC3/UVIS and continuum emission suggest that it is a tidal dwarf galaxy
the F438W filter is also shown (central λ0 =4320 Å and (TDG; e.g. Bournaud et al. 2004).
FWHM=695 Å. Program 12754; PI J. Comerford). It in- An alternative scenario is also possible. Several radio
cludes the redshifted [OII]λ3727, which dominates the emis- knots seem to track the eastern Hα tail (Fig. A.2). The
sion from the filamentary structures between the galax- advancing radio jet may be interacting with the ambient
ies. The HST spatial resolution is essential to appreciate gas along the tail possibly enhancing its Hα emission. At
the shape and the morphological substructure of this gas. the same time, the jet is being deflected by the gas.
Storchi-Bergmann et al. (2018) proposed that this ionised No evidence for an ionised outflow has been identified in
gas delineates the ionisation cone of the QSO2 hosted by this object (see also Greene et al. 2011). The non detection
the eastern galaxy. Based on the edge-brightened appear- of the outflow may be a consequence of the dilution due to
ance and the curved edges, we suggest that this gas traces a the large size of the 300 SDSS fibre.
giant (∼8 kpc) ionised bubble inflated by an outflow driven • J0853+38 (z=0.127)
by the QSO2. This RI QSO2 (Fig. 1) has a remarkable radio morphol-
The radio source of the RQ J0841+01 (Fig. 1) has a ogy (Fig. A.3)5 . The high resolution (VLA A-configuration)
maximum extension of drad max ∼20 or ∼40 kpc (Fig. A.1).
00
map shows a radio core and two narrow jets extending N
We show in Fig. 2 the overlay between the low (B con- (∼4.5 kpc) and S (∼9.0 kpc) of the AGN. Beyond a gap in
figuration, black contours) and high (A configuration, red the radio emission, the high SB jet bends sharply and ex-
contours) VLA radio maps with the Hα GTC and the tends towards the East for ∼60 kpc. This jet was already ap-
[OIII]λ5007 continuum subtracted HST/ACS FR551N im- parent in the FIRST data. The VLA B-configuration map
age from Storchi-Bergmann et al. (2018) (program 13741; reveals that it is part of a much larger and highly asym-
PI: T. Storchi-Bergmann). Three compact radio compo- metric radio source of total extension ∼3.5’ or ∼472 kpc.
nents are identified: a radio core is associated with the The bent jet extends towards the NE with a wiggling mor-
QSO2 nucleus, a brighter radio knot is located between the phology that ends in a hot spot at ∼1.50 or ∼202 kpc from
two galaxies, overlapping with the intricate filamentary gas, the QSO2. This is embedded in a large lobe, which shows
and a third, outer knot overlaps with the northern side of diffuse emission mostly on the northern side along the jet
the companion galaxy and is spatially shifted ∼200 relative and hot-spot.
to its optical nucleus. This suggests that this third radio Towards the SW another radio lobe with no identifiable
feature represents a hot-spot or lobe at the end of a jet hot spot is detected at similar distance from the QSO2.
associated with the QSO2. The northern ∼4.5 kpc inner jet detected in the A configu-
The middle radio component overlaps with the giant ration map appears to bend 90◦ towards the West in the B
bubble candidate. Soft X-ray extended emission spatially configuration image. Faint radio emission detected between
coincident with this warm ionised gas has been detected this structure and the SW lobe suggests that the radio lobe
(Comerford et al. 2015). This is reminiscent of the 10 kpc may be continuous, as on the eastern side, but Doppler de-
radio, X-ray and optical emission line bubble associated boosted and thus receding. The low SB radio emission fills
with the Teacup (Keel et al. 2012; Harrison et al. 2015;
Lansbury et al. 2018). In this QSO2 it is not clear whether 5
The map shown in Fig. A.3 contains artefacts imprinted by
the bubble has been inflated by a wide angle AGN driven the PSF near the bright radio core as a result of the snap-shot
wind or by the relativistic radio source (see also Jarvis et al. observations. We will mention only the features that are unam-
2019). The second scenario is favoured in J0841+01 by the biguously real
Article number, page 16 of 32Villar-Martín et al.: Radio mode feedback in SDSS QSO2
J0841+01
VLA-B VLA-A
20 kpc
−1
√ VLA radio maps of J0841+01. Left: B-configuration map. Contour levels start at 100 µJy
Fig. A.1. √beam and increase by
factor 2. Right: A-configuration map. Contour levels starts at 67 µ Jy beam−1 and increase by factor 2. The synthesised beam
is shown in the bottom-left corner of the maps.
Continuum Hα
TDG? QSO2 C [OII] + cont.
33”
5 kpc
Giant bubble or
10 kpc ionization cone?
10 kpc
33”
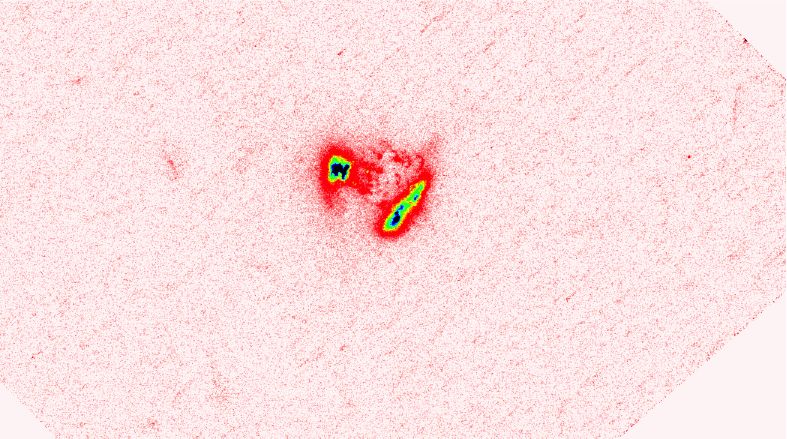
Fig. A.2. J0841+01. GTC continuum (left) and Hα images (middle). Contour values start at 3σ and increase with factor ×2.
For the Hα image, σ=4.1×10⁻¹⁹ erg−1 cm−2 pixel−1 . QSO2 and C indicate the QSO2 and the companion galaxy. TDG is a tidal
dwarf galaxy candidate (see text). The small right panel zooms in the central region of the HST WFC3/UVIS F438W image, which
contains the [OII]λ3727 doublet. The intricate filamentary structures between the two galaxies are dominated by gas emission.
They are reminiscent of a giant ionised bubble. In this and all figures the Hα images have been continuum subtracted. N is always
up and E is left.
an area of at least ∼20,000 kpc2 in projection. Therefore, is shown in Fig. 3. Both N and S of the QSO2, the ionised
the relativistic electrons have the potential to inject energy gas and the radio source trace each other. The prominent
across a huge volume and large distances from the AGN. bends of the radio source suggest that it is propagating
The GTC images of J0853+38 are shown in Fig. through a gas rich environment that deflects it (Heesen et
A.4. The QSO2 host is a spiral galaxy and so is SDSS al. 2014). Simultaneously the radio source appears to be
J085317.82+385311.7 at ∼37.500 (84 kpc) to the NW affecting the Hα morphology by redistributing and/or ex-
(zph =0.123±0.010; SDSS database). The Hα image shows citing the gas it encounters as it advances.
the spiral arms of this companion prominently. This is not There is a gap of Hα emission at ∼10 kpc South of the
detected in the VLA maps. Both galaxies may be interact- AGN. The southern radio structure bends at or near this
ing, although this is not conclusive based on our data. location. This morphological correlation suggest that the
The Hα image shows extended ionised gas all around radio source has cleared this region of gas. At the same
the QSO2 nucleus. Some of it overlaps with the spiral arms time, this interaction forces it to change its trajectory.
and is naturally explained by star formation. This is further Therefore, the J0853+38 radio source is interacting with
supported by the presence of some compact regions on the the ambient gas at different locations up to at least ∼36 kpc
eastern side. from the AGN. In fact, the radio source is so large that it
The most prominent ionised features extend up to ∼36 has the potential to affect a huge volume in and around the
kpc North and ∼22 kpc South of the AGN. They are not QSO2 host.
tightly correlated with the spiral arms and the main axis Several patches of Hα emission indicated with purple
is misaligned relative to the continuum major galaxy axis arrows in the middle panel of Fig. A.4 are seen at different
(Fig.A.4, right). locations at tens of kpc from the QSO2 and the companion
The overlay between the low (B configuration) and high (rmax ∼3100 or 70 kpc and dmax ∼100 kpc). They may be
(A configuration) VLA radio maps with the Hα GTC image separate gas patches, but it appears more natural that they
Article number, page 17 of 32You can also read