DIVERSIFICATION OF THE ALBERTA ECONOMY: IN SEARCH OF STABILITY - The School of Public ...
←
→
Page content transcription
If your browser does not render page correctly, please read the page content below
PUBLICATIONS
SPP Pre-Publication Series

July 2021

DIVERSIFICATION OF
THE ALBERTA ECONOMY:
IN SEARCH OF STABILITY

Robert L. Mansell*

* The helpful comments by Ken McKenzie and Daria Crisan on an earlier draft are much appreciated. However, they should not be
 implicated in any remaining errors or omissions for which the author remains wholly responsible.

AF-11 w w w. policyschool.ca
ALBERTA FUTURES PROJECT
 PRE-PUBLICATION SERIES

 Alberta has a long history of facing serious challenges to its economy, including shocks
 in the form of resource price instability, market access constraints, and federal energy
 policies. However, the recent and current challenges seem more threatening. It seems
 that this time is truly different.

 The collapse of oil and gas prices in 2014 combined with the rapid growth of U.S. oil
 production, difficulties in obtaining approval for infrastructure to reach new markets
 and uncertainty regarding the impacts of climate change policies world-wide have
 proven to be strong headwinds for the province’s key energy sector. Together, the
 negative effects on employment, incomes and provincial government revenues have
 been substantial. To make matters worse, in early 2020 the COVID-19 pandemic struck
 a major blow to the lives and health of segments of the population and to livelihoods
 in many sectors. The result has been further employment and income losses, more
 reductions in government revenues and huge increases in government expenditures
 and debt. These events, combined with lagging productivity, rapid technological
 shifts, significant climate policy impacts and demographic trends, call for great
 wisdom, innovation, collective action and leadership to put the province on the path of
 sustainable prosperity.

 It is in this context that we commissioned a series of papers from a wide range
 of authors to discuss Alberta’s economic future, its fiscal future and the future of
 health care. The plan is that these papers will ultimately be chapters in three e-books
 published by the School of Public Policy. However, in the interest of timeliness and
 encouraging discussion, we are releasing selected chapters as pre-publications.

1
1. INTRODUCTION
 Calls for economic diversification in Alberta have become a prominent feature of every
 significant downturn in the provincial economy and these have become louder in the
 current circumstance of the twin shocks of low oil prices and COVID-19. In late 2014
 benchmark oil prices fell by approximately 50 per cent and remained at those levels
 until 2019. Then in early 2020, COVID-19 led to a further weakening of these prices
 which dealt an additional blow to employment and incomes across most sectors in
 the province. The result has been a very severe downturn in the economy1 and, with
 the ever more stringent environmental and market access policies facing the key oil
 and gas sector, there are concerns that the longer-term prosperity of the province is
 seriously threatened.

 These circumstances have intensified the calls for diversification, presumably to
 achieve greater stability. But it is typically unclear as to what exactly is meant by
 ‘diversification’, how it is measured, what its objectives are, how it is to be attained
 and the ultimate trade-offs and impacts. Nevertheless, there is broad public support
 for greater diversification during such periods2 and this makes diversification policies
 politically very attractive. In most cases the attraction is based on promises of new or
 ‘better’ industries that will change the industrial structure of the region. The promise of
 new industries materializing may generate political support for such policies. However,
 the reality is that economic diversification is very complex and difficult to define and
 measure with the result that diversification strategies, like industrial development
 strategies, tend to be vague and difficult to put in operation. 3

 This paper begins with a summary of the key elements of effective diversification
 in the context of various types of economic instability faced by Alberta. While
 inherently difficult to measure given its many dimensions, some common measurement
 approaches are applied to assess the level and changes in diversification of the
 provincial economy. Attention is then turned to the degree, types and sources of
 economic volatility and, in this context, the potential role of greater diversification in
 stabilizing the economy is examined. Based on lessons from previous diversification
 attempts, some general policy guidance is proposed, along with other stabilization
 policies that warrant attention.

 1
 For example, the decline in Alberta’s real (or inflation adjusted) GDP in 2020 was 8.2 per cent and
 compensation per employee fell by 6 per cent, by far the largest declines among the provinces. (Statistics
 Canada, Table 36-10-0222-01)
 2
 For example, with the collapse of oil prices in 2015 a poll found that two-thirds of those surveyed believed
 diversification away from oil and gas should be a priority (https://www.cbc.ca/news/canada/calgary/poll-
 pembina-alberta-climate-change-1.3249966 ). In a 1987 survey following the dramatic drop in oil prices in
 1985 almost three-quarters of Albertans surveyed indicated a preference for greater diversification even if it
 led to incomes and employment that were lower but on average more stable. Mansell and Percy (1990, p.89).
 3
 Beauregard (1993, p.109) sums it up this way: “The romance with industrial diversification, however, should
 not be seen as a commitment to marriage. While diversification has much to offer, it is certainly not a panacea.
 Its goals are muddled, its rationale unsubstantiated, its consequences problematic, and its implementation
 doubtful. Nonetheless, industrial diversification seems to be unconditionally adopted and praised.”

2
To summarize, by most measures, the Alberta economy has become much more
 industrially diversified over time than is commonly understood, especially in terms of
 employment and the diversity of goods and services produced. Currently the level
 of this diversification is fairly comparable to that in other benchmark provinces such
 as Ontario, Quebec and British Columbia. However, the province continues to exhibit
 higher levels of cyclical instability in incomes and value added or Gross Domestic
 Product (GDP) and, looking forward, there are concerns about secular instability
 related to long term challenges to the Alberta oil and gas sector.

 There is a case for policies to encourage industrial development and growth to address
 the cyclical and secular instability. However, the more commonly proposed forced
 growth approaches targeting specific industries are often problematic, particularly
 given marginal success rates and the potential for large trade-offs resulting in lower
 productivity, incomes, exports and government revenues. Rather, a broad based
 approach is better suited and should be focused more on expanding the range of
 goods and services produced within the existing industrial structure and on market
 diversification. Further, it is noted that there are effective approaches other than
 industrial diversification to reduce variability. High on that list are policies to diversify
 the province’s tax base and restore fiscal sustainability. Lastly, the potential secular
 instability associated with the challenges facing the province’s oil and gas sector
 deserves special attention. This is the highest risk to Alberta’s long term prosperity.
 The province has many strengths of adaptability and innovation developed through
 previous periods of adversity that will be critical in achieving a successful transition
 for this dominant sector. Strong leadership and consistent policies that anticipate and
 support the transition will also be particularly important.

 2. WHAT IS DIVERSIFICATION?
 The common objective of diversification in a regional economy is to reduce instability.
 In most cases the focus is on changing the industrial structure by adding new industries.
 The principle is similar to that used to stabilize a financial portfolio. In general, the
 variability of the portfolio will decline as the number of different company shares held
 increases, as the proportion of the most volatile shares decreases and as the amount
 of negative covariance increases (that is, where the prices of the individual company
 shares move in opposite directions).4 In the case of a regional economy consisting of a
 ‘portfolio’ of various industries, the degree of variability will therefore depend on the
 number of different industries, their relative size and volatility and the degree to which
 they move together or in opposite directions. As such, the diversification principle
 suggests the addition of industries exhibiting lower variability and industries which tend
 to exhibit negative covariance with the more volatile industries. 5

 4
 As an approximation, with N individual units, each accounting for 1/N of the portfolio, the portfolio variance
 will be (1/N) x Average Variance + (1-1/N) x Average Covariance. As N increases, the portfolio variance
 approaches the average covariance.
 5
 An example is where the addition of a petrochemical industry using a natural gas based feedstock (primarily,
 ethane) helps offset the variability associated with the natural gas producing industry. For instance, in a
 period of low natural gas prices, the declines in the gas producing industry would be partially offset by the
 gains in the petrochemical industry as feedstock costs are reduced.

3
However, in the case of a regional economy these simple notions become much more
 complicated. First, there are different types and sources of volatility. This could be
 cyclical variability related to the frequent ‘ups and downs’ in commodity markets,
 especially those for internationally traded resource-based products, or related to less-
 frequent shifts associated with macroeconomic business cycles. In other cases the main
 concern could be random variability associated with largely unpredictable changes
 in such things as government policies, in trading relationships or the emergence of a
 pandemic. Finally, there is the case of secular instability associated with the long term
 decline of an industry or sector as a result of, for example, technological change, shifts
 in markets, or government policies that impair competitiveness. The key point here
 is that to be effective the type of diversification required will depend on the type of
 instability and, indeed, in many cases the best solutions will involve policies other than
 those aimed directly at diversification.

 A second source of complications arises from the fact that there are different types of
 diversification. Most commonly, the focus is on diversity with respect to the industrial
 structure. However, stability is also related to diversity with respect to markets for
 existing industries, diversity in terms of the range of commodities produced by existing
 industries and / or the degree of processing of raw commodities in the region.6

 A third complication arises from the fact that the degree of diversification will depend
 on which measure of well-being is used. For example, a region could be highly
 diversified in terms of employment but less so in terms of income or output.

 For these (and other) reasons there is not a single definitive and meaningful measure
 of diversification and its relationship to regional economic stability.7 Rather, it is
 necessary to use a variety of indicators to capture the various dimensions and that is
 the approach taken here. A common measure used across dimensions is a Herfindal
 (H) index which indicates the degree of concentration in terms of industrial structure,
 markets, product mix and so on. For example, the normalized version, (denoted H*)8 for
 the distribution of employment in a region would have a value of one if all employment
 was in one sector and a value of zero if employment was equally distributed among all
 sectors. So, the lower the H-index the more diversified is the economy.

 6
 In general, higher levels of processing results in commodities that have less price and quantity volatility than
 the raw materials used as inputs.
 7
 Conroy (1975) provides a good summary of the complications in measuring diversification in a regional context.
 8
 The normalized H index, denoted H*, = (H-1)/(1-1/N) where H= ∑# " "
 !$% ! and ! is the square of the share in sector
 i and where the sectors range from 1 to N.

4
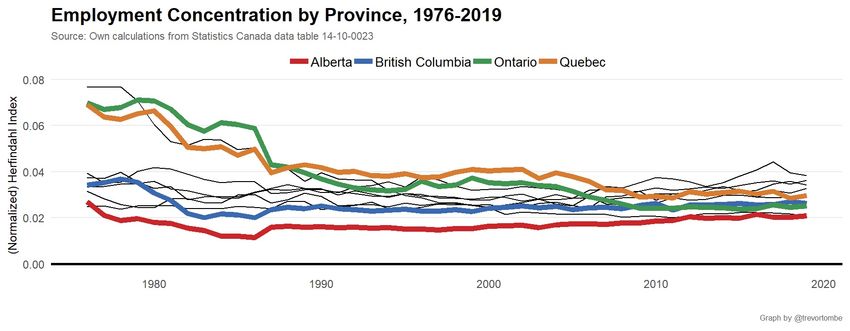
3. DIVERSIFICATION OF THE ALBERTA ECONOMY
 The focus in this section is on changes over time in the level of diversification of the
 provincial economy and how this compares to that in other provinces. Values for the
 shares of employment and GDP by two-digit industry level over selected years in the
 period 2001-2020 for Alberta, British Columbia, Ontario and Quebec are provided in
 Appendix tables 1 and 2.

 As indicated in Figure 1, as measured by the H*-index, over the past four decades or so
 direct employment concentration across industrial sectors in Alberta has tended to be
 below that in other provinces, and particularly relative to that in comparator provinces
 such as British Columbia, Ontario and Quebec.9

 However, this does not take account of the covariance among sectors. For example, in
 the case of Alberta, there are extensive linkages among the oil and gas, construction,
 manufacturing and professional / technical Services sectors. As a result, employment in
 these latter sectors depends to a significant degree on oil and gas sector employment.
 To the extent that these move together (positive covariance), the result will be
 less diversification and greater cyclical variability. As indicated in Figure 2, taking
 these linkages into account results in a lower level of diversification (or higher level
 of concentration) but it is still at a level that compares favorably with most other
 provinces.10

 Figure 1: H* Index of Direct Employment Concentration by Province, 1976-2019

 Source: Tombe (2020) based on data from Statistics Canada table 14-10-0023.

 9
 Indeed, other studies indicate that Alberta has one of the most diversified labour markets in North America.
 (Alberta Central, 2021).
 10
 See Tombe and Mansell (2016, section 2.6) for methodological details.

5
Figure 2: H* Index of Direct and Indirect Employment by Province, 2015
 Direct Employment Direct and Indirect Employment

 0.035

 0.030

 0.025

 0.020

 0.015

 0.010

 0.005

 0.000
 NL PE NS NB QC ON MB SK AB BC

 Source: Tombe and Mansell (2016, Figure 7).

 However, as shown in Figure 3, the level of diversification for Alberta in terms of value
 added (or GDP) is significantly less than in most other provinces and particularly so in
 comparison to that for Ontario and Quebec. A key factor is the dominant contribution
 by the mining and oil and gas sector which directly accounts for over 25 per cent of
 total Alberta GDP in most years. (see Appendix Table 2).

 Figure 3: H* Index of Nominal GDP by Province, 2015
 0.06

 0.05

 0.04

 0.03

 0.02

 0.01

 0
 NL SK AB NS PE BC ON NB QC MB

 Source: Tombe and Mansell (2016, Figure 8)

 No equivalent summary measure of diversity with respect to the product range
 of existing industries is provided here. A survey of Statistics Canada data at the
 six-digit level (the highest level of disaggregation in the North American Industry
 Classification System (NAICS)) indicates that there has been a significant increase

6
in this diversity over time (in terms of employment and value added) in the case of
 Alberta.11 However, without further detailed analysis it is not possible to compare this
 increase with the changes for other provinces.

 The final dimension summarized here is with respect to the diversity of export
 markets. Using the H* index again, the approach is to measure the degree of diversity
 with respect to the province’s export markets. As before, a higher H* value indicates
 less diversity or greater market concentration. Using 2015 again as a representative
 year, the results shown in Figure 4 indicate a level of market concentration for Alberta
 well above that for most other provinces, primarily reflecting the very heavy reliance
 of the oil and gas sector on the U.S. market.12

 By way of summary, the ranking of the level of diversification across provinces is shown
 in Table 1. Other than its high degree of diversification in terms of direct employment,
 Alberta ranks mid-pack when taking into account the indirect employment associated
 with each sector and it ranks poorly with respect to the sectoral diversity of nominal GDP
 and export markets. This suggests that, to the degree that greater diversification is aimed
 at reducing cyclical or random variability of the Alberta economy, the focus should be on
 two key elements: expanding and diversifying domestic and international export markets
 and pursuing polices consistent with offsetting the volatility of changes in GDP.

 Figure 4: H* Index of Export Market Concentration, by Province, 2015
 1

 0.9

 0.8
 Herfindhal Index of Exports

 0.7

 0.6

 0.5

 0.4

 0.3

 0.2

 0.1

 0
 NL PE NS NB QC ON MB SK AB BC
 Source: Tombe and Mansell (2016, Figure 10)

 11
 As just one example it can be noted that the main output of Alberta’s energy industry in the 1950s was
 conventional oil but over time it has added to its product range large components comprised of natural gas,
 gas liquids and unconventional (heavy and oil sands) oil. Similar trends can be observed for other basic or
 exporting sectors.
 12
 For example, in January 2021 Alberta exports to the U.S. amounted to $7.37 B compared to $0.41 B to China,
 $0.24 B to Japan, and $0.12 B to Mexico. https://oec.world/en/profile/subnational_can/alberta

7
Table 1: Ranking of Diversification Dimensions Across Provinces
 Diversification Rank, by Province and Metric
 Direct Employment Direct and Indirect Nominal GDP Export Markets
 Employment
 SK 2 1 9 2
 BC 3 2 5 1
 MB 7 8 1 5
 AB 1 5 8 9
 NB 6 3 3 10
 QC 9 10 2 7
 PE 5 9 6 3
 ON 4 7 4 8
 NS 8 4 7 6
 NL 10 6 10 4

 Source: Tombe and Mansell (2016, Table 4)

 4. VARIABILITY OF THE ALBERTA ECONOMY
 The dramatic impacts associated with the twin crises associated with energy prices
 and COVID-19 have unquestionably demonstrated the economic and social costs
 arising from volatility. But here it is important to distinguish among cyclical, random
 and secular instability. The large energy price shock initiated in 2014 is no doubt
 part of the cyclical variability seen many times before and it is this type of variability
 we initially focus on. The pandemic, on the other hand, is quite different. It is more
 of a ‘black swan’ event that is less predictable than variations in energy prices and
 typical variations among regions in terms of industrial structure would not alone make
 substantial differences to the impacts of the pandemic. In contrast, the increasing
 policy and market challenges facing the energy sector suggest a potential case of
 secular or long term instability associated with reduced investment and growth in a
 major driver of the overall economy.

 The costs of variability will generally be smaller the greater the degree to which
 variations can be predicted or be reasonably anticipated. For example, in theory
 individuals, industries and governments subject to large income swings due to the
 vagaries of international commodity markets could take a longer term view with
 respect to commodity prices and avoid or minimize large swings in their expenditures
 over the cycle. However, this is often not the case given fleeting memories, the
 tendency to believe a current boom will be lasting rather than end in a bust, the short
 term focus of equity markets and the inherent propensities to chase rising markets.

 It should also be noted at the outset that mathematically there will always be a
 tendency for greater variability the higher is the growth rate. This is particularly
 relevant to the case of Alberta which by most measures has tended to have the highest
 long term growth rates. For example, between 2001 and 2020 the population growth

8
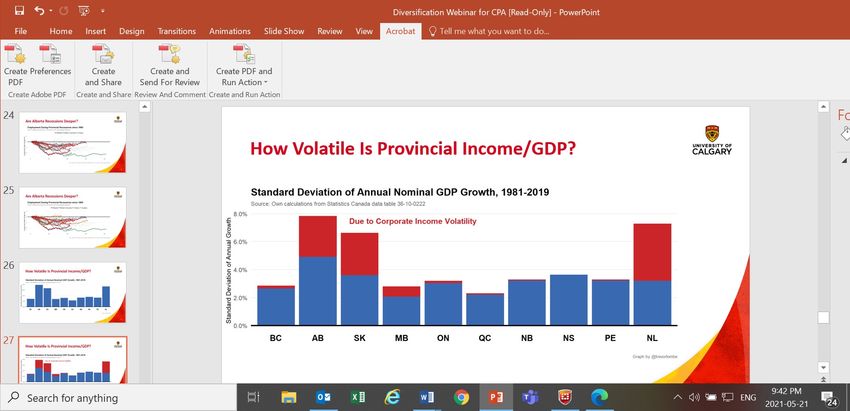
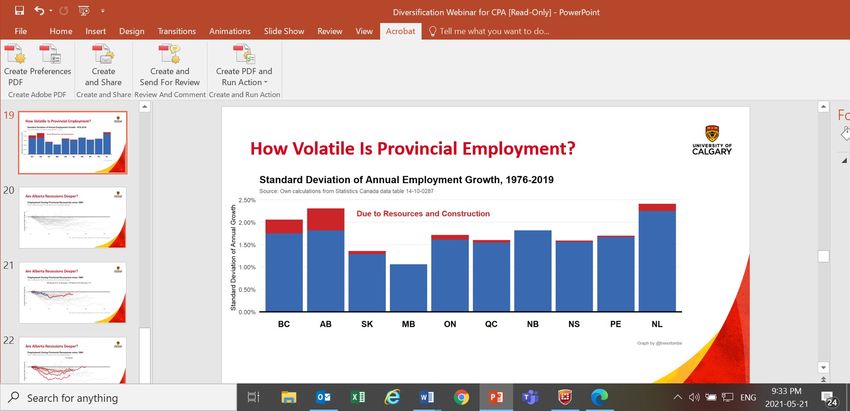
rate for Alberta was 2.2 per cent per annum13, 53 per cent above that for Ontario, and
 more than 100 per cent greater than that for Quebec and Manitoba, all provinces that
 have tended to have lower levels of variability.

 CYCLICAL INSTABILITY
 For the moment attention is on cyclical variability and the starting point is to measure
 the level of this volatility in terms of two broad measures, employment and GDP, that
 are critical in terms of economic and social well being. The variability of employment
 and GDP changes, measured as a standard deviation in annual growth rates, is
 portrayed in Figures 5 and 6 respectively.14

 As shown in Figure 5, the variability of employment growth in Alberta over the period
 indicated has tended to be somewhat higher than in other provinces, with a substantial
 portion of this related to outsized variations in resource and construction industry
 employment in Alberta.15

 Figure 5: Standard Deviation of Annual Employment Growth, by Province, 1976-2019

 Source: Tombe, (2020, based on calculations from Statistics Canada table 14-10-0287)

 However, the greatest variability for the province shows up in terms of GDP growth
 rates. As indicated in Figure 6, it is substantially above that in other provinces,
 except for Saskatchewan and Newfoundland and Labrador. There are a number of
 key sources of this variability. Using the income-based approach to measuring GDP,
 the net corporate operating surplus (or return on investments) exhibits wide swings
 in Alberta, largely in relation to the energy sector. For example, the swing in this
 component between 2014 and 2016 was from $78.6 billion to $15.7 billion.16 Using the

 13
 Measured as the annual compound growth rate over this period.
 14
 The standard deviation is a measure of the dispersion of a set of values around the mean of those averages.
 The standard deviation (ơ) is the square root of the sum of the squared deviations of values for x (xi) from the
 mean (μ) divided by the number of observations (N). That is, ơ = [Σ(xi-μ)2/N]1/2
 15
 As noted by Mansell and Percy (1990) and Chambers (1999), this variability for Alberta was particularly
 high during the 1976 – 1987 period, primarily the result of federal energy policies combined with swings in
 international oil prices. Also, see Kneebone and Gres (2013) for an analysis of regional employment cycles
 relative to those at the national level.
 16
 Data from Statistics Canada, Table 36-10-0221-01.

9
expenditure approach,17 the largest volatility is in the value of exports and in investment
 expenditures. The large fluctuations in energy prices directly produce substantial
 variations in the value of Alberta exports, one of the key drivers of the provincial (and
 the national) economy. Further, given the very high capital intensity of the energy
 sector, non-residential investment is also very large18 and, given its sensitivity to swings
 in expectations associated with energy pricing and policies, this adds further volatility
 to the province’s GDP.

 Figure 6: Standard Deviation of Nominal GDP Growth, by Province, 1981-2019

 Source: Tombe, (2020, based on calculations from Statistics Canada table 36-10-0222)

 Another way of unpacking the sources of instability involves decomposing a regional
 economic instability index.19 Using this approach, Dahlby and Khanal (2018, p.8) found
 that over the period 1997- 2015 Alberta’s GDP volatility was much higher than that of
 Ontario, Quebec, and British Columbia primarily because of the greater variability in
 the construction, oil and gas extraction and manufacturing industries and in support
 activities for oil and gas extraction. At the same time, however, they found that shifts
 in the industrial composition of the Alberta economy over the period 1997-2015
 reduced output volatility by 21 per cent. 20 These authors also examined the industrial
 composition of the variations in labour income, a more important concern of policy
 makers. For the period 1997-2014 they found that the construction sector had the
 most volatile labour income, followed by the oil and gas extraction sector and the
 manufacturing sector.

 SECULAR INSTABILITY
 The shifts in the Atlantic regional economies in the early 1900s are perhaps the most
 dramatic examples of secular instability in Canada. A combination of events, including

 17
 Using this approach, GDP = Consumer expenditures + Investment expenditures + Government expenditures
 (on goods and services) + Exports – Imports.
 18
 For example, in 2009, 2015 and 2019, non-residential investment in Alberta accounted for, respectively, 30
 per cent, 33 per cent and 25 per cent of total non-residential investment in Canada. Data from Statistics
 Canada, table 36-10-0222-01.
 19
 See Mansell and Percy (1990, p.69).
 20
 Dahlby and Khanal (2018, p.10). The comparable reductions for Quebec and Ontario were, respectively, 42.5
 per cent and 34.5 per cent.

10
the phasing out of wooden ships, the shifting of international trade routes with the
 opening of the Panama Canal, the shrinking of traditional fish markets, and the declines
 in the demand for Maritime-sourced coal and steel struck serious blows to these
 economies. Arguably they have never fully recovered and this highlights the immense
 costs of secular instability.

 While there have been cases of secular instability at a local level in Alberta, there
 have been none for the province overall. However, there have been instances of
 significant concern, particularly in relation to the energy sector. In the early 1970s
 and into the 1980s there were concerns that production from the province’s pivotal
 oil and gas sector would begin a secular decline and that there was perhaps only
 a decade to diversify. In response Premier Lougheed (1974), emphasized the need
 for a diversification strategy to “become less dependent on the sale of unprocessed
 resources.” This led to a number of diversification initiatives (noted later), including the
 formation of the visionary Alberta Heritage Savings Trust Fund to save for the future,
 strengthen or diversify the economy and improve the quality of life of Albertans.

 As it turned out, the development and implementation of new technologies resulted
 in dramatic increases in oil sands production along with uplifts to conventional crude
 oil, natural gas and gas liquids production. This greatly reduced the urgency to
 address any future declines in the contributions of the oil and gas sector, and those of
 the linked industries, to Alberta’s future prosperity. However, there are now growing
 environmental, policy and market issues around oil and gas that represent huge
 challenges to its contributions to Alberta’s long term growth and prosperity.

 5. DEALING WITH INSTABILITY

 TRADE-OFFS
 Any discussion of instability must be in the broader context of the province’s overall
 performance. Alberta has an enviable record in terms of most measures of economic
 and social well-being of its residents. For example, Uguccioni, Sharp and Beard (2017,
 p.33) indicate that over the period 2000-2015 Alberta ranks first in terms of the Human
 Development Index21 among all Canadian provinces and fifth in the world. The province
 has also tended to have the highest output and income per worker and per capita and
 the lowest poverty rates. 22

 Much of this success can be traced to the resources sector and particularly the energy
 industry (Mansell and Staples, 2011). In general, the resource industries tend to be
 characterized by capital and technology-intensive production processes, a large
 number of independent units, a high degree of risk and entrepreneurial awareness,
 considerable backward and forward linkages to other sectors, and wide exposure to
 the vagaries of international markets and government policies. Taken together, these

 21
 This international measure takes into account factors such as life expectancy, education, and per capita incomes.
 22
 See Kneebone and Wilkins (2021).

11
characteristics have created a very entrepreneurial, flexible and mobile population with
 strong incentives and abilities to respond to adversity by modifying existing activities
 and creating new ones. (Cross, 2021 and Mansell and Percy, 1990, p.57).

 This adjustability in the broader real-world environment with rapid changes and
 volatility represents a very important strength of Alberta’s economic base. It also
 highlights the fact that an industrial development policy aimed at replacing the more
 variable sectors with less variable ones can involve large trade-offs. These include a
 lower overall level of productivity, a less competitive industrial structure (particularly
 in a rapidly changing and volatile environment), and a diminished level of economic
 and social well being. 23 Further issues arise given the large size and highly integrated
 structure of the energy sector and its critical role (along that of agriculture and other
 resource sectors) in the economic base of many communities across the province.
 Simply put, there are no industry alternatives of sufficient size, productivity, export and
 government revenue generation capability, regional impacts and competitiveness that
 could realistically offset the negative impacts on the Alberta economy associated with
 a rapid and substantial decline in this sector.

 ELEMENTS OF A SOLUTION
 These trade-offs do not deny the fact that reduced variability of the Alberta economy
 would represent a real gain so long as the solutions would not entail significant
 reductions in overall economic and social well being. But diversification is not a
 panacea in achieving greater stability. Rather, there are approaches other than a forced
 re-engineering of Alberta’s economic base that must also be considered in the search
 for greater stability. 24

 Random Instability
 Industrial diversification is not generally an effective strategy for truly random
 instability such as that associated with the pandemic. However, as noted by Cléroux
 (2020), diversification in the form of expanding the range of products and markets for
 existing industries and firms is a viable risk mitigation strategy for the province. This,
 along with having appropriate risk management systems in place (including access
 to technologies to allow market pivots) and sufficient federal and provincial fiscal
 flexibility and capacity to provide short term income supports to assist individuals and
 businesses to ‘weather the storm’, are essential. 25 The enormous increase in federal
 expenditures has certainly been important in cushioning the impacts of the COVID-19

 23
 Labour productivity and compensation in Alberta’s energy and related industries is multiples above the
 average for most other industries in the province and in Canada. For example in 2020 per hour labour
 productivity (in chained 2012$) for conventional oil and gas extraction was $341.7 and it was $1323.3 for
 non-conventional oil extraction, $935.2 for petroleum refineries and $672.2 for basic chemical manufacturing,
 compared to an average of $84.5 for all industries in the province. (Data from Statistics Canada, Table 36-10-
 0480-01).
 24
 See chapter 5 of Mansell and Percy (1990) for a detailed discussion.
 25
 The Alberta government alone has committed just under $9 billion as part of its support and economic
 recovery program.

12
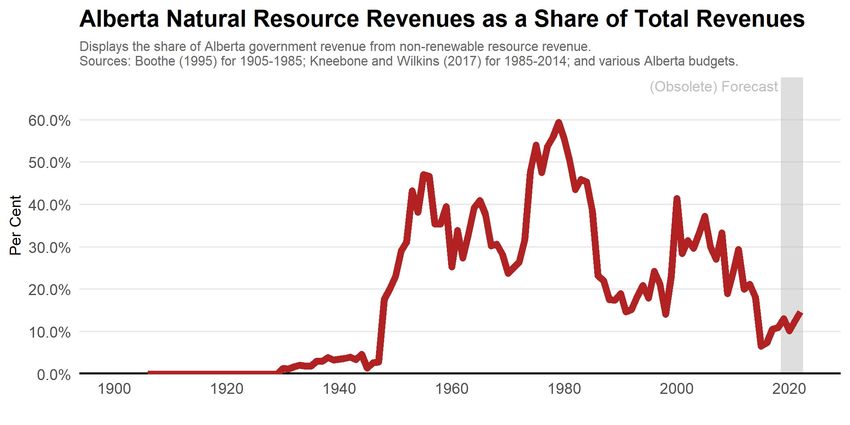
pandemic. While the longer term macro and regional effects of the resulting expansion
 in federal debt are certainly a concern, the run up in Alberta’s debt is more problematic
 given the province’s pre-existing and significant long term fiscal gap (Tombe, 2021
 and Crisan and McKenzie, 2021). Unlike the case at the federal level where deficits can
 be financed by ‘printing money’, at the provincial level there are definite debt walls
 and immediate negative consequences when they are approached (Ascah, 2021). This
 brings us to the issue of Alberta’s fiscal situation and, in particular, the problem of
 revenue instability.

 Mitigating Cyclical Variability – Fiscal Stabilization
 Alberta, along with Saskatchewan and Newfoundland and Labrador, suffers by far
 the greatest instability in provincial government revenue (Dahlby, 2019) and this has
 important implications for their governments in dealing with cyclical variability. This
 instability is primarily a result of the non-renewable resource revenues that comprise
 a substantial portion of the provincial government’s revenues and swing widely with
 the ups and downs of oil and gas prices. As indicated in Figure 7, this share of Alberta
 revenues over the last two decades has ranged from over 40 per cent to under 10 per
 cent. While the running of fiscal surpluses and deficits has provided a buffer, there are
 still significant consequences for overall economic stability.

 As noted by Crisan and McKenzie (2021, Figure 1) a result has been the tendency for
 the provincial government to overspend in periods of fiscal bounty, followed by periods
 of painful retrenchment. 26 Given that almost a quarter of total Alberta employment
 is in education, health care, social assistance and public administration, all sectors
 heavily dependent on provincial funding (see Appendix Table 2), this alone transmits
 significant volatility in addition to that associated with changes in other revenue and
 expenditure components. Further, it reduces the ability of the government to more
 aggressively pursue a fiscal stabilization policy involving, for example, large increases
 in infrastructure and other capital expenditures during downturns in the provincial
 economy. And, it also reduces the ability of the province to provide stable, attractive
 and predictable tax policies, along with high quality physical and social infrastructure.
 These factors are particularly important in attracting investment, employment and
 income growth.

 26
 See also Mansell (1997).

13
Figure 7: Non-Renewable Resource Revenues as a Share of Total Alberta Government
 Revenues, 1905-2020.

 Source: Tombe, (2020).

 It should be noted that restoring fiscal stability and sustainability is widely seen by the
 business community as the highest priority for maintaining and growing employment
 and incomes in Alberta. (Kobly, 2021).

 A sensible way of converting an unstable stream of resource revenues into a more stable
 flow of interest and dividend income is through a sovereign fund. Indeed, this, and the
 desire to save for the future, was the motivation for the Alberta Heritage Savings Trust
 Fund (AHSTF), as well as other similar funds such as the Alaska Permanent Fund and
 the Government Pension Fund Global of Norway (or Oil Fund). By investing a portion of
 resource revenues in a financial portfolio diversified across industries and regions, the
 Oil Fund has, since 1996, grown to almost $1.6 trillion (Cdn) and the Alaska Permanent
 Fund (APF) has, since 1976, grown to over $97 billion (Cdn). 27 In contrast the AHSTF,
 also established in 1976, had a value of $17.3 billion at the end of 2020. 28 Unlike the
 APF and Oil Fund, the AHSTF did not and does not have the type of constitutional
 or pension plan protection to counter the propensity to spend rather than save and
 benefit from compound growth in interest and dividend revenues. As a result it has
 been politically attractive to significantly reduce the original non-renewable revenue
 investment commitments (to zero in many years), and to use it to fund capital projects
 and operating expenditures. 29 It is interesting to contemplate how different Alberta’s
 economic future would look if the fund was, say, $100 billion and able to realistically

 27
 Data from: https://www.nbim.no/ and https://apfc.org/
 28
 Data from: https://www.alberta.ca/heritage-savings-trust-fund.aspx#jumplinks-0
 29
 See https://open.alberta.ca/dataset/80ee4142-17f2-4bc7-b30b-18afd3dfe5c8/resource/1c95d123-fa1d-49e3-
 ad25-98599aba2fb4/download/heritage-fund-historical-timeline.pdf for a historical timeline of the AHSTF.

14
generate a fairly stable average of $7 or $8 billion per year in revenue. 30 Rather than a
 lament of the lost opportunity, the main point here is that it can serve as a useful lesson
 going forward. It is reasonable to expect resource revenues will remain substantial,
 and highly variable, for the foreseeable future. As emphasized by Smith (2021), a re-
 dedication to consistently saving a larger share of these revenues in a protected AHSTF
 would be one option in the context of much-needed fiscal restructuring to stabilize and
 enhance the sustainability of provincial government revenues.

 Additional stability could be obtained by broadening the provincial tax base. Other
 papers in this series discuss this issue (see Tombe, 2021 and Crisan and McKenzie,
 2021). A common prescription from an efficiency and stability perspective is the
 introduction of a sales (or value-added) tax. Unfortunately, in the case of Alberta this is
 difficult politically given that the absence of a sales tax is seen almost as a ‘birth right’.
 Another option may be the repatriation of the federal carbon tax (which has many
 of the efficiency characteristics of a sales tax) and the use of some of the associated
 revenues to supplement the existing tax base.

 One of the common requirements of a well-functioning federation is the provision of
 economic stabilization to allow regions to specialize in areas of comparative advantage
 without the added risks of doing so. As noted by Kneebone and McKenzie (1998),
 federal stabilization has primarily been through expenditure and transfer policies. For
 example, via automatic or discretionary federal fiscal adjustments a net stimulus can
 be provided to offset the effects of a sharp regional downturn. As outlined by Mansell,
 Khanal and Tombe (2020), over the period 1961-2018, these types of adjustments
 have played a significant role in stabilizing incomes in most provincial economies but
 not in the case of Alberta. In general, the net federal fiscal balance for the province
 (the difference between the total federal revenues collected in the province and the
 total federal expenditures and transfers returning to the province) has represented
 a large net outflow from the province and it has not been particularly responsive to
 downturns in Alberta’s economy. This net outflow from Alberta associated with federal
 fiscal programs and policies has averaged more than $20 billion annually and amounts
 to an annual transfer of over $5000 per person. This is by far the highest in Canada,
 representing an annual transfer out of the province equal to about 10 per cent of
 total personal incomes in Alberta. 31 These large transfers of income (and associated
 employment and population) become a substantial drag on the provincial economy
 during downturns and work against stabilization. Even modest changes, such as a

 30
 The 2008 Financial Investment and Planning Advisory Commission’s report on Alberta’s savings and investment
 strategy recommended investing a legislated share of the non-renewable revenues with a target for the Alberta
 Heritage Fund of $100 billion by 2030. See: https://www.alberta.ca/release.cfm?xID=24786B1AE3659-F3BF-
 39F1-519A63F0E373A3EE . Bremer and Ploeg (2014) have estimated that to achieve an on-going resource
 dividend equivalent to 30 per cent of government revenue the AHSTF would need to be worth the equivalent of
 40 per cent of Alberta GDP by 2030 and 100 per cent by 2050.
 31
 This is roughly 3.5 times the net per capita federal fiscal contribution by Ontario, the only other major net
 federal fiscal contributor in Canada. Since 2000, the per capita federal fiscal balance for Ontario has ranged
 from a net per capita outflow of just over $4000 to a net inflow of just under $1000 per capita. The total net
 federal fiscal transfer out of Alberta over the period 1961-2018 amounted to $631 billion. See Mansell, Khanal
 and Tombe, (2020). With the net transfer for 2019 added, the total comes to $661 billion (in 2019$).

15
re-balancing of federal procurement so that Alberta receives something closer to the per
 capita share for other provinces, would significantly reduce this drag on the economy. 32

 The federal fiscal stabilization program is intended to provide insurance to provinces
 in cases of dramatic drops in their own-source revenues and could be of considerable
 assistance in stabilizing Alberta’s revenues. However, as explained by Dahlby (2019), it
 is designed to minimize the protection against large revenue declines for the provinces
 with heavy reliance on resource revenues (Alberta, Saskatchewan and Newfoundland
 and Labrador). 33 Unfortunately these are the provinces in greatest need for revenue
 stabilization. In the case of Alberta, for instance, revenues dropped by $8.8 billion in
 2015-16 (roughly 20 per cent) and it received $248.3 million under the stabilization
 program. Over the period 1986-2018 there have been two instances of 25 and 34
 per cent declines and four years with declines of more than nine per cent. Based on
 standard insurance principles, Dahlby estimates that the province should have received
 an additional $7 billion to $11 billion in revenue stabilization over this period (Dahlby
 2019, p.11). While the formula was changed recently by the federal government this was
 limited to raising the cap from $60 to $170 per resident to reflect inflation over time
 but did not address the discriminatory 50 per cent deductible for resource revenues.
 The net result is an increase in the expected payment to Alberta to $750 million and
 with the main benefits going to the provinces that are not significantly dependent on
 resource revenues. 34

 All of the types of fiscal restructuring in Alberta and those involving changes to federal
 fiscal policies discussed above would significantly reduce the cyclical variability of the
 provincial economy. The huge challenge is achieving the sustained political leadership
 and support to make these changes a reality in a democratically unbalanced federation. 35

 Mitigating Cyclical Variability – Diversification
 As noted earlier, the Alberta economy has become more diversified over time and this
 has reduced cyclical variability. This has been due to both market-induced changes,
 particularly involving innovation, as well as policy-induced changes. At the provincial
 level there have been numerous policy statements and strategies since the 1970s which
 have invariably included diversification objectives, typically captured within a broader
 ‘industrial development’ strategy. 36 The most recent (Government of Alberta, 2020)
 is the recovery plan to create jobs, build and diversify. It includes strategies to drive
 diversification in relation to agriculture, forestry, tourism, technology and innovation,
 finance and fintech, creative industries, natural gas and petrochemicals.

 32
 This change alone for federal non-defense and defense procurement would reduce the net annual outflow by
 over $3 billion. See Mansell, Khanal and Tombe (2020, Table 7). See also, Alberta (2020).
 33
 The very low coverage for these provinces results from changes in the program over time that included a
 deductible of 50 per cent for resource revenues, a deductible of five per cent for non-resource revenues and
 a cap of $60 per capita in payments to the provincial government.
 34
 See https://www.cbc.ca/news/politics/pbo-fiscal-stabilization-reform-1.5880714
 35
 Savoie (2019) provides a comprehensive analysis of these fundamental issues.
 36
 For example, see: Government of Alberta (1984, 2011 and 2020).

16
The overall quantitative impact of the earlier policies and strategies on cyclical
 stabilization and other objectives has yet to be estimated. 37 However, much can be
 learned from case studies of both the successes and failures and these lessons should
 be applied going forward.

 The most studied cases have involved examples of ‘forced growth’ where government-
 led initiatives using public funding, along with private funding, target and subsidize
 specific industries for development in a region. Some of the classic, earlier examples
 of this approach used across Canada, along with details on why they failed, can be
 found in Mathias (1971). 38 More recent cases of the forced growth approach in Alberta
 are summarized in Puscoi (2013) and Morton and McDonald (2015). These highlight
 the successes (such as Syncrude, the Alberta Energy Company, the Ethane-based
 Petrochemical Industry, the Canadian Western Bank and Pacific Western Airlines/
 WestJet), along with a dozen or so failures. In general, the successes have avoided
 the problems of the earlier Canadian experience but in addition they have tended to
 be rooted in some clear comparative advantage related to Alberta’s strengths such as
 natural resources, the existing industrial base, access to markets, entrepreneurial skill,
 innovation or scale-up economies. Further, they could demonstrate long-run financial
 viability and sustainability in the province under a range of realistic future scenarios and
 there was one or more clear market imperfections justifying government intervention. 39
 It is also noteworthy that the successful diversification policies have not been focused
 on promoting industries or sectors based on their cyclical stability or negative
 covariance with the existing economic base. Indeed, such a singular focus is unrealistic.

 While there are certainly cases where a forced growth approach is appropriate for
 advancing diversification aimed at greater stability, experience suggests that a broader
 approach should be the dominant one. This ‘shot gun’, market-based approach does
 not focus on trying to re-engineer the industrial structure or economic base, something
 which is extremely complex, interconnected and subject to rather gradual evolution
 over time. Rather, it emphasizes product diversification (expanding the range of
 products) over many industries, growing and diversifying markets for Alberta goods

 37
 Given the combination of differing policies and objectives typically embodied in these industrial development
 strategies it is difficult to separate out and estimate the independent effects on diversification. To do so
 requires the use of a detailed model of the provincial economy to run projections under different policy
 parameters and compare those projections to the actual or observed changes in the economy. An example
 can be found in Mansell (1990, 30-43).
 38
 The reasons for failure include: lack of objectivity and impartiality in the motivation for, assessment of and
 justification for publically funded industrial development projects; lack of evaluation that is arm’s length
 from politics; lack of thorough, impartial and independent cost-benefit analysis, viability analysis and risk
 analysis; dealing with private sector partners without a proven track record and lacking in terms of integrity,
 competence and financial sustainability; lack of government expertise to properly and accurately evaluate
 projects and proposals and ensure the information provided by partners is accurate and complete; failure to
 subject the projects to ‘market failure’ or ‘comparative advantage’ tests (to justify government intervention
 and determine whether the new industry could realistically be competitive without sustained public funding);
 poor or inadequate audits and financial controls; lack of sunset/contingency clauses to limit taxpayer liability
 or allow taxpayers to cut their losses in the event of unforeseen changes; and, over reliance on imported
 expertise with few provisions for the development and use of local skills.
 39
 Perhaps the most dramatic success has been the development of the in-situ oil sands industry. Much of this
 can be tied to the Alberta Oil Sands Technology and Research Authority (AOSTRA) created in the 1970s to
 advance research and technology development to unlock the vast oil sands resources that are too deep to
 mine. See Hastings-Simon (2019).

17
and services generally and encouraging innovation and adaptability to thrive in an
 environment of constant change. It is consistent with broadly-based diversification
 and development, its effects are not determined by the success or failure of a few
 projects, it imposes an element of market discipline that encourages efficiency, and it
 is consistent with diversity of opportunities for diversification and development across
 many sectors.

 This broad-based approach is consistent with the goals and objectives outlined
 in Alberta’s current recovery plan and, for that matter, the earlier strategies going
 back to 1984. What has often been lacking is the consistent adherence to the basic
 requirements for this approach to be effective. Most importantly, it requires a
 commitment to establishing and maintaining an attractive investment climate. This
 includes: a strong and stable fiscal position for the province; stable, competitive and
 predictable taxation policies, including low effective tax rates on business investments;
 a highly skilled and adaptable labour force; and an efficient system with short time
 frames for regulatory decisions on investments.

 Alberta has many strengths that support this broader approach to expand Alberta’s
 economic base and thereby reduce variability. It has high quality social and physical
 infrastructure, a large and vibrant education, research and development ecosystem,
 and, in many sectors, a strong culture of entrepreneurship innovation and adaptability,
 strengths honed through adversity. But there are areas where significant change
 is required. This includes: shifts to achieve fiscal stability and sustainability for the
 province; a focus on improving the regulatory and investment environment; better
 access to risk capital to bridge the ‘death valley’ where funding is often not available to
 commercialize and realize the benefits of many innovations developed in the province;
 infrastructure development and reduced interregional and other trade barriers to allow
 growth and market diversification for Alberta industries; and, a rebalancing of federal
 policies to reduce the net federal fiscal outflows from the province.

 Secular Instability – the Elephant in the Room
 By far the greatest concerns for secular instability of the Alberta economy must center
 on the long-term prospects for its oil and gas sector. It has been a major driver for the
 provincial economy (and the Canadian economy) for many decades, making outsized
 contributions to exports, investment, productivity, incomes and government revenues.
 However, it seems clear that the headwinds facing this sector, particularly since 2014,
 will only intensify going forward.40 Climate change concerns and policies addressing
 GHG (Green House Gas) emissions will undoubtedly only grow and increasingly target
 fossil fuel production, limiting both markets and access to capital.

 There is great uncertainty as to what this means for the future of Alberta’s oil and gas
 industry. For example, in the ‘Evolving Scenario’ of the Canadian Energy Regulator
 (CER), Alberta production of crude oil continues to grow41 (especially from in-situ oil

 40
 See Cosbey, Sawyer and Stiebert (2021) for a summary.
 41
 Although at much lower rates than in the past.

18
sands operations) until 2040 and the province’s natural gas production declines only
 slightly over the period to 2050. Although substantial new investments in carbon
 emissions reduction are required, this path would seem quite manageable for the
 province. In particular, the reduced contribution of the oil and gas sector to overall
 employment and incomes in the province would be gradual enough to be offset to a
 large degree by added growth in other sectors,42 aided by the types of diversification
 policies discussed in the previous section.

 In a scenario with the addition of even more aggressive policies to reach net-zero
 carbon emissions by 2050, the transition would be significantly shorter. However,
 even here, as outlined by Van Wielingen (2021) and by Bataille, Dobson, Kanduth and
 Winter (2021), a reasonable path of prosperity for Alberta over the longer term would
 be potentially achievable. It builds on the strong record of the sector and the province
 for innovation and adaptability. And it builds on the world class experience with energy
 technologies and on the wealth of both skills and resources (such as viable carbon
 storage sites) required for large scale carbon capture use and storage (CCUS) or for
 transitions to hydrogen and other low carbon fuels.

 However, there are other quite plausible scenarios that would have much more
 disruptive and negative impacts. For example, it is entirely possible to have extended
 periods of lower and highly volatile oil prices as low-cost foreign suppliers compete for
 shares in a stagnant or declining global oil market. As outlined in Cosbey, Sawyer and
 Stiebert (2021), in a lower price environment, particularly when price shocks similar to
 those observed in the past are incorporated, the impacts on the provincial economy
 would be large, negative and long term.43 It is not hard to come up with other examples
 of destabilizing external factors with similar implications for Alberta.44

 The main point is that these types of uncertainty imply considerable risks to the
 viability of the existing oil and gas industry and to long-run prosperity in the province.
 Indeed, this potential secular instability is the strongest case for more aggressive
 policies aimed primarily at diversification of products from the province’s various
 sectors and at diversification of markets for those products.45 However, it also makes
 the case for policies and policy changes: (i) that support the transitioning of the
 oil and gas sector; (ii) that anticipate and help manage the transitioning of workers
 and communities; (iii) that are aimed at strengthening, stabilizing and securing the
 province’s long term fiscal health; (iv) that focus more on the long term benefits,
 recognizing that these often take decades rather than years to materialize; and, (v)
 most importantly, consistently support a strong investment climate in the province.

 42
 For example, see Spencer and McConnell (2021) and Mintz, Wilson and Tingle (2021).
 43
 For example, with low prices, the projected average loss of oil and gas GDP would be $4.4 billion per year to
 2050 combined with an average loss of 6,300 (FTE) jobs per year. When oil price volatility is added, these
 respective declines grow to $24.3 billion and 24,300 jobs, approximately equivalent to a quarter of current
 levels. (Crosbey, Sawyer and Stiebert, 2021, p.vii).
 44
 Including shifts in U.S. policies that impair access to that dominant market for Alberta oil and gas.
 45
 In setting these policies the lessons and principles outlined in the previous section also apply.

19
6. SUMMARY
 The twin shocks of low oil prices starting in 2014 and the pandemic of 2020 have
 imposed substantial costs on Albertans. As in previous downturns there are renewed
 calls for diversification to address this economic instability. But it is seldom clear
 exactly what diversification means, how it is achieved and what role it can and should
 play in helping to stabilize the Alberta economy.

 Most commonly, diversification is taken to mean industrial diversification involving the
 addition of new and ‘better’ industries. But in reality effective diversification aimed at
 increasing stability is more likely to involve increasing the range of goods and services
 produced by existing sectors and facilitating the growth and diversification of markets
 for all exports from the region while building competitive substitutes for imports.

 By most measures, and contrary to common views, the Alberta economy has become
 much more diversified over time. With respect to employment diversification it ranks
 among the most diversified regional economies in Canada. However, in terms of
 incomes and value added (or GDP) it is less so, particularly reflecting the outsized oil
 and gas sector. By these latter measures it exhibits higher levels of cyclical instability
 than the benchmark provinces and, looking forward, there are concerns about secular
 or long-run instability related to the challenges to this sector.

 There is a case for policies to encourage industrial development and growth to address
 the cyclical and secular instability. However, the more commonly proposed forced
 growth approaches targeting specific industries are often problematic, particularly
 given the success rates and the potential for large trade-offs resulting in lower
 productivity, incomes, exports and government revenues. Rather, a broad-based
 approach is better suited and should be focused more on expanding the range of
 goods and services produced within the existing industrial structure and on market
 diversification. Alberta has many strengths that support this broader approach to
 expand Alberta’s economic base and thereby reduce variability. But some changes
 are required to achieve fiscal stability and sustainability, improve the regulatory and
 investment climate, increase access to risk capital, expand infrastructure and reduce
 trade barriers for market growth and diversification, and rebalance federal policies to
 reduce the fiscal drag on the provincial economy.

 The potential secular instability associated with the challenges facing the province’s
 oil and gas sector represents the highest risk to Alberta’s long term prosperity. The
 province has many strengths of adaptability and innovation developed through
 previous periods of adversity that will be critical in achieving a successful transition
 for this dominant sector. Strong leadership and consistent policies that anticipate and
 support this transition will be particularly important.

20
You can also read