CEDS 2017 2021 - COMPREHENSIVE ECONOMIC DEVELOPMENT STRATEGY South Delta Planning and Development District, Inc - South Delta Planning and ...
←
→
Page content transcription
If your browser does not render page correctly, please read the page content below
CEDS
 2017 - 2021

COMPREHENSIVE ECONOMIC
DEVELOPMENT STRATEGY

South Delta Planning and Development
District, Inc.

                                       1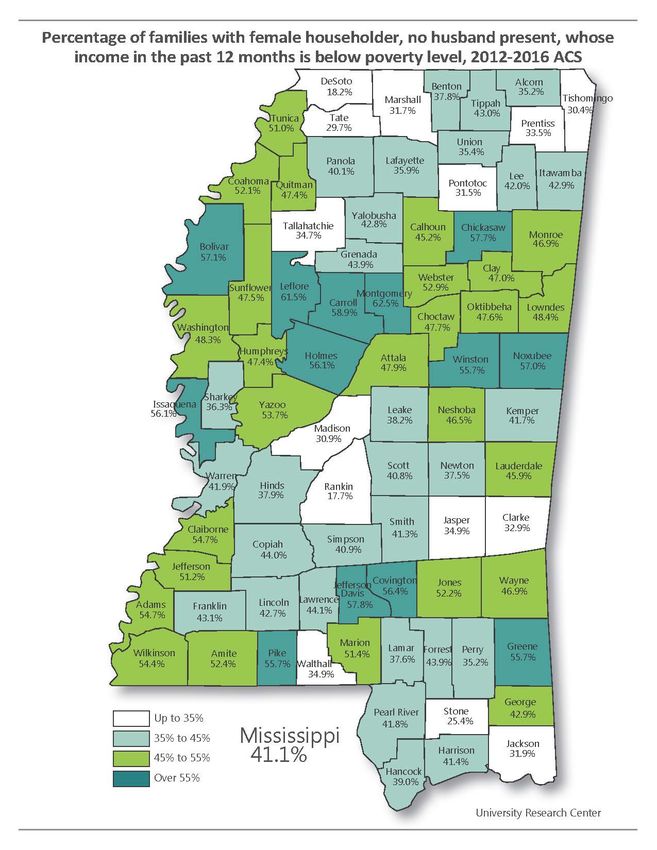
2
COMPREHENSIVE ECONOMIC
                    DEVELOPMENT STRATEGY

                              FOR THE
         SOUTH DELTA PLANNING AND DEVELOPMENT DISTRICT, INC.

                                      COUNTIES

            BOLIVAR                                          SHARKEY
            HUMPHREYS                                        SUNFLOWER
            ISSAQUENA                                        WASHINGTON

                                  September 2018

                               PREPARED BY
             South Delta Planning and Development District, Inc.
           1427 South Main Street, Suite 147, Greenville, MS 38702

The preparation of this report was made possible by a grant from the U. S. Department of
                  Commerce, Economic Development Administration.

                                           3
Table of Contents
Introduction.................................................................................................... 5
Organization and Management ....................................................................... 7
Regional Analysis ........................................................................................... 13
      Population .............................................................................................. 13
      Income and Education ............................................................................ 17
      Water ..................................................................................................... 30
      Sewer ..................................................................................................... 32
      Transportation ....................................................................................... 32
      Industrial Parks and Sites ........................................................................ 35
      Water Resources .................................................................................... 36
      Natural ................................................................................................... 37
      Political .................................................................................................. 37
      Economic................................................................................................ 38
      Social ..................................................................................................... 39
      Resiliency ............................................................................................... 39
SWOT Analysis ............................................................................................... 41
      Strengths ................................................................................................ 41
      Weaknesses ........................................................................................... 41
      Opportunities ......................................................................................... 42
      Threats ................................................................................................... 42
Goals and Objectives ...................................................................................... 43
STRATEGIC PROJECTS, PROGRAMS AND ACTIVITIES......................................... 45
ACTION PLAN ................................................................................................. 52
PERFORMANCE MEASURES ............................................................................ 53

                                                         4
Introduction
   The South Delta Planning and Development District, Inc. was incorporated under State Law as a
non-profit corporation on September 8, 1967. In January 1976, the Charter was changed and the
organization is currently a non-profit, non-taxable corporation as designated by The Internal Revenue
Code 501 (C) (3). In 1971, the Governor of the State of Mississippi changed the name from Economic
Development District, to Planning and Development District, and delineated its boundaries.
   The South Delta Planning and Development District, Inc. serves Bolivar, Sunflower, Washington,
Humphreys, Sharkey and Issaquena counties as well as the 35 municipalities within these six counties.
The region served has a land area of 3,602 square miles and an estimated population (July1, 2017) of
118,263.
   South Delta assists local governments with economic development efforts, workforce, housing,
community development, childcare and programs for the elderly. The District serves as the Regional
Clearinghouse Coordinator, the Delta Workforce Investment Opportunity Area administrator, the Area
Agency on Aging and the U. S. Census Data Affiliate.
   This Comprehensive Economic Development Strategy (CEDS) has been developed through a
cooperative effort between citizens, local elected officials, CEDS Committee members and District
personnel. Through surveys, meetings, research and observations this document provides an
overview of the District as a whole and the individual factors involved in development of the area. The
CEDS is to be the basis for district-wide planning and implementation activities for the next five years.
However, this document, the analysis and the ideas within are not static. This plan will be revisited
numerous times over the next five years and, with the assistance of each local government and the
CEDS committee, the plans, goals and objectives will be amended as necessary to reflect changes in
the area.
   This document includes broad goals and objectives of the region along with some of the readily
identifiable needs of the area and potential actions to address these needs. those needs. It also
includes an analysis of the strengths, weaknesses, opportunities and threats of the region. Apparent
in recent years is the need for useable regional planning documents to include information related to

                                                5
the resilience of the area with regard to natural disasters and a method of evaluating successes and
failures. This document includes both.
   The completed CEDS will be made available to the public for review and comment. The CEDS will
be available at the offices of South Delta Planning and Development as well as on the South Delta
website. The document will be provided to State and Federal agencies for integration into state and
regional economic development efforts.

                                               6
Organization and Management

INTRODUCTION
       The South Delta Planning and Development District, Inc. was incorporated under State
Law as a non-profit corporation on September 8, 1967. In January 1976, the Charter was
changed and the organization is currently a non-profit, non-taxable corporation as designated
by the Internal Revenue Code 501 (C) (3). In 1971, the Governor of the State of Mississippi
changed the name from Economic Development District, to Planning and Development District,
and delineated its boundaries.

BOARD OF DIRECTORS
       South Delta Planning and Development District is governed by county and municipal
governments through their selection of representatives to the Board of Directors. At the fall
meeting of the District, the second of two open meetings held each year, election of Board
members is carried out. Each county makes nominations from within their county and members
are voted on by the full Board.
       There are 25 directors serving staggered three-year terms. The Board, in accordance
with 13 CFR 304.2 (c)(2) and the Amended Bylaws of South Delta Planning and Development
District, Inc., is broadly representative of the principal economic interests of the Region,
capable of implementing the relevant Comprehensive Economic Development Strategy (CEDS)
and, unless otherwise prohibited by applicable State or local law, includes at least one Private
Sector Representative per county and/or Executive Directors of Chambers of Commerce, or
representatives of institutions of post-secondary education, workforce development groups or
labor groups. The District’s governing body shall have at least a simple majority its membership
who are elected officials. The number of directors from each county varies depending on the
population of the county. The three largest counties have five directors and the smallest

                                                 7
counties each have three. There is one at-large Director, a member of the Mississippi
Legislature from the six-county region. The current Board of Directors is listed on the following
page.

    Board Member                 County                            Representing
 Will Hooker                     Bolivar                       County Administrator
 Billy Nowell                    Bolivar                      Elected Official - Mayor
 Henry Phillips, Jr.             Bolivar                    Private Sector - Restaurant
 Bern Prewitt                    Bolivar               Private Sector – Agricultural Aviation
 Judson Thigpen, II              Bolivar                      Chamber of Commerce
 Willie F. Brown               Humphreys                     Private Sector - Farming
 Henry Reed, Jr.               Humphreys                   Private Sector – Home Health
 Richard D. Stevens            Humphreys               Elected Official – County Supervisor
 William Carpenter              Issaquena                          Private Sector
 Michael Parker, Sr.            Issaquena                   Elected Official - Alderman
 Eddie Holcomb, III             Issaquena              Elected Official – County Supervisor
 Willie Smith                    Sharkey               Elected Official – County Supervisor
 Merlin Richardson               Sharkey                      Private Sector - Retired
 Russell Stewart                 Sharkey                       Private Sector - Bank
 Barry Bryant                   Sunflower               Private Sector – Automobile Sales
 Clanton Beamon                 Sunflower                     Private Sector - Retired
 Edgar Donahoe                  Sunflower                     Private Sector - Retired
 Dennis W. Holmes,              Sunflower              Elected Official – County Supervisor
 Sr.
 Steve Shurden                  Sunflower           Executive Director Sunflower County EDD
 Helen Johnson                 Washington                            City Clerk
 Mike Gordon                   Washington                     Private Sector – Retired
 Marilyn Hansell               Washington                Elected Official - Chancery Clerk
 Cora Burnside                 Washington                     Elected Official - Mayor
 Kenny Thomas                  Washington                     Elected Official - Mayor
 Willie Simmons                 At-Large             Elected Official – Mississippi Legislature

                                                8
At the first board meeting following the District’s annual meeting, officers of the
corporation are selected by the Board of Directors. The President of the Board then appoints an
executive committee of not more than nine members. There will be two executive committee
members from each of the three largest counties and one member from each of the three
smallest counties. The executive committee, also serving as the loan committee, meets once a
month. The full board meets a minimum of once per year. Two meetings, open and advertised
to the public are held each year, one in the spring and one in the fall. The spring public meeting
provides an opportunity to present to the general public an overview of the District’s activities
of the previous year. The fall meeting includes election of new Board members and provides an
opportunity for discussion of plans for the upcoming year.

MEMBER GOVERNMENTS
       South Delta Planning and Development District is made up of six counties and the thirty-
five municipalities within those counties.

       Bolivar County                Humphreys County                  Issaquena County
          Alligator                       Belzoni                          Mayersville
           Benoit                           Isola                      Sunflower County
           Beulah                          Louise                          Doddsville
            Boyle                        Silver City                          Drew
         Cleveland                    Sharkey County                        Indianola
           Duncan                         Anguilla                         Inverness
         Gunnison                           Cary                           Moorhead
          Merigold                      Rolling Fork                         Ruleville
       Mound Bayou                                                         Sunflower
            Pace                     Washington County
           Renova                         Arcola
          Rosedale                      Greenville
            Shaw                        Hollandale
           Shelby                         Leland

                                                9
Winstonville                      Metcalfe

CEDS COMMITTEE
       The 2017 CEDS Committee is much larger, with a broader cross-section of the region’s
economic interest than in the past. These committee members were brought together by the
District and volunteered their input for the future of the region based on the roles they
currently and/or previously played within the community.

The CEDS committee is as follows:

 Henry Perkins         Bolivar County               Elected Official – Mayor - Winstonville
 Carey Estes           Bolivar County               Elected Official – Mayor - Rosedale
 Barbara Humphrey      Bolivar County               Workforce Development
 Cathy Dickerson       Bolivar County               Medicaid Waiver* - Nurse
 Michele Reed          Bolivar County               Medicaid Waiver – LSW** - Case Manager
 Tommie Brown          Bolivar County               Elected Official – Mayor - Alligator
 Eunice Sanders        Bolivar County               Private Sector
 Peggy Mengarelli      Bolivar County               Elected Official – Mayor - Shelby
 Evereth Stanton       Bolivar County               Elected Official – Mayor - Shaw
 Judson Thigpen        Bolivar County               Chamber/Industrial Development
 Will Hooker           Bolivar County               County Administrator
 Bern Prewitt          Bolivar County               Private Sector - Agriculture
 Bobbie Reed           Bolivar County               Elected Official – Alderwoman - Shelby
 Henry Phillips        Bolivar County               Private Sector – Restaurant – Retired
 Jana Meyer            Bolivar County               Medicaid Waiver – LSW – Case Manager
                                                    Educator
 Wanda Ledford         Bolivar County               Medicaid Waiver - Nurse
 Eddie Hall            Bolivar County               Medicaid Waiver - Nurse
 Lisa Houston          Bolivar County               Medicaid Waiver - Nurse
 Frances Flowers       Humphreys County             Private Sector
 Woodrow Johnson       Humphreys County             Elected Official – County Supervisor

                                               10
Henry Reed Humphreys County Private Sector – Home Health
Jerry Wood Humphreys County Elected Official – County Supervisor
James Bankhead Humphreys County Elected Official – County Supervisor
Carol Ivy Humphreys County Elected Official – Mayor – Belzoni
Ruffin Smith Humphreys County Elected Official – Mayor – Louise
Linda Short Issaquena County Elected Official – Mayor – Mayersville
William Carpenter Issaquena County Private Sector
William Holcomb, Issaquena County Elected Official – County Supervisor
Charles Weissinger Issaquena County Attorney
III
Michael Parker, Jr. Issaquena County Elected Official – County Supervisor
Marcus Hooker, Jr. Sharkey County Engineer
Sandra Nichols Sharkey County City Clerk – Rolling Fork
Merlin Richardson Sharkey County Private Sector – Retired - Agriculture
LaDonna Sias Sharkey County Elected Official – Alderwoman – Rolling
Russell Stewart Sharkey County Private Sector –
Fork
Andrew Smith Sunflower County City Manager
Banking/Workforce/Elected
Jane McCarty Sunflower County Medicaid Waiver - Nurse
Cheryl Beck Sunflower County Medicaid Waiver – LSW – Case Manager
Penne Davis Sunflower County Medicaid Waiver – LSW – Case Manager
Vescia Smith Sunflower County Medicaid Waiver - Nurse
Riley Rice Sunflower County Elected Official – County Supervisor
Clanton Beamon Sunflower County Private Sector – Retired – Non-Profit
Richard Noble Sunflower County Attorney
Patricia Plummer Sunflower County Medicaid Waiver – Nurse
Steve Shurden Sunflower County County Economic Development District
Dennis Holmes Sunflower County Elected Official – County Supervisor
George Holland Sunflower County Elected Official – Mayor - Moorhead
Kenny Thomas Washington County Elected Official – Mayor - Leland
Carolyn Baker Washington County Economic Alliance
Debra Wintory Washington County Greenville Chamber of Commerce
Blythe Hamburg Washington County Medicaid Waiver – LSW – Case Manager
Amanda Watson Washington County Medicaid Waiver – Nurse
11Brittany Stone Washington County Medicaid Waiver – LSW – Case Manager
Robin Williams Washington County Medicaid Waiver – Nurse
Sylvia Jackson Washington County Area Agency on Aging
Tracy Malone Washington County Medicaid Waiver – Supervisor
Ruby Moody Washington County Medicaid Waiver – LSW – Case Manager
Angela Carter Washington County Mississippi Access to Care
Kamesa Sibley Washington County Area Agency on Aging
Thressa Love Washington County Medicaid Waiver – LSW – Case Manager
Clara Martin Washington County Medicaid Waiver – LSW – Case Manager
Jennifer Price Washington County Go Greenville – College Student
Mike Gordon Washington County Private Sector – Retired Food Sales
Cora Burnside Washington County Elected Official – Mayor - Arcola
Sponjetta Sims Washington County Mississippi Access to Care
Mitzi Woods At-Large Workforce Development
Mike Philpot At-Large Delta Council
Chuck Herring At-Large Small Business Development
*Medicaid Waiver – Employed by South Delta Planning
**LSW – Licensed Social Worker
During the CEDS committee development process it became apparent that along with
private sector representatives and elected officials the people that saw all of the region and
communicated with the most citizens on a daily basis were the Medicaid waiver teams. These
teams as well as the other CEDS committee members provide insight into the issues facing the
region as they relate to growth and development. The CEDS committee brings with it
knowledge of a broad range of topics from health care to education and from private business
ownership to public policy. All of the areas of knowledge represented by the committee are
vital to the future development of the South Delta region.
12Regional Analysis
South Delta Planning and Development District includes 41 units of local government.
Six counties and thirty-five municipalities make up that number. The counties served by the
District are Bolivar, Humphreys, Issaquena, Sharkey, Sunflower and Washington. The regional
analysis section of this document serves to give insight into the traits and characteristics that
make up the area known as South Delta. Population and demographics, clusters, infrastructure,
financial resources and external forces will be looked at from a regional standpoint as well as on
a county-by-county basis.
POPULATION AND DEMOGRAPHICS
Population
South Delta is comprised of 3,602 square miles of land area. That equates to
approximately 8% of Mississippi’s land area. Based on U. S. Census Bureau 2017 Population
Estimates, there are 118,263 people living in the South Delta region. This is only 3.9% of the
estimated 2017 Mississippi population. The population of the District, between 2000 and 2010,
decreased by 17.47% while the population of the State increased. The District population has
shown another decrease of 6.9% between 2010 and 2016.
South Delta Planning and Development District experienced a total population decline
of 44.28% from 1960 to 2017. The majority of the District’s population resides in three of the six
counties. These three counties – Bolivar, Sunflower and Washington – have over 88% of the
population. Going hand in hand with this is the fact that the majority of the civilian labor force
resides in and is employed in these three counties. Residents of the three smaller counties, the
three southern counties of the District, must obtain employment from the limited opportunities
13in each county. Those unable to find employment within their own county must commute to the
surrounding areas.
POPULATION TRENDS PERCENT CHANGE, 1960 - 2017
% % % %
1960 CHANGE 1970 CHANGE 1980 CHANGE 1990 CHANGE
South Delta PDD 212,259 -13.6 183,312 -3.1 177,561 -7.8 163,786 -3.5
Mississippi (000) 2,178 1.8 2,217 13.7 2,520 2.1 2,573 10.5
Counties
Bolivar 54,464 -9.3 49,409 -7 45,965 -8.9 41,875 -3
Humphreys 19,093 -23.5 14,601 -4.6 13,931 -12.9 12,134 -7.6
Issaquena 3,576 -23.5 2,737 -8.2 2,513 -24 1,909 19.1
Sharkey 10,738 -16.8 8,937 -10.9 7,964 -11.3 7,066 -6.9
Sunflower 45,750 -19 37,047 -5.9 34,844 -5.6 32,867 -4.6
Washington 78,638 -10.2 70,581 2.5 72,344 -6.1 67,935 -7.3
% %
2000 CHANGE 2010 CHANGE 2017E
South Delta PDD 158,039 -17.5 130,429 -9.3 118,263
Mississippi (000) 2,844 4.3 2,967 0.6 2,984
Counties
Bolivar 40,633 -15.9 34,145 -6.4 31,945
Humphreys 11,206 -16.3 9,375 -11 8,342
Issaquena 2,274 -38.2 1,406 -4.8 1,339
Sharkey 6,580 -25.3 4,916 -9.8 4,435
Sunflower 34,369 -14.3 29,450 -11.8 25,981
Washington 62,977 -18.8 51,137 -9.6 46,221
E = Estimate
SOURCE:
U. S. Census of Population, General Population Characteristics, Mississippi 1960-2000.
U. S. Census Bureau, Census 2010.
U. S. Census Bureau, 2017 Estimates.
Generally, it can be stated that there are certain predominant population, labor force,
income and educational trends in the South Delta District that have existed in past years and
are still present in varying degrees today. In the past, the District’s economy was based solely
on agriculture. With the advent of mechanized farming, the need for laborers who possessed
14very little education and few job skills was diminished drastically. Laborers were forced to seek
employment elsewhere, usually in the industrialized cities of the North. In 2017, just as in 2007
and 2012, the District can be described as an economically depressed area experiencing a
continuing decline in population due to out-migration and death; unemployment rates that are
high; median family incomes that are extremely low; numbers of persons living below the
poverty level are high and educational levels that are below standard.
The population of the District has declined by approximately 93,996 persons between
1960 and 2017. While all counties in the District have experienced significant population losses
during the past several decades, Issaquena County has experienced the greatest loss in
percentage of population. Issaquena County lost 62.56% of its population during the period
1960-2017, while Humphreys County followed closely with a population of loss of 58.70%. In
terms of absolute numbers, Washington County lost the greatest amount of population during
the same period amounting to over 32,000 persons.
A continuing decline of the population in the South Delta District can be attributed to
out-migration. During the period from 1990-99 there were 26,767 births in the District.
Between 2010 and 2017 the number of births in the District had decreased by 51.5% to 12,981.
The number of deaths in the District,10,557, during the same period, 2010 – 2017, resulted in a
natural increase of 2,424. Despite the fact that births in the District outnumber deaths, overall
population continues to decline. Out migration continues to outnumber the natural increase in
population occurring from births and deaths at a rate of approximately 4 to 1.
Based on 2016 U. S. Census American Community Survey Data, the District’s median age
is 36 years while Mississippi’s is 36.7 and the United States’ 37.7. The District’s median age in
1960 was 19.9 years indicating the District’s population is becoming somewhat older. Of the
District’s population in 2016, 35.8% were 0-24 years old while 13.4% were 65 years of age or
older. This left 50.8% of the District’s population in the productive working age group of 25-64.
152016 POPULATION BREAKDOWN BY AGE GROUP
Preschool School Age College Age Young Adult Older Adult Older
Bolivar County 2,438 6,007 3,826 8,429 8,195 4,720
Humphreys County 623 1,804 816 2,026 2,313 1,240
Issaquena County 94 114 90 436 366 252
Sharkey County 265 905 440 1,058 1,294 700
Sunflower County 1,718 4,731 3,119 7,760 6,909 3,187
Washington County 3,766 9,234 4,702 11,584 12,884 6,654
South Delta PDD 8,904 22,795 12,993 31,293 31,961 16,753
Percent of District 7.14% 18.28% 10.42% 25.09% 25.63% 13.43%
Total District Population 124,699
U. S. Census Bureau, American Community Survey
Preschool: 0-4; School Age: 5-17; College Age: 18-24; Young Adult: 25-44; Older Adult: 45-64; Older: 65 Plus
Generally, over the last decade, people have migrated outside the bounds of the District. From
2000-2010 the District’s urban population decreased 15.56% and the rural population decreased by
22.11%. The District’s loss in population is escalating and no longer limited to primarily urban residents.
Of the 35 incorporated municipalities within the South Delta District, only five (four of which
were located in Humphreys County) experienced population losses from 1960-70, sixteen experienced
losses from 1970-1980, 26 experienced losses from 1980-1990 and 15 experienced losses from 1990-
2000. The 2010 Census indicated that all but two of the District’s municipalities lost population during
the period of 2000 – 2010. Further, the Census data reflects that some of the larger incorporated
communities of the District that experienced a population gain during the period of 1980-1990 have lost
considerably more population than was gained during the years 1990-2010.
Strategic Finding: The District as a whole has declined significantly in both its urban and
rural populations from 2000 to 2010. In terms of total urban population, the South Delta is
virtually even with where it was in 1960. There will be no drastic upward changes in population
unless there are significant changes in economic conditions. Until opportunities and quality of
16place improve, the steady out-migration of population will continue. Therefore, efforts must be
placed on retaining and attracting population to the area. The “brain drain” must be addressed.
Arresting the “brain drain” and drawing younger, educated individuals either back to the area
or to it for the first time always brings about the age old “chicken and egg” conundrum. Which
comes first? Do you focus on recruiting industry with the idea that younger people will come to
the jobs? Do you focus on attracting the younger people in the hopes that industries will
choose to locate where the bright, young, well-educated work force is located? Regardless of
which way is correct, a path must be chosen and followed. This trend of out-migration,
especially among the college aged/young adult groups, cannot continue. Everything else that
leads to a turn around in the fortunes and livability of the District depends on having some
younger, educated and energetic population in the area.
Income and Education
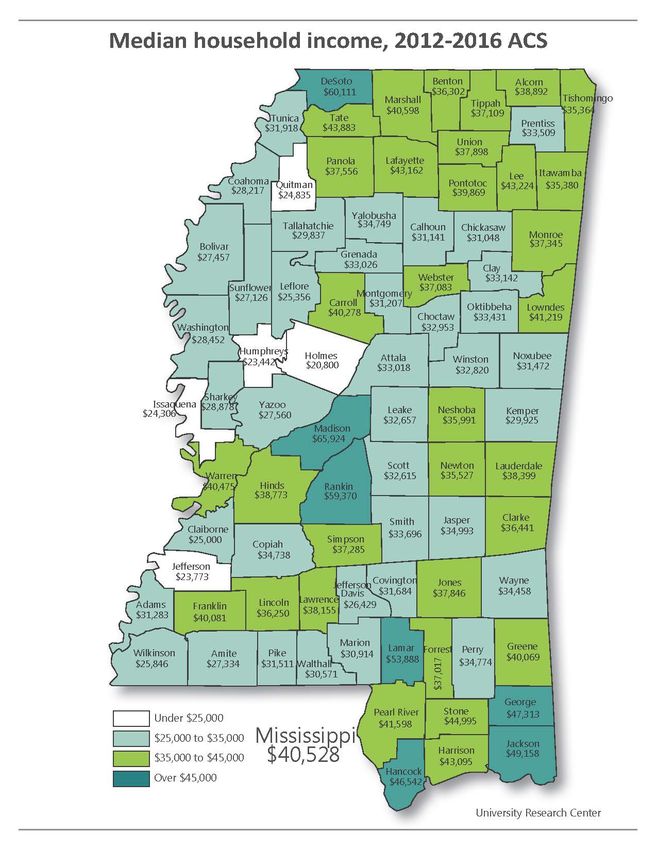
The average 2016 median household income of the District is $28,282 while that of the
State is $40,528 and the Nation is $55,322. The District’s average median household income,
higher than it was in 2012, is still significantly lower than the State’s and Nation’s. Based on
2016 numbers, 19.5% of the 41 units of local government in the South Delta area had a median
household income of less than $20,000 and 78% had a median household income of less than
$30,000. From 2010 to 2016 the percentage of households in the district with an annual
income of less than $10,000 is holding steady at 18%. The percentage of households with an
income in excess of $50,000 is 24.61%. Economically, the District continues to lag, significantly,
behind the State and Nation. The percentage of households in Mississippi and the United
States with an annual household income of $10,000 or less is 11% and 7% respectively. These
rates are well below that of the South Delta region. The State of Mississippi has 41.4% of
households receiving an annual income of $50,000 or more; the nation’s percentage is 54. Both
of these are drastically higher than the 24.61% of South Delta.
1718
Transfer payments continue to make up a large share of personal income for all South
Delta counties. Though no single county in the South Delta area has the highest percentage of
transfer payments as a component of personal income in the state, the regional average is
37.7%. This percentage is well over Mississippi’s percentage of 26.7. Transfer payments are
government payments to individuals that are not paid in return for goods and services to the
government. Examples include social security, unemployment compensation and welfare
payments.
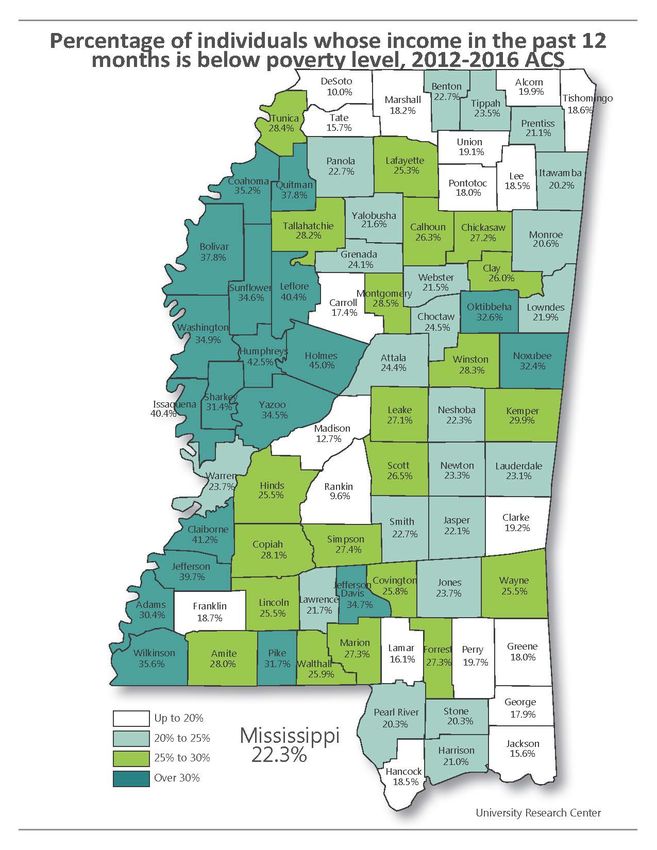
In 2010 36.9% of South Delta’s citizens were living below the poverty level. In 2016 that
percentage had decreased slightly to 36.1%. Although slightly improved, the percentage of
persons living below the poverty is still over twice the national percentage. The segment of the
population with the highest percentage below the poverty level is family households with a
female head of household.
1920
21
The educational attainment level within the District is improving; however, it is still
lower than that of the State and the Nation. In 2016 74.4% of the District’s total population
above 25 years of age completed high school or above, compared to 83% for the State and 87%
for the Nation. Education levels in the District have improved considerably since 2000, from a
50.7% high school completion percentage to 74.4%. These improvements are encouraging, but
there is still much to be done in order for the South Delta region to compete in the State, the
Nation, and the World.

       Strategic Finding: With regard to income and education, these two factors must be one
of the major focal points for improvement of the region. All other man-based factors are
dependent on these things for improvement. The improvement of workforce training is helping
to make the region more competitive in attracting skilled employment opportunities; however,
as long as the level of educational attainment among the working age population is so much
lower than the State and the Nation, significant economic development and high paying job
opportunities will continue to pass the region by.

Employment and Labor Force

       The District’s labor force steadily declined from 66,811 in 1960 to 57,565 in 1970,
rebounded in 1980 to 60,865 continued upward in 1990 to 64,030 and has fallen drastically to
55,624 in 2010 and even farther in 2017. The 2017 District labor force was 42,720 of which
39,548 were employed. The June 2018 District labor force, according to the Mississippi
Department of Employment Security, was 43,000 of which 39,460 were employed. Although,
the District unemployment rate is trending downward, it is doing so much more slowly than the
state and nation. The June, 2018, unemployment rate for the South Delta area was 8.2% and
for July, 2017 it was also 8.2%. These two numbers don’t give the impression that anything is
improving; however, looking at the 5-year trends for each of the counties in the District as well
as the state and nation proves that things are taking an overall turn for the better throughout
region and the nation. Bolivar County’s unemployment rate in 2013 was 12% and in 2017 it
was 7.7%. Humphreys County’s unemployment rate in 2013 was 18.2% and in 2017 10.6%.
Issaquena County had an unemployment rate of 22.2% in 2013; however, in 2017 the

                                                22
unemployment rate was down to 10.2%. Sunflower County’s unemployment rate for 2013 was
14.7% decreasing to 8.2% in 2017. Washington County had a 2013 unemployment rate of
15.5% and had a rate of 8.2% in 2017. Mississippi’s 2013 unemployment rate was 9.1% and
that of the nation was 7.3%. Both the state and the nation have seen major improvement in
these numbers with 2017 rates of 5.8% and 4.3% respectively. None of the Distric’s
unemployment numbers indicate that the economic turnaround being experienced throughout
the rest of the country has fully made it to the Delta but, they do indicate that things are on the
way to improving if all factors are addressed.
Assuming a continued average labor force participation rate of 49.95%, or better as
opportunities improve and people re-enter the labor market, the region is poised to fulfill the
employment needs of the type businesses that have become the focus of ongoing and
improved recruiting efforts throughout the Delta.
Strategic Finding: It is apparent, from the information provided, that the
unemployment rate in the South Delta region is still well above that of the State and the
Nation; however, the situation appears to be improving as more partnerships are formed, more
collaborative efforts are launched and innovative thinking is utilized. Bringing new job
opportunities to the area is very important. However, retaining the jobs currently in the area is
also of the utmost importance. It is imperative that the counties of this region and SDPDD work
together to provide existing businesses the opportunities for expansion and prosperity.
2324
One component of this is a workforce that improves and advances with time and
technology. To this end the District is the fiscal agent for the Delta Workforce Investment Area
(DWIA). It provides the administrative functions associated with the Workforce Investment Act.
Six South Delta staff members currently provide support to the Board and coordinate WIA
programs and activities in the 14-county workforce area.
       In accordance with the Workforce Investment Act of 1998, it is the purpose of the Delta
Area Workforce Investment Area Board to provide workforce activities in the local area that will
increase the employment, retention and earnings of participants and increase occupational skills
attainment by participants, and, as a result, improve the quality of the workforce, reduce welfare
dependency and enhance the productivity and competitiveness of the fourteen counties which
constitute the Delta Workforce Area.
       In FY’07, the DWIA was awarded $10 million to serve WIA eligible adults, dislocated
workers and youth, since then the awards have steadily decreased, as is the case with all Federal
and State funding, yet the need continues to increase as the Region, State and Nation fall farther
behind the rest of the world in the ultra-competitive global market. Seven WIN Job Centers (one-
stop operators) in the 14 counties provide adult and dislocated worker services. The DWIA
focuses a lot of activity on economic development to recruit new businesses and retain existing
businesses through On the Job Training and Customized Training. WIA eligible participants are
provided services through Individual Training Accounts to help them get a first job or a better
job.
       New efforts are underway in the DWIA to focus on sector training initiatives to address
local needs. The DWIA will be exploring specific job sectors and will allocate a certain amount of
funds to that specific sector. Some areas to be considered include health care, hospitality and
advanced manufacturing.
       These sector initiatives will focus on key industries, promote education and training,
provide opportunities for career advancement and create new jobs while building the area’s
skilled workforce. These efforts will also help create shared objectives and priorities between
public and private partners to leverage new and existing resources.

                                               25
Housing
Housing characteristics in the South Delta region are directly related to the environment
of the population. One of the negative housing characteristics in the area, as well as in the
State, is the age of housing. Of the 52,086 housing units in the six-county area 12.67% were
constructed prior to 1949. This percentage, though not large, does indicate some definite
deteriorating factors among the housing stock in the area. This figure is not quite double the
percentage for the entire state. Conversely, the percentage of housing units in the region
lacking complete plumbing and/or kitchen facilities is half that of the state. This is an indicator
that some efforts are being made to improve the existing housing stock. The fact remains that
with these older units it is difficult to maintain and make repairs especially when the population
is aging and a primary source of income in the area is transfer payments. It is also an
unfortunate by-product of population loss, as well as, the regional and national economy that
there is very little housing construction taking place in the region. not much of a new housing
stock to replace these older homes. Only 4% of the area’s housing stock has been constructed
since 2010.
According to the 2012 – 2016 American Community Survey conducted by the U. S.
Census Bureau there are 19,929 renters in the South Delta area. This reflects a slight increase
in renters from the 2010 Census. Some studies have shown a need and desire among renters to
become homeowners; however, financing for low- and moderate-income families is often
difficult or even impossible to obtain. Experience has shown that not everyone with a desire to
own a home is capable of doing so. South Delta has, when programs are available, attempted
to address this need through some innovative financing and down payment assistance. These
programs, available to specific units of government, have virtually disappeared. The programs
that are now available are on an individual basis and no longer involve local governmental
units.
A number of the 24,664 owner-occupied units in the District area need minor to major
repairs. The District from 2005 to 2015 assisted local units of government with
reconstruction/rehabilitation projects that addressed 137 sub-standard, dilapidated housing
26units. This program was extremely helpful to many low and very low-income homeowners.
(See the following table.) Unfortunately, since 2015 the program has changed administrative
agencies and shifted priorities. These factors along with very limited funding for HOME (Home
Investment Partnership Program) have made it nearly impossible to help those homeowners
that are truly in need.
HOMEOWNER REHABILITATION/RECONSTRUCTION PROJECTS 2005 - 2015
Units Units
Project Year Built Project Year Built
Silver City 2005 4 Rosedale 2012 3
Silver City 2007 2 Inverness 2009 4
Benoit 2005 4 Inverness 2012 2
Benoit 2007 4 Shaw 2008 5
Drew 2005 4 Hollandale 2008 5
Drew 2007 4 Hollandale 2011 3
Drew 2012 4 Anguilla 2009 5
Mayersville 2006 3 Moorhead 2009 2
Mayersville 2008 1 Washington County 2009 4
Mayersville 2011 2 Louise 2009 3
Sunflower 2006 4 Bolivar County 2009 3
Sunflower County 2006 5 Rolling Fork 2010 2
Sunflower County 2011 5 Leland 2010 3
Sunflower County 2015 5 Leland 2015 2
Isola 2009 2 Issaquena County 2011 2
Isola 2012 2 Ruleville 2011 3
Arcola 2007 3 Greenville 2012 4
Arcola 2010 5 Shelby 2013 4
Humphreys County 2007 4 Sharkey County 2013 5
Belzoni 2007 2
Rosedale 2007 4 TOTAL 137
27BEFORE
AFTER
Strategic Finding: With the
realization that it is very much
a component of economic
development, housing has become an issue in the area. Housing stock deficiencies, especially
houses affordable to middle income families are a serious deterrent to industries that may
desire to locate here. Houses are not being built in the District. According to some urban and
regional planners, “if you aren’t building, you are dying”.
Clusters/Sectors
According to the Sector Strategy Plan developed by the Delta Workforce Development
Area, the South Delta region has three significant clusters/sectors, manufacturing, health care,
and agribusiness. Along with these significant clusters/sectors there are a few other industry
categories that, although not included in the Sector Strategy, are currently relevant enough to
28remain a focus of industry/job recruitment efforts. (aerospace, metalworking, automotive,
distribution, and plastics) Based on information obtained from the Mississippi Department of
Employment Security, retail/wholesale has the highest number of employed persons in the 14-
county Delta Workforce Area. Away from the more urban settings of the far north delta, retail
is not necessarily sustainable as a growing sector for employment. The three significant sectors
were established based on job growth projections, sustainability and Delta Strong. Agriculture,
although no longer the basis for all of the economy of the region, is still a major component. In
2006 the largest cluster in the area appeared to be Agribusiness, Food Products and Services.
Since then agribusiness has slipped behind health care and social assistance. Processed food
production is still a part of the manufacturing-based sector; therefore, it brings together the
sectors of manufacturing and agribusiness.
The District has the largest medical facility within a 120-mile radius. Four of the six
counties in the region have hospitals located within their boundaries. Delta Regional Medical
Center, located in the City of Greenville, is the largest medical facility in the area. Issaquena
County and Humphreys County do not have medical facilities of their own; however,
Humphreys County has recently participated in a pilot project with the University of Mississippi
Medical Center to establish a critical care clinic. The health care and social assistance sector
has begun to outpace agribusiness as a source of employment in the region. The
manufacturing sector, in the current climate, is where the majority of job
creation/improvement strides can be made. The Delta Strong initiative started to bring about
improvement and growth in the manufacturing sector/cluster.
Delta Strong is a new regional branding, marketing, and business
attraction program aimed exclusively toward attracting new
manufacturing opportunities to the Mississippi Delta. The
initiative is supported by private sector financial institutions, our
planning and development districts, port terminals on the
Mississippi River, local economic development foundations, and
our utility and infrastructure partners. This strategy, led by the Delta Council Development
Department, is a four-year plan which includes outcome measurements and transparency that
29positions the Mississippi Delta region as a major player in the attraction of manufacturing,
distribution, and warehousing operations.
Although tourism is not considered a significant sector/cluster it is an up and coming
component of the local economy and employment. The region is steadily taking hold of the
tourism opportunities that are related to the region. Music and museums based on music and
musicians are now a force in the local economy and driving hospitality industry
entrepreneurship. The construction of the B. B. King Museum, the Grammy Museum Mississippi
and the Delta Music Institute has been the catalyst for new restaurants, hotels and shops that
are springing up in the area. In addition to music, outdoor sporting activities such as hunting
and fishing are helping to bring about outfitter and guide businesses as well as sporting goods
retailers.
Strategic Finding: The information garnered from the sector/cluster analysis is an
indicator of “the way things have been” in the South Delta area but, it is also an indicator of the
opportunities that can be taken advantage of moving forward. The low levels of training and
educational attainment have left the majority of the labor force qualified for and working at the
lowest paying jobs. This is where the Workforce Development Area comes and provides the
training necessary for these workers to fill the gap of the middle-skill worker shortage. These
sectors/clusters must be nurtured in order to provide more opportunities for employment and
economic growth.
INFRASTRUCTURE
Water
The principal difference between the infrastructure of urban and rural areas is in the
capacity of the water and sewer systems. Urban networks generally have a superior capacity
per person in both quantitative and qualitative evaluations. Water supplies in the urban area
are more reliable and have better treatment facilities. A greater amount is available on a per
capita basis for domestic purposes and also for fire flows in emergency situations. In addition to
municipal water and sewer systems, there are water associations operating within the District
30to provide domestic water supplies to rural areas. Most of these were organized through the
United States Department of Agriculture – Rural Development and were designed to furnish
domestic needs only. In most instances, industrial uses of fire flow demands would be beyond
the design capacity of such systems.
In accordance with the Federal Safe Drinking Water Act of 1996, the State of Mississippi
has implemented a Capacity Development Program to improve the technical, managerial, and
financial capacity of the state’s public water systems and to prevent the creation of new
systems that do not have the technical, managerial, and financial capacity to comply with
current and future provisions of the Act. Included in the requirements of the Act is the
development of an annual report on all of the public water systems in the State of Mississippi.
This report provides much needed information in the development of projects throughout the
District. It not only indicates water production capacity but provides ratings to discern the
capability of the system on the issues of technology, management and finances. These factors
must be considered for projects to improve these water systems as well as for projects that rely
on access to water.
Strategic Finding: It appears that the populated areas of the region are generally served
by public water systems. There may be some pockets of population that are too remote to be
included in an organized water system and must rely on private wells for access to water.
Many of the unserved areas surrounding municipalities or organized communities have been
recently connected to existing systems. Those remaining will be connected as funding becomes
available. One of the major concerns of the area is not access to water but, access to water
systems that are technologically sound, well managed and financially capable of remaining
viable. The second, equally major concern is the aging components of the municipal water
systems in the region. Many of these systems are beginning to experience catastrophic failures.
These issues will have to be at the forefront of infrastructure improvement planning for many
years to come.
31Sewer
Urban sanitary wastewater facilities are characterized by more sophisticated treatment
methods and consequently higher quality treated effluent. Most of the small towns in the
district utilize lagoon treatment while the largest city uses a mechanical treatment plant.
Several of the communities that were utilizing mechanical plants then changed to lagoon type
treatment for cost savings are being forced to make plans to return to the mechanical systems.
This issue has just recently arisen with the changes in the permitted limits for discharge. Most
of the small communities in the region cannot meet the new limits because of location and
environment. These communities had discovered that the operation and management costs
related to mechanical treatment was too high for their financial capacity. Unfortunately, the
choices for their wastewater treatment may become very limited.
A number of the unincorporated communities in the District have formed utility
districts, which allowed them to provide sewer service to area residents. These systems may
face the same uncertain future as the municipal systems and may have to return to a form of
septic system for their wastewater service needs.
Strategic Finding: More and more information on the health hazards of poor
wastewater handling is being disseminated to the public. As this happens more communities
are seeking ways to improve their quality of place and the human condition of their area.
Additionally, the changes to discharge requirements implemented by the Environmental
Protection Agency will bring about the need to revisit wastewater systems that have recently
been addressed. Efforts to assist both units of local government and unincorporated
communities in identifying funding for addressing these issues must continue. These efforts are
not only vital to maintaining a healthy populace but also in attracting people and business
opportunities to the region.
Transportation
The South Delta area has a multi-modal transportation network capable of handling
almost any type of cargo. Proximity to the Mississippi River makes water transportation of bulk
32materials possible. The public ports at Greenville and Rosedale offer shippers the opportunity
to import or export large volumes of goods to regional, national or international markets.
Numerous industrial port facilities also line the harbor front. Unfortunately, both of these port
facilities are full and no longer have useable land available to offer industries wishing to locate
at the ports.
The remainder of the transportation system in the District is characteristic of the State
as a whole. The principal north-south and east-west thoroughfares are U. S. Highways 61 and
82. Greenville, the largest city in the District, is the site of the relatively new Highway 82
Bridge. Greenville has one of the four bridges in the state that crosses the Mississippi River.
The crossing currently gives Greenville a locational advantage because of its exposure to larger
volumes of traffic and its access to a greater regional trade area. Highway 61 passes through
Leland, which is eight miles to the east of Greenville. A secondary roadway network that serves
even the smaller communities with paved access roads complements the primary
thoroughfares. The counties build and maintain a network of farm-to-market roads that are
either paved or gravel surfaced. This operation is assisted by both State and Federal funds, but
the county provides the manpower and management.
The South Delta Region, just like the remainder of the state, is experiencing a critical
situation on the farm-to-market roads serving the area. Based on the current criteria and
inspections conducted by the Federal Highway Administration, there is a need to rehabilitate or
reconstruct 84 currently closed timber bridges located within the six-county south delta
footprint as possible. The number of bridges to be addressed will rise as the next round of
inspections is conducted. The long-range plan is to rehabilitate or reconstruct these timber
bridges with concrete pilings or concrete box culverts as each bridge situation dictates. The
current timber bridges, although some are 60 or 70 years old, outlived their design life at
around 30 or 40 years. Concrete components, with care and maintenance, could possibly
double the design life of these bridges.
A proposal for another bridge over the Mississippi River has been approved as part of
the construction of Interstate 69 (I-69) an intercontinental highway linking Canada, the United
33States and Mexico. It appears that the most likely route for I-69 will be through southern
Bolivar County and to the north of the City of Greenville. Greenville has been identified as a
location requiring further study for access and connectivity. The location of I-69 and any
connector routes through the South Delta Planning and Development District would have a
major economic impact on the region.
The only commercial airport in the District is located in Greenville, which is within 75
miles of any point in the District. The regularly scheduled commercial flights are regionally
oriented, providing a commuter style connection to the larger air facility in the City of Nashville,
TN. Chartered flights and air freight services are also available.
The Genesee and Wyoming Railway, formerly known as the Columbus and Greenville,
provides the South Delta District with rail-freight service. The Genesee and Wyoming is an east-
west railway that once crossed the entire state. Now the railway only provides service from
Greenville to Greenwood. This service is marginal at best considering the current track
conditions. The Great River Railroad, although still in existence, is no longer in operation. Rail
access to industrial sites is currently very limited. The Great River Railroad has been the focus
of an effort to find funding for revitalization of the north south connector that would serve the
growing Port of Rosedale and provide east west rail access at Greenville.
Strategic Finding: Transportation facilities in the South Delta region must be improved
in order for the area to be competitive with the state, the nation and the world. Every
component of the transportation system within the District needs improvement. Some, like the
Port of Greenville and the Rosedale-Bolivar County Port, have taken steps to improve their
facilities and the services offered. However, both of these port facilities have many more
improvements that could be made, not the least of which is taking the steps necessary to open
more land for development.
Air transportation, although not terrible considering the population of the area, should
continue to be at the forefront of improvement considerations. An area that does not have
access to a functioning commercial airport will not be considered for business location over an
34area that does. Therefore, it is imperative that the Mid-Delta Regional Airport be maintained at
its current level of service and improved with every opportunity.
Rail service in the District is not even remotely close to the level necessary to make this
area a viable option for business location or in support of business that has located elsewhere
in the state. The Great River Railroad, that provided service from the Port of Rosedale to a
junction with the Genesee and Wyoming in Leland, is currently not in operation due to age and
deterioration of the equipment and rails. The Great River Railroad is actively seeking
opportunities to rehabilitate the line. The Genesee and Wyoming has shut down service
beyond Greenwood. With the location of the Toyota plant at Tupelo and the steel mill in
Columbus, it is critical that the South Delta region have rail access to the eastern side of the
state. Plans must be made for the future to keep access to rail service in South Delta area. Even
though rail traffic has been very light in recent years, the total loss of rail service would be
highly detrimental to economic development in the area.
Industrial Parks and Sites
Nine local governments in the District – Greenville, Cleveland, Indianola, Shelby,
Rosedale, Belzoni/Humphreys County, Rolling Fork, Issaquena County and Hollandale – have
organized industrial parks. Several smaller communities have industrial sites reserved and
serve those sites with utilities, but they are not of a scale that would classify them as industrial
parks.
Light and heavy industries are located throughout the District and their contribution to
the economic growth of the District has been considerable. The total land area presently
occupied by industrial users is very small with the greatest concentration being in Greenville,
Cleveland and Indianola. The larger communities are better able to support the needs of most
manufacturers. Consequently, it can be anticipated that their dominance of attracting new
industries in the District will continue.
Strategic Finding: Currently the only shortage of industrial development space within
the District is at the Port of Greenville and the Rosedale-Bolivar County Port. All other
industrial parks and sites have land available for development. Most of these sites are served
35with the necessary infrastructure. However, some of the infrastructure serving these industrial
parks is beginning to age considerably and some has been surpassed by the needs of industries
currently being served. Future efforts must include upgrading and maintaining existing
industrial parks and sites. This is especially true in light of the current Delta Strong efforts to
focus on smaller manufacturing recruitment. Beyond this, efforts must focus on the
development of larger regional industrial development areas designed for the larger type of
industry such as an automotive manufacturing facility. This need not be the first item of
business but as I-69 continues toward completion it should be addressed.
Water Resources
One of the primary natural resources of the District is the abundant water supply. In
addition to the Mississippi River, which forms the western border of the District, underground
aquifers have provided domestic water supplies of very good quality. Lakes and ponds provide
numerous opportunities for water-oriented recreation as well as aesthetic enhancement of
building sites.
The Yazoo River is navigable in the eastern portion of the District, and a port has been
proposed for Belzoni. The ports of Greenville and Rosedale, along with a future port at Belzoni,
will provide reasonable access to water transportation. Then all areas of the South Delta region
will be within 50 miles of a river port.
Strategic Finding: In recent years it has been reported that groundwater supplies are
dropping and measures should be undertaken to conserve the State’s water resources. The
dwindling water supplies in the Delta are due primarily to heavy agricultural uses such as crop
irrigation. The groundwater is not being replaced fast enough to offset the consumption. Local
farming operations are beginning to embrace water reclamation activities for the conservation
of this valuable resource.
Port expansion projects, as with all new major construction projects in the South Delta
area, will have careful environmental evaluations in order to assess the impact of the projects
on their surroundings. Various sections of the Environmental Policy Act of 1969 have set forth
methods of improving the quality of previously damaged areas, such as streams polluted by
domestic waste. In order to assure the continued potential of the District’s natural resources
36for future generations, it is imperative that our present action be consistent with conservation
goals for the future.
EXTERNAL FORCES
Natural
The State of Mississippi, like any other state, is susceptible to a number of natural and
man-made hazards. The South Delta region faces the same hazards as the rest of the state and
some not associated with the entire state. The region, just like the rest of Mississippi, is
threatened annually by devastating tornadoes, drought and severe thunderstorms. Not as
frequent, but just as devastating, is the threat of winter storms and hurricanes that approach
the state from an angle leaving the region vulnerable to spin off tornadoes and flooding. The
South Delta region, by its very nature, is extremely vulnerable to flooding resulting from storms
and prolonged periods of rain. Additionally, the threat always exists for a break in the levee that
retains the Mississippi River.
In addition to threats already mentioned, is the region’s location along the New Madrid
fault. This location expands the list of natural threats to include earthquakes. Though the threat
of an earthquake may seem very small it is a very real possibility and like the others must be
included in emergency planning efforts.
Political
There are several politically based external forces that are at work in the South Delta
Planning and Development District. These political forces include Federal and State programs as
well as the current pro-business administration.
Portions of the District were included in the Mid Delta Empowerment Zone Alliance.
This Empowerment Zone designation, a joint program through the U. S. Department of Housing
and Urban Development for urban zones and the U. S. Department of Agriculture for rural
zones, had a ten-year time frame. Even though the time frame for the Empowerment Zone has
expired, the benefits of this designation are still in evidence. The broad and flexible usage of
37You can also read