The Contagion Externality of a Superspreading Event: The Sturgis Motorcycle Rally and COVID-19 - IZA DP No. 13670 SEPTEMBER 2020 - Institute of ...
←
→
Page content transcription
If your browser does not render page correctly, please read the page content below
DISCUSSION PAPER SERIES

IZA DP No. 13670

The Contagion Externality of a
Superspreading Event:
The Sturgis Motorcycle Rally and COVID-19

Dhaval Dave
Andrew I. Friedson
Drew McNichols
Joseph J. Sabia

SEPTEMBER 2020
DISCUSSION PAPER SERIES

IZA DP No. 13670

The Contagion Externality of a
Superspreading Event:
The Sturgis Motorcycle Rally and COVID-19
Dhaval Dave Joseph J. Sabia
Bentley University, IZA, NBER and CHEPS CHEPS, San Diego State University and IZA
Andrew I. Friedson
University of Colorado Denver and CHEPS
Drew McNichols
CHEPS, University of San Diego-California
and San Diego State University

SEPTEMBER 2020

Any opinions expressed in this paper are those of the author(s) and not those of IZA. Research published in this series may
include views on policy, but IZA takes no institutional policy positions. The IZA research network is committed to the IZA
Guiding Principles of Research Integrity.
The IZA Institute of Labor Economics is an independent economic research institute that conducts research in labor economics
and offers evidence-based policy advice on labor market issues. Supported by the Deutsche Post Foundation, IZA runs the
world’s largest network of economists, whose research aims to provide answers to the global labor market challenges of our
time. Our key objective is to build bridges between academic research, policymakers and society.
IZA Discussion Papers often represent preliminary work and are circulated to encourage discussion. Citation of such a paper
should account for its provisional character. A revised version may be available directly from the author.

 ISSN: 2365-9793

 IZA – Institute of Labor Economics
Schaumburg-Lippe-Straße 5–9 Phone: +49-228-3894-0
53113 Bonn, Germany Email: publications@iza.org www.iza.org
IZA DP No. 13670 SEPTEMBER 2020

 ABSTRACT
 The Contagion Externality of a
 Superspreading Event:
 The Sturgis Motorcycle Rally and COVID-19*
 Large in-person gatherings without social distancing and with individuals who have traveled
 outside the local area are classified as the “highest risk” for COVID-19 spread by the
 Centers for Disease Control and Prevention (CDC). Between August 7 and August 16, 2020,
 nearly 500,000 motorcycle enthusiasts converged on Sturgis, South Dakota for its annual
 motorcycle rally. Large crowds, coupled with minimal mask-wearing and social distancing
 by attendees, raised concerns that this event could serve as a COVID-19 “super-spreader.”
 This study is the first to explore the impact of this event on social distancing and the spread
 of COVID-19. First, using anonymized cell phone data from SafeGraph, Inc. we document
 that (i) smartphone pings from non-residents, and (ii) foot traffic at restaurants and bars,
 retail establishments, entertainment venues, hotels and campgrounds each rose substantially
 in the census block groups hosting Sturgis rally events. Stay-at-home behavior among local
 residents, as measured by median hours spent at home, fell. Second, using data from the
 Centers for Disease Control and Prevention (CDC) and a synthetic control approach, we show
 that by September 2, a month following the onset of the Rally, COVID-19 cases increased
 by approximately 6 to 7 cases per 1,000 population in its home county of Meade. Finally,
 difference-in-differences (dose response) estimates show that following the Sturgis event,
 counties that contributed the highest inflows of rally attendees experienced a 7.0 to 12.5
 percent increase in COVID-19 cases relative to counties that did not contribute inflows.
 Descriptive evidence suggests these effects may be muted in states with stricter mitigation
 policies (i.e., restrictions on bar/restaurant openings, mask-wearing mandates). We conclude
 that the Sturgis Motorcycle Rally generated public health costs of approximately $12.2 billion.

 JEL Classification: H75, I1
 Keywords: large outdoor gathering, COVID-19, Sturgis Motorcycle Rally,
 social distancing

 Corresponding author:
 Joseph J. Sabia
 Department of Economics
 San Diego State University
 5500 Campanile Drive
 San Diego, CA 92182-4485
 USA
 E-mail: jsabia@sdsu.edu

 * Dr. Sabia acknowledges support from the Center for Health Economics & Policy Studies at San Diego State
 University, including grant funding from the Troesh Family Foundation and the Charles Koch Foundation. We thank
 Alicia Marquez, Kyu Matsuzawa, Melinda Mueller, and Samuel Safford for outstanding research assistance.
1. Introduction

“Now we’re all here together tonight. And we’re being human once again. F*ck that Covid sh*t.”
 Smash Mouth Lead Vocalist Steve Harwell, 2020 Sturgis Concert

 Restrictions on large gatherings were a near universal policy adopted by U.S. states

following the initial U.S. coronavirus outbreak (McKinley and Gold 2020). As of August 29,

2020, when all states that had forced businesses closed had at least partially reopened (Lee et al.

2020), 29 states continued to ban gatherings of groups of over 50 individuals (North Star

Meeting Group 2020), a reflection, in part, of the resurgence of COVID-19 in the U.S. beginning

in June 2020.

 Restrictions on large gatherings during a pandemic is a form of government regulation of

quantity within a market to curb a negative externality. In that way, gathering restrictions are

similar to public smoking bans, chemical emission standards, or vaccination mandates. 1 In this

case, the negative externality is due to infection risk, so the blanket nature of a gathering

restriction is a key part of the containment strategy as a single mass gathering has the potential to

generate a large number of cases, a phenomenon referred to as a “superspreading event.”

Indeed, the Centers for Disease Control and Prevention (CDC) deems “large in-person

gatherings where it is difficult for individuals to remain spaced at least 6 feet apart and attendees

travel from outside the local area” among the highest risk activities for the spread of COVID-19

(CDC 2020). The risk of contagion of COVID-19 is exacerbated at such events if (i) there are

high frequency, prolonged interactions between individuals, and (ii) pre-event COVID-19 case

growth in the county hosting the event is elevated (CDC 2020).

1
 For more on these topics see Gruenspecht and Lave (1989); Anger, Kvasnicka, and Siedler (2011); Carpenter,
Postolek and Warman (2011); Abreyava and Mulligan (2011) and Lawler (2017).

 1
Even though large gathering restrictions have become ubiquitous, with high profile

events such as the 2020 Olympics postponed and the 2020 Umrah Pilgrimage suspended

(Ebrahim and Memish 2020) there is little empirical evidence on the contagion dangers of large

events with “super-spreader" potential – most evidence in support of gathering restrictions has

centered around theoretical models of the spread of disease. 2 A small literature has emerged

showing rises in local COVID-19 infections from events such as college students returning from

spring break (Mangrum and Niekamp 2020), and in-person primary voting (Cotti et al. 2020).

Other work has shown that certain high-profile mass gatherings did not exhibit noticeable

increases in COVID-19 cases when avoidance behavior was detected in the local population

(Dave et al. 2020a; 2020b).

 In this study we examine the 80th Annual Sturgis Motorcycle Rally, a 10-day event with

dozens of concerts, live performances, races, and bike shows that drew over 460,000 individuals

to a city with a population of approximately 7,000 located in a county with a population of

approximately 26,000 (Maxouris 2020; South Dakota Department of Transportation 2020; Yost

2020). COVID-19 mitigation efforts at the Sturgis Rally were largely left to the “personal

responsibility” of attendees (Knowles and Lati 2020), and post-opening day media reports

suggest that social distancing and mask-wearing were quite rare in Sturgis (Walker 2020;

Porterfield 2020; Orecchio-Egresitz 2020; Groves 2020). 3

2
 See for instance model simulations by the Institute for Health Metrics and Evaluation (IHME; University of
Washington) available at: http://www.healthdata.org/covid/faqs.
3
 The City of Sturgis did take some public action. The City provided guidelines to vendors serving food and drink
and offered to help businesses acquire personal protective equipment. The City provided health safety guidelines to
vendors serving food and drink at the event (O’Kane 2020). Furthermore, event organizers (i) required attendees of
the multi-day live concert event series, the Sturgis Buffalo Chip Music Festival, to carry masks into the event
(Guttierez 2020), (ii) included signs at event entry points recommending social distancing (Griffith 2020), and (iii)
warned attendees that some “South Dakota tribal lands may be restricted with checkpoints to protect residents from
COVID-19 exposure” (O’Kane 2020).

 2
The Sturgis Motorcycle Rally represents a situation where many of the “worst case

scenarios” for superspreading occurred simultaneously: the event was prolonged, included

individuals packed closely together, involved a large out-of-town population (a population that

was orders of magnitude larger than the local population), and had low compliance with

recommended infection countermeasures such as the use of masks. The only large factors

working to prevent the spread of infection was the outdoor venue, and low population density in

the state of South Dakota.

 We document three key results. First, using anonymized smartphone data from

SafeGraph, Inc., we demonstrate that non-resident cell phone pings rose in the census block

groups where the Sturgis events look place over the 10-day period of the rally relative to other

census block groups within South Dakota and in border states to South Dakota. Furthermore, we

find that foot traffic at restaurants and bars, hotels, entertainment venues, and retail

establishments in CBGs hosting Sturgis Rally events rose by up to 90 percent during the event,

relative to nearby CBGs. Second, we find that stay-at-home behavior declined among residents

of Meade County We find that the Sturgis Rally event was associated with a 9.4 to 10.9 percent

decline in median hours spent at home. Finally, turning to COVID-19 case data from the

Centers for Disease Control and Prevention (CDC), we find that the Sturgis Rally caused spread

of COVID-19 cases both locally and in the home counties of those who traveled to the Sturgis

Rally and returned home.

 Using a synthetic control approach, we find that the Sturgis event increased COVID-19

cases in Meade County by 6.3 to 6.9 cases per 1,000 population as of September 2nd 2020, a

month following the onset of events at the Sturgis Rally. For the state of South Dakota as a

whole we find that the Sturgis event increase COVID-19 cases by 3.6 to 3.9 cases per 1,000

 3
population as of September 2nd 2020. This represents an increase of over 35 percent relative to

the 9.7 cases per 1,000 population in South Dakota on July 31, 2020 (South Dakota Department

of Health 2020).

 Then, using a dose response difference-in-differences model, we find that counties that

contributed the highest inflows of Sturgis attendees saw COVID-19 cases rise by 10.7 percent

following the Sturgis event relative to counties without any detected attendees. Descriptive

evidence suggests some evidence of variation in local COVID-19 spread depending on the

stringency of local contagion mitigation policies. We conclude that the Sturgis Motorcycle Rally

generated substantial public health costs, which we calculate to reach at least $12.2 billion using

the statistical value of a COVID-19 case estimated by Kniesner and Sullivan (2020). While we

note that this estimate captures the full costs of infections due to the Sturgis rally — and is an

overestimate of the externality cost because this number includes COVID-19 infections to

individuals who attended the rally (and may have internalized private health risks) — we

nonetheless conclude that local and nationwide contagion from this event was substantial.

 2. Background

2.1 COVID-19 in South Dakota

 With a population of approximately 900,000 and covering an area of over 77,000 square

miles, South Dakota is one of the least densely populated states in the country, ranking 46 out of

51 states, including the District of Columbia (World Population Review 2020). Many public

health experts have credited the “natural social distancing” of low population density as an

important driver of low infection rates in the state (Pereira 2020; Bottum 2020). As of July 31,

2020, a week prior to the official Sturgis festivities, there were 8,764 reported cases of COVID-

 4
19 in South Dakota (or approximately 9.7 cases per 1,000 population), as well as 824

hospitalizations, and 130 deaths (South Dakota Department of Health 2020; The New York

Times 2020; The Brookings Register 2020). Meade County, where most of Sturgis’s activities

took place, reported less than 1 percent (71 cases) of the state’s cases as of July 31, 2020 (South

Dakota Department of Health 2020; Matthews 2020).

 South Dakota’s public health response to the novel coronavirus outbreak has largely been

a hands-off approach, centered around private personal responsibility (Pereira 2020). South

Dakota was one of 8 states to never issue a statewide shelter-in-place order or a safer-at-home

order (Mervosh et al. 2020; Secon 2020). A recent assessment found South Dakota to have the

least restrictive COVID-19 policy environment when assessing mask wearing mandates (none),

travel restrictions (none), large gathering restrictions (none), statewide school restarts (district-

level decisions), reopening of bars and restaurants (full indoor-dining permitted), work-from-

home requirements (none) and temperature screenings (not required) (WalletHub 2020; South

Dakota’s Back to Normal Plan 2020; South Dakota Bureau of Human Resources 2020).

2.2 The 2020 Sturgis Motorcycle Rally

 As planning for the 80th Annual Sturgis Motorcycle Rally began in Spring 2020, many

public health officials argued for its postponement or cancellation given that it was set to occur

in the middle of a worldwide pandemic.

 “Public health authorities, however, view [the Sturgis Rally] as a potential petri dish for

 the spread of COVID-19…That’s got Minnesota health leaders worried about the disease

 making its way back here. ‘We are concerned with any large gathering, sustained contact

 5
of that nature,’ Minnesota Health Commissioner Jan Malcolm told reporters Monday,

 calling the rally ‘sort of a recipe for something to happen.’” (MPR News Staff 2020)

 However, a lack of lockdown measures in South Dakota, along with no maximum

gathering crowd limit or mask-wearing requirement, made it quite difficult for the City to

prevent the event from occurring (Blistein 2020). Furthermore, when the Sturgis City Council

consulted the state government on their ability to restrict or revoke camping permits of nearby

campgrounds, where the majority of attendees stay (Blistein 2020) 4, they were quickly denied

(Blistein 2020). 5 So, in April 2020, the Sturgis City Manager and the City Council, concluding

that individuals would still travel to Sturgis in large numbers if the event were canceled; allowed

the event to go forward with minimal changes (Ainslie 2020; Bonnet 2020).

 To prepare for the influx of people arriving in the small town, the City of Sturgis tested

all Rally workers and emergency responders for COVID-19 and performed daily health

screenings on such personnel (Blistein 2020; James 2020). The City stocked personal protective

equipment (PPE), offered PPE supplies to local businesses in need, sanitized restroom stations

and sidewalks, and placed hand sanitizer dispensers in public locations throughout the city

(Blistien 2020; Ainslie 2020a). Moreover, hospital staging was increased, and a mandate was

issued that would expand local intensive care units (ICUs) to include 500 more beds within 48

hours if necessary (Blistein 2020; James 2020). The City announced that following the

4
 Approximately 50 percent of attendees every year stay at large campgrounds, such as Buffalo Chip, outside of the
city, that hold coinciding events with the Rally but are not subject to the same regulatory restrictions as events
happening within Sturgis (Blistein 2020).
5
 There was also concern from Native American tribal leaders around Sturgis, who set up checkpoints in the months
prior to the Rally to question travelers on possible exposure (James 2020).

 6

conclusion of the rally, residents and local businessowners would be assured access to low-cost

testing (Ainslie 2020b).

 The Sturgis Motorcycle Rally was held over a 10-day period from August 7 through

August 16, 2020, with pre-Rally events beginning on August 3. Estimated attendance was

462,182 (South Dakota Department of Transportation 2020). The Rally included rides and races

(drag, motocross, motorcycle), bike shows, poker tournaments, boxing matches, exhibitions,

contests, vendors (tattoo artists, rally merchandise, bike washes, apparel), and music events

(concerts, disk jockeys, dancers).

 Over 30 entertainment groups preformed concerts or held events at over the course of the

two-week period (80th Sturgis Rally Events Schedule 2020; City of Sturgis Motorcycle Rally

Concerts 2020). Venues were both indoor and outdoor, located within Meade County, and

included bars on the Main Street of Sturgis to campgrounds outside of city limits, most notably

Buffalo Chip. Beginning on August 3, Buffalo Chip held dozens of events every day through the

16th, including a headlining performance by musical group Smash Mouth (2020 Sturgis Buffalo

Chip Schedule). Masks were required for the backstage crew during concerts, but attendees were

only required to have mask in their possession to be permitted to enter (Blistein 2020). Bars and

restaurants remained fully open, including for indoor dining, with some businessowners

reporting remaining open 24 hours per day to cater to attendees (Thorson 2020). Moreover,

liquor store sales in Sturgis were up 27 percent from the prior year, which could be

representative of a less risk averse population of attendees given that attendance was down

roughly 7.5 percent from the prior year (Bonnet 2020).

 Following the event, public health officials expressed concern about the likely effects of

the event, not only in Sturgis and its environs, but also in the residential counties of those who

 7
attended the event (Knowles 2020; Moini 2020). Despite widespread speculation by

policymakers and public health officials (Groves 2020; Associated Press 2020; Beer 2020;

Whateley 2020), no study has yet explored the impacts of this very large public gathering during

the COVID-19 pandemic. 6

 3. Data

3.1 Anonymized Cellphone Data

 We begin our analysis using anonymized cellphone data provided by SafeGraph Inc.

from July 6, 2020 through August 30, 2020, a period that envelopes the Sturgis Rally. 7

SafeGraph provides census-block-group-level data from 45 million anonymized cell phones that

allow us to measure the residence of individuals and the jurisdictions to which they travel. These

data have been used widely by scholars examining the impact of COVID-19 mitigation policies

(Courtemanche et al. 2020; Abouk and Heydari 2020; Lasry et al. 2020; Friedson et al. 2020;

Dave et al. 2020a,b,c) and large gatherings (Dave et al. 2020d,e) on stay-at-home behavior.

These data have been used commonly by the Centers for Disease Control and Prevention and

other researchers to study social distancing behavior during the COVID-19 epidemic in the

United States.

 The SafeGraph data defines a person’s “home” as a 153-by-153-meter area in a common

night-time location that receives the largest number of GPS pings during the hours of 6PM

through 7AM. An individual’s “movement” is measured from a cellphone once a person leaves

6
 The Monument Health Sturgis Hospital confirmed that multiple attendees of the rally had tested positive (Walker
2020; Matzen 2020; Levenson 2020), and at least one positive case was traced back to a Sturgis bar within two days
of the Rally’s conclusion (South Dakota News Release August 18, 2020; Levenson 2020; Coleman 2020)
7
 To obtain SafeGraph data, see: https://www.safegraph.com/covid-19-data-consortium

 8
their home. 8 For the purposes of our study, we use the SafeGraph data to (i) measure the number

of non-resident visitors to the census block groups (CBGs) where Sturgis Motorcycle Rally

events took place, (ii) trace those attendees back to their home counties, and (iii) measure stay-

at-home behavior among residents of Meade County (where the Sturgis Rally, in the main, took

place) as well as border counties, so as to examine compensatory risk avoidance behavior by

those who are local to the area.

 First, we measure the natural log of the number of non-resident visitors in the census

block groups (CBGs) where the Sturgis Rally took place and bordering CBGs (Census Bureau

Geocoder 2020). CBGs were identified as treated if they held (7 CBGs) or bordered (19 CBGs)

a documented Sturgis event or vendor location, as listed on an official Sturgis Rally or Sturgis

Rally-affiliated rally website between August 3 and 16 (City of Sturgis 80th Motorcycle Rally

2020; Rally Sturgis 2020; Sturgis 2020). 9 We also account for temporal variation across these

CBGs, accounting for the days when particular events were held. “Treatment” CBGs were

largely located within Meade County, mostly in the city of Sturgis, though some expand into

Lawrence and Pennington County, which are border counties to Meade.

 Relative to the two-week period from July 6 through July 19, the number of non-resident

pings in the “Sturgis treatment CBGs” rose by 92.5 percent from August 3 and August 16,

peaking on Saturday, August 8, the date of the Smash Mouth concert. Appendix Figure 1

compares the number of non-resident pings in the treatment CBGs and all other CBGS

8
 While this measure of social distancing has some limitations — for instance, it would not capture whether an
individual engages in social distancing while outside the home or working during non-standard night shifts, any
measurement error introduced in these measures cross-spatially will not affect our results as we are interested in
changes within areas over time.
9
 Affiliated pre-Sturgis Rally events took place from August 3 through August 6, 2020 (see, for example:
https://www.buffalochip.com/BANDS,
https://www.buffalochip.com/Portals/0/2012/schedule/2020%20_Daily_Schedule_Updated_8-9-20.pdf?ver=2020-
08-09-172919-593) and the main events took place from August 7 through August 16, 2020 (Rally Sturgis 2020).

 9
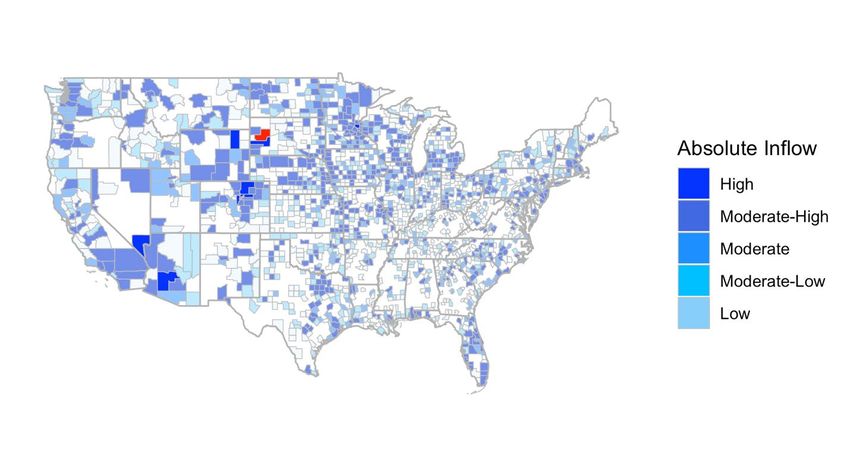
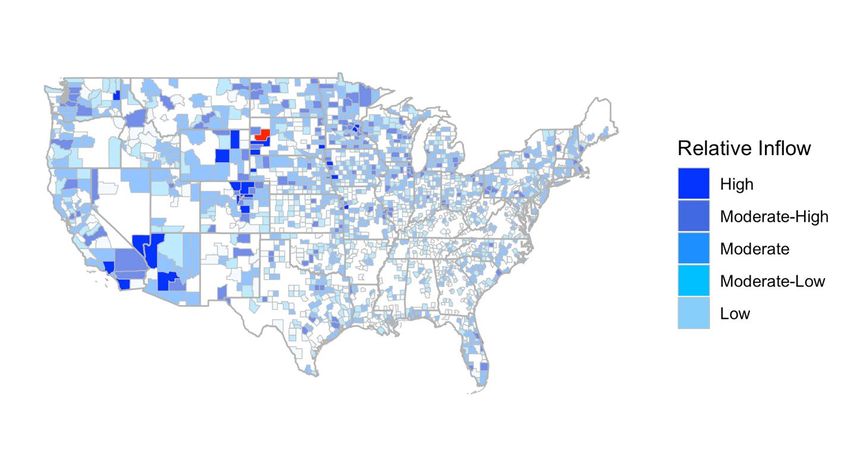
(“controls”) in the state of South Dakota. These patterns suggest that travel into the treatment

regions increased substantially relative to the controls.

 In Figure 1, we present a map of home counties of individuals (who do not reside in the

treatment CBGs) who visited the CBGs where Sturgis Rally events took place between August 3

and August 16. Panel (a) shows the intensity of inflows into Sturgis (during the treatment

period) net of usual inflows during a prior two-week period (from July 6 to July 19). We explore

five categories of inflows: High, Moderate-High, Moderate, Moderate-Low, and Low. 10 As

illustrated, the Rally drew attendees from all over the United States. Moreover, while a number

of high inflow counties were found within South Dakota and its border states, a number of

counties from other states, including Arizona, California, Colorado, Minnesota, Nevada, and

Washington, contributed larger numbers of smartphone pings.

 We find that event attendees were not primarily concentrated in the event county or its

environs. Only 0.9 percent of non-resident pings at the Sturgis Motorcycle Rally CBGs came

from Meade county. A further 8.5 percent of non-resident pings came from other counties

outside of Meade County within South Dakota. But a full 90.7 percent came from outside the

state of South Dakota, 18.6 percent from border states and 72.1 percent from the remainder of

the country.

 In panel (b) of Figure 1, we show an alternative measure of inflows: the ratio of the home

county-specific number of smartphone pings in the Sturgis treatment CBGs between August 3

and 16 and the average number of resident pings over the sample window. This measure (i)

10
 High absolute inflows correspond to 400 or more pings (7 counties), moderate-high absolute inflows correspond
to 30 to 400 pings (526 counties), moderate inflows correspond to 20 to 30 pings (216 counties), moderate-low
inflows correspond to 10 -20 pings (437 counties), low inflows correspond to 1 to 10 pings (672 counties), and zero
inflows correspond to 0 pings (1,386 counties). The latter group also serves as an additional counterfactual, not
having sourced any observable travelers to the Sturgis event.

 10
better controls for county population size (to ensure high inflows do not simply capture large

populations), and (ii) accounts for resident smartphone coverage in the SafeGraph data. In the

main, the pattern of high inflow counties looks quite similar. 11

 Next, to capture increased presence in Sturgis at the time of the rally, we use foot traffic

data, also available from SafeGraph, Inc. These data track hourly aggregated foot traffic to

millions of points of interest across the United States. In order to categorize each individual point

of interest, SafeGraph, Inc. includes industry-specific National American Industry Classification

System (NAICS) codes.

 We construct six measures from these NAICS codes, including dining establishments,

comprised of restaurants and bars (7225 and 7224 respectively), and retail, which combines both

essential and non-essential businesses, including industries such as grocery stores (4451) and

pharmacies (446110), liquor stores (4453), gas stations (4471), and clothing merchandisers

(4481). Entertainment establishments are aggregated into one measure, including spectator sports

arenas (7112), amusement parks and arcades (7131), and gambling venues (7131). We also

consider two measures of lodging, hotels (7211) and campgrounds (721211 and 721214). Foot

traffic for each category of industry is then aggregated to the day-by-census block group level.

 In addition to tracking behavior of rally attendees, we also measure stay-at-home

behavior of residents of Meade County and its environs in order to detect any potential

compensatory or avoidance behaviors on the part of the local residents. We generate two

measures from the SafeGraph data: (i) Full-Time Stay-at-Home, which measures the mean

11
 High relative inflows correspond to more than 3.5 relative pings (25 counties), moderate-high relative inflows
correspond to (1 to 3.5] relative pings (157 counties), moderate relative inflows correspond to (.25 to 1] relative
pings (648 counties), moderate-low relative inflows correspond to (.1- to 25] relative pings (405 counties), low
relative inflows correspond to (0 to .1] relative pings (523 counties), and zero relative inflows correspond to 0 pings
(1,386 counties).

 11
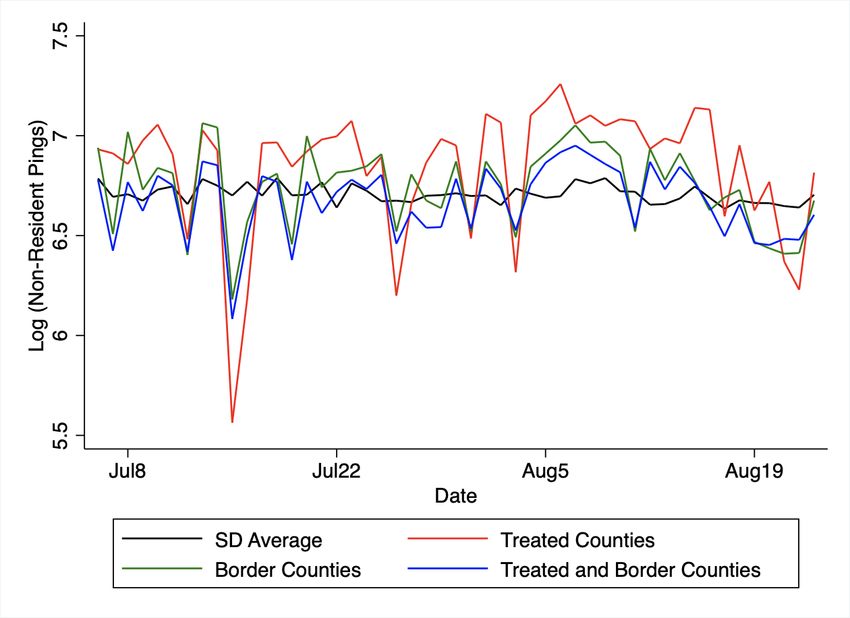
percent of individuals who spend the entire day at home, and (ii) Median Hours at Home, which

captures the intensive margin of stay-at-home behavior, the median number of hours that the

respondent is recorded as being at his/her residence. Each of these measures is generated for

three jurisdictions: Meade County, Meade County and its border counties (Perkins County,

Ziebach County, Haakon County, Pennington County, Lawrence County, and Butte County), and

the state of South Dakota. In Meade County, we document that in the week prior to the Sturgis

event, residents remained at home for a median of 10.1 hours. During the Sturgis Rally period

(August 3 through August 16), this number decreased to 8.8 hours.

3.2 COVID-19 Cases

 We measure county-level COVID-19 cases using state and county-level data from the

Centers for Disease Control and Prevention (CDC), which were made available by the Kaiser

Family Foundation, the New York Times, and Johns Hopkins University. 12 COVID-19 cases are

analyzed over the period from June 6, 2020 through September 2, 2020. During this time frame,

the mean number of cumulative COVID-19 cases per 1,000 population was 3.83 in Meade

County. There was one recorded COVID-19 death over this period in the county which hosted

the event; given the relatively low level of mortality before, during and after the Sturgis event,

we mainly focus on cases for our short-to-medium run analyses.

 In Appendix Figure 2A, we display the trends in COVID-19 cases per 1,000 population

in the state of South Dakota, Meade County, and in Meade County and its border counties. We

find that Meade County had a similar COVID-19 case rate to the state of South Dakota.

12
 To obtain county- and state-level COVID-19 case and mortality data, see: https://github.com/nytimes/covid-19-
data

 12
However, in the latter part of the sample period (post-Sturgis), the growth rate is notably faster in

Meade County. COVID-19 cases also grew more rapidly in South Dakota and “Meade County

and Border Counties” in the post-Sturgis (post-August 16) period. However, the rate of growth

appears fastest in Meade, particularly after a week following the close of the Sturgis Rally.

 In Appendix Figure 2B, we show trends in cumulative COVID-19 cases in counties that

contributed heterogeneous inflows of attendees to the Sturgis Rally, as coded with our SafeGraph

data. We find generally higher rates of COVID-19 cases from the counties that contributed

higher inflows to the rally.

 4. Empirical Approach

4.1 Effect of Sturgis Rally on Non-Resident Travel and Foot Traffic in Sturgis

 We begin by estimating the effect of the Sturgis Motorcycle Rally on non-resident cell

phone pings in the CBGs where the Sturgis events took place. 13 We pool 10,411 CBGs in South

Dakota and its border states across 56 days and estimate the following difference-in-differences

specification: 14

 Ygcst = β0 + β1 Sturgisgt + β2 Tempct + β3 Precipct + β4 'Xst + α + τt + εgct (1)
 g

where Ygcst measures the inverse hyperbolic sine of (i) the number of non-resident GPS pings in

census block group g in county c in state s on day t, (ii) foot traffic in restaurants and bars, retail,

13
 Included among the official sites were: Sturgis Dragway, Buffalo Chip, Glencoe Camp Resort, Kickstands
Campground, Load American Roadhouse. Iron Horse Saloon, Drag Pipe Saloon and Campground, One Eyed Jack
Saloon, Shade Valley Campground, Junction Ave & Main Street, The Historical Sturgis Half Mile, The Hotel
Sturgis, Jackpine Gypsies Club, and Cadillac Jack’s Gaming Resort.
14
 We omit CBGs from the analysis sample if they did not host Sturgis events but were located in counties where
there were CBGs that hosted events since there may be spillovers in terms of travel and foot traffic to these CBGs,
and they may be partially “treated”.

 13
entertainment, hotels, and campgrounds in census block group g in county c in state s on day t; 15

Sturgisgt is a treatment measure that “turns on” when an event occurs in the CBG at the Sturgis

Event, Tempct is a measure of the average temperature (in degrees Celsius) in county c on day t,

Precipct is a dichotomous variable capturing whether measurable rainfall occurred that day 16, Xst

is a vector of state-specific time-varying controls, including state reopening policies for personal

care services, gyms, entertainment centers, and restaurants/bars, the presence of a mask-wearing

mandate, and the COVID-19 testing rate per 100,000 population; αg is a time-invariant CBG

fixed effect and τt is a CBG-invariant day effect that controls for intra-day cyclicality in travel

behavior in addition to secular trends. Given the relatively small number of treatment and border

CBG clusters (less than 30), we conduct statistical inference using wild cluster bootstrap

techniques (Cameron et al. 2008; 2012).

 Our estimate 1 will be unbiased only if the common trends assumption is satisfied. To

explore the validity of our two-way fixed effects estimator, we conduct event study analyses to

explore differential trends in foot traffic (and non-resident pings) between treatment and control

CBGs in the weeks prior to the Sturgis event. The presence of common leads provides at least

descriptive support for the common trends assumption. Moreover, this event-study approach

also allows us to further disentangle dynamics and examine lagged effects of Sturgis events,

which permit identification of (i) post-treatment days that saw the largest increases in foot traffic,

and (ii) when travel back home by attendees likely began.

4.2 Estimating Effects of Sturgis Rally on Stay-at-Home Behavior & COVID-19

15
 The inverse hyperbolic sine approximates the natural log, is interpreted in a similar manner, but has the advantage
of retaining areas with zero counts (Bellemare and Wichman 2020).
16
 Weather data can be obtained at: https://www.ncdc.noaa.gov./

 14
To examine the impact of the Sturgis Motorcycle Rally on the local resident population,

we use data from July 6, 2020 through September 2, 2020 and undertake a synthetic control

approach (Abadie et al. 2010). This method has been used by several recent studies to investigate

how COVID-19 mitigation policies (Friedson et al. 2020; Dave et al. 2020d) and gatherings

(Dave et al. 2020e,f) have affected social distancing and the spread of novel coronavirus. As

noted above, we focus on (i) Meade County, the county where the rally took place, (ii) Meade

County and the surrounding border counties (“Meade Plus Border”) and (iii) the state of South

Dakota.

 A key decision for researchers is in the selection of the donor pool to form the

counterfactual for the treatment jurisdiction. In order to avoid a contaminated control group, we

first ensure that our donor pool was not directly affected by the Sturgis Rally. Thus, we exclude

all jurisdictions from which we detect travelers to the Sturgis event via smartphone pings. To

further ensure the absence of spillovers from those attendees who travel to non-attending

counties, we also exclude any jurisdictions from border states to South Dakota, which includes

Iowa, Minnesota, Montana, Nebraska, North Dakota, and Wyoming.

 For our analyses of Meade County and its environs, we exclude from the donor pool (i)

counties from within the state of South Dakota or from border states, and (ii) counties with

urbanicity rates above 64.5 percent or below 59.5 percent (creating a band of counterfactuals that

envelope Meade County’s urbanicity rate of 62.0) and counties with a population-weighted

density greater than 650 persons per square mile or below 350 persons per square mile (creating

a band of donor counties that envelope Meade County’s population weighted density of

approximately 500 persons per square mile). These restrictions help to select on factors that may

be important to COVID-19 spread (Friedson et al. 2020; Dave et al. 2020b,c).

 15
To ensure that the synthetic control was similar to the treatment jurisdiction on our key

outcomes the pre-Sturgis rally of COVID-19 cases and mortality, we match on (i) outcomes

(stay-at-home behaviors, COVID-19 cases per capita, or COVID-19 mortality per capita) on

each day for 28 days prior to the start of the pre-events on August 3, or (ii) outcomes on 10 or 14

pre-treatment days. We also consider matching on multiple observable traits that have been

documented to affect COVID-19 case growth, which include the state-level COVID-19 testing

rate per 100,000 population, an indicator for whether the state issued a mask wearing mandate,

and state reopening policies (number of days that the state has allowed reopening of

bars/restaurants, personal care services, gyms, entertainment centers, and retail shops). Our

synthetic control estimate is then calculated as the difference in average post-treatment COVID-

19 cases between the treated jurisdiction and its synthetic control. 17

 In addition to examining the effect of the Sturgis Rally on COVID-19 cases in Meade

County (including its border counties) and in South Dakota, we also examine the impact of the

rally on stay-at-home behavior among residents. This will test for the net social distancing effect

among local residents who might avoid the rally due to fears about COVID-19 case growth

(Dave et al. 2020e,f), or perhaps due to drunken violence and disorderliness.

 Our previous analyses on the scale of non-resident travel, in conjunction with the inflow

patterns across counties that contributed the largest numbers of attendees to Sturgis rally events,

highlight further areas of focus – beyond just Meade County and South Dakota - for studying

17
 The unobserved counterfactual for COVID-19 case or mortality rate for Meade County, Meade County and its
border counties county, or the state of South Dakota is given by ∑ ∗ , where is the weight allocated
to donor jurisdiction j on day t. The estimated weights are selected for all pre-treatment days to minimize the
absolute difference between = , and ∑ ∗ . The treatment effect is assessed as =
 = , − ∑ ∗ for ϵ {August 3, August 16}, which is used to construct the average treatment
effect over the post-treatment window.

 16
potential effects on COVID-19 cases as the out-of-state attendees travel back home. In order to assess whether there were any discernible changes in COVID-19 cases in areas that contributed relatively more attendees to the event, we utilize a dose-response difference-in-differences model to exploit variation in the home counties to which attendees return, as detailed in Figure 1. Namely, we pool a panel of 3,078 counties and 59 days from all U.S. states except South Dakota (which is analyzed in the above synthetic analysis) and estimate the following model: COVID-19cst = α0 + Inflowc * t * 1 + Xst * 2 + Zct * 3 + γc + δt + γc *t + εcst (2) where COVID-19cst is the natural log of COVID-19 cases per 1,000 population, Inflowc is a set of five indicators of intensity of inflows to Sturgis from resident counties (both absolute inflow and relative to resident smartphone pings) relative to counties that had zero inflow (reference) into the Sturgis event (corresponding to the heat maps shown in Figure 1), PostSturgist measures lagged windows of the post treatment period beginning on August 3 and continuing through September 2, approximately three weeks following peak attendance at Sturgis and two weeks following the close of the event. This post-treatment window captures a period well past the median incubation period (5 days) for COVID-19, and surpasses the point where 99 percent of individuals who are infected would have started showing symptoms (Li et al. 2020). Our controls are as follows: Xst as defined above as well as the COVID-19 testing rate per 100,000 population; Zct , is a vector for the average temperature in a county and whether measurable rainfall fell; αc are county fixed effects, τt are day-of-week fixed effects, and γc *t is a county- specific linear time trend. The latter help to control for differential growth trends of COVID-19 17
across counties. To evaluate the common trends assumption, we again conduct event study

analyses by intensity of inflows to the Sturgis event. 18

 5. Results

 Our findings on non-resident travel and foot traffic in Sturgis appear in Table 1 and

Figures 2A and 2B. Synthetic control estimates on social distancing and local COVID-19 spread

in Meade County, its border counties, and the state of South Dakota are shown in Tables 2-3 and

in Figures 3 through 6. And dose-response estimates are shown in Tables 4-5 and in Figure 7.

Supplemental analyses are shown in various Appendix Tables and Figures.

5.1 Non-Resident Travel, Foot Traffic, and Social Distancing

 In Figure 2A, we first establish with our anonymized smartphone data that the 2020

Sturgis Rally attracted substantial foot traffic, particularly from non-residents, consistent with

media reports of over 350,000 attendees at the event. Our event-study analysis shows that in the

weeks leading up to the event, there was relatively little difference in non-resident pings in the

census block groups that later held Sturgis events and those non-resident pings in CBGs in other

parts of South Dakota or in the border states. However, the number of non-resident pings rose

substantially in the days following the onset of Sturgis events. This gradually increased during

the first week following the onset of the event, cresting about 2 days after, and then returning to

baseline about 11-12 days after the start of the first event, corresponding to the length of the pre-

Rally and main Rally events. 19 Note that the magnitudes of the lagged effects we observe are

18
 Given that we use variation in inflows to estimate treatment effects, we cluster our standard errors at the county-
level for statistical inference. Clustering at the state-level generated a qualitatively similar pattern of results.
19
 One of the headlining events, a concert by the band Smash Mount, took place on August 9, two days after the
official start of the Sturgis Rally on August 7.

 18
clearly lower-bound estimates of inflows given that many of the control CBGs in our sample also

saw spillover effects from travelers, either en route to, traveling home from, or riding

motorcycles around the area during the Sturgis event. Still, our non-resident “ping” effects are

statistically distinguishable from zero.

 We observe a similar pattern of results in Figure 2B, where we show event-study

analyses of foot traffic at the Sturgis Rally. Specifically, we examine visitation patterns into

restaurants and bars (panel a), retail establishments (panel b), entertainment venues (panel c),

business services (panel d), hotels (panel e), and campgrounds (panel f). Again, there is

relatively little evidence of differential pre-treatment trends across each of these measures of foot

traffic. Rather, we find strong and consistent evidence of large increases in foot traffic into each

of these venues during the Sturgis Rally event, particularly for restaurants/bars, entertainment

venues, and retail establishments. The magnitudes of our estimated effects were substantial,

ranging from about 30 to 90 percent increase in foot traffic across each of these venues. These

results, taken together with our non-resident ping analyses, provide strong evidence that the

Sturgis Rally attracted substantial inflows, personal interaction, and economic activity in Meade

County.

 Our findings in Table 1 confirm the findings from our event study analyses. Panel I

shows the overall “Sturgis event” effect, while Panel II shows post-treatment lagged windows,

which captures growing event activity and then the gradual close of the event. Consistent with

our event studies, we find that relative to other nearby CBGs in South Dakota and in bordering

states, non-resident pings and foot traffic rise substantially in the days following the onset of the

Sturgis events, generally increasing for about a week to 10 days before declining (13+ days after

the event). The peak estimated effects range from 36.7 percent (for hotels) to 94.1 percent (for

 19
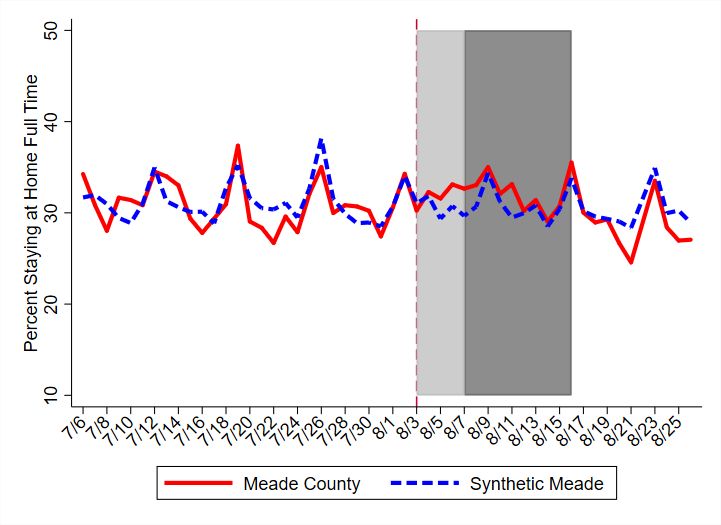
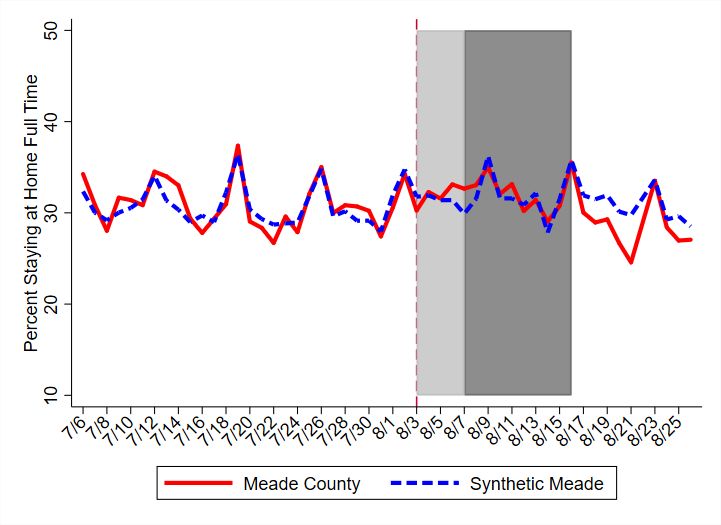
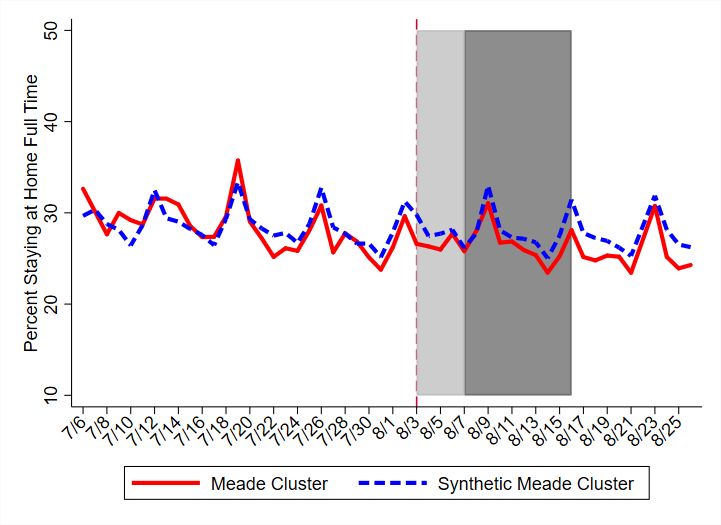
restaurants and bars) increase in foot traffic relative to surrounding CBGs in South Dakota and

the bordering states. As discussed above, these are likely lower bound estimates given spillovers

into other areas en route to Sturgis or as attendees are riding their motorcycles around other areas

during the event.

5.2 Social Distancing and Local Community Spread of COVID-19

 One of the most important results in two recent studies of the impacts of large gatherings

(at a Tulsa, Oklahoma political rally in Dave et al. 2020e, and in large U.S. cities experiencing

Black Lives Matter protests in Dave et al. 2020f) has been a countervailing increase in social

distancing by local residents in response to the gathering, dampening community spread of

COVID-19. Could such risk-averting behavior have occurred in Sturgis as well, where 60

percent of local residents polled appear to have opposed the Rally going on as in prior years? In

Figure 3, we show synthetic control estimates of the effects of the Sturgis Rally on full-time

stay-at-home behavior in Meade County (panel a), Meade County and its border counties (panel

b), and South Dakota as a whole (panel c).

 In panels (a) and (b), we construct our synthetic control using a donor pool comprised of

counties that (i) did not have residents “pinging” in Sturgis during the period August 3 through

16 and were not located in border states of South Dakota, (ii) had urbanicity rates that did not

deviate by more than 2.5 percent from the urbanicity rate of Meade County (62.5%), and (iii) had

weighted population density than did not deviate by more than 150 persons per square mile from

the population density of Meade County (approximately 500 persons per square mile). After

matching on all pre-treatment values of full-time stay-at-home behavior, we find no evidence

that local residents avoided going outside and increased full-time stay-at-home behavior in

 20
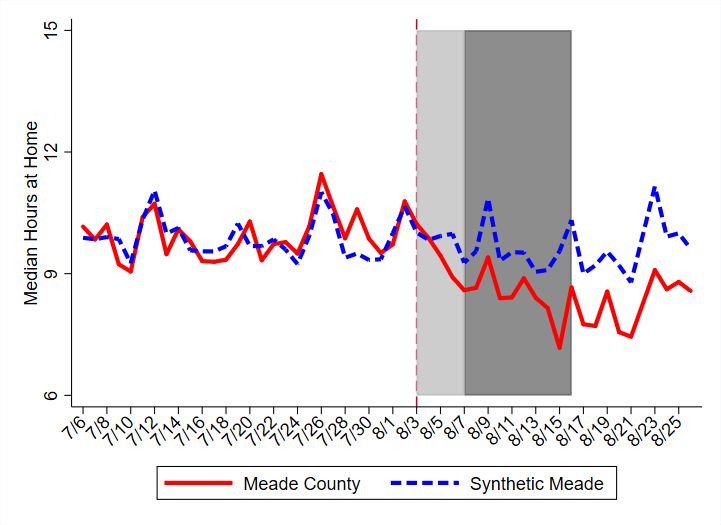
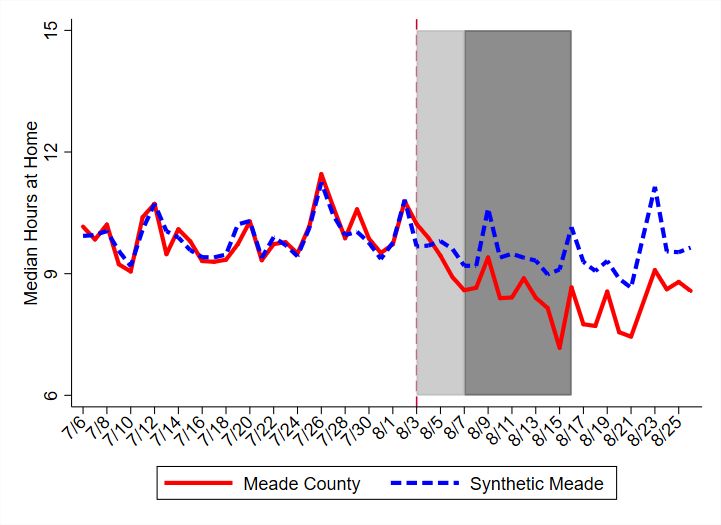
response to the large gathering in their county. This is true across both the pre-Rally event

period (light grey shading) and the main Rally events (darker grey shading). We also find no

evidence of increases in full-time stay-at-home behavior in South Dakota following the Sturgis

event. 20

 Rather, in Figure 4, we document that there was a decline in stay-at-home behavior by

local residents, when such behavior is measured at the intensive margin. Specifically, we find

that the average number of hours that local residents in Meade County (panel a) spent in their

home substantially declined during and following the onset of the Sturgis Rally, suggesting that

local residents also attended the rally events. 21 Interestingly, this decline appeared to continue

even as the event closed on August 16, indicative of some persistence in these behaviors. We

also find these results in alternate synthetic control models where we match on 14 days of pre-

treatment social distancing as well as state policies related to reopening of businesses, mask-

wearing policies, and COVID-19 testing rates (see Appendix Figure 4).

 In Table 2, we provide formal synthetic control estimates, which largely confirm the

results shown in Figures 3-4 and Appendix Figures 3-4. We fail to detect evidence that the

Sturgis Rally significantly affected full-time stay-at-home behavior (columns 1-3). However, we

do find that the Sturgis Rally reduced the average number of hours that Meade County residents

(Panel I) spent at home (columns 4-6) by about 0.9 to 1.1 hours, or approximately 9.4 to 10.9

percent relative to the pre-treatment mean. This reduction in stay-at-home behaviors does not

extend much beyond Meade County, and the estimated effect sizes are much smaller when we

20
 These results persisted when we instead matched on two weeks of pre-treatment social distancing data as well as
state policies with regard to reopening of businesses, COVID-19 testing, and mask-wearing mandates (see Appendix
Figure 3)
21
 Some of the decrease in median hours spent at home may also reflect an increase in work activity fueled by the
events and visitors.

 21
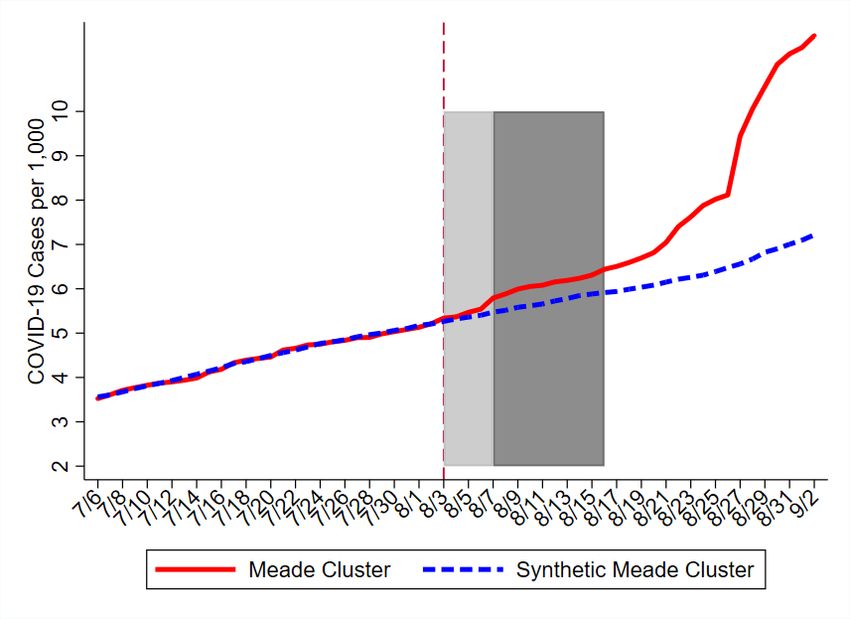
include border counties to Meade (panel II) and the state of South Dakota as a whole (panel

III). 22

 These results suggest that in contrast to prior large gatherings that have been studied (i.e.,

Tulsa and BLM protests), in the case of Sturgis, the local resident population appeared to

participate in the events. This raises the possibility that the local population may be at risk for

COVID-19 spread, especially if mitigating strategies (i.e., mask-wearing, interacting closely with

only household members, avoiding crowds) were not undertaken.

 In Figures 5 and 6 and in Table 3, we explore whether the Sturgis Rally contributed to

local community spread of COVID-19. We find strong evidence that the events were a local

spreader of COVID-19. Figure 5 shows synthetic control estimates for the model where we

match on all pre-treatment days of cumulative COVID-19 cases while Figure 6 shows estimates

where we match on half of all pre-treatment days (14 days) as well as on other predictors of

community spread, including the number of days the state has permitted reopening of

restaurants/bars, entertainment venues, personal care services, and gyms, as well as the number

of days the state has had a mask-wearing mandate and the state COVID-19 testing rate

(measured on July 7, August 2, August 6, and August 20). Across both sets of figures, we find

strong evidence that the Sturgis Rally is associated with a substantial increase in COVID-19

cases in the local population. The effect appears particularly stark in Meade County, which

hosted the Rally’s core events. There is a clear break in COVID-19 growth in the period

following the Sturgis Rally, accelerating after about August 24, a week following the event’s

close.

22
 In Appendix Table 1, we list the counties and states that received positive weights in the synthetic control
estimates shown in Table 2.

 22
Table 3 presents the synthetic control estimates of the Sturgis Motorcycle Rally on

cumulative COVID-19 cases. We find that over the full post-treatment period, the Sturgis Rally

was associated with a 1.63 to 2.09 increase in COVID-19 cases per 1,000 people in Meade

County (Panel I). This corresponds to a 76.8 to 98.5 percent increase in cumulative COVID-19

cases relative to its estimated synthetic counterfactual. The effects are statistically

distinguishable from zero using permutation-based p-values generated from placebo tests, and

are largest when we might expect them, following the incubation period of COVID-19 (Li et al.

2020) during the period following the close of the Sturgis events. Specifically, after August 16th,

we find that COVID-19 cases increase by 2.83 to 3.54 cases per 1,000 population in Meade

County relative to its synthetic control. By September 2, approximately three weeks following

the Sturgis event, we find that COVID-19 cases are 6 to 7 cases higher per 1,000 population in

Meade County, a 100 to 200 percent increase in cases. This translates to between 177 to 195

more total cases in the County, by the end of the analysis period, as a result of the rally.

 Turning to Meade County and its border counties (Panel II), we find that there is strong

evidence that the Sturgis Rally increases COVID-19 cases in Meade County’s environs. In

Meade County and its border counties, the Sturgis event is associated with a 1.38 to 1.54 cases

per 1,000 population increase in cumulative COVID-19 cases. Again, the effects are largest

during the period following the close of the Motorcycle Rally.

 Finally, the spread appears to be picked up in the entire state of South Dakota (Panel III),

with almost 10 percent of attendees coming from within the state. Using our synthetic control

method, we find that COVID-19 cases are 1.10 to 1.24 higher per 1,000 population, effects that

are statistically distinguishable from zero at conventional levels. By September 2nd, the synthetic

control estimates indicate an increase in the state by between 3,185 and 3,441 total number of

 23
cases. We note that these estimates may be lower bound estimates to the extent that several of

the positively weighted donor states that contributed to synthetic South Dakota (see Appendix

Table 2) included counties with residents that “pinged” in Sturgis at the time of the event and

could have contributed to community spread back home.

 Together, the findings in Figures 5-6 and Table 3 provide strong evidence that the Sturgis

event contributed to substantial local community spread. We next turn to an exploration of

whether the impact of the Sturgis event extended nationally. That is, we answer the question: did

the Motorcycle Rally turn into a super-spreader event?

5.3 Dose-Response Estimates of Effect of Sturgis on Broader National Spread of COVID-19

 While the above findings have established evidence of local community spread of

COVID-19, we next assess the degree to which the Sturgis event contributed to COVID-19

spread beyond the borders of South Dakota. For this purpose, we exclude counties from the state

of South Dakota from the analysis sample and use our dose-response difference-in-differences

model (equation 2) to assess whether counties that had relatively higher numbers of residents

attend the Sturgis Rally saw increases in community spread of COVID-19 following the event,

when many such attendees returned home. Figure 7 and the corresponding Table 4 present the

results of this exercise.

 Figure 7 presents event-study analyses of the effect of relative inflows into the Sturgis

Rally on the natural log of cumulative COVID-19 cases in attendees’ resident counties. As noted

above, the relative inflow measure captures the ratio of the number of net pings in Sturgis

treatment CBGs from August 3-16 (relative to non-resident pings in the same CBGs from July 9-

26) to the average number of resident pings over the sample window. Figure 7 presents event

 24
studies for Low Inflows, Moderate-Low Inflows, Moderate Inflows, Moderate-High Inflows, and

High Inflows. The estimates shown in the event studies may be thought of as COVID-19 effects

relative to counties with no inflows to the Sturgis rally. Our event study results show little

evidence of pre-treatment county-level COVID-19 case trends. In moderate and higher inflow

counties, we find that approximately more than three weeks after the start of the Sturgis events

(corresponding to about two weeks following the end of the Rally), county-level cumulative

COVID-19 cases increase by about 6 to 12 percent. This provides some visual evidence of non-

localized spread of COVID-19 as a result of the Sturgis Motorcycle Rally. We find little

evidence, within this time span, of any discernible increase in cases in those counties that

sourced relatively fewer attendees to the Sturgis rally.

 Table 4 presents the lagged effects of the Sturgis Rally on the natural log of COVID-19

cases. Our findings in column (1) shows that the highest relative inflow counties to Sturgis

(outside of the state of South Dakota), which were comprised of counties representing states

nationwide, including Arizona, California, Colorado, Iowa, Minnesota, Nebraska, Nevada

Washington, and Wyoming 23 — saw a 10.7 percent increase in COVID-19 cases more than three

weeks following the opening of the Sturgis Rally, and about two weeks following the close of

the events. Over the same time window, we find that the second highest inflow counties also

experienced about a 12.5 percent increase in COVID-19 cases following the events. Turning to

our “moderate inflow” counties, we also see that a diverse set of counties from states across the

nation also saw about a 7 percent increase in COVID-19 cases, beginning about ten days

23
 These counties include Jefferson County, Colorado, Weld County, Colorado, Adams County, Colorado, Denver
County, Colorado, El Paso County, Colorado, Larimer County, Colorado, Mohave County, Arizona, Maricopa
County, Arizona, Los Angeles County, California, San Diego, California, Clark County, Nevada, Anoka County,
Minnesota, Hennepin County, Minnesota, Pottawattamie County, Iowa, Woodbury County, Iowa, Jackson County,
Missouri, Campbell County, Wyoming, Natrona County, Wyoming, Spokane County, Washington, and Scotts Bluff
County, Nebraska.

 25
following the close of the Sturgis Rally. These effects are all significantly different from zero.

This suggests that the COVID-19 spread effects of Sturgis occurred far more widely than just the

state of South Dakota or its border states.

 In contrast, we find no evidence that lower inflow counties saw differential changes in

COVID-19 case growth relative to counties that did not have any inflows. This suggests that the

super-spreading effects of the Sturgis Event were restricted to counties with more substantial

inflows.

 As the relative measure of inflows normalizes by the total resident pings in the county,

the pattern of results suggested in column (1) of Table 4 were not simply driven by high

population counties or by idiosyncratic SafeGraph coverage differences across counties. 24 In

defining the “dose” of returning rally-goers to their home counties, we also alternately consider

the absolute measure of county-level inflows into Sturgis. Figure 8 shows event-study analyses

of the effects of absolute inflows into Sturgis on the natural log of COVID-19 cases. Consistent

with our relative inflow measure, we find that moderate and higher inflow counties saw larger

increases in COVID-19 cases relative to counties that contribute no inflows into the Sturgis

Rally.

 In column (2) of Table 4, we show dose-response estimates using the absolute inflow

measure. The results continue to show strong evidence that in the weeks following the Sturgis

Rally, COVID-19 cases grew more rapidly in counties that sourced more attendees to the Sturgis.

In our highest absolute inflow counties — comprised of (i) Adams County, Colorado, (ii)

Jefferson County, Colorado, (iii) Weld County, Colorado, (iv) Maricopa County, Arizona, (v)

24
 It also accounts for differential risk of exposure from potential population mixing. For instance, 100 returning
residents from the rally to their home county would have different implications for community spread if the home
county has a relatively smaller population (than if the home county was more populated).

 26
You can also read