GOA PEARL OF THE ORIENT - February 2018 - IBEF

Page created by Dwayne Strickland
 
CONTINUE READING
GOA PEARL OF THE ORIENT - February 2018 - IBEF
GOA
 PEARL OF THE ORIENT

For updated information, please visit www.ibef.org   February 2018
GOA PEARL OF THE ORIENT - February 2018 - IBEF
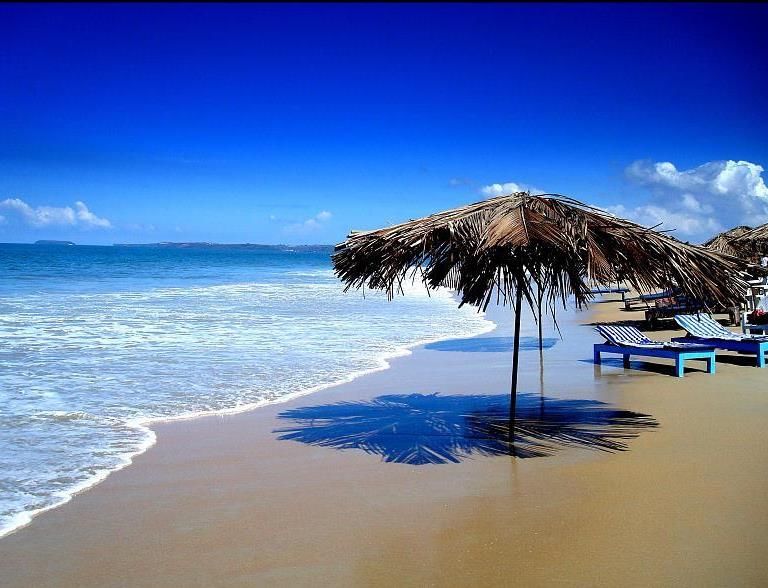
Table of Content

   Executive Summary……………….….…….3

   Advantage State…………………..….……..4

   Goa Vision 2035…………………….………5

   Goa – An Introduction…………….……..….6

   Annual Budget 2016-17.…………..............18

   Infrastructure Status……………...………... 20

   Business Opportunities…………...…………37

   Doing Business in Goa…………..………… 55

   State Acts & Policies………….….………… 56
GOA PEARL OF THE ORIENT - February 2018 - IBEF
EXECUTIVE SUMMARY

                                                  Around 32.29 million tonnes of iron ore was extracted from 44 operational mines in the state between
     India’s major iron ore                        September 2015 and October 2017.
     producer
                                                     Exports of iron ore reached 17.64 million tonnes between September 2015 and November 2017.

                                                  During 2016-17, the total traffic handled by Mormugao port was recorded to be 33.18 million tonnes,
     Mormugao Port,
                                                   registering a growth of 59.70% over the previous year, which is the highest growth rate among 12 major
     reflected remarkable                          ports of the country. The port handled 21.35 million tonnes of cargo in 2017-18*.
     growth
                                                  The average output per ship berth day was recorded to be 12,042 million tonnes during the same period.

     Strong economic                              Goa is one of the fastest growing states in the country. Goa’s net state domestic product (NSDP) was US$
     growth                                        8.55 billion in 2016-17.

                                                  Goa is a popular tourist destination due to its natural beauty and bountiful avenues for leisure and relaxation.
     Tourist paradise                              During 2016, Goa was the ninth most visited state in terms of footfall of foreign tourists with Foreign Tourist
                                                   Arrivals (FTAs) reaching 680,683.

    Note: * up to January 2018
    Source: Economic Survey of Goa, Mormugao Port Trust Goa, Ministry of Mines, Ministry of Tourism, Indian Express

3        GOA                                                                                                          For updated information, please visit www.ibef.org
GOA PEARL OF THE ORIENT - February 2018 - IBEF
ADVANTAGE GOA

      March 2015                           High Economic Growth                                              Facilitating infrastructure                         January
                              GSDP compounded annual growth rate was at about                  Goa has a well-developed social, physical and                    2018
        Installed              12.55% between 2011-12 and 2016-17.                               industrial infrastructure, and virtual connectivity.
                                                                                                                                                                 Installed
         thermal              The state has one of the highest per capita GSDP in the          It has an international airport that is in line its ambition     thermal
          power                country and stands at about US$ 6,044.5 in 2016-17.               to be a globally recognised leisure destination. It also
                                                                                                                                                                   power
        capacity:                                                                                has significant port infrastructure.
                                                                                                                                                                 capacity:
      400.02 MW                                                                                                                                                 521.32 MW

                                                                                       Advantage
                                                                                         Goa

                                            Strong presence in                                                    Rich labour pool
                                   mining, tourism and pharmaceuticals                          Goa’s high rate of literacy has attracted knowledge-
                              Abundant reserves of iron ore.                                    based industries such as pharmaceuticals,
                                                                                                 biotechnology and IT.
                              Established base for the pharmaceuticals industry and
                               an emerging destination for knowledge-based                      A large proportion of the population can speak English,
                               industries such as biotechnology and IT.                          which helps boost the state’s tourism and ITeS
                                                                                                 industries.
                              High inflow of international tourists driving tourism
                               revenue.

    Note: 2016-17 estimate for GSDP based on NSDP figures – GSDP is calculated as percentage of NSDP based on data for FY12-16
    Source: Economic Survey of Goa, 2014-15, Press Information Bureau GSDP: Gross State Domestic Product

4        GOA                                                                                                        For updated information, please visit www.ibef.org
GOA PEARL OF THE ORIENT - February 2018 - IBEF
GOA VISION 2035

                                                  The foundation of high                   The state plans to preserve its
                                                   quality governance should                 natural beauty at all costs
                                                   be fairness, accountability              To ensure vibrant future for the
                                                   and transparency.                         habitats of the state.

                  Goa plans to emerge as the                                                                             To conserve Goa’s biodiversity,
                   most well-governed state in                Governance             Preserve beauty                       embrace responsible mining,
                   India.                                                              and serenity                        develop tourism sites.

                                                                           Vision 2035

                   Goa’s per capita GDP is
                                                            Value chains to          Knowledge centric                     In spite of its higher literacy
                    twice that of India and the
                                                               success                                                      rate, the state plans to move
                    state aims to exceed that in
                                                                                                                            one step ahead.
                    the next 25 years.

                                                  To depend on natural
                                                   resources and related logistic            The state plans to be a
                                                   industries, tourism and related            knowledge-centric destination in
                                                   services, healthcare & pharma              the upcoming years.
                                                   industry, etc.

    Source: Goa Chamber of Commerce and Industry

5        GOA                                                                                              For updated information, please visit www.ibef.org
GOA FACT FILE

                                                                             Parameters                                     Arunachal Pradesh

                                                                             Capital                                              Panaji
                                                                             Geographical area (sq km)                            3,702
                                                                             Administrative districts (No)                          2
                                                                             Population density (persons per sq km)                364
                                                                             Total population (million)                            1.46
                                                                                Male population (million)                          0.74
                                                                                Female population (million)                        0.72
                                                                             Sex ratio (females per 1,000 males)                   973
                                                                             Literacy rate (%)                                     88.7
      Goa is located in the western region of India. The state shares its
       border with the Arabian Sea to the west, Maharashtra to the north
       and Karnataka to the south and the east.
      Languages spoken are Konkani, Marathi, Portuguese, Hindi and
       English.
      Goa’s administrative headquarters are located at Panaji (the state
       capital) and Margao. The state has two districts: North Goa and
       South Goa.
      Goa has a tropical climate, with a monsoons lasting from June to
       September. Due to its long coastline, the weather is hot and humid
       for the rest of the year.

    Source: Census 2011

6        GOA                                                                                     For updated information, please visit www.ibef.org
GOA IN FIGURES … (1/2)

     Parameter                                         Goa       All states    Source

     Economy                                         2016-17      2016-17

                                                                               Aranca Estimates based on NSDP figures provided by
         GSDP as a percentage of all states’ GSDP      0.4         100.0
                                                                               Directorate of Economics and Statistics, Goa
                                                                               Aranca Estimates based on NSDP figures provided by
         GSDP growth rate (%)                          12.5        10.98
                                                                               Directorate of Economics and Statistics, Goa
                                                                               Aranca Estimates based on NSDP figures provided by
         Per capita GSDP (US$)                       6,044.5       1,611
                                                                               Directorate of Economics and Statistics, Goa

     Physical Infrastructure                         2016-17      2016-17

         Installed power capacity (MW)               548.08      334,399.83    Central Electricity Authority, as of January 2018

                                                                               Telecom Regulatory Authority of India, as of
         Wireless subscribers (No)1                 93,210,472   11,624,7043
                                                                               November 2017
                                                                               Telecom Regulatory Authority of India, as of
         Internet subscribers (million)                35          429.24
                                                                               September 2017

         National Highway length (km)                  262       100,087.08    NHAI & Roads and Building Department

         Major and minor ports (No)                    1+5        13+187       India Ports Association

         Airports (No)                                  1           125        Airports Authority of India

    1Denotes   Goa including Maharashtra

7        GOA                                                                   For updated information, please visit www.ibef.org
GOA IN FIGURES … (2/2)

     Parameter                                                              Goa                     All states    Source

     Social Indicators

         Literacy rate (%)                                                  88.7                        73.0      Census 2011

         Birth rate (per 1,000 population)                                  12.9                        20.4      SRS Bulletin, September 2017

     Investments

                                                                                                                  Department of Industrial Policy & Promotion, From
         FDI equity inflows (US$ billion)                                  0.964                      357.47
                                                                                                                  April 2000 to September 2017

     Industrial Infrastructure

         Completed and Operational PPP projects                                                                   DEA, Ministry of Finance, Government of India, July
                                                                              9                        1,565
         (No)                                                                                                     2016
                                                                                                                  Ministry of Commerce & Industry, Department of
         Exporting SEZs (No)                                                  0                          222
                                                                                                                  Commerce, December 2017

    Note: PPP: Public Private Partnership, SEZ: Special Economic Zone, 1Only notified and formally approved SEZ

8        GOA                                                                                                      For updated information, please visit www.ibef.org
ECONOMIC SNAPSHOT – GSDP

      At current prices, Goa’s gross state domestic product (GSDP) was                                 GSDP
                                                                                                         Visakhapatnam
                                                                                                              of Goa at current
                                                                                                                         port traffic
                                                                                                                                prices(million
                                                                                                                                        (in US$tonnes)
                                                                                                                                                 billion)
       about US$ 9.16 billion in 2016-17.

      The GSDP increased at a compound annual growth rate (CAGR) of                            10.00
                                                                                                                                     CAGR 7.6%
       7.6% between FY12-17..
                                                                                                 9.00

                                                                                                                                                                     9.16
      Goa’s economic growth is driven by the strong performance of
       industrial sectors such as mining, tourism and pharmaceuticals.                           8.00

                                                                                                                                                           8.14
                                                                                                 7.00

                                                                                                                                                 7.17
                                                                                                 6.00

                                                                                                             6.35

                                                                                                                           5.72

                                                                                                                                       5.39
                                                                                                 5.00

                                                                                                 4.00

                                                                                                 3.00

                                                                                                 2.00

                                                                                                 1.00

                                                                                                 0.00

                                                                                                             2011-12

                                                                                                                           2012-13

                                                                                                                                       2013-14

                                                                                                                                                 2014-15

                                                                                                                                                           2015-16

                                                                                                                                                                     2016-17E
    Note: 2016-17 estimate for GSDP based on NSDP figures – GSDP is calculated as percentage of NSDP based on data for FY12-16
    Source: Directorate of Economics and Statistics Goa, Government of Goa, Economic Survey 2016-17, Aranca Research

9        GOA                                                                                                           For updated information, please visit www.ibef.org
ECONOMIC SNAPSHOT – NSDP

      Goa’s net state domestic product (NSDP) was about US$ 8.55 billion                            NSDP
                                                                                                      Visakhapatnam
                                                                                                           of Goa at current
                                                                                                                      port traffic
                                                                                                                             prices(million
                                                                                                                                     (in US$tonnes)
                                                                                                                                              billion)
       in 2016-17.

      The NSDP grew at a CAGR of 7.70% between 2011-12 and 2016-                             9.00
                                                                                                                              CAGR 7.70%
       17.

                                                                                                                                                               8.55
                                                                                              8.00

                                                                                              7.00

                                                                                              6.00

                                                                                                                                                     6.31
                                                                                                       5.90

                                                                                                                                           5.63
                                                                                                                    5.37
                                                                                              5.00

                                                                                                                                4.97
                                                                                              4.00

                                                                                              3.00

                                                                                              2.00

                                                                                              1.00

                                                                                              0.00

                                                                                                       2011-12

                                                                                                                    2012-13

                                                                                                                                2013-14

                                                                                                                                           2014-15

                                                                                                                                                     2015-16

                                                                                                                                                               2016-17
 Source: Directorate of Economics and Statistics Goa, Government of Goa, Economic Survey 2016-17

10      GOA                                                                                                      For updated information, please visit www.ibef.org
ECONOMIC SNAPSHOT – PER CAPITA GSDP

      The state’s per capita GSDP was US$ 6,044.5 one of the highest in                           GSDP
                                                                                                     Visakhapatnam
                                                                                                        per capita of port
                                                                                                                      Goa traffic
                                                                                                                           at current
                                                                                                                                  (million
                                                                                                                                       prices
                                                                                                                                           tonnes)
                                                                                                                                              (in US$)
       India, during 2016-17.

      Goa’s per capita GSDP increased at a CAGR of 6.86% between                                                                     CAGR 6.86%
       2011-12 and 2016-17.
                                                                                              7,000.0

                                                                                              6,000.0

                                                                                                                                                                         6,044.5
                                                                                                                                                              5,409.3
                                                                                              5,000.0

                                                                                                                                                    4,797.4
                                                                                                            4,337.9
                                                                                              4,000.0

                                                                                                                            3,876.6

                                                                                                                                          3,628.4
                                                                                              3,000.0

                                                                                              2,000.0

                                                                                              1,000.0

                                                                                                  0.0

                                                                                                            2011-12

                                                                                                                            2012-13

                                                                                                                                          2013-14

                                                                                                                                                    2014-15

                                                                                                                                                              2015-16

                                                                                                                                                                        2016-
                                                                                                                                                                         17E
 Note: 2016-17 estimate for GSDP based on NSDP figures – GSDP is calculated as percentage of NSDP based on data for FY12-16
 Source: Directorate of Economics and Statistics Goa, Government of Goa, Aranca Research

11      GOA                                                                                                           For updated information, please visit www.ibef.org
ECONOMIC SNAPSHOT – PER CAPITA NSDP

      The state’s per capita NSDP was US$ 5,637.96 in 2016-17.                                     NSDP
                                                                                                      Visakhapatnam
                                                                                                         per capita of port
                                                                                                                       Goa traffic
                                                                                                                            at current
                                                                                                                                   (million
                                                                                                                                        prices
                                                                                                                                            tonnes)
                                                                                                                                               (in US$)
      Goa’s per capita NSDP increased at a CAGR of 6.96% between
       2011-12 and 2016-17.                                                                                                          CAGR 6.96%
      Certain factors, such as substantial foreign exchange earnings from                    6000.00
       mining and tourism industries, contributed to the high per capita

                                                                                                                                                                       5637.86
       NSDP in the state.
                                                                                              5000.00

                                                                                              4000.00

                                                                                                                                                             4193.09
                                                                                                           4026.93

                                                                                                                                                   3767.74
                                                                                                                           3637.50

                                                                                                                                         3349.14
                                                                                              3000.00

                                                                                              2000.00

                                                                                              1000.00

                                                                                                   0.00

                                                                                                           2011-12

                                                                                                                           2012-13

                                                                                                                                         2013-14

                                                                                                                                                   2014-15

                                                                                                                                                             2015-16

                                                                                                                                                                       2016-17
 Source: Directorate of Economics and Statistics Goa, Government of Goa, Economic Survey 2016-17

12      GOA                                                                                                          For updated information, please visit www.ibef.org
ECONOMIC SNAPSHOT – PERCENTAGE
                  DISTRIBUTION OF GSDP

      In 2015-16, the tertiary sectorµ accounted for 46.67% of GSDP at                                  Visakhapatnam
                                                                                                               GSDP composition
                                                                                                                       port trafficby
                                                                                                                                   (million
                                                                                                                                      sectortonnes)
       constant prices, followed by secondary sector with a share of
       46.45% and the primary sector contributing a share of 6.88%..
                                                                                                100%
      At 7.11%, the tertiary sector had the highest growth among all three                                          45.19%            CAGR            46.67%
       sectors between 2004-05 and 2015-16. It was followed by the                               90%
       secondary sector (6.92%), and the primary sector (1.67%).
                                                                                                 80%
      Growth in the tertiary sector has largely been driven by the tourism                                                            7.11%
       industry, which facilitated growth of other related industries such as                    70%
       banking and financial services, real estate, and business services.
                                                                                                 60%

                                                                                                 50%                 42.54%                            46.45%

                                                                                                 40%
                                                                                                                                       6.92%
                                                                                                 30%

                                                                                                 20%

                                                                                                 10%
                                                                                                                     12.27%
                                                                                                                                       1.67%
                                                                                                                                                        6.88%
                                                                                                   0%
                                                                                                                     2004-05                           2015-16

                                                                                                          Primary Sector       Secondary Sector        Tertiary Sector

 Source: Directorate of Economics and Statistics Goa, Government of Goa Sector-wise %share of GSDPµ -Geometric mean of YoY calculation from 2004-05 to 2015-16

13      GOA                                                                                                       For updated information, please visit www.ibef.org
ECONOMIC SNAPSHOT – AGRICULTURAL
                  PRODUCTION

      Cashew processing has been a traditional industry in the state.                                                                         Annual production
                                                                                            Category
       Cashew apple is also used in the production of feni, a local liquor,                                                               2016-17 (in thousand tonnes)
       which has become internationally popular. During 2016-17, cashew                     Food-grains                                               122
       nut production in the state was estimated at 30,200 tonnes.
                                                                                            Rice                                                    116.07
      Agriculture in Goa comprises cultivation of crops like paddy, cashew,
       coconut and seasonal vegetables and pulses, and provides                             Cashew                                                   30.2
       livelihood support to nearly 12% of the state’s 1.5 million population.              Arecanut                                                   3

                                                                                            Sugarcane                                                40.2

                                                                                            Milk                                                     51.36

 Source: Economic Survey of Goa, 2014-15, Indian Horticulture Database 2014-15, National Horticulture Board, State Budget 2016-17, DAHD

14      GOA                                                                                                        For updated information, please visit www.ibef.org
ECONOMIC SNAPSHOT – EXPORTS

     Commodity wise container traffic handled at Mormugao port (tonnage in metric tonnes)

                                                                  2013-14                                               2014-15                           2015-16                          2016-17
     Item
                                                          TEUS                Tonnage                        TEUS                Tonnage          TEUS          Tonnage           TEUS           Tonnage
     Frozen fish                                          2,328                      32,804                  3,064                 42,940         2,308              32,271       3,128              44.735
     Zinc oxide                                            96                         1,697                  138                   2,476           19                 320              -                   -
     Pig iron                                             381                        10,328                  1,228                 33,580          641               17,570        472               12,977
     Battery plates                                        17                         354                       6                   126             3                  63              3               67
     Coke                                                  36                         608                     77                  1,769            13                180           -                   -
     Iron casting                                         418                         6,455                  510                   7,511           472               7,226         533                7,586
     Pharmaceutical
                                                          325                         2,537                  750                  6,151            636              5,076         555                4,522
     products
     Total export                                         6,445                      101,453                 8,682                144,423         8,682             108,286        NA                  NA

                       Visakhapatnam
                              Fisheriesport
                                        exports
                                            trafficfrom
                                                     (million
                                                         Goatonnes)                                                                    Iron oreVisakhapatnam
                                                                                                                                                exports from Mormugao
                                                                                                                                                              port trafficPort Trust
                                                                                                                                                                           (million   (‘000 tonnes)
                                                                                                                                                                                    tonnes)

                                                                          37.8         42.7       32.8       42.9                    15000                                     14,723
       80.0                                                  37.2                                                         60.0
       60.0                        21.5        27.0                                                                       40.0       12000
       40.0     18.3
                                     42.9

                                                41.3

                                                                63.3

                                                                           70.7

                                                                                        69.8

                                                                                                   68.3

                                                                                                              70.2

                                                                                                                          20.0        9000
                  2007-08 23.2

       20.0                                                                                                                                                                                      6,729
        0.0                                                                                                               0.0         6000
                                                                                                                                                                    3,570
                                     2008-09

                                                2009-10

                                                                2010-11

                                                                           2011-12

                                                                                        2012-13

                                                                                                   2013-14

                                                                                                              2014-15

                                                                                                                                      3000
                                                                                                                                                  604
                                                                                                                                            0
                                 Value (US$ million, LHS)                              Quantity ('000 tonnes)                                   2014-15         2015-16        2016-17          2017-18*

 Note: * up to January 2018, Data is as per latest available information
 Source: Ministry of Mines, Mormugao Port Trust Goa

15      GOA                                                                                                                                             For updated information, please visit www.ibef.org
ECONOMIC SNAPSHOT – GOA EXPORT POTENTIAL

     Commodities exported from Mormugao Port

     Commodities                         2013-14 (in million tonnes)   2014-15 (in million tonnes)   2015-16 (in million tonnes)   2016-17 (in million tonnes)

     Iron ore & iron ore pellets                     0.04                         0.60                          3.57                         14.72
     Other ores                                      0.16                         0.27                          0.21                          NA
     Total ores                                      0.20                         0.87                          3.78                         14.72
     Alumina                                         NA                           0.02                          0.02                          0.05
     Steel slabs                                     0.06                         0.06                          NA                            0.14
     Hot rolled coils                                1.21                         1.63                          0.84                          1.82
     Container cargo                                 0.12                         0.17                          0.14                          0.17
     Granite                                         0.36                         0.30                          0.31                          0.29
     Other cargo                                     0.28                         0.27                          0.31                          0.14
     Wheat                                           0.04                         NA                            NA                            NA
     Sugar                                           0.06                         0.01                          0.01                          NA
     Total exports                                   2.33                         3.33                          5.41                         17.33

 Date: Data is as per latest available information
 Source: Mormugao Port Trust, Goa; NA – Not available

16      GOA                                                                                              For updated information, please visit www.ibef.org
ECONOMIC SNAPSHOT – FDI INFLOWS &
                    INVESTMENTS

      According to the Department of Industrial Policy & Promotion (DIPP),              FDI equity
                                                                                             Visakhapatnam
                                                                                                    inflows, 2008-09
                                                                                                              port traffic
                                                                                                                      to 2017-18
                                                                                                                           (million(US$
                                                                                                                                    tonnes)
                                                                                                                                        million)
       FDI inflows into the state of Goa, during April 2000 to September
       2017, was US$ 964 million.

                                                                                                                  302
                                                                                  350
                                                                                  300
                                                                                  250

                                                                                                     169
                                                                                  200
                                                                                  150

                                                                                                                                                                                            83
                                                                                  100

                                                                                                                                                                                                      40
                                                                                                                                38

                                                                                                                                                                 35
                                                                                           29

                                                                                                                                                                           18
                                                                                                                                                    17
                                                                                   50

                                                                                                                                          9
                                                                                     0

                                                                                                                                                                                                      1
                                                                                           2008-09

                                                                                                     2009-10

                                                                                                                  2010-11

                                                                                                                                2011-12

                                                                                                                                          2012-13

                                                                                                                                                    2013-14

                                                                                                                                                                 2014-15

                                                                                                                                                                           2015-16

                                                                                                                                                                                            2016-17

                                                                                                                                                                                                      2017-18
                                                                                 Note: 1Up to September 2017
     Current Ongoing Projects under GSIDC                                        Source: Department of Industrial Policy & Promotion

     Project                                          Category      Start date       End date                   Status as on July 2016                        Estimated cost (in US$ million)

     Construction of Bridge across river Mandovi
                                                     Connectivity   July 2014    September 2017                             40% completed                                       54.23
     at Panaji

     Construction of Panchayat Complex at              Public
                                                                    March 2014    February 2016                             75% completed                                            1.26
     Chicalim                                         Amenities

     Establishing infrastructure for Organic                         February
                                                     Environment                   August 2016                              80% completed                                            0.45
     Waste Management Facility                                         2014

     Infrastructure works for Sanjay Centre for       Sports &      November
                                                                                 November 2016                              60% completed                                             1
     Special Education at Bogda, Vasco.               Education       2014

     Construction of Primary Health Centre at        Healthcare
                                                                    July 2015      October 2016                             32% completed                                            0.51
     Navelim, Margao, Goa.                            Facilities

 Date: Data is as per latest available information

17       GOA                                                                                                   For updated information, please visit www.ibef.org
ANNUAL BUDGET 2017-18… (1/2)

      The Gross Budget presented for 2017-18 is US$ 2.42 billion as against US$ 2.19 billion in 2016-17. A sum of US$ 145.59 million has been
       allocated for social sector, US$ 70.65 million has been allocated for child & women empowerment and US$ 28.26 million for tribal welfare.

      Increase in PWD budget allocation of US$ 282.61 million.

      20 MLD water treatment plant for Panaji will be completed till 2018.

      100 dual pump solar power water supply projects in remote areas will be introduced.

      New sewage system in Candolim & Bicholim. US$ 15.62 million provided for creating additional infrastructure for 36th National Games in 2018.

      US$ 22.31 million allotted to improve public transport, especially to tourist destinations. Dedicated traffic management plan for all major cities in
       Goa. Betul, Chapora & Talpana jetties will be upgraded. Focus on total implementation of current IT policy; Startup Promotion Board to be
       established. Regional plan to be completed & notified by December 2017.

 Source: Finance Department, Government of Goa

18      GOA                                                                                           For updated information, please visit www.ibef.org
ANNUAL BUDGET 2017-18 … (2/2)

     Annual budget (estimates in US$ million)

     Departments                                     Budget allocations (2017-18)
     Education                                                 234.79
     Public works                                              307.76
     Sanitation                                                 51.99
     Water resources                                            52.08
     Mining                                                      8.59
     Agriculture                                                26.72
     Social welfare                                             48.46
     Medical and Public Health                                  79.63
     Tourism                                                    31.07
     Panchayats                                                 29.83
     Urban development and municipalities                        1.49
     Sports & youth affairs                                     32.03
     Transport                                                  42.38

 Source: State Budget 2015-16, Government of Goa

19      GOA                                         For updated information, please visit www.ibef.org
PHYSICAL INFRASTRUCTURE – ROADS

      NH-17 runs along India's West Coast & links Goa to Mumbai in the                Road type                                     Road length (km)
       north & Mangalore to the south. NH-4A running across the state
       connects Panaji to Belgaum (Karnataka) in the east. As of May 2015,             National highways                                   262
       the construction of 4 state highways, 10 major district roads & 76
       rural roads are under progress.                                                 State highways                                      232

      The state had a road density of 68.7 km per 1,000 sq. km of area, as            District highways                                   815
       of December 2016.
      As per budget 2016-17, under the National Highway Development
       Programme (NHDP- Phase III), projects for 4 laning of NH-17 as well
       as NH-4 received the in-principle approval during 2015-16. The
       project was under progress as of February 2017.
      As per Budget 2017-18, dedicated cell would be made in PWD to
       look after PM Gram Sadak Yojana and other infrastructure works.
       Around 65% of the work on New Mandovi bridge was completed as
       of August 2017 while work on the new Khandepar bridge costing
       US$ 44.18 million will be completed before 2020. Road safety audit
       worth US$ 32.73 million to be taken up in 2017.

 Source: Directorate of Transport PWD: Public Works Department, State Budget 2016-17

20      GOA                                                                                                For updated information, please visit www.ibef.org
PHYSICAL INFRASTRUCTURE – RAILWAYS

                                                    The total railway route in Goa is around 167 km long, comprising two
                                                     rail tracks: the Konkan Railways line & the South-Western Railways
                                                     line. These routes connect the state to other parts of the country.
                                                    The Konkan Railways line runs from the north to the south and the
                                                     South-Western Railways line runs from west to east. The rail tracks
                                                     cross at the most important junction of the state, the Madgaon railway
                                                     station; Vasco-da-Gama is the other important railway station.
                                                    Konkan Railways, which connects Mumbai, Goa & Mangalore, has
                                                     considerably boosted tourism. The Mormugao port is connected through
                                                     a broad gauge line.
                                                    The government has pulled off a new double-decker luxury train service
                                                     on Konkan Railways route that commutes tourists from Mumbai to Goa.
                                                    The Government of India introduced a Double Decker Express train on
                                                     December 6, 2015 to improve connectivity between Goa & Mumbai, t.
                                                    An amount of US$ 14.87 million has been allocated under 2017-18
                                                     budget towards Konkan Railways. 4 railway overbridges are to be built
                                                     in Goa with financial support from the Rail Ministry.
                                                    On May 22, 2017, state-of-the-art, high-speed, 15 coach train Tejas
                                                     Express, with a speed of 200 km/hour, made its debut. The train would
                                                     run between Mumbai to North Goa, covering a distance of 579 km in
                                                     8.5 hours. The train has 2 classes — executive chair car & chair car,
                                                     and is equipped with facilities like automatic doors, secured gangways,
                                                     Wi-Fi, LCD screens, magazines, tea-coffee vending machines, bio-
                                                     toilets, etc.
                           Source: Maps of India

21   GOA                                                              For updated information, please visit www.ibef.org
PHYSICAL INFRASTRUCTURE – AIRPORTS … (1/2)

                                                                                              Goa has one airport at Dabolim, which functions as a domestic as
                                                                                               well as an international airport. The state is connected to most
                                                                                               Indian cities by air.
                                                                                              The state ranks among the top 10 in all-India air traffic, most of
                                                                                               which is tourism related.
                                                                                              The state has good connectivity in terms of international flights,
                                                                                               including chartered flights from European countries.
                                                                                              Passenger footfalls at the Goa airport during 2016-17 reached
                                                                                               68,56,362 with aircraft movement reaching 47,801 flights.
                                                                                              The state introduced a new terminal in February 2014 at Dabolim.
                                                                                              As per state budget 2016-17, for the establishment of an
                                                                                               international airport at Mopa in Taluka Pernem, on PPP basis, the
                                                                                               Government of Goa has already issued proposals to shortlisted
                                                                                               builders. The state has acquired 7.4 million sq. metres of land for
                                                                                               the airport. The airport is being designed to handle 4 million
                                                                                               passengers, in addition to the 4 million capacity at Dabolim, to
                                                                                               create a total capacity of 8 million by 2018. The project will be
                                                                                               developed by GMR Airports Ltd. The 1st phase of the airport is
                                                                                               expected to be commissioned during financial year 2019-20.
                                                                                              Moreover, for the development of the civil aviation sector in the
                                                                                               state, an allocation of US$ 22.33 million has been proposed by the
                                                                                               state government.
                                                                                              As per Budget 2017-18, Dabolim airport will be upgraded on a time-
                                                                                               to-time basis even after the completion of Greenfield Mopa
                                                                                               international airport. In January 2018, the state government
                                                                                               appointed consultants to monitor the construction of the airport.

 Source: Airports Authority of India, Department of Tourism, Government of Goa Economic Survey of Goa, Goa Investment Policy 2014

22    GOA                                                                                                          For updated information, please visit www.ibef.org
PHYSICAL INFRASTRUCTURE – AIRPORTS … (2/2)

                                    Goa passenger traffic (million)                                                                           Goa aircraft movement (Nos.)

        8                                                                                                                  60,000
        7
                                                                                                                           50,000

                                                                                            6.86
        6

                                                                                                                                                                                                               47,801
                                                                                                                           40,000
        5

                                                                                                      5.42
                                                                                  5.37

                                                                                                                                                                                                  39,030

                                                                                                                                                                                                                         36,904
        4                                                                                                                  30,000

                                                                        4.51

                                                                                                                                                                                        33,422
                                                            3.89

                                                                                                                                                                              28,904
                                                                                                                                                          27,430

                                                                                                                                                                    26,804
        3
                                                  3.54
                                        3.52

                                                                                                                                    24,326
                                                                                                                           20,000

                                                                                                                                               24,018
                          3.08
               2.63

        2
                                                                                                                           10,000
        1
        0                                                                                                                      0
               2009-10

                          2010-11

                                        2011-12

                                                  2012-13

                                                            2013-14

                                                                        2014-15

                                                                                  2015-16

                                                                                            2016-17

                                                                                                                                    2009-10

                                                                                                                                               2010-11

                                                                                                                                                          2011-12

                                                                                                                                                                    2012-13

                                                                                                                                                                              2013-14

                                                                                                                                                                                        2014-15

                                                                                                                                                                                                  2015-16

                                                                                                                                                                                                               2016-17
                                                                                                      2017-18*

                                                                                                                                                                                                                         2017-18*
     Freight handled by Goa airport (tonnes)

                   2013-14                                            2014-15                                    2015-16                                 2016-17                                            2017-18*
                  4,767                                               4,498                                      4,880                                   4,103                                              3,564

 Note: * April – December 2017
 Source: Airports Authority of India

23     GOA                                                                                                                                    For updated information, please visit www.ibef.org
PHYSICAL INFRASTRUCTURE – PORTS

       Goa has 255 km of rivers & canals, providing an economical mode                         Ports
        for goods transport. As of March 2016, the total capacity at
        Mormugao port stood at 48.79 million MT. A total of 5.03 MT of                         Major ports                             Mormugao
        capacity was added during period 2015-16. The port had a capacity                                                              Panaji
        of 50.04 million MT during 2016-17.
                                                                                                                                       Chapora
          •   During 2017-18*, the general cargo traffic handled at the port was               Minor ports                             Betul
              recorded to be 21.35 million tonnes.
                                                                                                                                       Talpona
       The River Navigation Department was established to provide safe,                                                               Tiracol
        dependable & affordable transport facilities on different ferry routes
        of Goa’s inland waters.                                                                 Commodity-wise Traffic Handled at Mormugao Port during
                                                                                                2016-17
       The Mormugao harbour, a multi-purpose general cargo berth
        situated in the port town of Vasco-da-Gama, handles local &                             Commodity                                Quantity (metric tonnes)
        international maritime cargo traffic.
                                                                                                POL (Petroleum, Oil & Lubricants)                  630,000
       During 2016-17, the total traffic handled by Mormugao port was
        recorded to be 33.18 million tonnes, thereby registering a growth of                    Iron ore                                          14,720,000
        59.70% over the same period in the previous year, which is the
        highest growth rate among 12 major ports of the country.                                Coke and coal                                     12,750,000

       State-of-the-art patrol vessel ICGS Shaunak, the largest & most                         Granite                                            290,000
        advanced new generation OPV was added to Coast Guard fleet in
        February 2017.                                                                          Container cargo                                    230,000

                                                                                                Phosporic Acid                                     3,40,000

     Note: P – Provisional, *up to January 2018
 Source: Ministry of Shipping, Government of India, Indian Ports Association, Mormugao Port Trust

24        GOA                                                                                                     For updated information, please visit www.ibef.org
PHYSICAL INFRASTRUCTURE – POWER

      As of January 2018, Goa had a total installed power generation                                  Visakhapatnam
                                                                                                             Installed power
                                                                                                                       port traffic
                                                                                                                              capacity
                                                                                                                                    (million
                                                                                                                                         (MW)tonnes)
       capacity of 548.08 MW.
                                                                                               600.0
      Of the total installed capacity, 499.32 MW was managed by central
       utilities, 48.71 MW by private utilities and 0.05 MW by state utilities..

                                                                                                                                                                                                 548.1
       Thermal power plants accounted for a significant share in the total

                                                                                                                                                                                       540.56
                                                                                               500.0
       installed capacity with 521.32 MW, whereas nuclear energy and
       renewable energy contributed 26 MW and 0.76 MW respectively.

                                                                                                                                               430.02
      Goa is one of the few states in India to achieve 100% rural                             400.0

                                                                                                                                                                             412.45
                                                                                                                                     400.2

                                                                                                                                                         400.02

                                                                                                                                                                   400.02
       electrification.

                                                                                                                           386.9
                                                                                                                 380.9
                                                                                                       357.2
      The state generates power from its 48 MW naphtha-based plant of
                                                                                               300.0
       Reliance Infrastructure Limited and it depends, largely, on the power
       allocated from the central generating stations.

      The industrial sector is the largest consumer of electricity, followed                  200.0
       by the domestic sector. Goa Electricity Department controls power
       infrastructure in the state.
                                                                                               100.0
      The project for laying a gas pipeline by GAIL from Gokak to Goa for
       gas transportation to Goa has been completed.

      As per the state budget 2016-17, the state government has taken up                        0.0

                                                                                                       2008-09

                                                                                                                 2009-10

                                                                                                                           2010-11

                                                                                                                                     2011-12

                                                                                                                                               2012-13

                                                                                                                                                         2013-14

                                                                                                                                                                   2014-15

                                                                                                                                                                             2015-16

                                                                                                                                                                                       2016-17

                                                                                                                                                                                                 2017-18*
       various underground cabling projects for 2016-17 and has made
       required financial provisions for these projects.

      As per the state budget 2017-18, the state government will build an
       MVA Gas insulated Sub-station at Tuem along with a line to feed this
       Sub- station which will cost approximately US$ 16 million.
 Note: * as of January 2018
 Source: Central Electricity Authority, State Budget 2016-17 Economic Survey of Goa, 2014-15

25      GOA                                                                                                           For updated information, please visit www.ibef.org
PHYSICAL INFRASTRUCTURE – TELECOM

      Goa is among the few states in the country to have 100 per cent            Telecom infrastructure – November 2017
       automatic telephone systems with a good network of telephone
       exchanges.                                                                 Wireless subscribers(1)                         93,210,472

      Goa has a fibre-optic cable network spread through the state; it           Wireline subscribers(1)                          1,779,189
       provides high-speed access for a wide range of internet-related
       services. All the gram panchayats in the state of Goa are connected        Internet subscribers(1)(2)                      30,870,000
       with optical fiber.
                                                                                  Tele-density(1)                                   109.06
      In Goa, all the Gram Panchayats are already connected with optical
       fibre cable. By the middle of December 2015, total number of post
       offices functioning in the state was recorded at 258,

      Moreover, the tele-density in the state stood at 109.061, as of            Some of the major telecom service providers
       October 2017.                                                               Bharat Sanchar Nigam Limited (BSNL)
      In December 2016, the Government of Goa announced the launch of             Tata Indicom
       Goa Yuva Sanchar Yojna, under which the state would be providing
       100 minutes of free talk time and 3 GB of internet data every month,        Bharti Airtel
       free with a new SIM card.                                                   Aircel Limited

                                                                                   Reliance Communications

 Note: 1Denotes Maharashtra including Goa, 2As of September 2017
 Source: Economic Survey of Goa, 2014-15, Telecom Regulatory Authority of India

26      GOA                                                                                           For updated information, please visit www.ibef.org
DEVELOPMENT PROJECTS: URBAN
                   INFRASTRUCTURE

      Panaji is one of the 65 cities identified under the Jawaharlal Nehru               National Urban Information System was introduced by Ministry of
       National Urban Renewal Mission (JNNURM).                                            Urban Development in March 2006. The purpose of this scheme is to
                                                                                           develop the geographic information system database for 152
      Under JNNURM, two projects costing around US$ 15.6 million have
                                                                                           towns/cities in the country. In Goa, 5 towns/cities are covered under
       been sanctioned for Panaji. Areas of development under these projects
                                                                                           this scheme.
       are heritage conservation and water supply for Panaji and surrounding
       areas under the jurisdiction of the corporation of the city of Panaji, Goa.        In April 2017, six rivers of Goa – Mandovi, Zuari, Chapora, Sal,
                                                                                           Mapusa and Chumbharjua were notified by the union government as
      As per the state budget 2017-18, the state government has planned
                                                                                           national waterways under the National Waterways Act, 2016.
       construction of second integrated Municipal Waste Treatment Plant
       along with transfer station at Cacora in South Goa on Designed Built
       Finance Operate & Transfer (DBFOT) basis.

      As per budget 2017-18, US$ 81.81 million would be allocated for Panaji
       under the Smart City mission, 5 major cities to be connected with tourist
       places with frequent plying of KTC with a budget of US$22.31 million. All             Funds allocated to Goa under SJSRY and NULM (US$ million)
       street lights would be converted to LED lights by December 2017, a 2nd
       solid waste treatment plant to be built at Cacora in South Goa, an
                                                                                            0.6
       amount of US$ 17.25 million has been allocated for garbage
       management.                                                                          0.5
                                                                                                                                         0.51
                                                                                            0.4
     Water supply
                                                                                            0.3                  0.37
      Water supply in Goa’s urban and rural areas is 143 and 82 litres per
                                                                                            0.2
       capita per day (LPCD), respectively.                                                          0.23
                                                                                                                                                                  0.2
                                                                                            0.1                              0.14                    0.13
      Goa’s water tariffs are among the cheapest in the country.
                                                                                              0
      The state has proposed an investment outlay of US$ 160.1 million for                        2012-13     2013-14     2014-15     2015-16     2016-17     2017-18
       water supply and sanitation projects in its 12th Five-Year Plan (2012-17).

 Source: JNNURM, Ministry of Urban Development, Public Works Department of Goa SJSRY – Swarna Jayanti Shahari Rozgar Yojana NULM – National Urban Livelihoods Mission

27      GOA                                                                                                    For updated information, please visit www.ibef.org
DEVELOPMENT PROJECTS: PUBLIC PRIVATE
                  PARTNERSHIP (PPP) PROJECTS

     As of November 2017, Goa had 9 PPP projects, of which one project is in pre-construction stage, three projects are under construction and five
     projects are in operation and maintenance stage.

     PPP Projects - Goa

     Project Name                                      Sector                           Status                        Total cost (US$ million)
     100 TPD solid waste management
                                                   Water sanitation        Operation and Maintenance Stage                     22.65
     facility unit at Calangute

     Implementation of municipal solid waste
                                                   Water sanitation        Operation and maintenance stage                     23.10
     treatment plant at Bardez in North Goa

     Development of Berth No. 7                       Transport            Operation and maintenance stage                     33.60

     Construction of Berth 5A; 6A at
                                                      Transport            Operation and maintenance stage                     34.15
     Mormugao in South Goa

     Bulk cargo berths No. 5A & 6A                    Transport            Operation and maintenance stage                     37.42

     Re-development of berth 8, 9 and Barge
     berth with a capacity of 19.2 MMTPA at           Transport                   Under Construction                          188.14
     Marmugao port
     Setting up of 10 TPD solid waste
                                                   Water sanitation               Under Construction                           2.33
     management unit at Pernem

     Construction of cruise terminal at
                                                      Transport                   Under Construction                           12.42
     Aguada

     International Airport (Mopa) Project             Transport                 Pre-construction Stage                        465.64

28      GOA                                                                                      For updated information, please visit www.ibef.org
DEVELOPMENT PROJECTS: SEZ AND INDUSTRIAL
                  ESTATES … (1/3)

      As of December 2017, Goa had seven formally approved and three                           Sector-wise formally approved SEZs in Goa, December
       notified special economic zones (SEZs). However, there are no
       operational SEZs in the state and no in-principle approved SEZ.                                                                         IT/ITES
      On completion, the SEZs would primarily cover knowledge-based                                          14%
                                                                                                                        29%                    Biotech
       industries such as biotechnology and IT/ITeS. The Goa Industrial
                                                                                                        14%
       Development Corporation (Goa-IDC) assists in establishing                                                                               IT
       industries in specific industrial areas and estates. Goa-IDC has
                                                                                                          14%                                  Pharmaceuticals
       established 20 industrial estates in various talukas of Goa. It plans to
                                                                                                                     29%
       expand eight of these existing units and establish another five
                                                                                                                                               Gems and Jewellery
       industrial estates.

      The Government is committed to make Goa an aspirational
                                                                                           Sector-wise formally approved SEZs in Goa, December 2017
       investment destination for best-in-class manufacturing, tourism,
       entertainment and other service industries, including research and                  Sector                   Developer                        Number of SEZs
       knowledge-based industries. Accordingly, the Government has set
                                                                                           IT/ITeS                  K. Raheja Corp Pvt. Ltd.                 1
       an ambitious target of creating 50,000 jobs by 2019, facilitating new
       investments of around US$ 4.2 billion in the state during 2014-19.                                           Peninsula Pharma Research
                                                                                           Biotechnology                                                     1
                                                                                                                    Centre Pvt Ltd
                                                                                           Pharmaceuticals          Meditab Specialities Pvt Ltd             1
                                                                                                                    Paradigm Logistics and
                                                                                           IT/ITeS                                                           1
                                                                                                                    Distribution Pvt Ltd
                                                                                           Gems and
                                                                                                                    Planet Mercantile Company                1
                                                                                           Jewellery
                                                                                           Biotechnology            Inox Mercantile company                  1
                                                                                           IT                       Panchbhoomi Infrastructure               1

 Source: Ministry of Commerce & Industry, Department of Commerce, Goa Industrial Development Corporation, Economic Survey of Goa

29      GOA                                                                                                      For updated information, please visit www.ibef.org
DEVELOPMENT PROJECTS: SEZS AND INDUSTRIAL
                  ESTATES … (2/3)

     Formal approvals granted in the Board of Approvals after coming into force of SEZ Rules

     Name of the developer                                Location                                                       Type           Area (hectares)

     Meditab Specialities Private Limited                 Bhut Kham, Kerim Industrial Estate, Taluka Ponda, Goa     Pharmaceuticals         123.20

     Paradigm Logistics and Distribution Private
                                                          Phase IV - Verna Industrial Estate, Goa.                      IT/ITeS              40.25
     Limited

     K. Raheja Corp Pvt. Ltd.                             Verna Industrial Area, Goa                                    IT/ITeS             105.91

     Peninsula Pharma Research Centre Pvt. Ltd.           Sancoale Tal- Mormugao, Goa                                   Biotech             20.365

     Planetview Mercantile Company Limited                Verna, Goa                                              Gems and jewellery         13.28

     Inox Mercantile Company Private Limited              Verna, Goa                                                    Biotech              48.48

                                                          Survey No. 260, Village Socorro, Bardez Taluka, North
     Panchbhoomi Infrastructure Private Limited                                                                           IT                 18.5
                                                          Goa District, Goa

 Source: Ministry of Commerce & Industry, Department of Commerce

30      GOA                                                                                            For updated information, please visit www.ibef.org
DEVELOPMENT PROJECTS: SEZS AND INDUSTRIAL
                  ESTATES … (3/3)

                                                  Taluka                       Industrial estate
                                                  Ponda                Bethora, Madkai, Kundai, Shiroda

                                                  Pernem                             Tuem

                                                  Bardez                Colvale, Mapusa, Pilerne, Tivim

                                                  Bicholim                          Bicholim

                                                  Sattari                    Honda and Pissurlem

                                                  Tiswadi                            Corlim

                                                  Salcete                Verna, Margao and Cuncolim

                                                  Mormugao                         Sancoale

                                                  Quepem                            Kakoda

                                                  Sanguem                          Sanguem

                                                  Canacona                         Canacona

 Source: Goa Industrial Development Corporation

31    GOA                                                    For updated information, please visit www.ibef.org
SOCIAL INFRASTRUCTURE – EDUCATION … (1/2)

      The state has a literacy rate of 88.7 per ent according to the data of           Literacy rate (%)
       Census 2011; the male literacy rate is 92.65% & the female literacy
       rate is 84.66%.                                                                   Total                                             88.70

      During 2016-17, the total enrolments in schools were recorded to be               Male                                              92.65
       275,464.
      As per state budget 2017-18, the Government of Goa has proposed to                Female                                            84.66
       allocate US$ 6.24 million as financial assistance for Goa University,
      Goa is planning to set up an Indian Institute of Science, Education and          Some of the higher education institutions
       Research, an Indian Institute of Technology (IIT) and an Indian Institute of      Shree Rayeshwar Institute of Engineering and Information
       Management (IIM) by 2035; to become a leading educational hub in the
                                                                                          Technology
       country.
                                                                                         Padre Conceicao College of Engineering
      Vasco, Margao & Panaji are proposed to be developed as a smart cities
       in the state.                                                                     National Institute of Oceanography
      In Budget 2017-18 the state government allocated US$ 0.89 million                 Parvatibai Chowgule College of Arts & Science
       additional grants for primary schools, that impart education in Marathi &
                                                                                         Don Bosco College
       Konkani, 15 additional supervisors & 50 counsellors in all schools & higher
       secondary’s to be recruited, 11th standard students to be given laptops           St. Xavier’s College
       with a budget of US$ 7.44 million, transport facility for students, integrated
                                                                                         BITS Pilani Goa campus
       educational complexes at Mapusa & Margao to be developed.

 Source: Economic Survey of Goa, 2014-15, Goa State Budget 2016-17

32      GOA                                                                                                 For updated information, please visit www.ibef.org
SOCIAL INFRASTRUCTURE – EDUCATION … (2/2)

      Goa has a number of leading engineering, business management,               Educational Statistics, 2016-17
       medical and legal institutes.

      The Maritime School, under the Captain of Ports Department,                 Primary schools                                    1,181
       Government of Goa, is among the first of its kind in the country.
                                                                                   Middle schools                                      68
      As per the state budget 2016-17, under Goa Scholarship Scheme,
       the state government proposed to add ten more scholarships for              Secondary schools                                   401
       students by providing a unique 2 year funding window from the date
       of their selection.                                                         Higher secondary schools                            99

      The state government is planning to set up its 2nd medical college in       Primary level teacher – pupil ratio                1:24
       an under-construction district hospital at Margao.
                                                                                   Higher secondary level teacher –
      Goa College of Pharmacy, set up in 1842, is one of the oldest                                                                  1:19
                                                                                   pupil ratio
       institutes in India. It offers bachelor’s, master’s & diploma courses in
                                                                                   Vocational and professional                              1
       pharmacy. In 2015, the institute had 60 seats for bachelor's degree,                                                            30
                                                                                   institutes
       60 seats for diploma & 23 seats for master’s degree in various fields
                                                                                                                                            1
       of pharmacy.                                                                Teachers training institutes                         5
      As per state budget 2017-18, the Government of Goa has proposed             Universities & colleges for general                      1
                                                                                                                                       25
       to implement a new programme in the state for providing yoga                education
       training as well as value education to the students of 350 primary
                                                                                   Universities & colleges for                              1
       schools through Education Development Corporation of Goa.                                                                       27
                                                                                   professional education
                                                                                                                                            1
                                                                                   Industrial Training Institutes (ITIs)               14

 Source: Educational Statistics at a Glance 2015-16, Government of Goa, 12014-15

33      GOA                                                                                            For updated information, please visit www.ibef.org
SOCIAL INFRASTRUCTURE – HEALTH

      The state has better health ratios compared to the rest of the country.               Health infrastructure (as of June 2017)
       Annually, around 276 persons were served per hospital bed during
       2014-15.                                                                              Primary health centres                                           47
      Some of the renowned hospitals in the state include Apollo Victor                     Sub centers                                                     218
       Hospital in Margao, Manipal Hospital in Panaji & Vrundavan Shalby
       Hospital in Mapusa.                                                                   Community health centres                                         10
      As of October 2017, the number of primary health centres & sub
                                                                                             Active district hospitals                                         3
       centres in Goa were recorded to be 47 and 218, respectively.
      In Budget 2016-17, the state government has proposed to construct                     Active sub-district hospitals                                     2
       a new building of 44 bedded PHC Cansaulim & a new building of 12
       bedded PHC Prina during 2016-17. The projects are under                               Health indicators (September 2017)
       construction as per Budget 2017-18.
                                                                                                          1
      Further, the state government has also made a provision of US$ 2.43                   Birth rate                                                      12.9
       million for buildings, US$ 0.18 million for books & periodicals & US$                                  1
       0.70 million for various equipment for Goa Medical College.
                                                                                             Death rate                                                      6.7
                                                                                                                     2
      A provision of US$ 0.12 million has also been made for supplies and                   Infant mortality rate                                             8
       materials & US$ 3.10 million is allocated for the completion of the
       2nd phase of the building of Goa Dental College.
      In the Budget 2017-18 an amount of US$ 22.31 million has been set
       aside to set up a burns unit in Goa Medical College (GMC).
      Primary health centres will be upgraded with more beds & the New
       South Goa District hospital to be ready for public use in 2018.
      The state government announced ban on use of plastic bags
       effective from July 2017. Manufacturing, selling and carrying plastic
       bags would lead to imposition of a fine of up to US$ 74.37.
 Source: Goa Economy in Figures - 2015, Economic Survey of Goa, 2014-15 1Per thousand persons, 2Per thousand live births PHC# -Primary Health Centre, State Budget 2016-17

34      GOA                                                                                                       For updated information, please visit www.ibef.org
CULTURAL INFRASTRUCTURE

      There are several sports complexes in Panaji, Margao, Ponda & other cities. Football is the major sporting activity; cricket is also growing in
       popularity. The state is home to the Goa Football Association & many renowned clubs like Sporting Clube de Goa & the Vasco Sports Club.

      Goa has a number of churches, chapels & convents of unmatched architectural beauty; most of these were built during the Portuguese rule. Some
       of the famous churches include Church of St. Francis of Assisi, Basilica of Bom Jesus (mortal remains of St. Francis Xavier enshrined), Lady
       Rosary and St. Augustine.
      The 5th Youth Delphic Games 2016 was hosted in Goa from February 1-14, 2016. The game combined 6 art categories & over 70 sub-categories,
       with many artistic events and activities. The age limit for participating in these games was between 15 to 25 years.
      The key hotels in Goa include Leela Kempinski, at Cavelossim, Taj Fort Aguada at Bardez, Park Hyatt at Cansaulim & the Intercontinental at
       Canacona. The Panjim Inn, Cidade-de-Goa & Majorda Beach Resort are well-known hotels in Margao.
      Goa is popular for traditional forms of performance arts like Natak, Tiatr & Zagor as well as modern art forms like Goan trance.
      Directorate of Sports & Youth Affairs of Goa has launched the Vision 2020 programme in an effort to encourage sports & produce Olympic players
       from the state.
      Department of Art & Culture organizes ‘Lokotsav’, to promote handicrafts & folk forms. The 18th Lokotsav festival was organized in January 2016.
      Construction of Konkani Bhavan under Konkani Academy is proposed under state budget 2017-18.
      In December 2016, Goa hosted a new music festival “Wonderwall”, which was curated by the Indian DJ Nikhil Chinappa.
      At the Goa carnival, the Indian Navy float showcased the profile of naval branch of the Indian armed forces, which provides coastal security &
       carries out anti-piracy operations.
      Goan film industry announced plans to collaborate with Jharkhand for making films. Under the central government 'Ek Bharat Shreshtha Bharat’
       programme, the government of both the states organized a festival at ‘’Inox Courtyard’’ at Panaji on May 27 2017.

35      GOA                                                                                          For updated information, please visit www.ibef.org
INDUSTRIAL INFRASTRUCTURE

      Goa Industrial Development Corporation (Goa-IDC) is the nodal agency established for setting up of industrial estates & offering developed plots
       to industrial units in the state.

      Goa-IDC has established 20 industrial estates, spread across the state’s talukas & is currently working on the expansion of existing industrial
       estates as well as establishing new ones.

      7 ITIs (industrial training institutes) in the state of Goa are covered under the World Bank Assisted Vocational Training Improvement Project
       (VTIP) while 1 ITI in the state has been taken up by the central government for upgradation through public private partnership.

     Industry clusters                    Industries

     Verna                                Rubber, plastics, petroleum products, pharmaceuticals, electronics and telecommunication equipment.

     Bicholim                             Engineering, oil products, plastics, leather, textiles, food processing, soaps and agro products.

     Kundaim                              Rubber, plastics, petroleum products, pharmaceuticals, steel fabrications and aluminum furniture.

     Margao                               Printing, plastics, herbal hair oils, cosmetics, ice blocks, engineering items and industrial diamond tools.

     Mormugao                             Shipbuilding and repair.

                                          Metal works, engineering, cold storage, food processing, electronic products, paper products, chemicals, paints
     Corlim
                                          and varnishes.

     Vasco                                Shipbuilding and repair.

 Source: Goa Industrial Development Corporation

36      GOA                                                                                                For updated information, please visit www.ibef.org
SMART CITY & AMRUT

      Panaji city is one of the 13 shortlisted cities in Fast Track Mode of City Challenge under Smart Cities Mission of the Ministry of Urban
       Development, Government of India. Through participation in this challenge, Panaji aims to fast track the achievement of a world- class city while
       retaining its heritage and cultural values. In order to convert Goa into a smart state, the CCP (Corporation of the City of Panaji) has set forth sub
       goals to create an enabling environment to preserve local heritage and to promote cultural tourism, to increase engagement of citizens to improve
       quality of life, to transform the city into a biodiverse and a sustainable city, to redesign Panaji as an inclusive ecomobile city and to enhance
       resource efficiency to attain a landfill- free city.

      The winning area based strategies proposed by Panaji include Retrofitting of Open Spaces Management, of Lake, River Precinct and sea shore
       protection, of Heritage areas, of Flood Management and unique projects such as building incubation centers and GIS based property and land
       management system.

      As per the Smart City Proposal, the list of projects in Panaji include:

        •   Area Based Development: Service improvement for urban poor in Mala Fontainhas area, Integrated Urban Water Management, Church
            Square Revitalization, Provision of basic services in entire area (2 sq km), etc

        •   Smart Transportation and Eco Mobility: Digital Enabled System for Public Bike Share System, Air Quality monitoring stations, Smart Parking,
            Smart Component for buses (GPS, automated fare collection etc.), etc

        •   Smart Environmental Services: Trolley Bins with RFID tags, Biometric Attendance in 12 Zonal Offices, CCTV Surveillance of black spots, etc

      Under AMRUT (Atal Mission for Rejuvenation & Urban Transformation) scheme by the Government of India, the city of Panaji has been selected
       from the state of Goa. The main aim of the scheme is to promote use of public & non-motorised transport, & provide each household with tap
       connections as well as enhance & develop greenery across these local bodies during 2015-16 to 2019-20.

 Source: Census Organization of India, Smart Cities Mission, Corporation of the City of Panaji, AMRUT

37      GOA                                                                                             For updated information, please visit www.ibef.org
KEY INDUSTRIES … (1/2)

      Apart from having an established iron ore mining industry, Goa has emerged as a manufacturing base for several leading companies in areas
       such as fertilisers, tyres & tubes, cement, electrical machinery, fish-net making machines, automatic washing machines, printed circuit boards,
       pharmaceuticals & pharmaceutical machinery.

      Mining (iron ore and manganese), pharmaceuticals, iron & steel industries are located in North Goa, while mining & shipbuilding industries are
       present in South Goa.

      Tourism is the largest segment in the services sector; the Goa Tourism Development Corporation (GTDC) is responsible for promoting tourism in
       the state.

      The state is in the process of developing the logistics sector in Goa by forming a special logistics group and constructing several bridges to
       address the existing deficiencies with regard to logistics and warehousing.

      As per the state budget 2016-17, the state government proposed to take up the establishment work of a state-of-the-art festival venue as well as
       an IFFI Secretariat in the state on PPP basis. For the same purpose, an allocation of US$ 152.8 thousand has been made by Government of Goa.
       A dedicated task force is being set up to implement the project on fast track basis, as per Budget 2017-18.

     Key industries In Goa                                                    Biotechnology
      Tourism                                                                Mining
      Food processing                                                        Pharmaceuticals
      IT/ITeS                                                                Fishing

 Source: Economic Survey of Goa, 2014-15, State Budget 2016-17

38      GOA                                                                                        For updated information, please visit www.ibef.org
KEY INDUSTRIES – MAJOR CLUSTERS … (2/2)

                                                  The cluster is run by the Goa Pharmaceutical Manufacturers’ Association (GPMA) and accounts for around
                                                   12% of the country’s medicine production.

                                                  Principal products manufactured are tablets, capsules, ointments, liquid orals & injectibles.
     Pharmaceutical cluster
                                                  The cluster has an annual growth rate of 18-20%; and, currently, 40 units are functioning under the cluster.

                                                  Export of pharmaceutical products from Goa has increased from 2,157 metric tonnes in 2012-13 to 5,076
                                                   metric tonnes in 2015-16.

                                                  The cluster is run by Goa Cashew Entrepreneurs’ Welfare Society with 300 functional units.

                                                  Cashew karnel is the major product manufactured.
     Cashew cluster
                                                  Fixed investment of US$ 5.2 million has been made.

                                                  Export of cashew karnels has increased from 532 metric tonnes in 2012-13 to 775 metric tonnes in 2015-16.

 Source: Ministry of MSME, Government of India, Brief industrial profile of South Goa district

39     GOA                                                                                                   For updated information, please visit www.ibef.org
KEY INDUSTRIES – IT/ITeS … (1/2)

      Despite being a small state and a late starter in the IT industry, Goa is ideally placed to
                                                                                                     Some of the key players
       capitalise on the opportunities available in the sector.
                                                                                                      Smartlink Network Systems Ltd
      Goa is one of the most literate states in India, with a literacy rate of over 88.7%; most
       Goans are conversant with the English language, which is the lingua franca for the IT          Zenith Computer Pvt Ltd
       industry.
                                                                                                      PCS Technology Ltd
      As per state budget 2016-17, Government of India granted the approval to the state
                                                                                                      Crompton Greaves
       government for constructing the Electronics Manufacturing Cluster in Tuem by
       providing a central assistance of US$ 7.63 million to the state government. The project
       is under progress and being developed by Info Tech Corporation of Goa Ltd.                    Rajiv Gandhi IT habitat, Dona-Paula
      The state government is also planning to develop an electropreneur park in the Goa             Situated seven kilometres away from the state
       College of Engineering in association with India’s Software Technology Parks and
                                                                                                       capital of Panaji.
       contribution of local ESDM industry, as per the budget 2016-17.
                                                                                                      Developed on an area of around 95 acres with
      The state is close to several business centres, such as Mumbai, Pune and Bangalore,
                                                                                                       the aim to attract IT/ITeS/BPO/KPO industries.
       of the country that provide growth opportunities. Goa University offers a postgraduate
       course in computer sciences, and there are over 250 other institutes imparting IT              IT habitat is expected to attract investments to
       training and education.                                                                         the tune of US$ 147–184 million.

      Under the Budget 2017-18, work for setting up a new IT park in Chimbel is targeted for         Government aims to create employment for
       completion on priority and the development of electronic city at Tuem has been                  10,000–12,000 persons through this park.
       approved.

      In April 2017, the state government announced an IT fund worth US$ 25.13 million, out
       of which US$ 2.23 million is to be used for boosting the startup sector in the state. The
       government has also proposed a startup promotion board, and US$ 74,371.56 to
       encourage incubation centres across the state.

 Source: The Directorate of Industries, Trade and Commerce, Government of Goa

40      GOA                                                                                          For updated information, please visit www.ibef.org
KEY INDUSTRIES – IT/ITeS … (2/2)

                            Formerly D-Link (India) Private Limited, Smartlink Network Systems Ltd is one of India’s leading networking
                             companies, offering an integrated value proposition that includes design and development, manufacturing, sales &
                             marketing and service & support. It was established in 1993.

                            The company has certified state-of-the-art manufacturing plants as well as a software and Research &
                             Development (R&D) centre at Verna, Goa. The company earned Rs 4.39 crore (US$ 0.68 million) in revenue
     Smartlink Network       during the first third of 2017-18. It has 17 offices in the country.
       Systems Ltd

                            Established in 1980, the company is one of the largest personal computer companies in India. It employs around
                             800 professionals and has 15 branches across the country, with a 60,000 sq ft of production facility in Sancoale
                             Industrial Estate, Zuari Nagar.

                            In 2015-16, the company earned US$ 0.27 million in revenue.
     Zenith Computer Pvt
             Ltd

                            PCS is an Indian technology company headquartered in Mumbai. The company focuses on facilities management
                             services, software services as well as computer hardware. The company’s total income reached Rs 3.04 crore
                             (US$ 0.47) million in the third quarter of 2017-18.

                               PCS has a manufacturing facility in Goa, where it produces desktop computers, notebook computers and
                               servers. It has a production capacity of 7,000 to 8,000 desktop computers per month.
     PCS Technology Ltd

41    GOA                                                                                  For updated information, please visit www.ibef.org
KEY INDUSTRIES – MINING

      The mining belt of Goa covers an area of approximately 700 sq km &   Goa mineral reserves
       is mostly concentrated in the 4 talukas of Bicholim, Salcete,
       Sanguem & Quepem.                                                    Mineral                                  Reserves (In ‘000 tonnes)

      The iron ore in Goa is export oriented with average annual export    Iron ore-hematite                                 6,42,113
       from Goa at around 30 million tonnes.

      Most mines in Goa are of open-cast type, which necessitates the      Iron ore-magnetite                                2,15,557
       removal of over burden overlying the iron ore formations. During
       2015-16, the state government created a separate District Mineral    Manganese                                          23,271
       Foundation under the MMDR Act, 1957, as per which the state’s
                                                                            Bauxite                                            53,072
       mining firms need to deposit an additional amount of 30% of the
       royalty paid to this fund.
                                                                            Quartz/silica sand                                 20,004
      Under state budget 2017-18, US$ 8.6 million has been allocated to
       the mining sector.
                                                                            Goa bauxite exports (tonnes)

                                                                                 2013-14                   2014-15                2015-16
     Some of the key players
                                                                                 153,400                   267,220                209,745
      Sesa Goa

      The Dempo Group

      V.M. Salgaocar and Company Ltd

      V.S. Chowgule and Company Ltd

  Source: As per latest available data
 Source: Ministry of Mines, Government of India

42      GOA                                                                                     For updated information, please visit www.ibef.org
KEY INDUSTRIES – IT/ITeS … (2/2)

                               Vedanta Limited, formerly known as Sesa Sterlite, is a well-known mining company in India. It is the flagship company of the
                                Vedanta Group and is India's largest iron ore exporter in the private sector. The Sesa Group of companies have been involved in iron
                                ore mining for over five decades. Over the last two decades, the company has diversified into manufacturing of pig iron and
                                metallurgical coke. As of March 2013, Sesa Goa has the rights to exploration & production of an estimated 433 million tonnes of iron
                                ore. In 2012-13 and 2013-14, the company produced 3.7 million tonnes and 1.5 million tonnes of iron ore, respectively. Apart from
                                Goa, it has mining operations in Karnataka. The company reported revenues of Rs 12,888 crore (US$ 1.99 billion) during the third
       Vedanta Limited
                                quarter of 2017-18.

                               The Dempo Group is one of the state’s leading mining and export companies. It has two subsidiaries for the mining business,
                                i.e., Dempo Mining Corporation Private Limited and V S Dempo Corporation Private Limited. The company’s key products are
                                iron ore fines, calibrated iron ore lumps and low-phosphate magnetite concentrates. Dempo has 19 mining leases in Goa,
                                which are spread across 1,800 hectares.
      The Dempo Group

                               The company was founded in 1952 as a mining and export company. It is one of the leading suppliers of processed iron ore to
                                large steel makers such as POSCO and Nippon Steel Corporation (NSC). The company has its corporate office at Vasco-de-
                                Gama and mining facilities in four different locations in Goa. It has diversified into the hospitality, shipping, real estate and
                                education sectors. Over 10 million tonnes of material is handled at the mines every year during iron ore extraction.
     V.M. Salgaocar & Bro
            Pvt Ltd

                               Chowgule Mining Division is a part of the Chowgule Group. The company has mines and three beneficiation plants in Goa (at
                                Pale, Tudou and Costi). Chowgule’s run-of-mine ore production exceeds five million tonnes per annum, and its beneficiation
                                plants produce over 3.5 million tonnes of iron ore and pellets every year.
      V.S. Chowgule and
         Company Ltd

43    GOA                                                                                              For updated information, please visit www.ibef.org
You can also read