GUJARAT - RUDABAI STEPWELL IN ADALAJ, GUJARAT

Page created by Miguel Cooper
 
CONTINUE READING
GUJARAT - RUDABAI STEPWELL IN ADALAJ, GUJARAT
RUDABAI STEPWELL IN ADALAJ, GUJARAT

 GUJARAT
 THE GROWTH ENGINE OF INDIA

For updated information, please visit www.ibef.org                           January 2019
GUJARAT - RUDABAI STEPWELL IN ADALAJ, GUJARAT
Table of Content

  Executive Summary .………………………..3

  Introduction ……..……………………………4

  Economic Snapshot ……………….….…….9

  Physical Infrastructure ………..……………15

  Social Infrastructure …..……………………28

  Industrial Infrastructure ……..……………...31

  Key Sectors ………….………………..….....35

  Key Procedures & Policies………………….50

  Annexure.………….……………………........66
GUJARAT - RUDABAI STEPWELL IN ADALAJ, GUJARAT
EXECUTIVE SUMMARY

                                                  According to the DIPP, FDI inflows in the state of Gujarat totalled US$ 19.16 billion during April 2000 – June
      Preferred Investment
                                                   2018. During the same period, Gujarat accounted for about 5 per cent share in the overall FDI inflows in
      Destination                                  India.

                                                  During 2017-18, the state produced 4,592 million tonne of petroleum (crude) and Natural Gas (Utilised) was
      Petro Capital of India                       1,557 million cubic metres. Total consumption of petroleum products was 19.14 million MT during 2017-
                                                   2018P.

                                                  Gujarat’s dairy sector consists of 17 district milk producers’ unions with around 14,598 milk co-operative
      Highest Share in India’s
                                                   societies. The state’s milk production which stood at 13.57 million tonnes during 2017-18, was the third
      Total Dairy Output                           largest state in India with 7.69 per cent of India’s share.

                                                  The state attracted investment commitments worth US$ 1,407 million under Gujarat's textile policy 2012, for
      Strong Textile Base                          varied units such as processing, spinning, weaving, made-ups, technical textiles etc. The Gujarat Garment &
                                                   Apparel policy was announced in October 2017 with the aim of creating 100,000 jobs in the state.

    Note: As per latest data available., MT- Metric Tonnes, P - Provisional
    Source: Gujarat Economic Review, 2017-18, Department of Industrial Policy & Promotion, April 2000 to March 2016, Ministry of Textiles, Industrial Extension Bureau
    Ministry of Petroleum & Natural Gas

3         Gujarat                                                                                                         For updated information, please visit www.ibef.org
GUJARAT - RUDABAI STEPWELL IN ADALAJ, GUJARAT
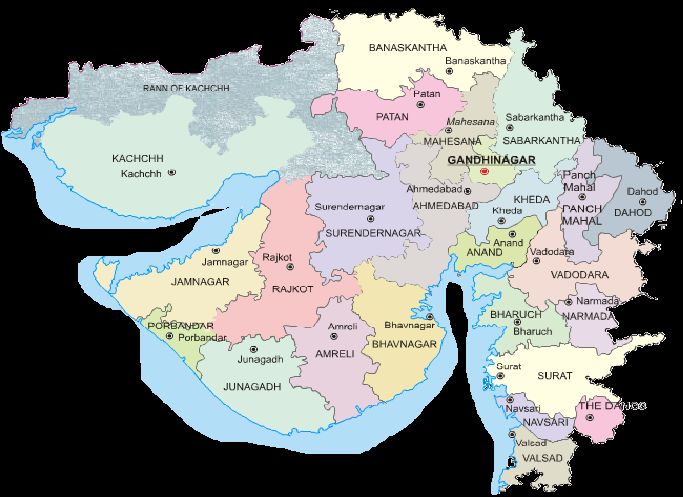
Gujarat

INTRODUCTION
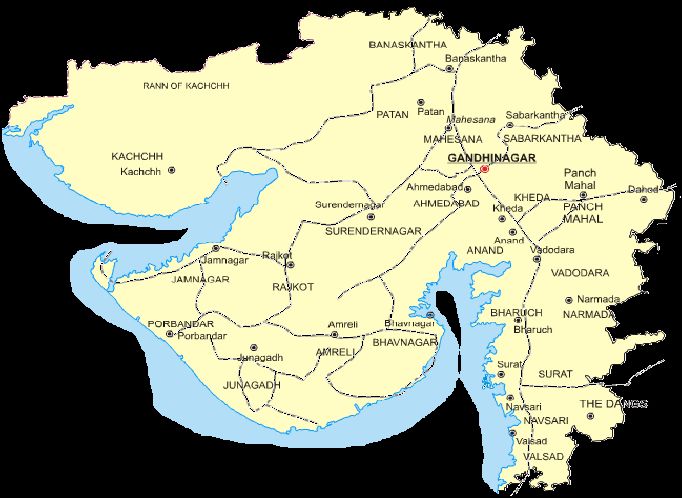
GUJARAT - RUDABAI STEPWELL IN ADALAJ, GUJARAT
GUJARAT FACT FILE

                                                                                   There are seven agro-climatic zones in the state that support
                                                                                     cultivation of a wide range of crops.

                                                                                   The most commonly spoken language of the state is Gujarati. Hindi
                                                                                     and English are the other Indian languages used.

                                                                                  Parameters                                              Gujarat

                                                                                  Capital                                               Gandhinagar

                                                                                  Geographical area (sq km)                               196,063

                                                                                  Administrative districts (No)                             26
                                                          Source: Maps of India
                                                                                  Population density (persons per sq km)                    308

                                                                                  Total population (million)                               60.4
     Gujarat is located on the western coast of India and has the longest
     coastline of 1,600 km in the country. The state shares its borders with      Male population (million)                                31.5

     Rajasthan, Madhya Pradesh, Maharashtra and the Union Territories of          Female population (million)                              28.9
     Daman & Diu and Dadra & Nagar Haveli. The Arabian Sea borders the
                                                                                  Sex ratio (females per 1,000 males)                       919
     state both to the west and the south-west.
                                                                                  Literacy rate (%)                                        79.31
     Gandhinagar, Ahmedabad, Vadodara, Surat, Rajkot, Bhav-nagar and
     Jamnagar are some of the key cities of the state.

    Source: Gujarat Socio Economic Review

5        Gujarat                                                                                      For updated information, please visit www.ibef.org
GUJARAT - RUDABAI STEPWELL IN ADALAJ, GUJARAT
ADVANTAGE GUJARAT

                       High economic growth and industrial                                            Policy incentives
                                 development                                         The state government has framed policies in almost all
                  Average annual Gross State Domestic Product (GSDP)                 key sectors such as industry, power, ports, roads,
                   growth rate from 2011-12 to 2016-17 was about 13.55                agriculture & minerals.
                   per cent.                                                         The Gujarat Garment & Apparel policy was announced
                  Gujarat has achieved the distinction of being one of the           in October 2017 with the aim of creating 100,000 jobs
                   most industrially developed states. Accounting for 5 per           in the state.
                   cent of the total Indian population, Gujarat contributes          Gujarat, with highest installed solar capacity, plans to
                   about a quarter to India’s goods exports.                          announce new net metering policy providing financial
                                                                                      support to solar power generating households.

                                                                           Advantage
                                                                            Gujarat
                                    Rich labour pool                                             Facilitating infrastructure
                  Gujarat has a good educational infrastructure with                Gujarat has successfully developed world class
                   premier institutes in management, fashion, design,                 infrastructure.
                   infrastructure planning & pharmaceuticals.                        There are 42 ports, 18 domestic airports & 1
                  There are industrial training institutes in each district to       international airport. The state also has an extensive
                   train manpower for the shop floor level. The state                 road & rail network. A 2,200 km gas grid supplies gas
                   government has undertaken many initiatives to                      to the industrial areas.
                   encourage innovation in the education sector.

6   Gujarat                                                                                             For updated information, please visit www.ibef.org
GUJARAT VISION 2020

                                                                                                   Make Gujarat a globally recognised
                                                 Encourage solar and wind energy generation.       knowledge society.

                                                 Encourage power generation and become a          Develop two knowledge corridors enabling
                                                  trading hub for the West.                         functioning of institutions in sectors like
                                                                                                    retail, aviation and centres of excellence.
                                                 Enhance gas supplies through E&P.

              Attract investments in SIRs, industrial                                                Education/                          Real GSDP to grow three times by 2020.
               areas, SEZ infrastructure.
                                                                                                  Skill Development                       Per capita income to be around US$
                                                                            Energy & Power
              Develop PCPIR to attract investments                                                                                        12,615 (in PPP terms) by the year 2020.
               in the petroleum products and
               chemicals sectors.                                Investment                                        GSDP/Per
                                                                  Promotion                                       Capita Income
                                                                                       Vision 2020
                                                                   Tourism                                        Industry
           Make Gujarat a global tourist destination.                                                                                       Develop world class and globally
                                                                                                                                              competitive industrial infrastructure.
           Setting up a tourism development fund,
                                                                             Healthcare/              Transport
            which would provide incentives to tourism                                                                                        Invest in ports and infrastructure to boost
            projects.
                                                                           Social Amenities
                                                                                                                                              imports and exports.

                                                   Improve quality of life of people by
                                                                                                    Develop high speed integrated transport
                                                    developing clean, green and safe cities.
                                                                                                     network meeting global standards.
                                                   Create good healthcare infrastructure to be
                                                                                                    Bullet train and Metro Rail Transport Project
                                                    at par with upper middle income countries.
                                                                                                     to reduce travel time.

    Source: Blueprint for Infrastructure in Gujarat (BIG 2020) PCPIR: Petroleum, Chemical and Petrochemical Investment Region

7         Gujarat                                                                                                          For updated information, please visit www.ibef.org
GUJARAT IN FIGURES

    Gujarat’s Contribution to Indian Economy (2016-17)                                          Physical Infrastructure in Gujarat

    Parameter                                     Gujarat                  India                Parameter                                  Gujarat                     India
    GSDP as a percentage of all                                                                 Installed power capacity
                                                    7.59                   100.0
    states’ GSDP                                                                                (MW) (as of December                      31,381.85                 349,288.22
                                                                                                2018)*
    GSDP growth rate (%)                           12.97                   10.80
                                                                                                Wireless subscribers (No)
    Per capita GSDP (US$)                          2,654                  17,503                                                         70,372,673               1,171,755,011
                                                                                                (as of November 2018)
                                                                                                Internet subscribers (Mn)
    Social Indicators                                                                                                                       35.91                     560.01
                                                                                                (as of September 2018)
    Parameter                                     Gujarat                  India                National highway length
                                                                                                                                            5,456                     122,432
                                                                                                (km)
    Literacy rate (%)                               79.31                  74.04
                                                                                                Major and minor ports
    Birth rate (per 1,000                                                                                                                    1+41                     13+187
                                                    20.1                    20.4                (No)
    population)
                                                                                                Airports (No)                                 11                        129
    Industrial Infrastructure                                                                   Investments (as of June 2018)

     Parameter                                    Gujarat                  India                Parameter                                     Gujarat                  India
     Operational PPP projects (No)                                                              Cumulative FDI equity inflows
                                                     136                   1,733                                                                19.16                  389.60
     (as of January 2019)                                                                       since April 2000 (US$ billion)
     Notified SEZs (No) (as of
                                                      24                    355
     January 2019)

    Note: GSDP, per capita GSDP figures are taken at current prices, Exchange Rate used is average of 2016-17, i.e. USD = INR 67.09, PPP: Public-Private Partnership, SEZ: Special
    Economic Zone, SRS: Sample Registration System, * For the year 2018-19

8       Gujarat                                                                                                        For updated information, please visit www.ibef.org
Gujarat

ECONOMIC SNAPSHOT
ECONOMIC SNAPSHOT – GSDP

                 Visakhapatnam
                          GSDP port
                               at current
                                    traffic prices
                                            (million tonnes)                                                         Visakhapatnam
                                                                                                                                 Perport
                                                                                                                                     capita
                                                                                                                                         traffic
                                                                                                                                            GSDP (million tonnes)

                                                                                                             3,000                                                                                               2,00,000
        200.00                                   CAGR (In Rs) 13.55%                               14                                                  CAGR (In Rs) 11.99%
                                                                                                                                                                                                                 1,80,000
        180.00
                                                                                                             2,500

                                                                                                                                                                                                      1,78,043
                                                                                                                                                                                                         2,654
                                                                                                   12                                                                                                            1,60,000

                                                                                         173.24
        160.00

                                                                                                                                                                                              2,439
                                                                                                                                                                                           1,59,689
                                                                                         11.62

                                                                                                                                                                                   2,379
                                                                                                                                                                                                                 1,40,000

                                                                                157.20
                                                                                                   10

                                                                                                                                                                             1,45,484
        140.00                                                                                               2,000

                                                                    150.74

                                                                                                                                                     2,156

                                                                                                                                                                   2,135
                                                                                                                        2,108
                                                                               10.29
                                                                                                                                                                                                                 1,20,000

                                                                                                                                                             1,29,158
                                                        133.49
                                         133.06

                                                                   9.22
        120.00
                     128.38

                                                                                                   8

                                                                                                                                             1,17,398
                                                                                                             1,500                                                                                               1,00,000
                                                       8.08

        100.00

                                                                                                                                  1,01,075
                                      7.24

                                                                                                   6                                                                                                             80,000
         80.00
                               6.16

                                                                                                             1,000
                                                                                                                                                                                                                 60,000
         60.00                                                                                     4
                                                                                                                                                                                                                 40,000
         40.00                                                                                                500
                                                                                                   2                                                                                                             20,000
         20.00
                                                                                                                0                                                                                                0
          0.00                                                                                     0

                                                                                                                        2011-12

                                                                                                                                             2012-13

                                                                                                                                                             2013-14

                                                                                                                                                                             2014-15

                                                                                                                                                                                           2015-16

                                                                                                                                                                                                      2016-17
                                                                                         2016-17
                     2011-12

                                      2012-13

                                                       2013-14

                                                                   2014-15

                                                                               2015-16

                                                                                                                                                                       US$       Rs
                                                US$ billion      Rs trillion

      At current prices, Gujarat’s GSDP* was about Rs 11.62 trillion (US$                               The state’s per capita GSDP^ stood at Rs 178,043 (US$ 2,654)
       173.24 billion) during 2016-17.                                                                    during 2016-17 in comparison with Rs 101,075 (US$ 2,108) during
                                                                                                          2011-12.
      The state’s GSDP grew at a CAGR of 13.55 per cent, during 2011-
       12 to 2016-17.                                                                                    Gujarat’s per capita GSDP increased at a CAGR of 11.99 per cent
                                                                                                          between 2011-12 and 2016-17.
 Note: Exchange rates used are averages of each year, provided on Page 66, data is expected to be updated by March 2019 from Ministry of Statistics and Programme Implementation
 (MOSPI) statistics
 Source: Directorate of Economics and Statistics Gujarat, Government of Gujarat, Government of Gujarat per Capita GSDP^ - calculated using GSDP million US$ /Population in million

10      Gujarat                                                                                                                       For updated information, please visit www.ibef.org
ECONOMIC SNAPSHOT – NSDP

                 Visakhapatnam
                          NSDP port
                               at current
                                    traffic prices
                                            (million tonnes)                                                                 Visakhapatnam
                                                                                                                                         Perport
                                                                                                                                             capita
                                                                                                                                                 traffic
                                                                                                                                                     NSDP(million tonnes)

        160.00                                         CAGR (In Rs) 13.83%                                   12      2,500                                                                                                              1,80,000
                                                                                                                                                                          CAGR (In Rs) 12.34%

                                                                                                    151.76
                                                                                                                                                                                                                                        1,60,000

                                                                                                                                                                                                                                2,333
        140.00
                                                                                                             10

                                                                                                                                                                                                                          1,56,527
                                                                                                                     2,000

                                                                                        136.57

                                                                                                                                                                                                                  2,127
                                                                                                 10.18
                                                                                                                                                                                                                                        1,40,000

                                                                                                                                                                                                    2,077
                                                                             131.60
        120.00

                                                                                                                                                                                                            1,39,254
                                                                                                                                                     1,888

                                                                                                                                                                                   1,870
                                                                                      8.94
                                                              116.93

                                                                                                                               1,824
                                      116.54

                                                                                                             8                                                                                                                          1,20,000

                                                                                                                                                                                            1,27,017
                     111.12

        100.00

                                                                         8.05
                                                                                                                     1,500

                                                                                                                                                                            1,13,139
                                                                                                                                                                                                                                        1,00,000
                                                           7.07

                                                                                                                                                               1,02,826
         80.00                                                                                               6
                                                6.35

                                                                                                                                                                                                                                        80,000

                                                                                                                                         87,481
                                                                                                                     1,000
                               5.33

         60.00
                                                                                                             4                                                                                                                          60,000
         40.00
                                                                                                                       500                                                                                                              40,000
                                                                                                             2
         20.00                                                                                                                                                                                                                          20,000

          0.00                                                                                               0           0                                                                                                              0
                     2011-12

                                      2012-13

                                                           2013-14

                                                                         2014-15

                                                                                      2015-16

                                                                                                 2016-17

                                                                                                                               2011-12

                                                                                                                                                     2012-13

                                                                                                                                                                            2013-14

                                                                                                                                                                                            2014-15

                                                                                                                                                                                                            2015-16

                                                                                                                                                                                                                          2016-17
                                                US$ billion            Rs trillion                                                                                                    US$       Rs

      Gujarat’s NSDP was about Rs 10.18 trillion (US$ 151.76 billion)                                             Gujarat’s per capita NSDP& was Rs 156,527 (US$ 2,333) during
       during 2016-17.                                                                                              2016-17 in comparison with Rs 87,481 (US$ 1,824) during 2011-12.
      The state’s NSDP expanded at a CAGR of 13.83 per cent from                                                  The state’s per capita NSDP increased at a CAGR of 12.34 per cent
       2011-12 to 2016-17.                                                                                          between 2011-12 and 2016-17.

 Note: Exchange rates used are averages of each year, provided on Page 66, , data is expected to be updated by March 2019 from Ministry of Statistics and Programme Implementation
 (MOSPI) statistics
 Source: Directorate of Economics and Statistics Gujarat, Government of Gujarat, Government of Gujarat per Capita NSDP& -calculated using NSDP million US$/Population in million

11      Gujarat                                                                                                                                   For updated information, please visit www.ibef.org
ECONOMIC SNAPSHOT – PERCENTAGE
                   DISTRIBUTION OF GSDP

      During 2016-17, the tertiary sector contributed 35.49 per cent to the                                Visakhapatnam
                                                                                                                 Percentageport
                                                                                                                            distribution
                                                                                                                                traffic (million
                                                                                                                                          of GSDPtonnes)
        state’s GSDP (at current prices), followed by shares of secondary
        (44.08 per cent) and primary (20.43 per cent) sectors.                                     100%
                                                                                                                        36.71%            CAGR             35.49%
                                                                                                    90%
      The primary sector increase at a CAGR of 10.90 per cent between
        2011-12 and 2016-17.                                                                        80%                                   12.60%

                                                                                                    70%
      At a CAGR of 15.32 per cent, the secondary sector has been the
        fastest growing sector, during 2011-12 and 2016-17. Growth in the                           60%                 40.48%                             44.08%

        sector was driven by expansion of manufacturing, construction and                           50%                                   15.32%
        electricity, and gas & water supply industries.
                                                                                                    40%

      The tertiary sector increased at a CAGR of 12.60 per cent between                            30%
        2011-12 and 2016-17. Growth was driven by trade, hotels, real
                                                                                                    20%                 22.81%
        estate, finance, insurance, transport, communications and other                                                                   10.90%           20.43%
        services sectors.                                                                           10%

                                                                                                     0%
                                                                                                                        2011-12                            2016-17

                                                                                                                         Primary      Secondary       Tertiary

 Note: Exchange rates used are averages of each year, provided on Page 66, , data is expected to be updated by March 2019 from Ministry of Statistics and Programme Implementation
 (MOSPI) statistics
 Source: Directorate of Economics and Statistics, Government of Gujarat

12      Gujarat                                                                                                      For updated information, please visit www.ibef.org
ECONOMIC SNAPSHOT – FDI INFLOWS &
                   INVESTMENTS

      According to the DIPP, FDI inflows to Gujarat totalled US$ 19.16                   Visakhapatnam
                                                                                                FDI Inflows
                                                                                                          port
                                                                                                            chart
                                                                                                               traffic
                                                                                                                  (US$ (million
                                                                                                                         million)
                                                                                                                                tonnes)
       billion from April 2000 to June 2018.
                                                                              25,000
      The Vibrant Saurashtra Expo and Summit, was held in Rajkot in                                                                                               413
                                                                              20,000                                                                       2,091
       January 2016. MoUs worth US$ 341.88 million were realised for the

                                                                                                                                                                           19,155
                                                                                                                                                   3,367
       development of various sectors of the state during the event. The      15,000                                                       2,244
       2018 edition of the expo will be held in April 2018.                                                                       1,531
                                                                              10,000                                      860
                                                                                         7,156 1,001           493
      Domestic companies which have disclosed their investment
                                                                                5,000
       commitments include Reliance Industries, Suzlon, Aditya Birla
       Group, and Videocon. Foreign companies who have committed                   0

                                                                                          FY00-FY11

                                                                                                                                                                   FY19*
                                                                                                      FY12

                                                                                                                   FY13

                                                                                                                           FY14

                                                                                                                                    FY15

                                                                                                                                            FY16

                                                                                                                                                    FY17

                                                                                                                                                            FY18

                                                                                                                                                                           FY01-FY19*
       investments include Rio Tinto, Suzuki and CLP Holdings.

      The lifting of suspension from 3 industrial clusters — Vapi, Vatva,
       and Ankleshwar including Panoli is expected to boost employment,
       investment and growth opportunities in the respective industrial      Investment intentions in terms of IEMs filed, LOIs / DILs issued
       areas.
                                                                                 Year                 Number                 Proposed Investments (US$ billion)

      Up to November 2018, 406 investment intentions worth Rs 65,710            2016                        412                                    8.37
       crore (US$ 9.11 billion) were filed in Gujarat.
                                                                                 2017                        428                                   12.27

                                                                                 2018^                       406                                    9.11
 Note: * - up to June 2018, ^Up to November 2018
 Source: Department of Industrial Policy & Promotion, News Articles.

13      Gujarat                                                                                        For updated information, please visit www.ibef.org
ECONOMIC SNAPSHOT – EXPORTS

                             Export Trend (US$ million)                                   Composition of Major Item Exported (2018-19*)

        80,000

        70,000

                                                               66,818                                                                39.19%
        60,000
                    61,238
                                                                         56,016
        50,000                                   54,214                                             60.87%
                                  49,820
        40,000

                                                                                                                                             6.91%
        30,000

                                                                                                                                     3.92%
                                                                                                                             3.41%
                                                                                                                    2.55%
                                                                                                                    2.43%
        20,000

        10,000                                                                        Petroleum Product                     Organic Chemicals
                                                                                      Drug Formulations                     Gold and Other Precious Metals
             0                                                                        Plastic Raw Materials                 Products of Iron and Steel
                   2014-15        2015-16       2016-17        2017-18   2018-19*     Others

      Total exports from the state stood at US$ 66,818 million during 2017-18 and US$ 56,016 million in April-September 2018.

      Major items exported from Gujarat are Petroleum Product and Organic Chemicals etc.

      During 2018-19*, total exports of Petroleum Product from Gujarat stood at US$ 21,953.99 million which was 39.19 per cent of the total exports.

 Note: * as of April - September 2018
 Source: Directorate General of Commercial Intelligence and Statistics

14      Gujarat                                                                                     For updated information, please visit www.ibef.org
Gujarat

PHYSICAL
INFRASTRUCTURE
PHYSICAL INFRASTRUCTURE – ROADS…(1/2)

       National highways length in Gujarat is 5,456 km (as of February
          2018).

       The Government of Gujarat, through GIDB, has prepared a vision
          document – Blueprint for Infrastructure in Gujarat (BIG) - 2020.
          Under this document, the state has identified a series of projects and
                                                                                                                                                  National Highways
          investments required across the road sector to be implemented on
                                                                                                                                                  State Highways
          priority basis for Gujarat’s inclusive growth.
                                                                                                                                                   Railways
       Along with road infrastructure, the Government of Gujarat is focusing
          on the growth of transportation sector in the state. The Gujarat State
          Road Transport Corporation delivers transportation facility to about
          24 lakh people every day.                                                           Type of road                              Road length (km) as of 2016-17
                                                                                                                    1
                                                                                              National highways                                      5,456
       As of January 2018, 3,387 habitations were eligible under Pradhan
                                                                                              State highways                                         17,201
          Mantri Gram Sadak Yojana (PMGSY), out of which 3,052 were
          cleared and further 3,040 habitations were connected.                               Major district roads                                   20,641

                                                                                              Other district roads                                   10,493

                                                                                              Village roads                                          21,119

     Note: 1up to February 2018
     Source: Gujarat State Road Development Corporation , Road & Building Department, Government of Gujarat, NHAI

16        Gujarat                                                                                                       For updated information, please visit www.ibef.org
PHYSICAL INFRASTRUCTURE – ROADS…(2/2)

      As per of state budget 2018-19, government has allotted US$ 221                          Fund Allocation and Expenditure
       million for the development road transport.
                                                                                                                  CRF (US$ million)                    EI & ISC (US$ million)
                                                                                                                                            1
      Under the plan and non-plan head for Ports and Transport                                                 Accrual           Release             Accrual      Expenditure
       Department, the state government has allocated US$ 198 million
                                                                                                2014-15           25.18             17.13               NA            2.35
       during 2017-18.

                                                                                                2015-16           27.04              9.47               NA            0.95
      In March 2017, the Prime Minister announced investment of US$1.78
       billion for upgrading 8 state highways to national highways in order to                  2016-17           69.06             20.49              0.31           0.31
       boost the infrastructure development in the state.
                                                                                                2017-18           64.06             11.57              1.40           1.35

      In August 2017, Government of India signed a loan agreement worth                       Road work completion under PMGSY
       US$ 329 million for the Gujarat Rural Roads Project. The projects will
       be implemented to improve rural road connectivity and accessibility                      Year                                            Road works (No)
       in 1,060 villages in the state.
                                                                                                2014-15                                                  600

      Funds accrued under Central Road Fund (CRF) for Gujarat reached                          2015-16                                                  377
       Rs 412.84 crore (US$ 64.06 million) in 2017-18.                                          2016-17                                                   31

                                                                                                2017-18                                                   44

                                                                                                2018-19**                                                 5

 Note: 1Release may be more that Accrual of current year due release of unspent balance of previous years, NA – Data not available., ** - June 2018
 Source: State Budget 2016-17

17      Gujarat                                                                                                         For updated information, please visit www.ibef.org
PHYSICAL INFRASTRUCTURE – RAILWAYS

      Gujarat had total length of railway line are 5,258.49 route kms which
        consists of 3,506.55 kms of Broad Gauge (BG), 1,193.04 kms of
        Meter Gauge (MG) and 558.90 kms of Narrow Gauge (NG) lines.

      The rail traffic in Gujarat mainly falls under the following divisions of
        Western Railway: Vadodara, Rajkot, Bhavnagar, Ratlam, Mumbai &
        Ahmedabad.

      Ahmedabad, Anand, Bhavnagar, Bhuj, Godhra, Porbandar, Rajkot,
        Vadodara (Baroda) & Valsad are some of the important railway
        stations in the state.

      India's first National Rail and Transportation University which will be
                                                                                       Source: Maps of India
        set up in Vadodara.
                                                                                         The state government is developing a High Speed Rail passenger
      Government of India has sanctioned construction of Ahmedabad                        corridor from Ahmedabad to Mumbai with the cooperation of the
        Metro with a length of 36 km at a cost of Rs 10,773 crore (US$ 1.61                Government of Japan. The length of the corridor is 508 km and total
        billion). The project is expected to be completed by July 2020.                    journey time for the train is estimated at 2.07 hrs with total estimated
                                                                                           cost of the project is US$ 14.92 billion. About 81 per cent of the
                                                                                           funding for the project will come by way of a loan from Japan.

 Source: Socio-Economic Review of Gujarat, 2015-16 MEGA-Metrolink Express for Gandhinagar and Ahmedabad, News articles

18      Gujarat                                                                                                For updated information, please visit www.ibef.org
PHYSICAL INFRASTRUCTURE – AIRPORTS…(1/2)

     Aircraft movement, Passenger and Freight in 2018-19*

                          Aircraft                 Passenger
       Airport                                                           Freight (MT)                                            Deesa
                       movement (nos.)            traffic (nos.)                                        Naliya                           Mehsana
                                                                                                                   Bhuj
       Ahmedabad               57,250                8,191,496              78,447           Mundra                   Kandla
                                                                                                                       Mandvi                 Ahmedabad
                                                                                              Mithapur
                                                                                                                       Jamnagar              Vadodara
       Vadodara                 6,362                 831,287                2,285                       Porbandhar           Rajkot
                                                                                                                       Amreli
                                                                                                                                                   Surat
                                                                                                                                Bhavnagar
       Rajkot                   2,728                 259,221                191                       Keshod                 Diu
                                                                                                                                              Daman

                                                                                                      International airport        Domestic airport

      The state has 10 domestic airports (the highest in any state) and one international airport.

      There are domestic airports at Bhavnagar, Bhuj, Jamnagar, Kandla, Keshod, Deesa, Porbandar, Rajkot, Surat, Vadodara, Mundra, Mandvi and
        Palanpur.

      Freight traffic at Vadodara and Rajkot airports reached 2,285 MT and 191 MT, respectively, during April-December 2018.

 Note: * For the period April to December 2018, MT – metric tonnes
 Source: Director Civil Aviation, Government of Gujarat, News articles

19       Gujarat                                                                                        For updated information, please visit www.ibef.org
PHYSICAL INFRASTRUCTURE – AIRPORTS…(2/2)

                   Aircraft movement in Ahmedabad (nos.)                                                      Passenger traffic in Ahmedabad (million)

       70,000                                                                                         10.00

                                                                                                       9.00

                                                                                                                                                                                      9.17
                                                                                 63,129
       60,000
                                                                                                       8.00

                                                                                                                                                                                                  8.19
                                                                                           57,250
       50,000                                                                                          7.00

                                                                                                                                                                          7.40
                                                                       51,107
                                                             47,195

                                                                                                                                                              6.48
                                                                                                       6.00
       40,000
                                         42,229
                     40,506

                                                   38,797
                               38,289

                                                                                                       5.00

                                                                                                                                                  5.05
       30,000

                                                                                                              4.70

                                                                                                                                      4.56
                                                                                                       4.00

                                                                                                                          4.16
       20,000                                                                                          3.00

                                                                                                       2.00
       10,000
                                                                                                       1.00

              0                                                                                        0.00
                                                                                           2018-19*

                                                                                                                                                                                                    2018-19*
                     2011-12

                               2012-13

                                         2013-14

                                                   2014-15

                                                             2015-16

                                                                       2016-17

                                                                                 2017-18

                                                                                                                2011-12

                                                                                                                            2012-13

                                                                                                                                        2013-14

                                                                                                                                                    2014-15

                                                                                                                                                                2015-16

                                                                                                                                                                            2016-17

                                                                                                                                                                                        2017-18
 Note: * For the period April to December 2018
 Source: Airports Authority of India

20     Gujarat                                                                                                            For updated information, please visit www.ibef.org
PHYSICAL INFRASTRUCTURE – PORTS … (1/2)

       The state has one of the strongest port infrastructures in India. It is
         the first state in India to take up port privatisation. Gujarat has 42
         ports, including one major port at Kandla and 41 minor ports, along a
         1,600 km coastline.

       GMB, which manages 41 non-major ports, has developed port
                                                                                      Jakhau               Kandla
         privatisation models such as private/joint sector ports, private jetties,             Mundra
                                                                                                               Navlakhi
         captive jetties and GMB jetties.
                                                                                                             Bedi                      Khambhat
                                                                                     Okha
                                                                                                         Sikka
       During 2018-19* Deendayal (Kandla) port handled 84.91 million                          Positra                      Dholera
         tonnes of cargo traffic.                                                                                      Bhavnagar            Dahej
                                                                                                      Porbandar           Mithivirdi         Magdalla
       As per Budget 2018-19, the state government has made a provision                                                  Mahuva             Hazira
                                                                                                           Simar
         of US$ 221 million for the port and transport department.                                                                            Vansi
                                                                                               Sutrapada                       Pipavav        Borsi
                                                                                                            Veraval       Jafrabad
       During 2018-19, Essar ports will invest Rs 4.5 billion (US$ 63 million)                                                               Maroli

         in Hazira port in Gujarat to increase the cargo-handling capacity of
         the port to 50 million tonnes (MT), current capacity of the port, is 30
         MT, raising the company’s capacity to 110 MT.

                                                                                        Major ports                 Private sector ports            GMB ports

     Note: * From April to December 2018
     Source: Indian Port Association, Ministry of Shipping

21        Gujarat                                                                                   For updated information, please visit www.ibef.org
PHYSICAL INFRASTRUCTURE – PORTS … (2/2)

      Gujarat has 2 LNG terminals that offer transportation facilities for                Traffic handled by Deendayal (Kandla) port (million tonnes)
        natural gas, crude oil & petroleum products from the Middle East and
                                                                                                       2011-12                              82.50
        Europe.
                                                                                                       2012-13                              93.62

      The state has a vast hinterland surrounded by the northwest markets                             2013-14                              87.00
        of Rajasthan, Delhi/NCR & Punjab. Together, these areas generate                               2014-15                              92.50
        approximately 60 per cent of India's cargo, of which a majority is
                                                                                                       2015-16                             100.05
        currently handled by the ports of Gujarat. The state has a large
                                                                                                       2016-17                             105.44
        external trade potential, given its vast coastline.
                                                                                                       2017-18                              90.99
      There is an increase in connectivity to non-major ports due to                                  2018-19^                             84.91
        development of the Delhi-Mumbai Dedicated Freight Corridor.
                                                                                           Key private sector stakeholders in Gujarat's ports sector
      More than 4,800 ships and 1,000 sailing vessels visit the ports of
                                                                                            Adani Ports and Special Economic Zone Ltd
        Gujarat every year.
                                                                                            Peninsular & Oriental Steam Navigation Company

      Private jetties in the state handled a total cargo traffic of 3.12 million           Gujarat Pipavav Port Limited
        tonnes in 2017-18*. Captive jetties handled total cargo of 159.9                    Reliance Industries Limited
        million tonnes along with the coastline of Gujarat cargo handled                    Maersk
        during 2017-18* was around 110.07 million tonnes.
                                                                                            Welspun

                                                                                            Petronet LNG

                                                                                            Shell
 Note: * up to November 2017, ^ From April to December 2018
 Source: Indian Port Association. Ministry of Shipping, Gujarat Economic Review, 2017-18

22      Gujarat                                                                                              For updated information, please visit www.ibef.org
PHYSICAL INFRASTRUCTURE – POWER AND
                    GAS … (1/2)

      As of December 2018, Gujarat had an installed power generation                                       Installed power capacity (MW)
       capacity of 31,381.85 MW (comprising 7,714.32 MW under state
       utilities, 19,355.72 MW under private utilities & 4,311.81 MW under              35,000

       central utilities).
                                                                                        30,000

                                                                                                                                                                                   31,382
                                                                                                                                                                         30,794
                                                                                                                                                               30,716
                                                                                                                                                     30,189
                                                                                                                                           28,960
      Thermal power contributed 22,168.00 MW to the state’s total installed

                                                                                                                                 27,420
                                                                                        25,000

                                                                                                                       26,414
       power generation capacity, followed by a contribution of 772 MW by

                                                                                                             21,918
       hydropower, 559 MW by nuclear power & 7,882.85 MW by renewable                   20,000

       power.                                                                           15,000

                                                                                                  15,723
      Power capacity of 600 MW Solar Power Stations have been                          10,000
       commissioned by 31 developers in Gujarat Solar Park. Further power
                                                                                         5,000
       capacity of 175 MW is under planning with an estimated cost of Rs.
       755 crore (US$ 117.15 million).                                                       0

                                                                                                                                                     2015-16
                                                                                                  2010-11

                                                                                                             2011-12

                                                                                                                       2012-13

                                                                                                                                 2013-14

                                                                                                                                           2014-15

                                                                                                                                                               2016-17

                                                                                                                                                                         2017-18

                                                                                                                                                                                   2018-19*
      Power generation in the state for 2018-19^ reached 61,312.97 GWH.

      Investments of Rs 2.2 trillion (US$ 30.49 billion) are expected in
                                                                                      In the state budget for 2018-19, US$ 1.31 billion was allocated to
       Gujarat's renewable energy sector over the next decade.
                                                                                       the Energy & Petrochemical Department.

 Note: * as of December 2018, GWH – GigaWatt Hour, ^ - between April-November 2018
 Source: Central Electricity Authority, Gujarat Economic Review, 2017-18

23       Gujarat                                                                                            For updated information, please visit www.ibef.org
PHYSICAL INFRASTRUCTURE – POWER AND
                   GAS … (2/2)

      Gujarat has the most developed gas pipeline network in the country,                 GAIL primarily serves consumers who have been allocated natural
        which is operated by GSPL, GGCL and GAIL.                                             gas by the Ministry of Petroleum and Natural Gas. Its pipeline
                                                                                              network can be divided into three sections: South Gujarat Network,
      Provision of US$ 29.13 million was channelled towards installation of
                                                                                              North Gujarat Network and ex-Hazira.
        15,000 solar domestic energy systems and providing around 3,210
        solar pumps for agriculture purpose across the scattered areas of the              GSPL is the nodal agency responsible for setting up a gas grid in
        state, during 2016-17.                                                                Gujarat, operating on common carriage basis. In 2015-16, the
                                                                                              company carried out the construction of a 366-km long pipeline and
      For the provision of free power supply to the water works of each
                                                                                              gas compressor station at Gana, Gujarat, with a pipeline capacity of
        voluntary organization and gram panchayat of the state, the state
                                                                                              14 mmscmd.
        government has proposed an allocation of US$ 62.08 million during
        2017-18.                                                                           GGCL currently operates a 1,550 km and 350 km under
                                                                                              construction/development pipeline network. It is planning to set up a
     GSPL’s integrated gas-grid
                                                                                              pipeline network of about 3,000 km in Gujarat.

     Current transmission                                     24.85 mmscmd
                                                                                           GCL has a total gas pipeline length of about 2,700 km and services
     Operational pipeline                                         2,454 km                    230,000 customers.

     Under construction pipeline                                   69 km

 Source: Gujarat Economic Review, 2017-18, State Budget 2016-17, GSPL-Gujarat State Petronet Ltd., GGCL-Gujarat Gas Company Ltd., GAIL-Gas Authority of India Ltd., MMSCMD:
 Million metric standard cubic metres per day.

24      Gujarat                                                                                                 For updated information, please visit www.ibef.org
PHYSICAL INFRASTRUCTURE – TELECOM

                                                                                             Performance status of BharatNet (National Optical Fibre
     Telecom infrastructure (as of November 2018)
                                                                                             Network) Project (as of July 2018)

      Wireless subscribers                                        70,372,673                 No. of GPs in Phase-I                                   6,905

      Wire-line subscribers                                        1,223,903                 Pipe laid (kms)*                                        6,370

      Internet subscribers^                                       35,910,000                 Optical Fiber Cable laid (in kms, as of
                                                                                                                                                     14,265
                                                                                             December 02, 2018)
      Tele-density (in %)                                            109.21
                                                                                             GPs for which cable laid                                5,788

                                                                                             Service ready GPs (as of January 02,
                                                                                                                                                     5,117
                                                                                             2019)

      As of November 2018, the state had 35.91 million internet subscribers.

      According to Telecom Regulatory Authority of India (TRAI), as of November 2018, Gujarat had 70.37 million wireless connections and 1.22 million
        wire-line subscribers.

      By the end of November 2018, 26.53 million subscribers had submitted request for mobile number portability in Gujarat.

      The Government of India has approved Rs. 1,652.97 crore (US$ 256.47 million) through Department of Telecommunications for implementation of
        BharatNet Phase-II in 7295 (6916 of Phase II + 379 from Phase-I) Gram Panchayats of Gujarat.

 Note: ^As of September 2018, GP-Gram Panchayats, * As of February 2018
 Source: Telecom Regulatory Authority of India, Ministry of Communications & Information Technology. Gujarat Economic Review, 2017-18.

25      Gujarat                                                                                                     For updated information, please visit www.ibef.org
PHYSICAL INFRASTRUCTURE – URBAN… (1/2)

       With household income of more than US$ 1.9 billion by 2018, Surat       Classification of AMRUT Cities (Funds allocated, committed
          is expected to emerge as a new metro in India.                        and sanctioned by central) (US$ million)

                                                                                                           Total
       Gujarat has 8,188 villages and 159 towns connected with Narmada-                                                Committed         Sanctioned
                                                                                                        Allocation
          based Water Supply Grid through Bulk Pipeline and Distribution
                                                                                Fund under AMRUT
                                                                                                          757.86           321.17           321.17
          Group network.                                                        Program*

                                                                                Total number of
       In order to develop and improve urban areas of Gujarat, the state                                                      31
                                                                                AMRUT cities*
          government has announced plans to invest US$ 1.93 billion as per
                                                                                Fund allocation under PMAY (as of July 2018)
          the budget 2018-19. For construction of individual, community and
          public toilets and solid and liquid waste management, the                           Cities                          Released       Utilised
                                                                                            included        Approved in
          Government of Gujarat has announced plans to invest US$ 108.12         State                                         in (US         in (US
                                                                                                            (US million)
                                                                                           In Mission                          million)      million)
          million during 2018-19.
                                                                                Gujarat           171          736.11           383.39        263.84
       Under the Mahatma Gandhi National Rural Employment Guarantee
          Scheme (MGNREGS), 19,892 check dams were constructed in
          Gujarat. As per the state budget for 2017-18, US$ 43.31 million was
          allocated by the state government for improving and reinforcing the
          network of existing canals in the state.

     Note: * As of April 2018
     Source: Economic Survey of Gujarat 2015-16 State Budget 2016-17

26        Gujarat                                                                                   For updated information, please visit www.ibef.org
PHYSICAL INFRASTRUCTURE – URBAN… (2/2)

      Six cities in Gujarat, namely Ahmedabad, Surat, Vadodara, Rajkot,     Smart Cities in Gujarat
       Dahod and Gandhinagar are shortlisted to be transformed into smart
                                                                             Cities            Population      Area (sq km)      Literacy rate
       cities under the central government’s Smart City Mission.
                                                                             Ahmedabad          7,214,225          8,107           85.31%
      The state will receive an amount of around US$ 0.49 billion for the   Gandhinagar        1,391,753          2,140           84.16%
       development of smart cities. A large number of projects are
                                                                             Rajkot             3,804,558          11,198          80.96%
       anticipated to be established under the mission.
                                                                             Surat              6,081,322          4,549           85.53%
      As of July 2018, Rs 700 crore (US$ 104.42 million) have been
                                                                             Vadodara           1,602,424          148.95          78.92%
       released for smart city projects in Gujarat.
                                                                             Dahod                94,578            23               NA
      The Government of India has released US$ 28.14 million to the state
       under AMRUT scheme in 2017-18. The scheme covers 31 cities in
       the state.

      As of December 2017, Ahmedabad had utilized the 40.89 per cent of
       the funds provided for smart city related projects.

 Source: TechSci Research

27      Gujarat                                                                               For updated information, please visit www.ibef.org
Gujarat

SOCIAL
INFRASTRUCTURE
SOCIAL INFRASTRUCTURE – EDUCATION

      Gujarat has a literacy rate of 79.31 per cent; the male literacy rate is                                                        No. of seats in technical education 2017-18 (P)
        87.23 per cent and the female literacy rate is 70.73 per cent.
                                                                                                                                       Engineering                                          68,113
      Gujarat’s government set up Indian Institute of Information
                                                                                                                                       MBA                                                  9,870
        Technology           college            near               Vadodara             approved            by               Central
                                                                                                                                       Pharmacy                                             5,675
        government. The IIT (Vadodra)                                        based on a public-private
                                                                                                                                       MCA                                                  5,410
        partnership model.
                                                                                                                                       Architecture                                         1,680
      As of 2017, Gujarat has 65 universities and 2,196 colleges and 416
        Industrial Training Institutes.
                                                                                                                                       No. of seats in diploma courses 2017-18 (P)

           Funds released for Primary Education (US$ million)
                                                                                                                                       Engineering                                        69,952

        140.00                                                                                                                         Pharmacy                                            580
        120.00
                                       121.76

                                                                                                120.62

        100.00
                                                                                                                           100.92

         80.00                                                                                                                         Literacy rates (%) (consensus 2011)
                                                                   94.05

         60.00
                     69.49

                                                                              63.24

                                                                                                         62.73
                                                 59.04

         40.00                                                                                                                         Literacy rate                                      79.31
         20.00
          0.00                                                                                                                         Male literacy                                      87.23
                             2014-15

                                                         2015-16

                                                                                      2016-17

                                                                                                                 2017-18

                                                                                                                                       Female literacy                                    70.73

                                         MDM Scheme                        SSA Programme

 Note: (P) = Provisional, data is expected to be updated from Gujrat Economic Survey 2018-19
 Source: Census 2011, Gujarat Economic Review, 2017-18, State Budget 2018-19 , Loksabha

29      Gujarat                                                                                                                                          For updated information, please visit www.ibef.org
SOCIAL INFRASTRUCTURE – HEALTH

      Gujarat is at the forefront of establishing & maintaining a good                  Health infrastructure (as of January 2019)
        health infrastructure.
                                                                                         Primary Health Centres                              2,059
      Gujarat’s health infrastructure facilities have 2,059 primary health
                                                                                         Sub-Centres                                         9,669
        centres, 9,669 sub-centers, 3,305 community health centres, 384
        sub district hospitals, and 50 district hospitals.                               Community Health Centres                            3,305

      In the state budget for 2018-19, US$ 1.5 billion has been allocated               Sub District Hospitals                               384

        by the state government for Health & Family Welfare department                   District Hospitals                                    50
        under Plan & Non-Plan expenditure.
                                                                                         Key health schemes of Gujarat government
      Under medical services, the following provisions have been made
                                                                                          Chiranjeevi Scheme
        for 2017-18:
                                                                                          Bal Sakha Yojna
        •   Provision of US$ 20 million upgradation and modernization of                  Mukhyamantri Amrutam Yojana (MA Yojana)
            civil hospital Ahmedabad.
                                                                                          Centre-aided Health Insurance Scheme

        •   Provision of US$ 6.21 providing free treatment to BPL and lower               Rogi Kalyan Samiti

            income families at cancer, kidney and cardiac public institutions.

        •   Provision of US$ 15.52 million under Medical Policy 2016.

 Source: Gujarat Economic Review, 2017-18, Health Management Information System, State Budget 2018-19

30      Gujarat                                                                                               For updated information, please visit www.ibef.org
Gujarat

INDUSTRIAL
INFRASTRUCTURE
INDUSTRIAL INFRASTRUCTURE

      Gujarat has 106 product clusters. The Cluster Development Scheme                    Product Clusters

        has been launched for furthering the growth of product clusters.

      Some of the successful clusters include ceramics cluster at Morbi,                                                                        Agro Processing
                                                                                                            Soda ash and salt-based
        brass-parts cluster at Jamnagar, fish-processing cluster at Veraval                             industries, cement and steel pipes               Mehsana

        and power-looms cluster at Ahmedabad.                                                                Kachch

                                                                                                                        KANDLA                              Gandhinagar
                                                                                                                                        Petroleum and
                                                                                                                                         brass parts     Ahmedabad
      There are 13 major industry groups that together account for around                                                      Morbi
                                                                                                           MUNDRA                                        Chemicals, Petrochemicals,
                                                                                                    Okha
        82.05 per cent of total factories, 95.85 per cent of total fixed capital                                                         Surendranagar       Pharma, Textiles
                                                                                                                                                          Anand
                                                                                                                            Rajkot
        investment, 90.09 per cent of the value of output & 93.21 per cent of                                   Engineering                                                  Vadodara
                                                                                                                and ceramics
        value addition to Gujarat’s industrial economy.                                                          Jamnagar                                    DAHEJ    Ankleshwar
                                                                                                                                 Amreli         Bhavnagar
                                                                                                                                   Soda ash and
      Gujarat is a leader in industrial sectors such as chemicals,                                                            salt-based industries                      Surat
                                                                                                                   Sutrapada
        petrochemicals, dairy, drugs, pharmaceuticals, cement, ceramics,                                                                                     HAZIRA         Navsari
                                                                                                                          Kodinar
                                                                                                                                           PIPAVAV
        gems, jewellery, textiles & engineering.                                                                                                             Valsad

      The industrial sector of the state comprises of around 603,000 micro,
        small & medium industries which provide employment to about                        The state has announced an Incentive program for the Industries
        3,851,000 people.                                                                     (General) from 2016-2021 in accordance with the New Industrial
                                                                                              Policy of 2015. The scheme aims to attract increased investments to
      As per Budget 2018-19, state government announced plans to invest
                                                                                              the state in the manufacturing sector to create more employment
        US$ 682.2 million for the growth of industrial sector of Gujarat.
                                                                                              opportunities.
 Source: Industries Commissionerate, Government of Gujarat Socio-Economic Review of Gujarat, 2015-16, State Budget 2018-19, MSME: Micro, Small & Medium Enterprises, GIDC:
 Gujarat Industrial Development Corporation,

32      Gujarat                                                                                                    For updated information, please visit www.ibef.org
INDUSTRIAL INFRASTRUCTURE - SEZS… (1/2)

      Gujarat ranks first in terms of total area covered under SEZs in        Sector-wise operational SEZs in Gujarat (As of January 2019)
        India. It is also a leading SEZ state with the highest geographical                                                 Operational SEZs in
                                                                               Sector
        area of 29,423.9 hectares under SEZ development.                                                                         Gujarat

                                                                               Multi Product                                           4
      As of January 2019, Gujarat had 16 operational SEZs. In addition to
                                                                               Pharmaceuticals                                         1
        operational SEZs, Gujarat had 4 SEZs with valid in-principle
        approvals, 28 SEZs with formal approvals and 24 SEZs with notified     IT/ITES                                                 6

        approvals.                                                             Textiles and Articles of Textiles                       1

                                                                               Hi-tech engineering products and related
      Gujarat is the first state to formulate an SEZ policy, which includes                                                           1
                                                                               services
        flexible labour laws and exit options for investors. SEZs in Gujarat
                                                                               Engineering goods                                       1
        receive a 10-year corporate tax holiday on export profits (100.0 per
        cent for the initial five years and 50.0 per cent for the next five    Chemicals                                               1

        years).                                                                Non-conventional Energy incl.
                                                                                                                                       1
                                                                               (solar energy equipments/ cell)

                                                                               Multi Services                                          1

 Source: Ministry of Commerce & Industry, Government of India

33      Gujarat                                                                                   For updated information, please visit www.ibef.org
INDUSTRIAL INFRASTRUCTURE - SEZS… (2/2)

                        Surat SEZ exports (US$ billion)                                                        Kandla SEZ exports (US$ million)

        10.0
                                                                                                  800
         8.0                                                                                                                                             752
                           7.8                                                                    600
                                                                                                                                 627     646     655
         6.0                                                                                                             601
                                                                                                                 545
         4.0                                                                                      400    461
                 4.6                 4.5
         2.0                                                       3.2
                                                         2.4                 2.5                  200
                                               1.8
         0.0
               2011-12 2012-13 2013-14 2014-15 2015-16 2016-17 2017-18                             0
                                                                                                        2011-12 2012-13 2013-14 2014-15 2015-16 2016-17 2017-18

      Surat accounts for more than 120 units of SEZs and supplies products to various locations around the world. Some of the key clients of the Surat
        SEZ include Adorn Gioielli, Flexit Laboratories Pvt Ltd., Priyank Cord & Tassels Ind. Ltd., Flair Impex Corporation and Pidilite Industries.

      Other large SEZs in Gujarat include M/s. Adani Port & Special Economic Zone Limited., M/s. Reliance Industries Ltd. and Sterling SEZ &
        Infrastructuring Ltd.

      In 2017-18, 264 units operate in Kandla and export products across the globe. The employee strength in Kandla SEZ is around 25,433.

      Overall exports from Gujarat increased 22 per cent in 2017-18 to US$ 66 billion.

 Note: Data is expected to be updated from Gujrat Economic Survey 2018-19
 Source: Ministry of Commerce & Industry, Government of India, Gujarat Economic Review, 2017-18

34      Gujarat                                                                                                 For updated information, please visit www.ibef.org
Gujarat

KEY SECTORS
  Agro & Food Processing

  Textiles and Apparel

  Gems and Jewellery

  Oil and Gas

  Pharmaceuticals and Biotechnology

  Chemicals and Petrochemicals
KEY SECTORS – AGRO & FOOD PROCESSING … (1/4)

      Gujarat accounts for the largest share in the total investments in the                                        Gujarat's position in         Share of world
                                                                                           Crop
                                                                                                                      world production             production (%)
        food processing sector of India.
                                                                                           Castor seeds                            1                     41
      Cotton, groundnut, bajra, paddy, maize, jowar, sesamum, castor &                    Fennel                                  1                     67
        tur (pigeon pea), along with fodder & vegetables, are the major kharif
                                                                                           Isabgul                                 2                     35
        crops in the state. Normal area under kharif cultivation is 8.6 million
        hectares.                                                                          Cotton                                  8                     3.5

      As of December 2018, 79 Agricultural Produce Market Committees                       Agri Export Zones Projects in Gujarat

        (APMCs) are linked with the National Agriculture Market (eNAM).                      Mango and vegetables

                                                                                             Value added onions
      GAIC promotes agricultural activities at the ground level & aids the
                                                                                             Sesame seeds0
        development of agro industries in the state.
                                                                                             In the budget 2018-19 for the state of Gujarat, an outlay of US$
      To provide an impetus to the development of farmers, Gujarat
                                                                                               1043.4 million was allocated for the Agriculture, Co-operation and
        announced ‘Agro Business Policy 2016-21. Food processing units
                                                                                               farmer Department. Initiatives for the agro & food processing sectors
        and agriculture infrastructural projects would be provided with
                                                                                               include: Provision of US$ 61.01 million for the Rashtriya Krishi Vikas
        various kinds of assistance to ensure that the crops and fruits
                                                                                               Yojana. Allocation of US$ 59 million for the development of fisheries
        cultivated in the state last longer and get exported on a large scale.

 Source: Vibrant Gujarat, APMC-Agriculture Produce Market Committees, GAIC-Gujarat Agro Industries Corporation, Gujarat Economic Review, 2017-18

36      Gujarat                                                                                                   For updated information, please visit www.ibef.org
KEY SECTORS – AGRO & FOOD PROCESSING … (1/4)

      Gujarat accounts for the largest share in the total investments in the                                        Gujarat's position in         Share of world
                                                                                           Crop
                                                                                                                      world production             production (%)
        food processing sector of India.
                                                                                           Castor seeds                            1                     41
      Cotton, groundnut, bajra, paddy, maize, jowar, sesamum, castor &                    Fennel                                  1                     67
        tur (pigeon pea), along with fodder & vegetables, are the major kharif
                                                                                           Isabgul                                 2                     35
        crops in the state. Normal area under kharif cultivation is 8.6 million
        hectares.                                                                          Cotton                                  8                     3.5

      As of December 2018, 79 Agricultural Produce Market Committees                       Agri Export Zones Projects in Gujarat

        (APMCs) are linked with the National Agriculture Market (eNAM).                      Mango and vegetables

                                                                                             Value added onions
      GAIC promotes agricultural activities at the ground level & aids the
                                                                                             Sesame seeds0
        development of agro industries in the state.
                                                                                             In the budget 2018-19 for the state of Gujarat, an outlay of US$
      To provide an impetus to the development of farmers, Gujarat
                                                                                               1043.4 million was allocated for the Agriculture, Co-operation and
        announced ‘Agro Business Policy 2016-21. Food processing units
                                                                                               farmer Department. Initiatives for the agro & food processing sectors
        and agriculture infrastructural projects would be provided with
                                                                                               include: Provision of US$ 61.01 million for the Rashtriya Krishi Vikas
        various kinds of assistance to ensure that the crops and fruits
                                                                                               Yojana. Allocation of US$ 59 million for the development of fisheries
        cultivated in the state last longer and get exported on a large scale.

 Source: Vibrant Gujarat, APMC-Agriculture Produce Market Committees, GAIC-Gujarat Agro Industries Corporation, Gujarat Economic Review, 2017-18

37      Gujarat                                                                                                   For updated information, please visit www.ibef.org
KEY SECTORS – AGRO & FOOD PROCESSING … (2/4)

       In 2018-19*, exports of major agriculture commodities from Gujarat         Agri Exports (US$ million)

         stood at US$ 3.16 billion.
                                                                                   Crop                                          2018-19*

       Gujarat’s dairy sector consists of 17 district milk producers’ unions,     Fruits and Vegetable seeds                       0.54
         with around 14,598 milk co-operative societies.                           Fresh Onions                                     1.78

                                                                                   Dairy Products                                  26.56
       The state’s milk production, which stood at 13.57 million tonnes
         during 2017-18, was the fifth largest state in India with 7.69 per cent   Wheat                                            4.46

         of India’s share.                                                         Pulses                                          56.11

                                                                                   Groundnut                                       174.92

                                                                                   Key districts in the dairy sector

                                                                                                                            Gandhinagar

                                                                                                                Ahmedabad
                                                                                                                                   Anand

     Note: * as of April–November 2018

38        Gujarat                                                                                    For updated information, please visit www.ibef.org
KEY SECTORS – AGRO & FOOD PROCESSING … (3/4)

     Agricultural production (thousand tonnes)                                                  Agricultural area (thousand hectares)

     Crop                                         2016-17                      2017-18*         Crop                                           2016-17                       2017-18*

     Rice                                            1,929                       2,039**        Rice                                                837                            805

     Wheat                                           2,737                       3,102**        Wheat                                               995                          1,053

     Jowar                                             150                            101       Jowar                                               106                              75

     Bajra                                             931                            247       Bajra                                               431                            156

     Total Foodgrains                                7,422                       7,776**        Total Foodgrains                                  3,803                          3,416
                                                                                                        1
     Cotton                                          85.75                      126.37**        Cotton                                            23.82                          26.23

     Groundnut                                       2,944                         3,206        Groundnut                                         1,760                          1,596

     Total Oilseeds                                  4,789                       5,858**        Total Oilseeds                                    2,776                          2,641

      As per the budget 2018-19, an allocation of US$ 1.03 billion has been made to the Agriculture, Cooperation and allied activities sector.

      In 2018-19^, the production of cotton, rice, total foodgrains and total oilseeds reached 88.28 thousand tonnes, 1,938 thousand tonnes, 3,159
        thousand tonnes and 4,152 thousand tonnes, respectively.

 Note: ** - As per 4th advance estimate, * Second advance estimate, ^ - As per 4th advance estimates
 Source: Ministry of Agriculture, National Horticulture Board, Gujarat Economic Review, 2017-18, State Budget 2018-19, 11000,000 bales (170 kgs each),area in lakh hectares as per 3rd
 advance estimates

39      Gujarat                                                                                                        For updated information, please visit www.ibef.org
KEY SECTORS – AGRO & FOOD PROCESSING … (4/4)

     Key players in agro and food processing industry

                                Anand Milk Union Limited (AMUL) was established in 1946 in Anand, Gujarat. Amul is a market leader in butter,
                                 whole milk, cheese, ice cream, dairy whitener, condensed milk, saturated fats and long-life milk. In August 2015,
                                 dairy major Amul announced plans to invest US$ 124 million for increasing its cheese manufacturing capacity
                                 from 40 tonnes to 120 tonnes.
             Amul

                                Parle Products Pvt Ltd has been India's largest manufacturer of biscuits and confectionery for almost 80 years.

                                Brands include Parle-G, Krackjack, Monaco, Hide and Seek, Poppins, Melody and Mango Bite.

                                The company has a factory at Bhuj, Gujarat.
     Parle Products Pvt Ltd

                                Vadilal was established in 1907 at Ahmedabad. The company manufactures ice-creams and frozen desserts. In
                                 October 2013, Vadilal was rated as India's second most attractive food & beverage brand by TRA.
                                Exports processed products. One manufacturing plant at Pundhra in Gandhinagar, second in Bareilly, Uttar
                                 Pradesh, and third in Dharampur, Surat.
            Vadilal

                                Rasna was formed in 1984, and has around 93.0 per cent market share in the powdered Indian soft drink
                                 concentrate market.
                                The company has a wide range of products in the processed-foods category such as fruit jams, energy sports
                                 drink powder, fruit cordial, rose syrup and iced tea.
                                Rasna has the largest capacity in Asia to make powder concentrates, with seven facilities spread across India.
             Rasna               The company is based in Ahmedabad.

40     Gujarat                                                                                 For updated information, please visit www.ibef.org
KEY SECTORS – TEXTILES AND APPAREL … (1/3)

      As per the Government of Gujarat’s survey report, technical textiles                             Cotton production in Gujarat (million bales of 170 kg each)
       is a key emerging area, with over 860 units in Gujarat.
                                                                                                       14.00
      The textile industry contributes around 6 per cent to the total                                 12.00
                                                                                                                                                          12.64
       industrial production in the state (organised sector). Gujarat is the                           10.00             10.95    10.50
                                                                                                         8.00   8.85                      9.40                    8.83
       largest producer of denim in India (65-70 per cent) and the third-                                                                         8.58
                                                                                                         6.00
       largest producer in the world.                                                                    4.00
                                                                                                         2.00
      Surat is the largest manufacturing centre of silk fabric and produces                             0.00

                                                                                                                2012-

                                                                                                                          2013-

                                                                                                                                  2014-

                                                                                                                                          2015-

                                                                                                                                                  2016-

                                                                                                                                                          2017-

                                                                                                                                                                  2018-
                                                                                                                                                                   19**
                                                                                                                                                           18*
                                                                                                                                           16
                                                                                                                 13

                                                                                                                           14

                                                                                                                                   15

                                                                                                                                                   17
       over 40 per cent of silk in the country. About 24-28 per cent of fixed
       investment, production value and employment of SSI is from the
       textiles sector. Gujarat has extended full support to entrepreneurs
       who want to invest in the technical textile market in the state.

      In 2014, state Government of Gujarat introduced textile policy. In
       order to promote the textile policy in the state, Gujarat state
       government had allocated US$ 88.44 million for implementation of
       this policy under budget 2017-18.

 Note: * - As per 4th advance estimate, ** - As per 4th advance estimates
 Source: Ministry of Textiles, SSI – Small Scale Industries, News articles, * as per 3rd Advance Estimates.

41      Gujarat                                                                                                         For updated information, please visit www.ibef.org
KEY SECTORS – TEXTILES AND APPAREL … (2/3)

      On the basis of capital investments worth US$ 2.3 billion, the textile   Investment opportunities

        policy of Gujarat has been successful in providing large scale           Conventional textiles
        employment opportunities in the state.                                    • Ginning and pressing
                                                                                  • Cotton & synthetic based spinning, weaving & processing units,
      The Government of Gujarat has introduced various schemes to                  cotton knitwear
        provide assistance in the form of:                                        • Terry towel/home furnishing
                                                                                  • High valued garment manufacturing
        •   Interest subsidy, power tariff and VAT exemption.
                                                                                 Technical textiles
        •   Support to technical textiles.
                                                                                  • Protective textiles
        •   Assistance for energy conservation, water conservation and            • Agro textiles
            environmental compliance to the existing unit.                        • Geo textiles
                                                                                  • Automotive textiles
        •   Assistance for technology.
                                                                                  • Home textiles
        •   Acquisition and upgradation.
                                                                                 Infrastructure development
        •   Assistance for apparel training institutions and trainees.            • Cotton Integrated Textile and Apparel Park

      The state government has announced plans for the setting up of
        brown and green field projects to facilitate environment friendly
        processing standards in the textile units of the state.

 Source: Industrial Extension Bureau (A Government of Gujarat organisation)

42      Gujarat                                                                                     For updated information, please visit www.ibef.org
KEY SECTORS – TEXTILES AND APPAREL … (3/3)

     Key players in textiles and apparel industry

                                  One of the largest producers of denim in the world and largest producer in Asia. Product line includes fabrics
                                   (denims, shirtings, khakis and knitwear) and garments. Asia’s first fabric-manufacturing unit to receive an ISO-
                                   14001 certification.
           Arvind Ltd

                                  100 per cent cotton-fabric manufacturers and a vertically integrated group. It has its registered office at
                                   Ahmedabad. Exports fabric to over 45 countries, markets to over 150 Indian garment exporters.

         Ashima Group

                                  Part of the S.K. Birla Group, the company was established in Jamnagar, Gujarat in 1948. The company
                                   manufactures fabrics for suiting and casual wear. It has restructured its business portfolios to focus on textile
                                   manufacturing and marketing of fabrics and ready-to-wear clothing under its own brands.

           Digjam Ltd

                                  With over 60.0 per cent market share in India, Raymond is one of the largest integrated manufacturers of worsted
                                   fabric in the world. The group is into textiles, engineering and aviation.

                                  Raymond Apparel Limited is a 100 per cent subsidiary of Raymond Limited. The plant at Vapi in Gujarat has a
                                   production capacity of 14 million metres per annum.
         Raymond Ltd

43      Gujarat                                                                                 For updated information, please visit www.ibef.org
KEY SECTORS – GEMS AND JEWELLERY… (1/2)

      Gujarat accounts for around 72 per cent of the world’s share of                          Investment opportunities
        processed diamonds and more than 80 per cent of diamonds                                 Jewellery fabrication
        processed in India. It also accounts for 95 per cent of diamonds                         White gold
        exported from India. About 90 per cent of diamonds in Gujarat are
                                                                                                 Platinum jewellery
        processed by about 10,000 diamond units located in and around
                                                                                                 Paved diamond jewellery
        Surat.
                                                                                                 Studded jewellery
      Eight out of 10 diamonds in the world are polished in Surat. The state
        has the highest labour productivity in the jewellery sector, with major                 Infrastructure development

        jewellery clusters at Ahmedabad, Surat and Rajkot.                                       Jewellery manufacturing units

                                                                                                 Assaying and hallmarking centres
      It is also internationally renowned for the production of unique
                                                                                                 Gold refinery
        hand-made silver ornaments (85 per cent of total silver jewellery
                                                                                                 Diamond park
        production of India).

      Renowned institutions such as the Indian Diamond Institute, Gujarat                      Jewellery retail

        Hira Bourse, and the Gems and Jewellery Export Promotion Council                         Luxury Products such as watches, brooches, clocks
        provide skilled manpower for the industry.

      Exports of Gold and other precious metals from Gujarat reached US$
        2,212.69 million in 2017-18.

 Source: Industrial Extension Bureau (A Government of Gujarat organisation), Directorate General of Commercial Intelligence and Statistics

44      Gujarat                                                                                                         For updated information, please visit www.ibef.org
KEY SECTORS – GEMS AND JEWELLERY… (2/2)

     Key players in gems and jewellery industry

                                 Sanghavi Export’s core business is exporting polished diamonds and diamond studded jewellery, and
                                  manufacturing diamonds and jewellery.

                                 It boasts of a large network of marketing offices worldwide, from the US to Hong Kong, Belgium to Japan,
                                  Australia to Canada, and Singapore to the European nations.

                                 The company’s well-equipped hi-tech diamond manufacturing factory, Sanghavi Diamond Mfg Pvt Ltd at Surat, is
       Sanghavi Exports           one of the largest units in Asia.

                                 Venus Jewel is a partnership firm established in 1969, specialising in manufacturing large-sized premium
                                  diamonds.

                                 The company deals in sizes from 0.50 to 15.00 carats in an expensive array of shaped diamonds of exceptional
                                  symmetry and polish.
          Venus Jewel

                                 Forever Diamonds is a manufacturer and exporter of diamond jewellery.

                                 The company deals in loose diamonds, diamond jewellery and gold jewellery.

       Forever Diamonds

45     Gujarat                                                                               For updated information, please visit www.ibef.org
KEY SECTORS – OIL AND GAS … (1/2)

      Gujarat is a preferred destination for MNCs like BASF, Bayer,                           Key locations                 Oil and gas companies

        DuPont, GE Plastics, Solvay, Cairn Energy, Shell, British Gas, etc.                                                  Reliance Industries refinery: Largest grassroots
                                                                                               Jamnagar                      refinery in the world;
                                                                                                                             Essar Refinery
      Gujarat is known as India’s chemicals and petrochemicals hub. The
        state has eight chemical clusters, 14 industrial estates and three                     Dahej                         Petronet LNG’s re-gasification terminal

        SEZs, which are primarily dedicated to the chemicals and                               Hazira                        Shell and Total’s LNG terminal
        petrochemicals industry. Oil and gas reserves are located at
                                                                                               Vadodara                      Indian Oil Corporation’s refinery
        Ankleshwar, Mehsana, Tapti High, Hazira, Bharuch, Gandhar, Dahej,
        Jambusar, Palej and Kalol. Isolated gas fields are located around                      Gandhar                       ONGC’s gas processing complex
        Ahmedabad.
                                                                                               Investment opportunities
      As of July 2018, Gujarat had four refineries with a combined capacity
                                                                                                Oil & gas refining
        of 101.9 MMTPA. In March 2018, Indian Oil owned Gujarat refinery
                                                                                                Gas distribution
        of Vadodara city announced that it will invest about Rs 24,174.00
        crore (US$ 3.75 million) on new projects and expansions till 2022                       Investments in PCPIR are incentivised

        which includes capacity expansion to 18 MMTPA, these will generate                      Gujarat consists of 47 per cent of total domestic gas connections in
        huge employment in the state.                                                              the country.

      Exports of petroleum products from Gujarat reached US$ 25,184.83                         Gujarat, with Maharashtra and Delhi, accounts for 96 per cent of
        million in 2017-18 and US$ 21,953.99 million in April-September                            domestic connections of piped natural gas and 92 per cent of
        2018.                                                                                      commercial connections.

 Note: As per latest data available, MMTPA – Million Metric Tonnes Per Annum
 Source: Industrial Extension Bureau Ministry of Petroleum & Natural Gases, Gujarat Economic Review, 2017-18, Directorate General of Commercial Intelligence and Statistics

46      Gujarat                                                                                                       For updated information, please visit www.ibef.org
KEY SECTORS – OIL AND GAS … (2/2)

     Key players in oil and gas industry

                                 IOCL is India's largest integrated oil refining and marketing company by sales. It is the 18th largest petroleum
                                  company in the world. It owns and operates 10 of India’s 22 refineries; the company had a refining capacity of
                                  65.7 million metric tonnes per annum (MMTPA) (1.3 million barrels per day).
       Indian Oil Corp Ltd       The refinery at Koyali is IOCL’s largest with a capacity of 18 MMTPA.
             (IOCL)

                                 The company operates the largest oil producing fields in the Indian private sector. Cairn India holds material
                                  exploration and production positions in 11 blocks in west and east along with new exploration rights elsewhere in
                                  India and one in Sri Lanka. CIL plans to invest $3 billion over three years, with 80 per cent of capex in the Barmer
                                  oil block.

           Cairn India           In April 2017, Cairn India merged with Vedanta Ltd to form US$ 15.6 billion market capital.

                                 ONGC is India’s leading exploration and production company for oil and gas. It has 240 onshore production
                                  installations, 77 drilling rigs and a 26,598 km pipeline network. ONGC has a plant at Hazira; assets in Mehsana,
                                  Ahmedabad and Ankleshwar.

                                 The company has the Institute of Reservoir Studies (IRS) in Ahmedabad and a regional office in Baroda.
             ONGC

                                 Shell is among the global leaders in the oil, gas and petrochemicals sector, with interests in bio-fuels, wind, solar
                                  power and hydrogen. The company operates in over 90 countries, employing around 93,000 people worldwide. It
                                  is one of the largest and most diversified international investor in India’s energy sector.

                                 The company is the only global major to operate petro-fuel retail outlets in India. The Hazira LNG Terminal and
              Shell               port project is Shell’s largest venture in India.

47      Gujarat                                                                                  For updated information, please visit www.ibef.org
You can also read