UTTAR PRADESH A RAINBOW LAND - TAJ MAHAL IN AGRA, UTTAR PRADESH - IBEF

Page created by Sam Morrison
 
CONTINUE READING
UTTAR PRADESH A RAINBOW LAND - TAJ MAHAL IN AGRA, UTTAR PRADESH - IBEF
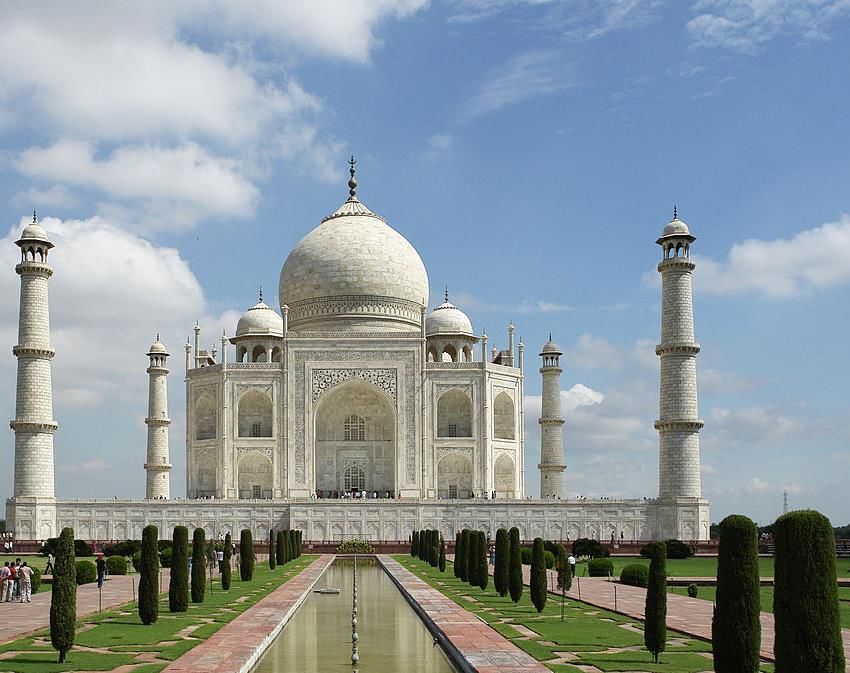
TAJ MAHAL IN AGRA, UTTAR PRADESH

 UTTAR PRADESH
 A RAINBOW LAND

For updated information, please visit www.ibef.org                            March 2018
UTTAR PRADESH A RAINBOW LAND - TAJ MAHAL IN AGRA, UTTAR PRADESH - IBEF
Table of Content

  Executive Summary .…………….….…….3

  Advantage State ……..……………………4

  Vision ……………….……………………....5

  Uttar Pradesh – An Introduction ……..…..6

  Budget Highlights ……………..………….14

  Infrastructure Status ...............................15

  Business Opportunities ……..………......40

  Doing Business in Uttar Pradesh ……….59

  State Acts & Policies …….………...........65
UTTAR PRADESH A RAINBOW LAND - TAJ MAHAL IN AGRA, UTTAR PRADESH - IBEF
EXECUTIVE SUMMARY

                                                   The number of foreign tourist arrivals in the state is expected to have crossed 2.8 million by 2017.
       Leading tourist
                                                   An amount of US$ 124.17 million has been allocated in the State Budget 2017-18 for development of tourism
       destination
                                                    infrastructure in Ayodhya, Varanasi and Mathura under ‘PRASAD’ Scheme.

                                                   Uttar Pradesh is the largest producer of food grains in India and accounted for about 17.83% share in the
                                                    country’s total food grain output in 2016-17. Food grain production in the state in 2016-17 stood at 49,144.6
       Strong Horticulture                          thousand tonnes.
       Base                                        Major food grains produced in the state include rice, wheat, maize, millet, gram, pea & lentils. With overall
                                                    vegetable production of 26.40 million tonnes in 2016-17, the state of Uttar Pradesh was the largest producer
                                                    of vegetables in India.

       Growth in state                             In 2017-18, state budget of Uttar Pradesh grew by 10.9%, as compared with the state budget in 2016-17. In
       budget                                       2017-18, the state government proposed an allocation of US$ 59.7 billion for various sectors of the state.

    Source: Uttar Pradesh Tourism, Government of Uttar Pradesh, Government of Uttar Pradesh, Directorate of Economics and Statistics, Ministry of Agriculture, India Sugar Mills Association,
    National Dairy Development Board, Milk Commissioner, Uttar Pradesh, India

3         UTTAR PRADESH                                                                                                    For updated information, please visit www.ibef.org
UTTAR PRADESH A RAINBOW LAND - TAJ MAHAL IN AGRA, UTTAR PRADESH - IBEF
ADVANTAGE: UTTAR PRADESH

          GSDP                   Hub of IT/ITeS services and semiconductor                            Developed infrastructure and good connectivity                     NSDP
                                                  industry
      GSDP of the                                                                                                                                                     NSDP of the
        state has                                                                                       The state has a well-developed social, physical and            state has
       increased               Uttar Pradesh has emerged as a key hub for IT & ITeS                     industrial infrastructure. It also has good connectivity
                                                                                                                                                                       increased
                                industries, including software, captive business                         through 48 national highways, 6 airports & rail links to
        from US$                                                                                                                                                        from US$
                                process outsourcing (BPO) & electronics.                                 all major cities. The state has witnessed strong
       58.2 billion                                                                                      infrastructure growth in the recent past. There has           58.6 billion
                               The state has become a hub for the semiconductor
          to US$                                                                                         been a considerable rise in the number of industrial             to US$
                                industry with several major players having their offices
          206.90                                                                                         clusters/hubs & PPPs in the infrastructure domain.               183.18
                                and R&D centres in Noida.
      billion during                                                                                                                                                  billion during
       2005-06 to                                                                                                                                                      2005-06 to
         2017-18                                                                        Advantage                                                                        2017-18
                                                                                       Uttar Pradesh
                                                  Rich labour pool                                                 Policy and fiscal incentives

                               With a population of 199.81 million, Uttar Pradesh is                   The state offers a wide range of subsidies, policy and
                                the most populous state in India.                                        fiscal incentives as well as assistance for businesses
                                                                                                         under the Industrial and Service Sector Investment
                               Uttar Pradesh has a large base of skilled labour,                        Policy, 2004 and Infrastructure & Industrial Investment
                                making it an ideal destination for knowledge-based                       Policy, 2012.
                                sectors.
                                                                                                        The state has well-drafted, sector-specific policies for
                               The state also has a large pool of semi-skilled and                      IT and biotech.
                                unskilled labour

    Source: Department of Infrastructure and Industrial Development, Directorate of Economics & Statistics of Uttar Pradesh, Central Statistics Office, Census 2011

4         UTTAR PRADESH                                                                                                     For updated information, please visit www.ibef.org
UTTAR PRADESH A RAINBOW LAND - TAJ MAHAL IN AGRA, UTTAR PRADESH - IBEF
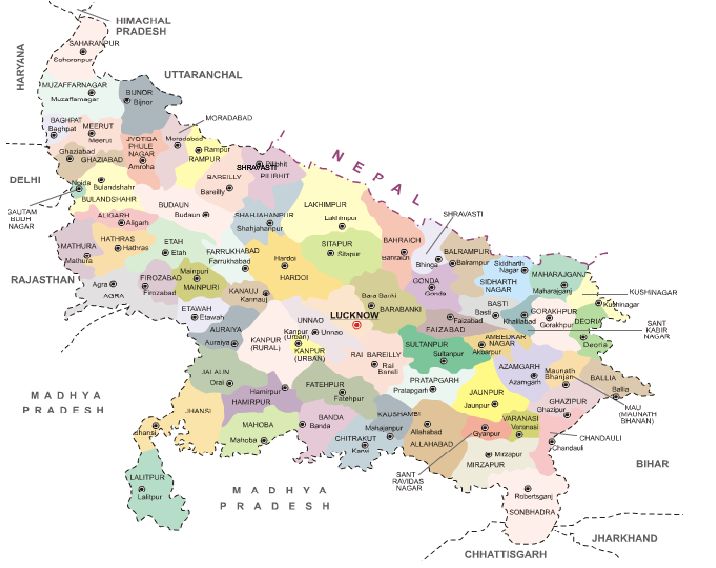
UTTAR PRADESH VISION

                                                    To invite private players to invest
                                                      in the energy sector and ensure                        To integrate efforts of various skill
                                                                                                              development departments of
                                                     uninterrupted power supply.
                                                                                                              central and state governments and
                                                    To promote generation and use of
                                                                                                              provide employment oriented
                                                     clean and green power in the state
                                                                                                              training in vocational skills.
                                                     by harnessing solar energy.

          To establish Uttar Pradesh as the                                                                                                         To use IT as a vehicle for
           most preferred destination for                                    Energy                  Skill development                                economic development.
           investments by accelerating industrial                                                                                                    To position Uttar Pradesh as the
           development and creating a                                                                                                                 preferred destination for IT/ITeS
                                                           Investment
           conducive business environment.                                                                             Information                    investment.
                                                            promotion
                                                                                                                       technology
                                                                                           Vision
                                                                                                                                                     To provide basic amenities to
              To develop religious tourism at               Tourism                                                 Social welfare
                                                                                                                                                      economically and socially
               various sites with potential.
                                                                                                                                                      backward sections.
              To develop areas of tourist interest                                                                                                  To provide housing to the urban
               and provide better wayside facilities.                     Agriculture               Infrastructure
                                                                                                                                                      poor and carry out slum
                                                                                                                                                      redevelopment programs.
                                                   To increase farm
                                                    productivity & farmer profitability.
                                                   To disseminate technology to                         To construct Metro Rail in Lucknow.
                                                    farmers through development of                       To develop, manage and maintain
                                                    training network, demonstration,                      highways at par with world standards.
                                                    and reference materials, among                       To provide connectivity to rural areas
                                                    others.                                               by developing roads.

    Source: Government of Uttar Pradesh

5      UTTAR PRADESH                                                                                                          For updated information, please visit www.ibef.org
UTTAR PRADESH A RAINBOW LAND - TAJ MAHAL IN AGRA, UTTAR PRADESH - IBEF
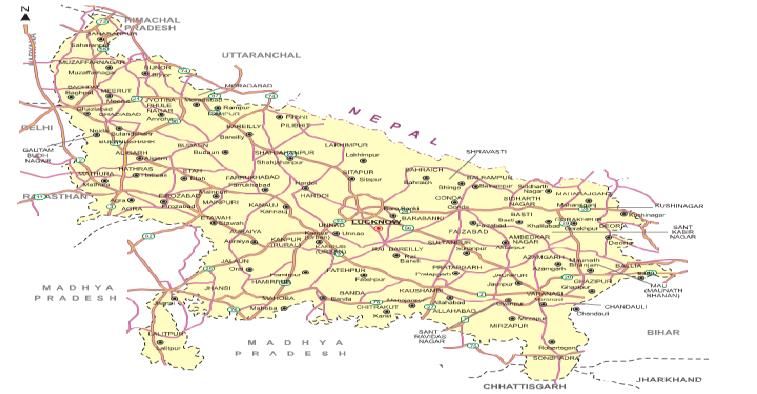
UTTAR PRADESH FACT FILE

                                                                                                  Wheat, rice, pulses, oil seeds and potatoes are the major
                                                                                                   agricultural products. Sugarcane is the most important cash crop
                                                                                                   throughout the state.

                                                                                                 Parameters                                           Uttar Pradesh

                                                                                                 Capital                                                 Lucknow

                                                                                                 Geographical area (lakh sq. km)                         240,928

                                                                                                 Administrative districts (No)                              71
                                                                         Source: Maps of India
                                                                                                 Population density (persons per sq. km)                   828
       Uttar Pradesh shares its borders with Nepal on the north; the Indian
        states of Uttarakhand and Himachal Pradesh towards the northwest;
                                                                                                 Total population (million)                               199.81
        Haryana, Delhi and Rajasthan on the west; Madhya Pradesh on the
        south, Chhattisgarh and Jharkhand to the southeast and Bihar in the
                                                                                                   Male population (million)                              104.48
        east.
       The most commonly spoken language in the state is Hindi. English                           Female population (million)                            95.33
        and Urdu are the other languages used.
       Lucknow, Noida, Agra, Ghaziabad, Allahabad, Varanasi, Kanpur,                            Sex ratio (females per 1,000 males)                       912
        Meerut and Saharanpur are some of the key cities in the state.
                                                                                                 Literacy rate (%)                                        67.68
       The state has three major seasons: hot weather (March to June),
        rainy season (July to September) and cold weather (October to
        February).

    Source: State Horticulture Mission Uttar Pradesh , Census 2011, Central Statistics Office

6         UTTAR PRADESH                                                                                              For updated information, please visit www.ibef.org
UTTAR PRADESH A RAINBOW LAND - TAJ MAHAL IN AGRA, UTTAR PRADESH - IBEF
UTTAR PRADESH IN FIGURES … (1/2)

    Parameter                                     Uttar Pradesh    All states                           Source

    Economy                                         2016-17         2016-17

                                                                                     Directorate of Economics & Statistics of Uttar
       GSDP as a percentage of all states’ GSDP      8.57            100.0
                                                                                           Pradesh, Central Statistics Office

                                                                                     Directorate of Economics & Statistics of Uttar
       GSDP growth rate (%)                          14.30           11.52
                                                                                           Pradesh, Central Statistics Office

                                                                                     Directorate of Economics & Statistics of Uttar
       Per capita GSDP (US$)                          933            1,799
                                                                                           Pradesh, Central Statistics Office

    Physical Infrastructure

       Installed power capacity (MW)               24,431.26       334,146.91      Central Electricity Authority, as of December 2017

                                                                                      Telecom Regulatory Authority of India, as of
       Wireless subscribers (No)                  163,099,654     1,167,435,645
                                                                                                 November 2017

                                                                                      Telecom Regulatory Authority of India, as of
       Internet subscribers (No)                  49,940,000      429,230,000
                                                                                                 September 2017

                                                                                  NHAI & Roads and Building Department, as of June
       National highway length (km)                  8,711           115,435
                                                                                                       2017

       Airports (No)                                   6              125                      Airports Authority of India

7      UTTAR PRADESH                                                              For updated information, please visit www.ibef.org
UTTAR PRADESH IN FIGURES … (2/2)

    Parameter                                                          Uttar Pradesh             All states                                Source

    Social Indicators

       Literacy rate (%)                                                    67.68                   73.0                               Census, 2011

       Birth rate (per 1,000 population)                                     26.2                   20.4                                SRS Bulletin

    Investment

                                                                                    1                                 Department of Industrial Policy & Promotion, April
       Cumulative FDI equity inflows (US$ billion)1                         0.652                 357.345
                                                                                                                                 2000 to September 2017

    Industrial Infrastructure

                                                                                                                       DEA , Ministry of Finance, Government of India,
       Operational PPP projects (No)                                          25                   1,246
                                                                                                                                       November 2017

                                                                                                                       Ministry of Commerce & Industry, Department of
       Exporting SEZs (No)                                                    12                     222
                                                                                                                                 Commerce, December 2017

    Note: PPP: Public-Private Partnership, SEZ: Special Economic Zone, SRS: Sample Registration System,(1)Including Uttarakhand

8      UTTAR PRADESH                                                                                                 For updated information, please visit www.ibef.org
ECONOMIC SNAPSHOT – GSDP

           GSDP of Uttar Pradesh current prices (in US$ billion)                                     GSDP per capita of Uttar Pradesh at current prices (in US$)

         250                            CAGR 4.99%                                                     1000                              CAGR 3.41%
                                                                                                        900

                                                                                                                                                                                  936.88
         200                                                                                            800

                                                                                                                                                                        844.66
                                                                                    206.90

                                                                                                                                                              798.58
                                                                                                                                                    795.51
                                                                                                        700

                                                                                                                   766.14

                                                                                                                                          750.67
                                                                         183.72

                                                                                                                               739.82
                                                              171.08
                                                    167.85
         150                                                                                            600
                                         156.00
                   154.45

                              151.43

                                                                                                        500
         100                                                                                            400
                                                                                                        300
          50                                                                                            200
                                                                                                        100
           0                                                                                              0
                   2011-12

                              2012-13

                                         2013-14

                                                    2014-15

                                                              2015-16

                                                                         2016-17

                                                                                    2017-18

                                                                                                                                                              2015-16
                                                                                                                   2011-12

                                                                                                                               2012-13

                                                                                                                                          2013-14

                                                                                                                                                    2014-15

                                                                                                                                                                        2016-17

                                                                                                                                                                                  2017-18
          At current prices, the GSDP* of Uttar Pradesh was US$ 206.90                                 The state’s per capita GSDP^ in 2017-18 was US$ 936.88
           billion in 2017-18.                                                                           compared with US$ 766.14 in 2011-12.

          The GSDP grew at a CAGR of 4.99% from 2011-12 to 2017-18.                                    Per capita GSDP increased at a CAGR of 3.41% between
                                                                                                         2011-12 and 2017-18.

    Source: Directorate of Economics & Statistics of Uttar Pradesh, Central Statistics Office, GSDP* - Directorate of Economics & Statistics of Uttar Pradesh, Per Capita GSDP^ - calculated
    using GSDP million US$ / Population in million

9       UTTAR PRADESH                                                                                                        For updated information, please visit www.ibef.org
ECONOMIC SNAPSHOT – NSDP

            NSDP of Uttar Pradesh current prices (in US$ billion)                                      NSDP per capita of Uttar Pradesh at current prices (in US$)

          200.00                                                                                        8.2                                CAGR 2.22%
                                            CAGR 4.88%
          180.00                                                                                          8

                                                                                     183.18

                                                                                                                                                                                   8.00
          160.00                                                                                        7.8

                                                                           162.76
          140.00

                                                                 151.37
                                                       147.94
                                                                                                        7.6

                                                                                                                                                             7.67

                                                                                                                                                                        7.67
                                             138

                                                                                                                             7.64
                        137.61

                                  134.97

          120.00
                                                                                                        7.4
          100.00

                                                                                                                                        7.39
                                                                                                        7.2
           80.00
           60.00                                                                                          7

                                                                                                                   7.01

                                                                                                                                                   7.01
           40.00                                                                                        6.8
           20.00                                                                                        6.6
            0.00                                                                                        6.4
                        2011-12

                                  2012-13

                                             2013-14

                                                       2014-15

                                                                 2015-16

                                                                           2016-17

                                                                                     2017-18

                                                                                                                  2011-12

                                                                                                                             2012-13

                                                                                                                                        2013-14

                                                                                                                                                   2014-15

                                                                                                                                                             2015-16

                                                                                                                                                                        2016-17

                                                                                                                                                                                   2017-18
           The NSDP of Uttar Pradesh was US$ 183.94 billion in 2017-18.                                  The state’s per capita NSDP# in 2017-18 was US$ 832.94
                                                                                                           compared with US$ 496.71 in 2011-12.
           The NSDP grew at a CAGR of 10.68% between 2011-12 and
            2017-18.                                                                                      Per capita NSDP increased at a CAGR of 9.01% between
                                                                                                           2011-12 and 2017-18.

     Source: Directorate of Economics & Statistics of Uttar Pradesh, Central Statistics Office, NSDP& - Directorate of Economics & Statistics of Uttar Pradesh, Per Capita NSDP# - Directorate
     of Economics & Statistics of Uttar Pradesh

10       UTTAR PRADESH                                                                                                      For updated information, please visit www.ibef.org
ECONOMIC SNAPSHOT – PERCENTAGE
                    DISTRIBUTION OF GSVA

      In 2016-17, the tertiary sector contributed 47.23% to Uttar Pradesh’s                             Percentage distribution of GSVA
       GSVA at current prices, followed by the primary sector (27.44%) and
       secondary sector (25.34%).
                                                                                             100%
      There has been a shift in the sectoral contribution from secondary to                                  45.51%           CAGR        50.47%
       the primary and tertiary sector. The overall performance of the                       90%
       economy of the state during 2016-17 was encouraging.
                                                                                             80%                              12.35%
      The tertiary sector grew the fastest among the three sectors from
       2011-12 to 2017-18 (12.35% CAGR). The growth was driven by                            70%
       trade, hotels, real estate, finance, insurance, transport,
                                                                                             60%
       communications and other services.
                                                                                             50%              26.66%
      The primary sector expanded at a CAGR of 9.69% between 2011-12
                                                                                                                                           22.79%
       and 2017-18 The growth was driven by agriculture and forestry.                        40%
      The secondary sector expanded at a CAGR of 7.58% between 2011-                                                         7.58%
                                                                                             30%
       12 and 2017-18. This was driven by manufacturing, construction,
                                                                                                              27.83%                       26.73%
       and electricity, gas & water supply.                                                  20%

                                                                                             10%
                                                                                                                               9.69%
                                                                                              0%
                                                                                                              2011-12                      2017-18

                                                                                                    Primary Sector      Secondary Sector   Tertiary Sector

 Source: Directorate of Economics & Statistics of Uttar Pradesh, Central Statistics Office

11      UTTAR PRADESH                                                                                      For updated information, please visit www.ibef.org
ECONOMIC SNAPSHOT – AGRICULTURAL
                   PRODUCTION

      Uttar Pradesh is the largest producer of food grains in India &                         The state government has made a record wheat purchase of 23.20
       accounted for about 17.83% share in the country’s total food grain                       thousand metric tonnes in just 53 days. With this purchase, the state
       output in 2016-17. Food grain production in the state in 2016-17                         government has benefitted and encouraged the farmers by crediting
       stood at 49,144.6 thousand tonnes. Major food grains produced in                         US$ 520.6 million directly to their accounts. Moreover, the state
       the state include rice, wheat, maize, millet, gram, pea & lentils. With                  government has already started 5,000 wheat purchase centres
       overall vegetable production of 26.4 million tonnes in 2016-17, the                      across Uttar Pradesh from April 1, 2017.
       state of Uttar Pradesh was the largest producer of vegetables in
       India.                                                                                   Crop                     Annual production in 2016-17 (‘000 tonnes)

      Uttar Pradesh is the largest producer of wheat in India with a share                       Wheat                                            30057.9
       of about 30.55% in the country’s overall wheat production. Wheat                           Rice                                             12954.7
       production in the state reached 30,057.9 thousand tonnes during
       2016-17.                                                                                   Fruit                                            10353.5
                                                                                                  Vegetables                                      26,407.34
      Production of pulses in the state was recorded at 2,186.1 thousand
       tonnes during 2016-17.                                                                     Flowers                                           118.29

      In April 2017, the state government announced a farm loan waiver                           Aromatic                                           13.53
       scheme in Uttar Pradesh. The scheme was said to cover small and                            Spices                                             227.5
       marginal farmers with debts up to US$1,487, and was expected to
                                                                                                  Honey                                              15.15
       cost the government US$5.40 billion. Of this, US$ 1.1 billion have
       been waived off, as a part of Phase-I.                                                     Onion                                             419.74
                                                                                                  Potato                                          13,870.73
                                                                                                  Tomato                                            823.77
                                                                                                  Pulse                                             2,186.1
                                                                                                  Cereals                                           3,946.0

 Source: Department of Agriculture and Cooperation, Government of India, National Horticulture Board, Aromatic Crops include Rosemary, Vetiver, Lemongrass, Citronella, Geranium,
 Palmarosa, Patchouli, Mint, (1) 2014-15,

12      UTTAR PRADESH                                                                                                For updated information, please visit www.ibef.org
ECONOMIC SNAPSHOT – FDI INFLOWS &
                       INVESTMENTS

      According to the Department of Industrial Policy & Promotion (DIPP),                                     Investment intentions in terms of IEMs filed, LOIs/DILs issued
       cumulative FDI inflows1 in Uttar Pradesh, during April 2000 to
       December 2017, amounted to US$ 652 million.                                                                 7500

                                                                                                                                  7,250
      The tertiary sector of Uttar Pradesh was a major contributor to the
       GSVA of the state, followed by the primary sector and the secondary                                         6000

       sector.
                                                                                                                   4500
      FDI equity      inflows1       in Uttar Pradesh, 2009-10 to 2017-18* (US$
                                              million)                                                             3000

        160

                                                                                                                                                              2,212
                                                                                                                                                2,201

                                                                                                                                                                                                        2,130
                                                                                                                                                                            2,052
                                                                                                                   1500

                                                                                                                                                                                          1,911

                                                                                                                                                                                                                      1,897
        140

                                                                                                                                                                                                                                   161
                                                                                                                                                                                    136
                                      140

                                                                                                                           165            134           158           108                         121           70            15
        120
                                                                                                                       0

                                                                                                                                                                                                                 2017⁽²⁾
                                                                                                                               2011

                                                                                                                                            2012

                                                                                                                                                          2013

                                                                                                                                                                        2014

                                                                                                                                                                                      2015

                                                                                                                                                                                                    2016

                                                                                                                                                                                                                               2018
                           112

        100
                                                                    110

         80                                                                                       82
                                                                              80

         60                                                                                                                                     Number of Investment Intentions

         40                                                                                                                                     Proposed Investments (US$ million)
                 48

                                                31

         20                                                                             8
                                                          25

           0
                                                                                                                  A 50-member delegation from US, representing 26 major
                 2009-10

                           2010-11

                                      2011-12

                                                2012-13

                                                          2013-14

                                                                    2014-15

                                                                              2015-16

                                                                                        2016-17

                                                                                                  2017-18*

                                                                                                                   companies has shown interest in investment opportunities in Uttar
                                                                                                                   Pradesh, giving a boost to employment opportunities in the state.

 Source: Department of Industrial Policy & Promotion,1Including Uttaranchal, 2 Up to                         Source: Ministry of Commerce & Industry, Government of India, IEMs – Industrial
 December 2017, * - data from April-September 2017                                                           Entrepreneur Memoranda, LOIs – Letters of Intent, DILs – Direct Industrial Licences

13      UTTAR PRADESH                                                                                                                      For updated information, please visit www.ibef.org
BUDGET 2017-18

      The Government of Uttar Pradesh presented a US$ 59.7 billion budget for 2017-18. The main objectives of budget include:

        •   To promote participatory development in improving infrastructural facilities & ensure that the benefits reach the farmers, labourers & the poor in
            the state.

        •   To incorporate latest technology in carrying out various programmes and schemes.

        •   To maintain efficiency and transparency in administration.

     Budget highlights -

      A total amount of about US$ 5.58 billion has been allocated for farm loan redemption.

      An amount of about US$ 44.7 million has been allocated for the construction of four metro rail projects.

      New solar power policy to be launched.

      US$ 616.51 million has been allocated for the upkeep of state roads.

      An amount of US$ 155.21 million has been allocated for ‘Swachh Bharat Mission’.

      Recruitment of 33,200 police officials will be done in the state.

 Source: State Budget 2017-18

14      UTTAR PRADESH                                                                                  For updated information, please visit www.ibef.org
PHYSICAL INFRASTRUCTURE – ROADS … (1/2)

      The state is well-connected to its 9 neighbouring states & other
       parts of India through 48 national highways. The length of national
       highways running through the state accounts for about 8.5% of the
       total National Highway (NH) length in India. Yamuna Expressway
       has 6 lanes & is 165-km long with controlled-access which connects
       Greater Noida with Agra.
      As of August 2017, a 96-kilometre long expressway between Delhi
       & Meerut is under construction. NHAI plans to use solid waste from
       Ghazipur landfill to curb pollution.

                                                                                                                                                    Source: Maps of India

      Road type                             Road length (km) as of 2015-16                   No. of projects and cost sanctioned for development of state
                                                                                             roads under Central Road Fund (CRF) & Economic Importance
      National highways*                                      8,711                          and Interstate Connectivity (EI & ISC) (2015-16)

      State highways                                          8,432                                         CRF                                EI & ISC

                                                                                                No of                Cost                                  Cost
                                                                                                                                   No of Projects
      Other district roads                                  169,153                            Projects           (US$ million)                         (US$ million)

      Rural roads                                            86,827                                38                193.12              3                   38.87

 Note: * - as on June 2017
 Source: Maps of India, Ministry of Road Transport & Highways, UPSRTC - Uttar Pradesh State Road Transport Corporation, NHAI,

15      UTTAR PRADESH                                                                                              For updated information, please visit www.ibef.org
PHYSICAL INFRASTRUCTURE – ROADS … (2/2)

      In the 2017-18 budget, the state government allocated US$ 70 million for connecting villages with roads. For the upkeep & widening of existing
       roads of the state, a provision of US$ 92.91 million has been made during 2017-18.
      Moreover, US$ 1.24 billion were allocated under Central Road Fund scheme for development of national highways, rural roads, state roads, etc.
      For construction of a road of 257 km length in 7 districts of the state, on the Indo-Nepal border, the state government also made a provision of
       US$ 39.06 million.
      The state government also allocated US$ 39.27 million for establishing and widening the “Core Road Network” of important roads in the state.
      In November 2016, Government of Uttar Pradesh inaugurated Asia's first cycle highway in Etawah. The highway was built between Etawah and
       Agra, stretching across a length of about 207 km.
      In June 2017, the central government approved road projects worth US$ 1.48 billion for the construction and upgradation of various roads across
       the state. The projects include upgradation of 73 state highways into national highways with a total length of 6,260 km, and many other proposals.
      In March 2018, National Highway Authority of India (NHAI) awarded a road project worth Rs 770.04 crore (US$ 11.95 billion) for upgradation of a
       national highway stretch from two-lane to four-lane in Uttar Pradesh.

     Source: State Budget 2016-17

16       UTTAR PRADESH                                                                              For updated information, please visit www.ibef.org
PHYSICAL INFRASTRUCTURE – RAILWAYS

      Uttar Pradesh has the biggest railway network in the country with a
       railway density of 40 km which is double the rail density of the India
       (20 km) per 1,000 sq. km of area.
      Agriculture, cement, fertilisers, coal and manufacturing are the major
       sectors and industries served by the railways.
      Various parts of the state are catered to by five of the 17 railway
       zones in India. These are Northern Railways, North Eastern
       Railways, East Central Railways, North Central Railways and West
       Central Railways.
      As per state budget 2017-18, an allocation of US$ 44.7 million has
       been done for the development of 4 metro rail projects.
      Moreover, the state government was also planning to extend the
       metro line network from Noida City Sector-32 to Sector-62 and from
       Kalindikunj to Botanical Garden, during 2016-17. The latter section
       of the metro was inaugurated in December 2017.
      Delhi-Ghaziabad-Meerut Rapid Rail Transit Corridor project (RRTC)
       has been cleared by the Board of National Capital region, at an
       estimated cost of US$ 3.34 billion. The corridor would be built
       between Sarai Kale Khan in Delhi & Modipuram in Meerut, where the
       trains can run up to a maximum speed of 180 km per hour, thus
       bringing down the travel time from Delhi to Meerut by 60 minutes. As
       of February 2018, pre-construction work for this project has been
       initiated.
      Under Railway Modernisation Programme, two Uttar Pradesh
       stations i.e. Kanpur Central and Allahabad, are to be revamped.
      In February 2018, Railway Minister Piyush Goyal announced setting                                       Source: Maps of India
       up of coach-refurbishment factory in Bundelkhand.
 Source: Ministry of Railways, State Budget 2016-17

17      UTTAR PRADESH                                                           For updated information, please visit www.ibef.org
PHYSICAL INFRASTRUCTURE – AIRPORTS … (1/2)

       The state has six domestic airports, located at Agra, Allahabad,             Passenger and aircraft movement in Uttar Pradesh in 2017-18*
        Gorakhpur, Kanpur, Lucknow and Varanasi.
       International flights operate from Chaudhary Charan Singh                                            Passenger traffic       Aircraft movement
        International Airport, Lucknow, and Lal Bahadur Shastri Airport,              Airport
                                                                                                                  (nos.)                    (nos.)
        Varanasi. In April 2017-January 2018, Lucknow and Varanasi
        airports handled 5,476 million tonnes and 1,024 million tonnes of             Agra                          8,674                     344
        freight, respectively.

                                                                                      Allahabad                    38,424                     632

                                                                                      Gorakhpur                    86,589                    1,292

                                                                                      Kanpur (Chakeri)              1,898                     50

                                                                                      Lucknow                     3,829,133                 25,580

                                                                                      Varanasi                    1,645,166                 10,829

                                                                                      As of September 2017, the Airports Authority of India (AAI) is
                                                                                       planning to undertake the construction of a integrated passenger
                                                                                       terminal building at Chaudhary Charan Singh International Airport,
                                                                                       Lucknow, for an estimated cost of Rs 1,230 crore (US$ 191.32
                                                                                       million).
                     International airport                                            The AAI is also planning to develop a civil enclave for an estimated
                     Domestic airport                                                  cost of Rs 125.76 crore (US$ 19.56 million), to meet the rising air
                                                                                       travel demand in Allahabad.
                                               Source: Airports Authority of India

     Note: * - data from April-December 2017

18        UTTAR PRADESH                                                                                  For updated information, please visit www.ibef.org
PHYSICAL INFRASTRUCTURE – AIRPORTS … (2/2)

              Passenger traffic, Varanasi and Lucknow (million)                                                                                       Aircraft movement, Varanasi and Lucknow (nos.)

            4.5                                                                                                                                  35,000

              4
                                                                                                                                                 30,000

                                                                                                                            3.96

                                                                                                                                          3.83

                                                                                                                                                                                                                                                                                           29,356

                                                                                                                                                                                                                                                                                                             29,156
            3.5

                                                                                                                                                                                                                                                                         27,317
                                                                                                                                                 25,000

                                                                                                              3.24
              3

            2.5
                                                                                                2.54                                             20,000

                                                                                                                                                                                                                                                       19,749
                                                                                                                                                                                                                                      19,682
                                                                                                                                                                                                    18,550

                                                                                                                                                                                                                     18,395
                                                                                  2.31

              2                                                                                                                                  15,000
                                                      2.02

                                                                    2.02

                                                                                                                                                                                                                                                                                  15,035
                                                                                                                     1.91

                                                                                                                                                                                   14,205
            1.5

                                                                                                                                                                  13,149
                                                                                                                                   1.65

                                                                                                                                                                                                                                                                                                    12,316
                                        1.58

                                                                                                                                                                                                                                                                11,666
                                                                                                                                                 10,000
                                                                                                       1.38

              1
                          1.19

                                                                                                                                                                                                                                               8,801
                                                                                                                                                                                                                              8,040
                                                                                         1.02

                                                                                                                                                                                                             7,654
                                                                                                                                                                                            7,421
                                                                                                                                                  5,000
                                                                           0.83
                                                             0.81

                                                                                                                                                                           5,880
                                               0.75

                                                                                                                                                          5,812
            0.5
                   0.48

                                 0.56

              0                                                                                                                                      0
                                                                             2013-14

                                                                                                                                                                              2010-11

                                                                                                                                                                                                                                                  2014-15
                     2009-10

                                   2010-11

                                                 2011-12

                                                               2012-13

                                                                                           2014-15

                                                                                                         2015-16

                                                                                                                       2016-17

                                                                                                                                                             2009-10

                                                                                                                                                                                               2011-12

                                                                                                                                                                                                                2012-13

                                                                                                                                                                                                                                 2013-14

                                                                                                                                                                                                                                                                    2015-16

                                                                                                                                                                                                                                                                                      2016-17
                                                                                                                                     2017-18*

                                                                                                                                                                                                                                                                                                        2017-18*
                                                           Varanasi               Lucknow                                                                                                                Varanasi                 Lucknow

     Note: * - data from April-December 2017
     Source: Airports Authority of India

19       UTTAR PRADESH                                                                                                                                                      For updated information, please visit www.ibef.org
PHYSICAL INFRASTRUCTURE – POWER … (1/2)

      As of 2017 Sasan ultra mega power project with installed capacity of
       3,960 MW is fully functional.                                                                 Installed power capacity (MW)
      As per state budget 2017-18, the state government is targeting to
       supply power for 24 hours in urban areas & for 18 hours in rural            30,000.0
       areas. Further, it aims to provide 24x7 electricity by October 2018.        25,000.0

                                                                                                                                                                                            24,434
      Noida, Uttar Pradesh-based infrastructure & energy-based

                                                                                                                                                                                  23,662
                                                                                   20,000.0
       conglomerate -- The Jaypee Group, has signed a Memorandum of

                                                                                                                                                                        18,617
                                                                                   15,000.0

                                                                                                                                                              15,087
       Understanding (MoU) with Kazakhstan’s national agency for

                                                                                                                                                    14,375
                                                                                                                      10,458

                                                                                                                                13,054

                                                                                                                                          14,079
                                                                                   10,000.0

                                                                                               9,247

                                                                                                            9,984
       investment & export - KAZNEX INVEST, to collaborate in several               5,000.0
       areas of mutual interest.                                                         -

                                                                                                                                                                                            1
                                                                                               2008-09

                                                                                                                                2011-12
                                                                                                            2009-10

                                                                                                                      2010-11

                                                                                                                                          2012-13

                                                                                                                                                    2013-14

                                                                                                                                                              2014-15

                                                                                                                                                                        2015-16

                                                                                                                                                                                  2016-17

                                                                                                                                                                                            2017-18
      In May 2017, Bharat Heavy Electrical Ltd. (BHEL) commissioned 3
       units of 1980-megawatt coal-based thermal power plants in Bara
       tehsil in Allahabad, Uttar Pradesh within a span of 85 days. The
       project is owned by Prayagraj Power Generation Company Limited          As of March 2017, the holy cities Gorakhpur, Mathura, Ayodhya &
       (PPGCL), a subsidiary company of Jaiprakash Power Ventures Ltd.          Varanasi are slated to get 24 x 7 power supply, with a view to
      Uttar Pradesh Electricity Regulatory Commission has approved             encourage tourism in the cities. With better administration & focus on
       transmission capital expenditure worth Rs 20,000 crore (US$ 3.11         development a file index system has been started, making it
       billion) between FY18-20, an increase of 107% over FY15-17.
                                                                                compulsory to rectify the problem.
      In June 2017, Adani Group announced the commissioning of a
                                                                               The center has given approval to the 1,320MW coal-based super
       50MW solar photovoltaic plant in Mahoba, Uttar Pradesh under the
                                                                                critical Khujra power project at a cost of US$1.44 billion in
       National Solar Mission Scheme with investment of US$ 46.85
                                                                                Bulandshahar district, Uttar Pradesh.
       million.
      As of January 2018, the state government has planned to set up          In February 2018, the Rs 4,150 crore (US$ 641.03 million) worth of
       about 6,000 solar power plants over the coming five years in Uttar       mega power transmission line for the Western Uttar Pradesh Power
       Pradesh in order to meet the government’s target of 10,700 MW of         Transmission Company Ltd (WUPPTCL) has been commissioned by
       clean energy.                                                            the Megha Engineering & Infrastructure Ltd (MEIL). The project will
                                                                                transit 13,220 Mega Volt Amp (MVA) of power and will benefit 10
                                                                                districts in the western Uttar Pradesh region.
 Note: 1As of December 2017
 Source: Central Electricity Authority, State Budget 2016-17

20      UTTAR PRADESH                                                                                    For updated information, please visit www.ibef.org
PHYSICAL INFRASTRUCTURE – POWER … (2/2)

     State-owned power companies

     Uttar Pradesh Rajya Vidyut Utpadan Nigam Limited (UPRVUNL)                                             Power generation (thermal)
     Uttar Pradesh Jal Vidyut Nigam Limited (UPJVNL)                                                        Power generation (hydro)
     Uttar Pradesh Power Corporation Limited (UPPCL)                                                           Power transmission
     Paschimanchal Vidyut Vitran Nigam Limited (PVVNL)                                                          Power distribution
     Purvanchal Vidyut Vitran Nigam Limited (PuVVNL)                                                            Power distribution
     Madhyanchal Vidyut Vitran Nigam Limited (MVVNL)                                                            Power distribution
     Dakshinanchal Vidyut Vitran Nigam Limited (DVVNL)                                                          Power distribution

     Private sector power generating stations

      Prime Mover                                      Developer                  Project name                      Installed capacity (MW)
      Steam                                                               Barkhera Thermal Power Station                       90
                                                                           Khamberkhera Thermal Power
      Steam                                                                                                                    90
                                                                                    Station
                                                     Bajaj Power Co
      Steam                                                               Kundarki Thermal Power Station                       90
      Steam                                                              Maqsoodpur Thermal Power Station                      90
      Steam                                                                Utraula Thermal Power Station                       90
      Steam                                       Lanko Anpara Pow Ltd    Anpara 'C'Thermal Power Station                     1,200
      Steam                                       Rosa Power Supply Co      Rosa Thermal Power Station                        1,200
      Total power generating capacity                                                                                         2,850

 Source: Ministry of Power, Government of India

21      UTTAR PRADESH                                                                         For updated information, please visit www.ibef.org
PHYSICAL INFRASTRUCTURE – TELECOM

      The Uttar Pradesh circle has good telecom infrastructure, with all the                 Telecom Infrastructure (As of November 2017)
       major players providing services in the state. The state has a huge
       postal circle (17,662 post offices) divided into six regions: Allahabad,               Wireless subscribers                                 163,099,654
       Agra, Bareilly, Gorakhpur, Kanpur and Lucknow.

      In January 2017, LAVA invested US$ 8.92 million to setup a new                         Wireline subscribers                                   8,42,582
       assembly plant in Noida, to bolster 4G portfolio. The company is also
                                                                                                                     (1)
       planning two Electronic Manufacturing Clusters (EMC) for southern                      Internet subscribers                                  49,940,000
       and northern markets. For northern market, the EMC will come up
                                                                                                             (2)
       along Yamuna expressway.                                                               Post Offices                                            17,662

      Major telecom companies are being called in for providing
                                                                                              Tele density (in %)                                     69.72
       connectivity as part of the Government of India’s plan of setting up 5
       million smart meters across Uttar Pradesh and Haryana.
                                                                                              Performance Status of Bharat Net Project (As of July 2017)
         Major telecom operators in Uttar Pradesh

         Bharat Sanchar Nigam Limited (BSNL)                                                 No. of GPs in Phase-I^                                  22,514

         Bharti Airtel
                                                                                              Pipe laid (kms)                                         48,556
         Idea Cellular
                                                                                              Cable laid (kms)^                                       51,283
         Vodafone Essar

         Aircel Ltd                                                                          GPs for which cable laid^                               25,985

         Reliance Communications                                                             No. of GPs lit                                          2,785
         Tata Teleservices

 Note: 1 - As of September 2017; 2As of March 2016, ^ - upto November 2017
 Source: Telecom Regulatory Authority of India, Ministry of Communications and Information Technology, India Post

22        UTTAR PRADESH                                                                                             For updated information, please visit www.ibef.org
DEVELOPMENT PROJECTS: URBAN
                    INFRASTRUCTURE

      Under the Jawaharlal Nehru National Urban Renewal Mission (JNNURM), 33 projects costing US$ 862.07 million were sanctioned for various
       cities in Uttar Pradesh, of which six were completed as of 31st March, 2015. Under Sabke Liye Awas Yojna, the Government of Uttar Pradesh
       completed the construction of 3,578 plots/buildings till December 2014. As of March 2015, construction work of 20,868 plots/ buildings was in
       progress. In budget 2017-18, the government allocated US$ 13.31 million for JNNURM.

      Most of these projects are approved for Kanpur, Lucknow, Varanasi, Allahabad and Agra. Some of the key areas of development are water
       supply, solid-waste management, sewerage and drainage/storm water. All the cities are fully covered by a piped water supply system. The state
       government has approved US$ 99.53 million for urban development in the state.

      In order to provide an alternative treatment option for the generated Municipal Solid Waste (MSW), the Kanpur Integrated Waste Processing
       Complex has been developed and includes processing waste to produce compost and refuse derived fuel (RDF).

      For Naya Savera Nagar Vikas Yojna, the state government proposed an investment of US$ 61.1 million during 2016-17. For the development of
       cremation grounds in urban areas, the Government of Uttar Pradesh announced plans to invest US$ 15.27 million, during 2016-17.

      The Government of Uttar Pradesh has proposed an investment of US$ 155.21 million for the Swachch Bharat Mission in State Budget 2017-18.
       For Agra Drinking Water Supply Project, the state government proposed an investment of US$ 45.82 million, during 2016-17.

      For Urban Drinking Water Programme, Urban Transport Development Fund as well as Adarsh Nagar Yojana, amounts of US$ 51.17 million, US$
       7.48 million and US$ 30.55 million, have been proposed by the state government, during 2016-17, respectively

      The state government has approved the allocation of around 450 acres of land to Patanjali Ayurveda, for setting up a food park worth US$ 305.53
       million in Greater Noida, near Yamuna Expressway. The food park will consist of an agro-processing plant, which will serve both domestic as well
       as international markets.

     Source: JNNURM, Ministry of Urban Development, Government of India, State Budget 2016-17

23      UTTAR PRADESH                                                                              For updated information, please visit www.ibef.org
KEY PUBLIC-PRIVATE PARTNERSHIP (PPP)
                     PROJECTS … (1/2)

                                                                                                          Project cost
      Project name                                                                    Sector                                          Stage
                                                                                                         (US$ million)
      Upgradation of Kanpur-Kabrai section under NHDP-IV A                          Transport                58.09                  Operation
      Roadways connects Delhi-Saharanpur-Yamunotri                                  Transport               331.79                 Construction
      International Cricket Stadium (Lucknow) Project                                Tourism                 55.87                 Construction
      Ghaziabad-Aligarh NH-91 Road Project                                          Transport               243.69                  Operation
      Gomti River Front Development Project                                          Tourism                 149.3                     N.A.
      Gorakhpur Bypass NH-28 Road Project                                           Transport               100.77                  Operation
      Greater NOIDA Balia Expressway                                                Transport              4,656.41                Construction
      Inner Ring Road Agra                                                          Transport               182.32                 Construction
      Input Based Urban Franchise Moradabad                                           Energy                 N.A.                  Construction
      Lucknow-Sitapur NH-24 Road Project                                            Transport                69.91                  Operation
      Meerut-Muzaffarnagar NH-58 Road Project                                       Transport                35.70                  Operation
      Modern slaughterhouse at Bareilly                                            Infrastructure           398.37                 Construction
      Modern slaughterhouse at Jhansi                                              Infrastructure           423.58                 Construction
      Road Upgradation (Jhansi-Lalitpur) Project (NS-1/BOT/UP-2)                    Transport                55.10                 Construction
      Road Upgradation (Bareilly-Sitapur) Project                                   Transport               162.66                 Construction
      Road Upgradation (Etawah-Chakeri) Project                                     Transport               303.44                  Operation
      Road Upgradation (Jhansi-Lalitpur) Project (NS-1/BOT/UP-3)                    Transport                42.85                  Operation
      Lucknow-Sitapur NH-24 Road Project                                            Transport                69.91                  Operation

     Source: DEA, Ministry of Finance, Government of India, N.A. – Not Available

24       UTTAR PRADESH                                                                              For updated information, please visit www.ibef.org
KEY PUBLIC-PRIVATE PARTNERSHIP (PPP)
                    PROJECTS … (2/2)

                                                                                                   Project cost
       Project name                                                           Sector                                           Stage
                                                                                                  (US$ million)
       Design, Engineering, Construction, Development, Finance of
                                                                             Transport                80.88                   Operation
       Orai-Bhognipur NH-25 Bhognipur-Barah NH-2, U.P.
       Bypass (Moradabad) Road Project                                       Transport                16.10                   Operation
       2- laning with paved shoulder of a Agra-Aligarh section of NH-93      Transport                38.96                   Operation
       Road upgradation (Lucknow-Raebareli) Project                          Transport                98.70                   Operation
       Road upgradation (Moradabad-Bareilly) (NH-24) Project                 Transport                196.66                  Operation
       Road upgradation (Orai-Bhognipur-Barah) Project                       Transport                80.71                   Operation
       Road upgradation (Rae Bareilly-Jaunpur) Project                       Transport                88.38                   Operation
       Road upgradation (Raebareilly-Allahabad) Project                      Transport                55.30                  Construction
       Solid waste management (Allahabad)                                 Water sanitation             4.72                  Construction
       Solid waste management (Kanpur)                                    Water sanitation             9.33                   Operation
       Solid waste management (Lucknow)                                   Water sanitation             6.66                  Construction
       Solid waste management (Meerut)                                    Water sanitation             3.51                  Construction
       Solid waste management (Varanasi)                                  Water sanitation             7.21                  Construction
       Yamuna Expressway connecting Greater Noida to Agra                    Transport               1,511.63                 Operation
       IT City (Lucknow) Project                                           Infrastructure             232.82                 Construction
       Transmission Line (Mainpuri-Hapur) Project                             Energy                  730.51                 Construction
       Transmission Line (Bara-Mainpuri) Project                              Energy                  800.73                 Construction
       Nirgajini Small Hydel Power Project                                    Energy                  16.83                Pre-construction

     Source: DEA, Ministry of Finance, Government of India

25       UTTAR PRADESH                                                                       For updated information, please visit www.ibef.org
DEVELOPMENT PROJECTS: SEZ … (1/3)

     Operational SEZs in Uttar Pradesh

      Name/Developer                                                          Area                      Primary industry

      Noida Special Economic Zone                                            Noida                         Multi-product

      HCL IT City Lucknow Private Limited                                   Lucknow                          IT/ITeS

      Moradabad Special Economic Zone                                      Moradabad                        Handicrafts

      Moser Baer SEZ                                                     Greater Noida               Non-conventional energy

      HCL Technologies                                                       Noida                           IT/ITeS

      Wipro Limited                                                      Greater Noida                       IT/ITeS

      NIIT Technologies Limited SEZ                                      Greater Noida                       IT/ITeS

      Ansal IT City and Parks Limited                                    Greater Noida                       IT/ITeS

      Seaview Developers Limited                                             Noida                           IT/ITeS

      Artha Infratech Pvt. Ltd.                                          Greater Noida                       IT/ITeS

      Aachvis Softech Pvt Ltd                                                Noida                           IT/ITeS

      Arshiya Northern FTWZ Limited                                    Khurja, Bulandshahr                    FTWZ

     Source: Ministry of Commerce & Industry, Department of Commerce

26      UTTAR PRADESH                                                           For updated information, please visit www.ibef.org
DEVELOPMENT PROJECTS: SEZ … (2/3)

     Some of the Notified SEZs in Uttar Pradesh

      Name/Developer                                                       Area                          Primary industry

      Hari Fertilizers Limited                                          Chandauli,                    Multi-services with FTWZ

      Arshiya Northern FTWZ Limited                                    Bulandshahar                           FTWZ

      Ansal IT City and Parks                                          Greater Noida                          IT/ITeS

      OSE Infrastructure Limited                                          Noida                               IT/ITeS

      NIIT Technologies Limited SEZ                                    Greater Noida                          IT/ITeS

      Unitech Infracon Limited                                         Greater Noida                          IT/ITeS

      Aachvis Softech Private Limited                                     Noida                               IT/ITeS

      Perfect IT SEZ Private Limited                                      Noida                               IT/ITeS

      Unitech Hi-Tech Projects Private Limited                            Noida                               IT/ITeS

      Gallant Infrastructure Private Limited                           Greater Noida                          IT/ITeS

      Jubilant Infracon Private Limited                                   Noida                               IT/ITeS

      Golden Tower Infratech Private Limited                              Noida                               IT/ITeS

      Artha Infratech Private Limited                                  Greater Noida              Electronic hardware and IT/ITeS

     Source: Ministry of Commerce & Industry, Department of Commerce

27      UTTAR PRADESH                                                             For updated information, please visit www.ibef.org
DEVELOPMENT PROJECTS: SEZs … (3/3)

       As of June 2017, Uttar Pradesh had 56 SEZs; of which, twelve were         Revenue from exports and employment generated from SEZs
        operational, nineteen were notified, twenty four were formally                                in Uttar Pradesh
        approved and one was approved in-principle.
                                                                                    120000
       The state government sanctioned 20 SEZs in the state to
        accommodate various sectors such as IT/ITeS, textiles, handicrafts,
        and non-conventional energy. IT/ITeS accounted for the maximum

                                                                                                                                                                                                                       1,05,609
                                                                                    100000
        share of approved SEZs in the state which accounted for 80% of the

                                                                                                                                                                                                96,591
        20 SEZs, followed by electronic products contributing 18% to the
        overall share.                                                               80000

                                                                                                                                                                     83,970
       Tier–II cities are attractive destinations for the IT/ITeS industry and

                                                                                                                                          75,101
        Uttar Pradesh can tap the potential of its cities such as Lucknow that
                                                                                     60000

                                                                                                               63,637
        are in proximity to Noida and NCR. During 2016-17*, the total
        exports from the operating SEZs in the state of Uttar Pradesh stood
        at US$ 1.64 billion.
                                                                                     40000

                                                                                     20000

                                                                                                                                                                                                         3,073
                                                                                             2,262

                                                                                                                                                   2,701

                                                                                                                                                                              1,764

                                                                                                                                                                                                                                  1,664
                                                                                                                        2,089
                                                                                        0

                                                                                                     2011-12

                                                                                                                                2012-13

                                                                                                                                                           2013-14

                                                                                                                                                                                      2014-15

                                                                                                                                                                                                             2015-16

                                                                                                                                                                                                                                      2016-17*
                                                                                               Exports (US$ Million)                                                      Employment (In persons)

     1Note: * - upto September 2016
      Source: Ministry of Commerce and Industry, Government of India

28        UTTAR PRADESH                                                                                         For updated information, please visit www.ibef.org
SOCIAL INFRASTRUCTURE – EDUCATION … (1/3)

       As of June 2017 the state has 72 universities out of which 28 are        Educational infrastructure – 2016-17
        state universities, 9 are deemed universities, 6 central universities,
        and 29 private universities. Uttar Pradesh is one of the few states to    Universities                                                                                                             72
        have successfully implemented the “education for all” policy.                        1
                                                                                  Colleges                                                                                                        4,345
        Consequently, the state has made various investments towards
                                                                                                                  1
        escalation of the standard of education across various levels. The        Medical colleges                                                                                                         27
        state has a good presence of private players in the education sector.                    1
                                                                                  Polytechnics                                                                                                       168
       In the budget for 2017-18, the state government allocated US$ 3.02
                                                                                  Primary schools                                                                                           113,249
        billion for Sarva Shiksha Abhiyan. Allocations of US$ 85.67 million
        and US$ 29.69 have been made for ‘Rashtriya Madhyamik Shiksha             Upper primary schools                                                                                      45,590
        Abhiyan’ and ‘Rashtriya Uchchatar Shiksha Abhiyan’.
                                                                                   Source: University Grants Commission, Medical Council of India, State Budget 2016-17
       The state of Uttar Pradesh is set to have about 5,000 state
        government-run English medium primary schools which are                                   Funds released for primary education
        expected to start functioning from the next academic year.

                                                                                       800
                                                                                       700

                                                                                                                                           774.22

                                                                                                                                                                746.30
                                                                                       600

                                                                                                                 622.89
                                                                                       500
                                                                                       400
                                                                                       300

                                                                                                                                                                                                                123
                                                                                                                                                                           105
                                                                                       200

                                                                                                 219

                                                                                                                           200

                                                                                                                                                                                           242
                                                                                                                                                    174
                                                                                       100
                                                                                         0

                                                                                                       2012-13

                                                                                                                                 2013-14

                                                                                                                                                      2014-15

                                                                                                                                                                                 2015-16

                                                                                                                                                                                                 2016-17

                                                                                                                                                                                                                      2017-18*
                                                                                                                          MDM Scheme                                     SSA Programme
     1Note: As of 2015-16

     Source: Ministry of Human Resource Development

29        UTTAR PRADESH                                                                                               For updated information, please visit www.ibef.org
SOCIAL INFRASTRUCTURE – EDUCATION … (2/3)

      According to the provisional data of Census 2011, Uttar Pradesh has
       a literacy rate of 69.7%; the male literacy rate is 77.28% and the    Literacy Rate in Uttar Pradesh
       female literacy rate is 51.36%.
                                                                              Category                                      Literacy rate (%)
      Major educational institutes in Uttar Pradesh are as follows:

        •   Indian Institute of Technology, Kanpur.                           Total                                               67.68
        •   Indian Institute of Management, Lucknow.
                                                                              Male                                                77.28
        •   Aligarh Muslim University, Aligarh.

        •   Motilal Nehru National Institute of Technology, Allahabad.        Female                                              51.36

        •   Asian Academy of Film and Television, Noida.
                                                                                                                                      Source: Census 2011
        •   Indian Veterinary Research Institute, Izatnagar.

        •   Banaras Hindu University, Varanasi.                              Fund Allocation for Educational Programme – US$ Million

        •   National Institute of Technology (NIT), Allahabad.                Education for all programmes                                1,655.11
      Upcoming national level institute projects include                     UP National Secondary Education Campaign                     242.7
        •   National Automotive Testing and R&D Infrastructure Project        Providing basic facilities in state universities
                                                                                                                                           35.17
        •   National Institute of Pharmaceutical Education and Research       and government degree colleges.

        •   Institute of Hotel Management

        •   All India Institute of Medical Sciences

30      UTTAR PRADESH                                                                            For updated information, please visit www.ibef.org
SOCIAL INFRASTRUCTURE – EDUCATION … (3/3)

     Education Sector Budget 2017-18

                                                                    Basic education

      Mid-Day-Meal                                                                                   US$ 318.92 million

      Sarva Shiksha Abhiyan                                                                           US$ 3.02 billion

                                                               Secondary education

      Rashtriya Madhyamik shiksha Abhiyan                                                            US$ 85.67 million

      For operation of Pt. Deendayal Upadhyay State Model Schools                                     US$ 3.88 million

                                                                    Higher education

      Rashtriya Ucchtar Shiksha Abhiyan                                                              US$ 29.69 million

      Free Wi-Fi across all colleges and universities                                                 US$ 7.76 million

 Source: State Budget 2017-18

31     UTTAR PRADESH                                                                   For updated information, please visit www.ibef.org
SOCIAL INFRASTRUCTURE – HEALTH

      The state has a 3-tier public healthcare infrastructure, comprising
                                                                                          A leading European research & consultancy company, Ecorys,
       primary health centres (PHCs), health units, community health
                                                                                           signed a contract for a World Bank funded project for providing
       centres (CHCs) & sub-centres.
                                                                                           technical assistance to the Uttar Pradesh Health Systems
      As on May 2015, the state had 149 mobile medical units (MMU) to                     Strengthening Project (UPHSSP).
       provide a range of preventive & curative healthcare services. As per
                                                                                          As of February 2017, a professor from Canada has developed a
       the latest available data, the state has 1,992 AYUSH hospitals,
                                                                                           technology for double fortified salt (DFS), which is planned to be
       including 210 Unani hospitals.
                                                                                           distributed in the state of Uttar Pradesh, by March 2017. DFS would
      The state government allocated US$ 1.46 billion in 2017-18, for the                 help in countering the problem of anaemia in the state.
       National Health Mission. Further, work on establishment of dialysis
       centres across 18 divisional district hospitals of the state is under
       progress.
     Health indicators (2016)                                                            Health infrastructure (August 2017)

      Parameter                                                     Uttar Pradesh        Active primary health centers                                3,386

      Government hospital beds per 100,000 population                     30.9           Active sub-centres                                          20,789
               1
      Birth rate                                                          26.2           Active community health centres                              3,787
                   1
      Death rate                                                           6.9           Active district hospitals                                     189
                              2
      Infant mortality rate                                                43            Active sub-district hospitals                                  6

                         Life expectancy at birth (year)                                 Ayurveda hospitals                                           1,774

      Male                                                                62.5           Unani hospitals                                                210

      Female                                                              65.2           Homeopathy hospitals                                            8
 Source: Press Information Bureau, Government of Uttar Pradesh, 1Per thousand persons,
 2Per thousand live births, Uttar Pradesh Budget 2016-17, AYUSH – Ayurveda,Yoga &                                           Source: Ministry of Health and Family Welfare
 Naturopathy, Unani, Siddha and Homoeopathy

32      UTTAR PRADESH                                                                                        For updated information, please visit www.ibef.org
SOCIAL INFRASTRUCTURE – HEALTH … (2/2)

     Medical & Health Sector Budget 2017-18

     For establishment of Primary and Community Health Centre’s in distant villages                    US$ 20.91 million

     For cashless treatment of state government employees and pensioners                               US$ 23.28 million

     For availability of specific medical services in district hospitals                                US$ 19.4 million

     712 more ‘108’ ambulances will be introduced in the state

 Source: State Budget 2016-17

33     UTTAR PRADESH                                                                  For updated information, please visit www.ibef.org
CULTURAL INFRASTRUCTURE

      Cricket and hockey are one of the popular sports in Uttar Pradesh. The state has various sports stadiums and clubs in cities like Noida, Lucknow,
       Kanpur, Allahabad and Agra. Almost, every city has sports infrastructure, which includes stadiums, multi-purpose halls and swimming pools. The
       state has 56 stadiums, 49 multi-purpose halls and 26 swimming pools. Moreover, another 10 stadiums, 17 multi-purpose halls and six swimming
       pools are proposed in the coming years. The state has various promotion committees for escalating the existing sports infrastructure. Taj Mahal
       and Fatehpur Sikri in Agra, Bada Imambara in Lucknow, and Kumbh Mela in Allahabad are the major tourist attractions. Other places of interest
       include Varanasi, Mathura and Sarnath.

      Uttar Pradesh is known for its festivals. Some of the famous festivals of the state are Deepawali, Ram Navami, Kumbha Mela, Lath mar Holi, Taj
       Mahotsav, Buddha Purnima, Vijayadashami, Makar Sankranti, Vasant Panchami, Ayudha Puja, Ganga Mahotsava, Janmashtami, Sardhana
       Christian Fair, Maha Shivaratri, Mahavir Jayanti, Moharram, Bārah Wafāṭ, Eid, Bakreed, Chhath puja, Lucknow Mahotsav, Kabob and Hanuman
       Jayanti.

      As per State Budget 2016-17, an allocation of US$ 763.82 thousand has been made by the state government for the establishment of a sports
       college in Ballia. As of February 2018, the college is under construction.

 Source: Department of Sports, Government of Uttar Pradesh, State Budget, 2016-17

34      UTTAR PRADESH                                                                              For updated information, please visit www.ibef.org
INDUSTRIAL INFRASTRUCTURE … (1/2)

      Uttar Pradesh, a state with an access to a robust industrial                               Prime Minister's Employment Generation Programme (PMEGP)
       infrastructure, has 15 industrial areas, 12 specialised parks, 4 growth                    Schemes in Uttar Pradesh (1)
       centres & Industrial Infrastructure Development Centres (IIDC). As of
       June 2017, the state had 19 notified special economic zones (SEZs).                                          Margin              Margin
                                                                                                                                        money                          Estimated
                                                                                                                    money                                 Number of
       Out of the notified SEZs, 15 are for the IT/ITeS sector.                                                                                                       employment
                                                                                                                   subsidy             subsidy
                                                                                                    Year                                                   projects    generated
      The state has proposed 40 IT/ITeS parks (apart from IT SEZs), 2                                            released –           utilised –
                                                                                                                                                           assisted     (No. of
       biotech zones & a knowledge park. The development of integrated                                               US$                  US$                          persons)
       agro/food processing zones has been proposed at Hapur, about 54                                              million             million
       km from Delhi. Various Integrated logistics hubs (free-trade                                                                             (1)
                                                                                                  2014-15             21.96             28.1               4,891        48,604
       warehousing zones) have been expected to be developed in
       collaboration amidst Mitsui (Japan), Mineral & Mining Trading
                                                                                                                                                (2)
       Corporation & IL&FS, .                                                                     2015-16             19.83             3.61               4,365        43,059

      Under central government scheme, various integrated industrial
                                                                                                                                                                             3
       development centres have been developed so as to boost the                                 2016-17             29.03              22.15             4,074       21,611
       development of micro small & medium industries at Etah, Banthar
       (Unnao), Kosi Kotwan (Mathura), Kursi Road (Barabanki) & various                           2017-18             17.32                 -              5,625        45,000
       other places. The Greater Noida Phase-II has 19% land reserved for
       industrial use

      With a 57% share in the total length of 1,839 km, the state is the
       major beneficiary of the Eastern Dedicated Freight Corridor project.
       The Infrastructure & Industrial Investment Policy was launched by
       the state government to boost industrial infrastructure in the state.

      In February 2018, Essel group announced MoUs worth Rs 180 bn
       (US$ 2.78 billion) to boost state infrastructure by manufacturing E-
       buses.
 Source: Ministry of Micro, Small and Medium Enterprises, (1) Including unutilised funds from previous years, (2)As of July 2015, (3) Upto October 2016

35      UTTAR PRADESH                                                                                                     For updated information, please visit www.ibef.org
INDUSTRIAL INFRASTRUCTURE … (2/2)

     Industrial parks

      Infrastructure (type)                                                                  Location                                      Area (acres)

      Growth centres                                                                       Bijoli, Jhansi                                       385

      Growth centres                                                                       Shajahanpur                                          311

      Growth centres                                                                         Dibiyapur                                          246

      Growth centres                                                                          Jainpur                                           331

      Agro parks                                                                            Barabanki                                           180

      Agro parks                                                                             Varanasi                                           261

      Apparel parks                                                                         Tronica City                                        146

      Textile and hosiery parks                                                               Kanpur                                            173

      Apparel Park, Tronica City                                                            Ghaziabad                                           146

      Leather technology parks                                                           Banthar, Unnao                                         233

      Export promotion industrial parks                                                   Greater Noida                                         200

      Export promotion industrial parks                                                Shastripuram, Agra                                       102
                                                                             13,000 sq ft, of which 9,296 sq ft of area is being utilised by 15 units. The park is fully
      Software Technology Parks of India (STPI)
                                                                                                                    operational.

 Source: UP State Industrial Development Corporation, ENVIS Centre: Uttar Pradesh

36      UTTAR PRADESH                                                                                          For updated information, please visit www.ibef.org
AMRUT AND SMART CITIES … (1/3)

      As of June 2017, 61 cities in the state are covered under Atal
       Mission for Rejuvenation and Urban Transformation (AMRUT).

      US$ 7.24 million was allocated to the state of Uttar Pradesh by the
       Ministry of Urban Development for administrative and office
       expenses (A&OE) in order to prepare the Service Level Improvement
       Plan (SLIP)/Capacity Building (CB).

      The Ministry of Urban Development, Government of India allocated
       US$ 652.2 million as to the state under AMRUT guidelines, out of
       which, US$ 57.7 million were released in 2017.

     Classification of AMRUT cities in Uttar Pradesh on the basis of
     population

     AMRUT cities with population less
                                                              53
     than 1 million

     AMRUT cities with population
                                                              7
     in the range of 1 – 10 million

     AMRUT cities with population
                                                              0
     greater than 10 million

     Total number of AMRUT cities                             60

 Source: Ministry of Urban Development, Government of India

37      UTTAR PRADESH                                                        For updated information, please visit www.ibef.org
AMRUT AND SMART CITIES … (2/3)

     Cities/towns in Uttar Pradesh covered under AMRUT

          City/town                        City/town                 City/town          City/town                    City/town

           Lucknow                          Firozabad                 Etawah            Faizabad                     Mainpuri

            Kanpur                             Loni           Mirzapur-cum-Vindhyacha    Budaun                        Etah

         Ghaziabad                            Jhansi               Bulandshahar          Shamli                        Basti

             Agra                        Muzaffarnagar               Sambhal              Ballia                    Chandausi

            Meerut                           Mathura                  Amroha             Banda                        Gonda

           Varanasi                      Shahjahanpur                Fatehpur           Lakhimpur                    Akbarpur

          Allahabad                         Sultanpur               Rae Bareli           Hathras                      Khurja

            Bareilly                      Shikohabad                   Orai              Lalitpur                    Azamgarh

         Moradabad                           Rampur                  Bahraich           Modinagar                    Ghazipur

            Aligarh                    Maunath Bhanjan               Jaunpur             Deoria                     Mughalsarai

         Saharanpur              Farrukhabad-cum-Fatehgarh            Unnao              Pilibhit                     Baraut

          Gorakhpur                           Hapur                   Sitapur            Hardoi                       Kasganj

 Source: Ministry of Urban Development, Government of India

38     UTTAR PRADESH                                                                     For updated information, please visit www.ibef.org
AMRUT AND SMART CITIES … (3/3)

      Under the Smart Cities Mission launched by the central government
       in Uttar Pradesh, 13 cities were proposed to be developed as smart
                                                                                                Saharanpur
       cities. In August 2015, 12 cities were shortlisted to be developed as
       smart cities, namely - Kanpur, Lucknow, Allahabad, Jhansi,
                                                                                                        Rampur
       Moradabad, Aligarh, Saharanpur, Bareilly, Varanasi, Ghaziabad
       Agra and Rampur. Out of these, 7 cities have been included by the                       Moradabad
       central government, until the third round of the mission. In the fourth     Ghaziabad                   Bareilly
       round released in January 2018, 3 new cities have been chosen,                             Aligarh
       namely, Bareilly, Moradabad and Saharanpur.

                                                                                           Agra
     Smart cities in Uttar Pradesh                                                                                     Lucknow
                                                                                                              Kanpur
      Cities             Population             Cities          Population
                                                                                                     Jhansi
                                                                                                                                      Varanasi
                                                                                                                          Allahabad
      Kanpur               2,765,348            Moradabad         887,871

      Allahabad            1,112,544            Aligarh           874,408
                                                                                 Smart cities under DMIC Phase I
      Lucknow              2,817,105            Saharanpur        705,478
                                                                                                                                          Project
                                                                                  Name of the                             Area (sq.
      Jhansi                505,693             Bareilly          903,668                                     State                       master
                                                                                  node                                      km)
                                                                                                                                         planners
      Agra                 1,585,704            Ghaziabad        1,648,643
                                                                                 Dadri-Noida-                                           Halcrow, UK,
                                                                                 Ghaziabad              Uttar Pradesh       200         Synovate and
      Varanasi             1,198,491            Rampur            325,313        Investment Region                                      Knight Frank

 Source: Ministry of Urban Development, Government of India

39      UTTAR PRADESH                                                                              For updated information, please visit www.ibef.org
KEY INDUSTRIES

      Abundant resources, government initiatives, suitable infrastructure       Key Industries in Uttar Pradesh
       and climate in the state provide boost to the investments in sectors         IT                                  Food processing
       such as IT, agro-based and food processing, light engineering goods,
       sports goods, textiles, leather-based, tourism and biotechnology. The        Agro processing                     Leather-based industry
       Uttar Pradesh State Industrial Development Corporation (UPSIDC)                                                
                                                                                    Tourism                              Sports goods
       and the Department of Infrastructure and Industrial Development are
       responsible for the development of industrial infrastructure in the          Mineral based industries            Biotechnology
       state. The state government has set up Udyog Bandhu to facilitate                                              
                                                                                    Textiles                             Handloom and handicrafts
       investment in industrial and service sectors. The organisation has a
       three-tier structure with presence at district, divisional and state
                                                                                 Funds released under National Handloom Development
       levels.
                                                                                 Programme (2016-17) – US$ ‘000
      State government has been promoting the development of several
       special economic zones across the state, such as IT and ITeS,
       electronic hardware and software, handicrafts and agro-based              Integrated Handloom Development Scheme (IHDS)                 1414.54
       industries. Twenty four investment regions were identified under the
       Delhi-Mumbai Industrial Corridor (DMIC) Project. Out of these             Handloom Marketing Assistance (HMA) (2014-15)                 253.82
       projects, Dadri-Noida-Ghaziabad industrial area and Meerut –
       Muzaffarpur industrial areas are located in Uttar Pradesh. Under the      Funds released under handicraft schemes (2016-17) – US$
       DMIC Projects, the government is developing an integrated industrial      million
       township in Greater Noida, which is expected to be set up by the end
       of 2019.
                                                                                 Ambedkar Hastshilp Yojana (AHVY)                                   176

                                                                                 Design                                                            724.06

                                                                                 Human Resource Development Scheme                                 261.06

                                                                                 Total                                                         1,161.12
     Source: UP State Industrial Development Corporation, Ministry of Textiles

40      UTTAR PRADESH                                                                                  For updated information, please visit www.ibef.org
KEY INDUSTRIES – MANUFACTURING … (1/2)

      The major factors driving the growth in the manufacturing sector is
                                                                                            Status of MSMEs in Uttar Pradesh
       the availability of robust infrastructure, extensive road network, large
       pool of talent, and various investments and incentives offered by the
       state government.                                                                                        Margin            Margin
                                                                                                                                  money                   Estimated
                                                                                                                money                          No. of
      Uttar Pradesh is leading among Indian states in terms of the                                                                                      employment
                                                                                                               subsidy           subsidy
       availability of MSME enterprises.                                                        Year                                          projects    generated
                                                                                                              released –         utilised –
                                                                                                                                              assisted     (No. of
                                                                                                                 US$                US$                   persons)
                                                                                                                million           million

                                                                                                2013-14             21.06         23.08        4,354       44,044

                                                                                                2014-15             20.23         25.87        4,891       48,604

                                                                                                2015-16             26.79         22.09        4,365       43,059

                                                                                                        (1)
                                                                                                2016-17             19.83          9.63        1,904       18,796

                                                                                            Some of the key players

                                                                                                Alstom T&D India Ltd

                                                                                                Atlas Cycles Ltd

                                                                                                Bharat Heavy Electricals Ltd

                                                                                                Eveready Industries India Ltd
 Note: MSME: Micro Small and Medium Enterprises, (1) Up to June 2016
 Source: UP Government Annual Plan 2014-15, Ministry of Micro, Small and Medium Enterprises, News Articles

41      UTTAR PRADESH                                                                                               For updated information, please visit www.ibef.org
KEY INDUSTRIES – MANUFACTURING … (2/2)

      GE T&D India Ltd      With more than 100 years of presence in India, Alstom T&D India (formerly Areva T&D India Ltd) is a leading
                             player in the power transmission business with a product portfolio ranging from medium voltage to extra high
                             voltage (765 kV) categories for the utility, industry and infrastructure markets. The company employs more than
                             3,515 people and has eight manufacturing units. Alstom has a predominant presence in all stages of the power
                             supply chain, with a wide range of products that include power transformers, circuit breakers, gas insulated
                             switchgears, instrument transformers, protection relays and power system automation equipments. In 2016, the
                             company changed its name to GE T&D India Ltd after its acquisition by GE. The company earned total revenue of
                             US$ 139.69 million during Q2 FY18.
       Atlas Cycles Ltd
                            Atlas Cycles, established in 1951, is one of the leading bicycle manufacturers in the country. The company
                             manufactures bicycles of all types, from those for children to mountain bikes, suspension bikes, city bikes and
                             sports bikes. Atlas Cycles exports bicycles to several countries in North America, Central and South America and
                             Africa. The company earned total income of US$ 26.02 million during Q2 FY18. Atlas Cycles has a manufacturing
                             unit in Sahibabad, which also houses a modern paint application unit.

       Bharat Heavy         Incorporated in 1964, Bharat Heavy Electricals Limited (BHEL) is a central government undertaking. It is the
       Electricals Ltd       largest engineering and manufacturing enterprise in India in the power and industrial machinery segment. The
                             company had total income of around US$ 1.05 billion in Q2 FY18. BHEL manufactures power transformers and
                             insulators in its plants in Uttar Pradesh at Jagdishpur and Jhansi.

     Eveready Industries    Eveready Industries India Ltd is one of the country’s leading producers of batteries (carbon zinc, alkaline and
          India Ltd          rechargeable). The company also produces compact fluorescent lamps and packet tea. Eveready recorded total
                             income of US$ 57.74 million during Q3 FY18. The company has manufacturing units in Lucknow and Noida in
                             Uttar Pradesh.

42    UTTAR PRADESH                                                                      For updated information, please visit www.ibef.org
You can also read