BIMSTEC-Japan Cooperation in Trade and Investment: A Sri Lankan Perspective - Janaka Wijayasiri and Deshal De Mel - Ips.lk
←
→
Page content transcription
If your browser does not render page correctly, please read the page content below

Discussion Paper #38

BIMSTEC-Japan Cooperation
  in Trade and Investment:
  A Sri Lankan Perspective

           Janaka Wijayasiri and
              Deshal De Mel

    Centre for Studies in International Relations
             and Development (CSIRD)
                      Kolkata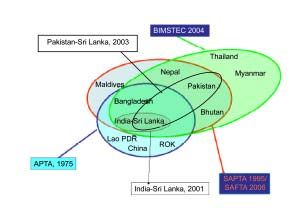
BIMSTEC-Japan Cooperation
          in Trade and Investment:
          A Sri Lankan Perspective

                      Janaka Wijayasiri
                            and
                        Deshal De Mel

               CSIRD Discussion Paper #38

                              May 2008

           Centre for Studies in International
              Relations and Development
     P 534 Raja Basanta Roy Road, Kolkata 700029, India
                   Phone: +91-33-2463 7322
                    Fax: + 91-33-2463 7322
            Email: membersecretary@csird.org.in;
                     csirdindia@yahoo.co.in
     Websites: http://www.csird.org.in; http://www.bntt.org

CSIRD Discussion Papers are published to disseminate research findings and
to attract comments. The feedback and comments may be directed to the
author(s) directly. Views expressed by the author(s) are his / her personal,
and in no way reflect the views of CSIRD. CSIRD Discussion Papers are
available at www.csird.org.in
Contents
1. Introduction .............................................................................. 1
2. Background of BIMSTEC ....................................................... 4
2.1 Negotiations in Trade and Investments to date ............. 5
2.2 Intra-BIMSTEC Trade .................................................. 8
3. Importance of BIMSTEC to Sri Lanka .................................. 13
3.1 Trade ........................................................................... 13
3.2 Investment ................................................................... 20
3.3 Services ....................................................................... 20
4. Importance of Japan to BIMSTEC and Sri Lanka ................. 22
4.1 Importance of Japan to Sri Lanka in terms ................. 23
of trade in Goods
4.2 Importance of Japan to Sri Lanka in terms ................. 25
of investments
4.3 Importance of Japan to Sri Lanka as a Donor ............. 27
5. What are the Potential Opportunities and Challenges ........... 29
of Enlarging BIMSTEC to Include Japan for Sri Lanka?
5.1 Opportunities and Challenges for Increased ............... 29
Trade in Goods
5.2 Opportunities and Challenges for Trade in Services .. 36
5.3 Opportunities and Challenges for ............................... 39
Increasing Investments
5.4 Other Challenges ......................................................... 40
5.5 Issues that Require Attention in BIMSTEC ................ 43
6. Conclusions ............................................................................ 47BIMSTEC-Japan Cooperation in Trade and
Investment: A Sri Lankan Perspective
Janaka Wijayasiri and Deshal De Mel*
Abstract: BIMSTEC is one of many regional trade agreements that Sri
Lanka has signed up to. At present the potential for benefits from the
BIMSTEC agreement are limited to increased access to markets of
Thailand’s and Myanmar since Sri Lanka already has access to India,
Bangladesh, Bhutan, and Nepal through ILFTA and SAFTA,
respectively. In this context, the addition of a new country, Japan to
BIMSTEC would increase the potential benefits to Sri Lanka.
Furthermore, Sri Lanka continues to seek increased diversification of
export markets which are at present concentrated in Europe and the
USA.
However, a lot of work needs to be done to get BIMSTEC’s own
house in order before countries like Japan would even be interested in
getting involved in such an agreement. Low trade coverage, high
transactions costs to trade and existing FTAs are cases in point. Japan
could however play an important role in boosting economic cooperation
in BIMSTEC if it were to join. For instance, building transport
infrastructure will be crucial to promote regional cooperation and in
this regard Japanese ODA can play a significant role. Furthermore, the
entry of Japan would boost competition in the region and act as a catalyst
for upgrading quality and standards of production and service supply
in the region. These potential dynamic benefits will make it worthwhile
giving strong consideration to Japan’s entry into BIMSTEC whilst being
aware of the challenges that have been outlined in this paper.
1. Introduction
Regional trade arrangements (RTAs) have become a significant feature
of the world trading system in recent times. Almost all countries in
the world are now members of at least one or more RTAs while some
are party to 20 or more. According to the WTO, the number of such
* Authors are with Institute of Policy Studies of Sri Lanka, Colombo. An earlier version
of the paper was presented at the 3rd International Conference on ‘Building a New
BIMSTEC-Japan Comprehensive Economic Cooperation’ held on 3 December, 2007,
at Tokyo, Japan. The authors can be contacted at janaka@ips.lk or deshal@ips.lk.
View expressed by the authors are their personal. Usual disclaimers apply.2
arrangements has surged since the early 1990s and there are some
386 RTAs notified as of end December 2006 with still more in the
pipeline. By 2010, it is estimated that close to 400 RTAs will be in
existence. The growth in the number of RTAs and their increasing
importance is reflected by the steady rise in share of preferential trade
– trade between members of RTAs account for about one-third of
total global trade at present. While RTAs have sprung up across the
world, Asia-Pacific and Latin American regions have witnessed the
largest proliferation of arrangements in recent times. The sluggish
progress under the current Doha Round launched in 2001, which was
expected to have been concluded in 2005, is likely to fuel the surge in
RTAs already witnessed, as countries scramble to partner up with
more countries. In fact, a number of countries announced their intention
of signing up RTAs with their major trading partners following the
suspension of the Doha Round in July 2006. In this context, regional
cooperation arrangement amongst the five countries in South and
South East Asia (Bangladesh, Bhutan, India, Myanmar, Nepal, Sri
Lanka and Thailand) or BIMSTEC (Bay of Bengal Initiative of Multi-
Sectoral and Technical Cooperation) is one of the more recent RTAs
in the Asian region, which aims to develop into a free trade
arrangement by concentrating on activities facilitating trade, increase
investments and promote technical cooperation.
The BIMSTEC region has a combined GDP of US$ 940 bn and
contains 1.3 bn people accounting for one-fifth of the world’s
population. The membership is a mixed bag of countries, each one at
different stages of development - 3 of the members are non-LDCs
(India, Sri Lanka and Thailand) and 4 are LDCs (Bangladesh, Bhutan,
Myanmar and Nepal). India is the largest economy in the region and
alone accounts for more than 80 percent of the population and more
than 70 percent of the GDP of the BIMSTEC. The complementarities
among the countries were considered to be substantial given the
different levels of economic development and resource endowments
of the economies thus providing a basis for regional cooperation. In
addition, all the countries in the grouping share a common border
with one another providing an important condition for regional
economic cooperation. However, intra-regional trade has been low3
and the full potential of intra-regional trade was considered untapped
due to tariff and non-tariff barriers, poor communication and transport
links, lack of information, among others (RIS, 2004). Intra-regional
investments too have been small despite the potential for market and
efficiency seeking investments in the region. It was thought that
regional cooperation in this context could help exploit these dormant
potentials existing in the sub-grouping.
Japan is the second largest economy in the world after the US
and accounts for a substantial share of global trade in goods and
services, ranking amongst the top 5 exporters and importers of goods
and services in the world. Japan is also a significant investor in the
world, including Asia, and it is also amongst the largest donors in the
world – both bilaterally and multilaterally. Japan maintains very good
relationship with BIMSTEC countries and is already an important
partner of countries in the BIMSTEC region in main respects – as a
trading partner, investors, as well as a donor. In this light, studies
done by CSIRD indicates that Japan can be considered a valuable
partner for the BIMSTEC given its potential to contribute to the
promotion of economic cooperation in the region. Japan too has the
potential to gain from partnering with the BIMSTEC by assisting in
the economic expansion of the country through diversifying of its
economic partners and securing its access to enlarged market in the
South and South East region of Asia. While Japan has historically
been less inclined to sign RTAs, with the slow progress seen under
the Doha round, it is increasingly seeking market access abroad by
negotiating trade arrangements or Economic Partnership Agreements
(EPAs) with a number of countries in the region and beyond.1 Japan’s
new found urgency for EPAs has been prompted in part by neighboring
countries like South Korea and China negotiating with Japan’s major
trading partners. While the BIMSTEC as a region has not been
approached to form an EPA with Japan, the two largest partners in
the region, India and Thailand have struck or in the process of
negotiating a deal with Japan.
This paper would look at the opportunities and challenges to
BIMSTEC-Japan cooperation in trade and investment from the4 perspective of Sri Lanka, which is one of the founding members of the region grouping. The remainder of the paper is organized as follows. First, the paper would provide a brief overview of the BIMSTEC and the negotiations on trade and investment undertaken by the region to date and the current status of trade within the region. Second, the paper would briefly outline the importance of the region to Sri Lanka (in terms of trade, services and investment) before highlighting the importance of Japan for the BIMSTEC region more specifically to Sri Lanka as a trading partner and investor. Fourth, it would present the potential benefits and challenges of widening the BIMSTEC to include Japan. 2. Background of BIMSTEC Realizing the importance of economic cooperation between South and South East Asia, Thailand took the initiative in 1994 to explore the possibility of formation of a sub-regional group. With the backing of the Asian Development Bank (ADB) and UN-ESCAP, the four- nation RTA – Bangladesh-India-Sri Lanka-Thailand Economic Co- operation (BIST-EC) was created on 6 June 1997 in Bangkok, Thailand, thereby bridging India’s Look East policy with Thailand’s “Look West” Policy. Initially Myanmar was only an observer, but was soon granted full membership at a special ministerial meeting held in Bangkok on 22 December 1997. Consequently, the name of the organization was changed to BIMSTEC to reflect the members of the grouping. Nepal was granted observer status by the second Ministerial Meeting in Dhaka, Bangladesh in December 1998. Nepal and Bhutan soon joined as full members in 2003. During the first BIMSTEC Summit in Bangkok on 31 July 2004, the organization was renamed as Bay of Bengal Initiative for Multi-sectoral Technical and Economic Cooperation (BIMSTEC). This sub-regional group not only aims at increasing intra-regional trade among the members but also covers other areas of cooperation. Initially, only 6 priority sectors were decided upon, namely Trade and Investment, Technology, Energy, Transport and Communication, Tourism, and Fisheries. The list was expanded after the first BIMSTEC Summit in 2004 to encompass 13 sectors: Agriculture, Cultural Co-
5

operation, Environment and Disaster Management, Public Health,
People-to-People Contact, Poverty Alleviation and Counter-Terrorism
and Transnational Crimes.

2.1 Negotiations in Trade and Investments to date
The first meeting of Commerce and Economic Ministers of the
Grouping, held in August 1998 mooted the idea that BIMSTEC should
aim to develop into a free trade arrangement and that it should focus
on activities that facilitate trade, investment, and promote economic
cooperation. Subsequently BIMSTEC decided to establish an FTA
and a framework agreement for BIMSTEC Free Trade Area (FTA)
was signed by all countries except Bangladesh in February 2004
(Bangladesh later acceded to the Agreement on 25 June 2004 through
a protocol). The Agreement envisions liberalization, promotion and
facilitation of trade in goods and services, investments, as well as
broader economic cooperation2. Thus, BIMSTEC goes beyond trade
in goods unlike other trade arrangements in the region such as SAPTA/
SAFTA, APTA to name a few

      Trade Negotiating Committee (TNC) was set up with the task of
negotiating the programme3. Negotiations on trade in goods were to
be completed by the end of 2005 for implementation in July 2006
after which the TNC would proceed to negotiate on trade in services
and investment (to have been concluded by 2007). So far, there have
been 15 TNC meetings but countries have failed so far to iron out
contentious issues like rules of origin, and negative lists, which form
the building blocks of an FTA. The focus of negotiations has been on
the trade in goods while discussions on services and investments are
still at the very initial stages. Having missed the deadline of end 2005
for completion of trade negotiations and the July 2006 deadline for
the implementation of the agreement, TNC was mandated to finalize
the agreement before the Second Summit meeting in February in India
2007, which was subsequently called off. The 16th TNC meeting was
held in September 2007 in Dhaka, Bangladesh.

     The BIMSTEC member countries have agreed to take a Negative
List approach to tariff liberalization, which means a certain percentage
of products that are considered sensitive would not be subjected to
6
tariff cuts. The Negative List of a country is expected to be set at 20
percent of total tariff lines at 6- digit level, which means roughly about
1050 item of Sri Lanka’s tariff lines would not be subjected to
liberalization – this is slightly smaller than the number of items under
SAFTA (1065) or ILFTA (1200 odd items). At the last TNC meeting,
member countries exchanged their revised Negative List. Despite the
agreement to limit the Negative List to 20 percent of the total tariff
lines, Thailand has expressed its desire to bring down the Negative
List further to 10 percent and also suggested the application of the
concept of reciprocity in determination of the Negative List of
products. Other member countries including Sri Lanka have not viewed
this favourably.
With regard to Rules of Origin, member countries are yet to agree
on a figure for domestic value addition under the General Rule.
Thailand favours a 30 percent value addition in addition to the Change
of Tariff Heading (CTH) at 4 digit level for all the member countries
while rest of the countries including Sri Lanka have suggested to
extend 30 percent value addition for LDCs and 35 percent for non-
LDCs (NLDCs) in conjunction with CTH to take into account different
stages of development of member countries. Member countries have
also expressed the need to provide derogations from the general Rules
of Origin by applying specific rules of origin for some 1200 products
(Sri Lanka has suggested some 295 products for consideration).
Specific rules of origin vary from product to product and are less
stringent than the general rules of origin in terms of value addition
and CTH (i.e.) at 6 digit level rather than at 4 digit level.
Liberalisation of goods would be done in two approaches: ‘fast
track’ (FT) liberalization between 2007 and 2011 and ‘normal track’
liberalization (NT) between 2007 and 2017 depending upon the level
of development of member countries. Under the fast track approach,
tariffs on identified products would be brought reduced or eliminated
by India, Thailand and Sri Lanka (the non-LDCs) for LDCs within
one year (2007) from the date of implementation and LDCs would do
the same for NLDCs in five years (2011). Thus, Sri Lanka would
have access to products listed under the Fast Track in other NLDCs
by 2009 and LDCs by 2011. In turn, Sri Lanka would provide accessTable 1: Tariff Reduction Schedules under Fast Track (FT) and Normal Track (NT)
Countries For NLDCs For LDCs
Fast Track IN, SL, TH 1 July 2006 - 30 June 2009 1 July 2006 - 30 June 2007
BG, BH, MY, NP 1 July 2006 - 30 June 2011 1 July 2006 - 30 June 2009
Normal Track IN, SL, TH 1 July 2007 – 30 June 2012 1 July 2007 - 30 June 2010
BG, BH, MY, NP 1 July 2007 - 30 June 2017 1 July 2007 - 30 June 2015
Source: Framework Agreement on the BIMST-EC FTA, BIMSTEC Chamber of Commerce, Sri Lanka (www.bimstec.org)
78
to its products under Fast Track to other NLDCs by 2009 and LDCs
by 2007. The number of products to be liberalized under the fast track
would be limited to 10 percent of total tariff lines at 6-digit level,
which would amount to about 514 products in the case of Sri Lanka.
Under the normal track approach, there would be a reduction and
elimination of tariffs over a period of 11 years from the date of
implementation. Products identified for tariff elimination would be
made duty free and those identified for tariff reduction would be
brought down to 0-5 percent range by NLDCs for LDCs in four years
(2010) while LDCs would do so for NLDCs in eleven years (2017).
In the case of Sri Lanka, it would have access to products listed under
Normal Track in NLDCs by 2012 and LDCs by 2017. In turn, Sri
Lanka would provide access to its products under Normal Track for
NLDCs by 2012 and 2010 for LDCs. The list of products to be
liberalized under the normal track would account for 70 percent of
total tariff lines at 6 digit level. In the case of Sri Lanka, of the 70
percent tariff lines, 55 percent of which would be eliminated and
another 15 percent would be reduced to 0-5 percent range.
2.2 Intra-BIMSTEC Trade
Tables 2-4 show intra-regional exports, imports and total trade amongst
the BIMSTEC countries. Intra-regional trade within BIMSTEC has
increased over time (from around 2.5 percent in the 1990s) but still
remains very low at 4.64 percent like in the case of SAARC. But for
countries in the region other than India and Thailand, the region is an
important destination of exports and source of imports. Intraregional
trade was most significant for Nepal (accounting for 50 percent of its
total trade), followed by Myanmar (41 percent), Sri Lanka (17 percent)
and Bangladesh (11 percent). Intra-BIMSTEC trade was least
important for Thailand (2.6 percent), and India (3.6 percent).
Nepal’s strong trade links in BIMSTEC is in reality due to its
high dependency on trade with its neighbour, India – accounting for
54 percent of its total exports and 48 percent of its imports. In fact,
India is the largest market for Nepalese exports and source of imports
to Nepal. Similarly, BIMSTEC region accounted for 57 percent ofTable 2:Intra-regional Exports as % of Country’s Total Exports, 2005
Exports to>> BG BH IN JP MY NP SL TH BIMSTEC
Bangladesh 0.04 1.40 0.76 0.02 0.04 0.10 0.17 1.77
Bhutan
India 1.67 0.10 2.43 0.11 0.85 1.91 1.04 5.68
Japan 0.09 0.00 0.59 0.02 0.00 0.06 3.79 4.55
Mayanmar 0.79 12.15 5.00 0.00 0.10 43.91 56.96
Nepal 0.42 53.74 1.46 0.00 0.02 0.18 54.36
Sri Lanka 0.25 8.87 2.27 0.04 0.01 0.43 9.59
Thailand 0.36 1.38 13.66 0.64 0.02 0.18 2.58
BIMSTEC 0.91 0.04 1.32 7.84 0.36 0.38 0.91 1.18 5.11
Note: Blanks indicate lack of data. There was no data available on Bhutan.
Source: IMF DOTS 2006
Table 3: Intra-regional Imports as % of Country’s Total Imports, 2005
Imports from>> BG BH IN JP MY NP SL TH BIMSTEC
Bangladesh 0.08 14.09 4.12 0.23 0.02 0.07 2.28 16.77
Bhutan
India 0.08 0.06 2.58 0.37 0.28 0.39 0.83 2.00
Japan 0.03 0.00 0.62 0.04 0.00 0.03 3.02 3.75
Myanmar 0.05 3.41 2.83 0.00 0.08 21.79 25.32
Nepal 0.20 47.58 1.10 0.00 0.02 1.44 49.25
Sri Lanka 0.10 20.71 4.28 0.05 0.00 1.90 22.75
Thailand 0.02 1.08 22.05 1.51 0.00 0.01 2.63
9
BIMSTEC 0.05 0.03 2.17 10.89 0.82 0.13 0.20 0.86 4.26
Source: IMF DOTS 200610
Table 4:Intra-regional (Trade as % of Country’s Total Trade), 2005
TradeWith>> Bangladesh Bhutan India Japan Myanmar Nepal Sri Lanka Thailand BIMSTEC
Bangladesh 0.06 9.26 2.84 0.15 0.03 0.08 1.48 11.07
Bhutan
India 0.75 0.08 2.51 0.26 0.52 1.03 0.92 3.55
Japan 0.06 0.00 0.61 0.03 0.00 0.05 3.44 4.18
Myanmar 0.43 7.86 3.93 0.00 0.09 33.04 41.42
Nepal 0.26 49.10 1.19 0.00 0.02 1.13 50.51
Sri Lanka 0.16 15.75 3.44 0.04 0.00 1.28 17.24
Thailand 0.18 1.23 18.00 1.09 0.01 0.09 2.60
BIMSTEC 0.44 0.04 1.79 9.53 0.62 0.24 0.52 1.00 4.64
Source: IMF DOTS 200611
Myanmar’s total exports and 25 percent of its imports. In the case of
Myanmar, Thailand was of overwhelming importance (responsible
for 44 percent of the country’s exports and 22 percent of imports)
followed by India. For Sri Lanka, 9 percent of its total exports go to
Chart 1: Spaghetti Bowl of RTAs involving Sri Lanka
Source: http://www.unescap.org/tid/projects/postdoha_s2mia.pdf
India and 21 percent of its imports come from India, which is the
most important trading partner within BIMSTEC. India happens to
be Sri Lanka’s third largest export market and the single largest source
of imports from the world. While the region is not an important export
market for Bangladesh, it is an important source of imports for the
country due to India, from which Bangladesh imported 14 percent of
its import requirements. None of the BIMSTEC countries were
particularly important export destinations or sources of imports for
either Thailand or India.
Currently countries in the region are members of a number of
other regional agreements such as SAPTA/SAFTA, ILFTA, BA/
APTA to name a few, which provide access to each others markets
under preferential terms. In the case of Sri Lanka, it already has market
access to India, its largest trading partner in the region through the
Indo-Lanka Free Trade Agreement and South Asian Preferential TradeTable 5: Salient features of RTAs Signed by Sri Lanka
12
Agreement Countries # of items in % of negative Schedule Rules of Services/
the SL list items Origin Investment
negative list in SL list
APTA Bangladesh, Positive list.SL has given Signed: 1975 Domestic VA: 45% Not
China, India, for 427 items.concession Commenced: 1976 Cumulative VA: 60% covered
Laos, Korea, For LDCs favourable
Sri Lanka 10 percentage points
BIMSTEC Bangladesh, 1050 20% Signed: February 2004 Domestic VA: 35% with HS 4 To be
Bhutan, India, Commenced:Pending CTH For LDCs domestic covered
Myanmar, Nepal, VA 30% withHS 4 CTH
Sri Lanka, Thailand
ILFTA India, 1220 23% Signed: December 1998. Domestic VA: 35% Covered
Sri Lanka Commenced: March 2000 SL CTH: HS 4 digit under
will complete implementation CEPA
in 2008.India completed
implementation in 2003.
PSFTA Pakistan, 697 13.3% Signed: August 2002. Domestic VA 35% Not
Sri Lanka Commenced: June 2005 SL CTH: HS 6 digit covered but
will complete implementation considering
in 2010 Pakistan will complete
implementation in 2008.
SAFTA Bangladesh, 1065 20.4% Commenced: January 2006. Domestic VA: 40% Cumulative Not
Bhutan, India, Non LDCs will complete VA: 50% provided that 20% covered but
Maldives, implementation in 2012.SL domestic VA.For Sri Lanka: considering
Nepal, will complete implementation favourable 5 percentage points
Pakistan, in 2013 LDCs will complete For LDCs: favourable 10 per-
Sri Lanka, implementation in 2015. centage point CTH:HS 4 digit
Sources: Department of Commerce, Govt. of India; SAARC Secretariat; UNESCAP; Department of Commerce, Sri Lanka.13 Arrangement, which was replaced by South Asian Free Trade Agreement and Bangkok Agreement, which was subsequently re- named as Asian Preferential Trade Arrangement (Chart 1). Similarly, Sri Lanka has access to Bangladesh under SAPTA/SAFTA and APTA while Sri Lanka has access to both Bhutan and Nepal under SAPTA/ SAFTA. Sri Lanka does not have preferential market access either to Thailand or Myanmar other than through proposed FTA with BIMSTEC which is under negotiations4 . In this context, Sri Lanka’s interest in the BIMSTEC lies squarely with accessing markets in Thailand and Myanmar. Table 5 outlines the salient features of these trade agreements. 3. Importance of BIMSTEC to Sri Lanka 3.1 Trade Overall exports of Sri Lanka to BIMSTEC countries have been increasing over the past 5 years (Chart 2), growing at a rate of 33 percent, since 2002 and reached a value of US$ 549 million in 2006. This amounted to 8 percent of Sri Lanka’s total exports. The growth in exports to the BIMSTEC region has come mainly from the increase in exports to India as a result of the Indo-Lanka FTA, which came into effect in 2001. Of the BIMSTEC countries, India is Sri Lanka’s most important trading partner accounting for 89 percent of exports to the region. India is Sri Lanka’s third largest export market (7 percent of Sri Lanka’s total exports in 2006) after the US and UK with a share of 31 and 13percent, respectively. Sri Lanka’s exports to India have risen sharply since 2003 as a result of implementation of the third and final phase of the Indo- Lanka FTA (ILFTA) – which enabled Sri Lanka to export goods to India on duty-free terms except items on India’s Negative List. As it can be seen from Chart 2, Sri Lanka’s exports to BIMSTEC countries closely mirror its exports to India because none of the other BIMSTEC countries are significant export markets. After India, the second most important export destination amongst BIMSTEC countries is Thailand, buying 7 percent of Sri Lanka’s exports, while Bangladesh has a share of 3 percent. Exports to Bhutan, Nepal and Myanmar have been negligible and stagnant over the observed period and these three countries together account for less than 1 percent of Sri Lanka’s total exports.5
14

                                        Chart 2: Exports from Sri Lanka to
                                          BIMSTEC & Japan (2002-06)
                                600                                                                100

                                                                                                   90
                                500
  Total Exports (USD Million)

                                                                                                   80

                                                                                                   70
                                400
                                                                                                   60

                                300                                                                50

                                                                                                   40
                                200
                                                                                                   30

                                                                                                   20
                                100
                                                                                                   10

                                 0                                                                 0
                                      2002         2003        2004            2005         2006
                                                               Year
                                         Bhutan     India    Japan        BIMSTEC     Bangladesh
                                         Myanmar     Nepal     Thailand
Note: Bhutan, Bangladesh, Myanmar, Nepal right axis

     In terms of composition of exports to the BIMSTEC region (Table
6), Sri Lanka’s exports to individual countries were concentrated in
one or two sectors with base metals and fats and oils accounting for
about 40 percent of exports to the region , largely due to India. But
there was variation of exports products from Sri Lanka to countries in
the region: Bangladesh (chemical products, textiles and textile articles),
Myanmar (plastic and rubber, vegetable products), Nepal (pulp of
wood), Thailand (precious stones).

     In terms of importance of BIMSTEC as a destination for exports
of Sri Lankan products, none of the countries other than India were of
much importance. India accounted for a substantial share of exports
from Sri Lanka in the following sectors: fats and oils, base metals,
articles of stones, cement, chemicals, wood and articles, machinery
and electrical equipment (Table 7).

    Sri Lanka’s imports from BIMSTEC tell a similar story to its
exports to the region with India’s dominating imports of the country
from the region. The average growth in imports from the region has
Table 6: Sri Lanka’s Exports (section-wise) to BIMSTEC, 2006
Description BG IN MY NP TH ALL
I Live animals and products 3.24 0.14 0.00 0.00 1.68 0.35
II Vegetable products 4.24 7.20 37.45 1.80 0.60 6.62
III Fats and oils 4.82 22.11 0.00 0.00 0.00 19.87
IV Prepared foodstuffs, beverages, etc. 0.84 1.78 7.98 2.29 0.19 1.64
V Mineral products 0.41 0.47 0.00 0.00 0.11 0.44
VI Chemical products 30.46 4.91 8.92 0.33 1.76 5.53
VII Plastics and rubber 10.47 4.78 44.22 0.17 2.28 4.78
VIII Hides and skins, leather, etc. 0.00 0.46 0.00 0.00 0.00 0.41
IX Wood and articles of wood 0.03 2.06 0.00 0.56 0.00 1.84
X Pulp of wood, paper, books, etc. 1.02 3.68 0.15 90.35 0.52 3.94
XI Textiles and textile articles 34.91 3.94 0.00 2.20 5.05 5.05
XII Footwear, headgear, umbrellas, etc. 0.00 0.02 0.00 0.00 0.10 0.03
XIII Articles of stone, cement, etc. 0.52 5.50 0.00 0.02 0.19 4.93
XIV Precious stones, etc. 0.00 0.41 0.00 0.00 84.42 6.12
XV Base metals and products 2.87 29.57 1.12 2.24 0.56 26.50
XVI Machinery and electrical equipment 2.15 10.46 0.16 0.00 1.10 9.47
XVII Transport equipment 0.46 0.78 0.00 0.00 0.00 0.71
XVIII Optical and precision instruments 0.00 0.10 0.00 0.00 1.36 0.18
XIX Arms and ammunition 0.00 0.00 0.00 0.00 0.00 0.00
XX Miscellaneous manufact. Articles 3.57 1.62 0.00 0.03 0.07 1.57
XXI Works of art, etc. 0.00 0.00 0.00 0.00 0.00 0.00
XXII Petroleum Products 0.00 0.00 0.00 0.00 0.00 0.00
Total 100.00 100.00 100.00 100.00 100.00 100.00
15
Value (USS mn) 18.68 489.49 0.11 3.57 37.46 549.32
Source: Compiled from Sri Lanka Customs DatabaseTable 7: Sri Lanka’s Exports to BIMSTEC (% of HS Sector), 2006
Description Bangladesh Bhutan India Myanmar Nepal Thailand ALL
16
I Live animals and products 0.42 0.00 0.47 0.00 0.00 0.44 1.34
II Vegetable products 0.07 0.00 3.09 0.00 0.01 0.02 3.19
III Fats and oils 0.81 0.00 97.79 0.00 0.00 0.00 98.61
IV Prepared foodstuffs, beverages, etc. 0.11 0.00 6.16 0.01 0.06 0.05 6.39
V Mineral products 0.29 0.00 8.84 0.00 0.00 0.16 9.30
VI Chemical products 8.09 0.00 34.17 0.01 0.02 0.94 43.23
VII Plastics and rubber 0.33 0.00 3.89 0.01 0.00 0.14 4.37
VIII Hides and skins, leather, etc. 0.00 0.00 11.04 0.00 0.00 0.00 11.04
IX Wood and articles of wood 0.02 0.00 32.42 0.00 0.06 0.00 32.50
X Pulp of wood, paper, books, etc. 0.44 0.00 41.14 0.00 7.35 0.44 49.38
XI Textiles and textile articles 0.21 0.00 0.62 0.00 0.00 0.06 0.89
XII Footwear, headgear, umbrellas, etc. 0.00 0.00 0.24 0.00 0.00 0.09 0.34
XIII Articles of stone, cement, etc. 0.13 0.00 36.75 0.00 0.00 0.10 36.98
XIV Precious stones, etc. 0.00 0.00 0.49 0.00 0.00 7.72 8.21
XV Base metals and products 0.32 0.00 86.78 0.00 0.05 0.13 87.28
XVI Machinery and electrical equipment 0.18 0.00 23.36 0.00 0.00 0.19 23.73
XVII Transport equipment 0.06 0.00 2.76 0.00 0.00 0.00 2.82
XVIII Optical and precision instruments 0.00 0.00 1.98 0.00 0.00 2.02 4.01
XIX Arms and ammunition 0.00 0.00 0.00 0.00 0.00 0.00 0.00
XX Miscellaneous manufact. Articles 0.80 0.00 9.57 0.00 0.00 0.03 10.40
XXI Works of art, etc. 0.00 0.00 14.53 0.00 0.00 0.00 14.53
XXII Petroleum Products 0.00 0.00 0.00 0.00 0.00 0.00 0.00
Total 0.28 0.00 7.23 0.00 0.05 0.55 8.12
Source: Compiled from Sri Lanka Customs Database17
been high (20 percent over the past 5 years) resulting in imports of
US$ 2019 million in 2006, which accounted for 21 percent of Sri
Lanka’s total imports (Chart 3). Of this, just over US$ 1800 million
were from India, accounting for 89 percent of imports from the
BIMSTEC and 18 percent of Sri Lanka’s total imports from the world.
India was Sri Lanka’s largest source of imports in 2006 (followed by
Singapore, China, and Hong Kong). Similar to the trend in exports,
the increase in imports from BIMSTEC has been in parallel to the
increase in imports from India as a result of the ILFTA. In 2006, Sri
Lanka imported 9 times more from India than Thailand, the second
highest source of imports from region with a share of 10 percent while
imports from the remaining BIMSTEC members (Bangladesh, Bhutan,
Myanmar and Nepal) were negligible (accounting for less than 1
percent of Sri Lanka’s total imports in 2006).
In terms of composition of imports from the region, the main
imports from the region are: mineral products (23 percent), transport
equipment (17 percent), textile and textile articles (11 percent) and
Chart 3: Imports from BIMSTEC & Japan to Sri Lanka
(2002-06)
2000 100
1800 90
1600 80
Total Exports (USD Million)
1400 70
1200 60
1000 50
800 40
600 30
400 20
200 10
0 0
2002 2003 2004 2005 2006
Year
Bhutan India Japan Thailand BIMSTEC
Bangladesh Myanmar Nepal
Note: Bhutan, Thailand, Bangladesh, Myanmar, Nepal right axis.Table 8: Sri Lanka’s Imports (section-wise) from BIMSTEC (% of Country Imports) 2006
18
Description Bangladesh India Myanmar Nepal Thailand ALL
I Live animals and products 0.00 0.55 0.00 0.00 11.41 1.64
II Vegetable products 0.84 5.50 26.68 0.00 1.85 5.15
III Fats and oils 0.00 0.45 0.00 0.00 0.02 0.41
IV Prepared foodstuffs, beverages, etc. 0.00 4.24 0.00 0.00 9.13 4.70
V Mineral products 0.00 24.47 0.00 0.00 8.42 22.73
VI Chemical products 11.57 8.89 0.00 0.00 8.30 8.83
VII Plastics and rubber 2.84 3.83 0.00 14.90 10.68 4.51
VIII Hides and skins, leather, etc. 0.58 0.06 0.00 37.85 0.16 0.07
IX Wood and articles of wood 0.09 0.28 17.22 0.00 1.23 0.40
X Pulp of wood, paper, books, etc. 0.61 3.43 0.00 2.29 1.39 3.21
XI Textiles and textile articles 48.83 9.62 0.00 0.00 24.42 11.25
XII Footwear, headgear, umbrellas, etc. 0.83 0.11 0.00 0.00 0.48 0.15
XIII Articles of stone, cement, etc. 0.14 0.91 0.40 0.00 2.26 1.04
XIV Precious stones, etc. 0.00 0.16 54.76 0.00 1.00 0.32
XV Base metals and products 30.50 11.58 0.75 0.00 4.20 10.90
XVI Machinery and electrical equipment 2.77 6.26 0.08 0.00 11.68 6.78
XVII Transport equipment 0.28 18.77 0.00 27.63 2.53 17.03
XVIII Optical and precision instruments 0.04 0.59 0.10 0.00 0.14 0.54
XIX Arms and ammunition 0.00 0.00 0.00 0.00 0.00 0.00
XX Miscellaneous manufact. Articles 0.08 0.30 0.00 17.33 0.65 0.33
XXI Works of art, etc. 0.00 0.00 0.00 0.00 0.05 0.01
XXII Baggage office, parcel post and re-imports 0.00 0.00 0.00 0.00 0.00 0.00
Total 100.00 100.00 100.00 100.00 100.00 100.00
Value (US$ mn) 7.99 1805.20 2.84 0.07 202.96 2016.22
Source: Compiled from Sri Lanka Customs DatabaseTable 9: Sri Lankan Imports from BIMSTEC (% of Sector) 2006
Description Bangladesh India Myanmar Nepal Thailand ALL
I Live animals and products 0.00 4.12 0.00 0.00 9.57 13.68
II Vegetable products 0.02 24.28 0.18 0.00 0.92 25.40
III Fats and oils 0.00 5.11 0.00 0.00 0.03 5.14
IV Prepared foodstuffs, beverages, etc. 0.00 18.50 0.00 0.00 4.48 22.99
V Mineral products 0.00 24.13 0.00 0.00 0.93 25.07
VI Chemical products 0.13 23.18 0.00 0.00 2.43 25.75
VII Plastics and rubber 0.05 14.37 0.00 0.00 4.51 18.92
VIII Hides and skins, leather, etc. 0.26 6.23 0.00 0.15 1.75 8.38
IX Wood and articles of wood 0.02 10.48 1.01 0.00 5.19 16.70
X Pulp of wood, paper, books, etc. 0.02 21.80 0.00 0.00 0.99 22.81
XI Textiles and textile articles 0.24 10.50 0.00 0.00 2.99 13.73
XII Footwear, headgear, umbrellas, etc. 0.43 12.23 0.00 0.00 6.19 18.84
XIII Articles of stone, cement, etc. 0.01 21.20 0.01 0.00 5.93 27.16
XIV Precious stones, etc. 0.00 0.91 0.48 0.00 0.63 2.02
XV Base metals and products 0.33 27.93 0.00 0.00 1.14 29.39
XVI Machinery and electrical equipment 0.02 7.89 0.00 0.00 1.66 9.56
XVII Transport equipment 0.00 45.95 0.00 0.00 0.70 46.65
XVIII Optical and precision instruments 0.00 11.16 0.00 0.00 0.30 11.47
XIX Arms and ammunition 0.00 0.00 0.00 0.00 0.00 0.00
XX Miscellaneous manufact. Articles 0.01 5.28 0.00 0.01 1.28 6.58
XXI Works of art, etc. 0.00 5.94 0.00 0.00 71.15 77.08
XXII Baggage office, parcel post and re-imports 0.00 0.01 0.00 0.00 0.00 0.01
Total 0.08 18.47 0.03 0.00 2.08 20.65
19
Source: Compiled from Sri Lanka Customs Database20 base metals (10.9 percent), which are mainly sourced from India. BIMSTEC as a region is also an important source of imports to Sri Lanka in a number of sectors: works or art, transport equipment, base metals, articles of stone, mineral products, chemical products, vegetable products, prepared foodstuff, to name a few. 3.2 Investment In terms of investments from the BIMSTEC region, India figures prominently as a foreign direct investor in Sri Lanka, followed by Thailand and to a small extent Bangladesh. India is now amongst the top 5 foreign investors in the country with a total number of 164 Indian projects as the end of 2006 according to the BOI with an estimated valued of Rs. 32.7bn (under section 17 of the BOI Law)6, accounting for about 7 percent of total investments to date. From India’s point of view, Sri Lanka has been an important destination for FDI in South Asia, with over 50 percent of Indian joint venture and wholly-owned subsidiaries in the South Asian region located in Sri Lanka. The inflow of direct investment from India began back in the 1980s with the liberalization of the Sri Lankan economy while the signing of the ILFTA gave a further push for Indian companies to invest in Sri Lanka with a view to export to the Indian market. Most of the Indian investments to date have gone into the services sector (66 percent), followed by food products (11 percent) and fabricated metal products (10). Comparatively, Thailand’s investments in Sri Lanka are much smaller with 5 projects to date, namely in jewellery and lapidary, services and apparel, which together amounted to less than Rs.200mn. 3.3 Services Sri Lanka’s trade in services with BIMSTEC partners is due to its trade in services with India. There is also services trade, but to a lesser extent with Thailand and Bangladesh. The major services that Sri Lanka is engaged with other BIMSTEC countries are in: port related activities, air transport, tourism, health and education services and retail. Most of this trade in services occurs through foreign direct investments (Mode 4), with Indian investment in Sri Lankan service sectors dominating the sectors.
21

     India has invested Rs. 17.3 billion in Sri Lanka through 54 service
related investments (under the Board of Investment Acts 16 and 17)
as of 2006. Thailand was involved in two service related investments
during the same period, with a realized investment of Rs. 23.3 million.
Some of the major Indian investments in Sri Lanka includes: Apollo
hospital (health services), Indian Oil Corporation (retail), Taj hotels
(tourism), Jet Airways, Sahara and Indian airlines (air services) and
ICICI Bank (financial services). It is clear that trade in services is
very significant between Sri Lanka and India through FDI, and this is
likely to be further enhanced as the two countries complete a
Comprehensive Economic Partnership Agreement (CEPA) which
includes an agreement on services aimed at removing barriers to trade
in services.

     Besides FDI, Sri Lanka engages in trade in services with India
across other modes, particularly Mode 2 (consumption abroad). Large
proportion of Colombo’s port activity is related to transshipment
between the East and West coast of India (this includes Bangladeshi
vessels). In the year 2006, income from transportation services
increased by 11.6 percent, led to a great extent by increased volume
of transshipment cargo handling, which grew by 37 percent reflecting
India’s expanding international trade and economic growth7. Given
India’s continued economic expansion it is likely that this trade will
continue to grow despite competition from Southern Indian ports in
Kerala and Tamil Nadu.

     Air services between the countries continue to grow while the
national carrier, Sri Lankan airlines has secured a number of
destinations in India during 2006. In fact, today Sri Lanka has the
greatest access to destinations in India with 95 flights a week. As
trade in services between the two countries continues to expand in
volume and scope it is likely that passenger air travel between the
countries will grow simultaneously. Related to air services, tourism
is a major source of trade in services in Sri Lanka, and India dominates
tourist arrivals to Sri Lanka. In 2006, out of 559,603 tourist arrivals
to the island, 128,370 were from India, the largest amount from a
single country. Sri Lanka and Thailand have also an open skies policy
between the two countries, allowing Sri Lankan airlines to travel
22
between Colombo and certain other cities (Beijing and Hong Kong
for instance) via Bangkok, picking up passengers in the latter. The
final significant source of trade in services between India and Sri Lanka
is in Mode 2, namely education services as many Sri Lankan students
travel to India for higher education as there are few vacancies available
in Sri Lankan universities.
Given that Sri Lanka is on the brink of a services agreement with
India, its major services partner in BIMSTEC, and trade in services is
likely to be included in the SAFTA (including Bangladesh, Nepal
and Bhutan), a services agreement in BIMSTEC diminishes in value
from a Sri Lankan perspective. However, if a meaningful agreement
can be reached it is entirely possible that new, previously unexploited
trading opportunities could be opened within the region, making other
BIMSTEC countries more relevant trading partners to Sri Lanka. An
example of such an instance was the export of Vanaspathi from Sri
Lanka following the FTA with India. In the past Vanaspathi was not
a major export item from Sri Lanka. However, the FTA provided a
new opportunity which resulted in increased exports from Sri Lanka
to India and increased investment into Sri Lanka, both from India and
third countries. Today Vanaspathi is the major export item from Sri
Lanka to India.
4. Importance of Japan to BIMSTEC and Sri Lanka
The importance of Japan as a trading partner varies across countries
in the region but on the whole Japan is an important trading partner,
both as a source of imports and destination of exports, particularly for
Thailand. In fact, Japan is the second largest export market after the
US and largest single source of imports to the country, accounting for
22 percent of Thailand’s total imports. Much of the trade between the
BIMSTEC region and Japan is largely due to substantial bilateral trade
between Japan and Thailand and to a lesser degree India. In terms of
imports to region, Thailand accounts for about 85 percent of total
imports of BIMSTEC from Japan, followed by India, accounting for
11 percent. The same is true of exports from the region to Japan –
Thailand accounts for 84 percent of total exports of the region to
Japan while India has a share of 13 percent. From Japan’s point of23
view, the BIMSTEC region accounts for less than 5 percent of its
exports and imports, with Thailand accounting for much of this trade.
Japan is also an important source of foreign direct investment.
Asia was the third largest recipient of Japanese FDI with a share of 18
percent, after the US and Europe. Presence of Japanese investments
have been particularly strong in ASEAN (especially amongst the NIEs
of the region), which received 9.2 of percent of total Japanese
investments, while China (including Hong Kong) has emerged as
attractive destination in Asia. While Japanese direct investments
contributed substantially to establishing closer relations between Japan
and East Asia, the role played by Japan in the BIMSTEC region other
than Thailand, has so far been negligible. BIMSTEC as a region has
only managed to receive 2.6 percent of cumulative Japanese FDI over
the last 5 years. Furthermore, the major part of this FDI to region has
gone to Thailand, which accounts for over 82 percent of Japanese
FDI to the group followed by India with a share of 16 percent. South
Asia as a region and Myanmar have not been major recipient of
Japanese FDI, compared to ASEAN due to their slower economic
growth, poor infrastructure, extensive government restrictions, labour
problems which deterred Japanese investments into these countries
in the past. But, the situation is fast changing with the opening of
these economies and Japan is increasingly looking at India as a new
investment destination.
Bilateral services trade between BIMSTEC and Japan appears to
be quite low at the moment. In the case of Thailand and India for
which there is data on trade in services with Japan, both countries
have a very small share of Japan’s total commercial services (about 3
percent between the two countries) and the value of commercial
services has been stagnant.
4.1 Importance of Japan to Sri Lanka in terms of trade in
Goods
Japan’s ranking as an export market of Sri Lanka has fallen over
the years from the third largest export market in 2000 to ninth
place with the emergence of other trading partners. A similar24
Table 10: Top 10 Exports to Japan, 2006
HS Description US$ mn % of totalexports
09 Coffee, tea, mate & spices 35.73 21.84
03 Fish and crustaceans, molluscs and other aquatic invertebrates 30.07 18.38
40 Rubber & articles thereof 18.00 11.00
71 Natural or cultured pearls, precious or semi-precious stones, etc. 11.00 6.73
90 Optical, photographic, etc. instruments and accessories 7.14 4.36
62 Articles of apparel and clothing accessories, not knitted or crocheted 6.85 4.19
61 Articles of apparel and clothing accessories, knitted or crocheted 6.77 4.14
53 Other vegetable textile fibres; paper yarn and woven fabrics 6.35 3.88
96 Miscellaneous manufactured articles 6.02 3.68
85 Electrical machinery and equipment and parts thereof 5.73 3.50
Source: Sri Lanka Customs Database25
picture appears on the import side with its ranking as a source of
imports dropping to sixth place from being the single largest import
country in 2000. Exports to Japan has been stagnant over the past
five years (recording a negative growth rate for the whole period
2002-05) and reached a value of US$ 162 mn in 2006 (Chart 2).
On the other hand, imports from Japan have performed better
(growing at a rate of 6 percent) with Sri Lanka importing goods
valued at US$ 450mn in 2006 (Chart 3), further widening the trade
deficit in favour of Japan (from US$ 217.46mn recorded in 2002
to US$ 286.8mn by 2006). Japan currently accounts for 2.4 percent
of Sri Lanka’s export and 4.6 percent of the country’s imports. Its
share in Sri Lanka trade has almost halved since 2000 – Japan
accounted for 4.1 and 8.8 percent of Sri Lanka’s exports and
imports respectively in 2000.
Main export sectors to Japan include vegetable products (tea),
live animals and products (fish and crustaceans), rubber and
articles, textiles and textile articles, precious/semi-precious stones,
which together accounted for more than half of Sri Lanka’s total
exports to Japan (Table 11). In fact, Japan is an important export
market for tea, and accounts for about one-fifth of Sri Lanka’s
total tea exports to the world. The main imports from Japan are:
transport equipment (vehicles), which alone account for half of
Sri Lanka’s imports from Japan, followed by machinery and
mechanical appliances. In fact, import of transport equipment from
Japan accounts for about one-fourth of Sri Lanka’s total imports
of the item from the world.
4.2 Importance of Japan to Sri Lanka in terms of
investments
The beginning of Japanese foreign direct investments in Sri Lanka
dates back to 1972, with the establishment of a joint venture between
Noritake of Japan and the Ceylon Ceramics Corporation. Since then
Japanese investments in Sri Lanka have contributed to the industrial
development of the country, namely in sectors such as electronics,
ceramics, engineering and metal-based sectors. Currently, Japan ranks
amongst the top 10 investors in Sri Lanka, with a cumulative value of26
Table 11: Top 10 Imports from Japan, 2006
HS Description US$ mn % of totalimports
87 Vehicles other than railway or tramway rolling-stock, parts etc. 245.76 54.66
84 Nuclear reactors, boilers, machinery and mechanical appliances, etc. 67.32 14.97
85 Electrical machinery and equipment and parts theoreof, etc. 25.32 5.63
39 Plastics and articles thereof 17.40 3.87
55 Man-made staple fibres 10.93 2.43
90 Optical, photographic, etc. instruments and accessories 10.10 2.25
73 Articles of iron or steel 9.25 2.06
40 Rubber & articles thereof 7.47 1.66
60 Knitted or crocheted fabrics 6.80 1.51
72 Iron and steel 5.87 1.31
Source: Sri Lanka Customs Database27
investments of Sri Lankan Rs. 17bn (accounting for about 4 percent
of total FDI to Sri Lanka) with 66 enterprises operating as of end
2006 (under the section 17 of the BOI Law)8. From Japan’s point of
view, the flow of Japanese investments into Sri Lanka has been low –
FDI flows from Japan to Sri Lanka failed to rise to even to 1 percent
of total Japanese FDI. Despite attempts to attract FDI to Sri Lanka
with generous incentives offered by the Sri Lankan government, the
volume of flows in general and Japanese investments in particular
has been low in scale and character. This has been due to a number of
factors including poor resource endowments, low rate of economic
growth, political and social unrest in the country and underdeveloped
domestic capital market and poor industrial environment (Lakshman
and Ratnayake, 2003).
Much of the Japanese investments (in terms of value) has been in
services sector and account for 61 percent of total investments9. While
most of the initial investments were small- and medium-scale ventures,
few large multinational conglomerates such as NTT, Mitsui Group,
Kawasho Corporation, and YKK have committed substantial
investments in large infrastructure and manufacturing projects. But
on the whole the majority of the Japanese investments in Sri Lanka
have been small size in terms of volume of investment. Some of the
other major Japanese investments in Sri Lanka include JICA, Noritake,
FDK, to name a few.
4.3 Importance of Japan to Sri Lanka as a Donor
Government of Japan has been a key lending partner of Sri Lanka
ever since the two countries commenced diplomatic relations back in
1952. The present focus of Japanese ODA has been in support of
peace building and in economic and social infrastructure, institutional
reform, measures for acquisition of foreign currency and poverty
alleviation10. Japanese aid to Sri Lanka is channeled through JICA
(Japanese International Cooperation Agency), JBIC (Japan Bank for
International Cooperation) and one can not ignore Japan’s contribution
to the ADB. The vast majority of Japanese aid has been untied and at
a concessional rate. Furthermore the aid has very closely tracked the
key development challenges in Sri Lanka, focusing on issues such asTable 12: Realised Investments from Japan as at end 2006
28
(Approved under section 17 of the BOI Law)
No. of Actual Investment (Rs.Mn.)
Projects Foreign Local Total
Beverages & Tobacco 1 11.8 0.0 11.8
Coir Products 2 30.7 9.0 39.7
Electronic & Electrical Goods 5 1,328.3 7.1 1,335.4
Fabricated Metal Products 4 89.3 1.5 90.8
Food Products (Processing) 4 233.6 194.8 428.3
Horticulture 4 110.6 25.1 135.7
Ind.,Chemical,Petroleum,Coal & Plastic 2 93.1 5.3 98.4
Jewellery & Lapidary 3 342.7 11.5 354.2
Marine/Fishing Gear & Accessories
Non-Metallic Mineral Products 5 1,014.7 697.3 1,711.9
Other Manufactured Products (N.E.S.) 3 362.9 0.0 362.9
Paper & Paper Products
PVC Products 1 154.0 0.0 154.0
Rubber Products 4 875.3 49.1 924.4
Services 16 8,746.7 1,557.3 10,304.1
Transport Equipment 5 285.9 7.4 293.4
Textiles & Fabrics
Wearing Apparel (Excluding Leather Gar.) 6 125.0 36.9 161.9
Wood Products 1 535.0 0.0 535.0
Total 66 14,339.7 2,602.3 16,941.9
Source: Board of Investment, Sri Lanka29
physical infrastructure, conflict, rural inequalities and the energy
sector.
Japanese ODA consists of loans, grants and technical assistance.
JBIC’s assistance is dominated by untied concessionary loans, while
JICA’s funding consists of a mix of loans, grants and TA. In 2005
Japan provided 1.1 Billion Yen worth of grants to Sri Lanka and 30
Billion Yen in loans, and as of 2004, 6044 Sri Lankan citizens have
been received as trainees by the Government of Japan and 1172
Japanese technical consultants have been dispersed to work in Sri
Lanka. As per capita income has increased, there is less access to
concessional funding available to Sri Lanka from multilateral donors.
Furthermore, certain countries have reduced aid allocations due to a
lack of progress in peace efforts in the country. Japan on the other
hand has scaled up aid efforts and has continued to lend to Sri Lanka
despite the adverse climate. Given this long and successful history,
Sri Lanka has a close relationship with Japan as a donor and as a
country.
5. What are the Potential Opportunities and Challenges
of Enlarging BIMSTEC to Include Japan for Sri Lanka?
Having examined the present status of Sri Lanka’s trade relations
between BIMSTEC and Japan it is pertinent to consider the possible
opportunities and challenges that will arise if Japan joins BIMSTEC.
This section will first consider the opportunities and challenges with
regard to specific sectors – goods, services and investment – followed
by a discussion on more general challenges that come about due to
North-South regional trade arrangements. This section will also discuss
what needs to be done by BIMSTEC to attract new members such as
Japan.
5.1 Opportunities and Challenges for Increased Trade in
Goods
While intra-regional trade in the region currently remains low (i.e.)
less than 5 percent of the region’s trade, inclusion of Japan would
increase this figure modestly to about 7 percent. The scope for further
expansion of trade could be greater if there is closer cooperation in30
trade between the region and Japan given the trade complementarities
in the enlarged BIMSTEC.
Revealed comparative advantage (RCA) index, which is
commonly used to gauge the potential for intra-regional trade, indicates
that countries in the region have comparative advantage in similar
products except in the case of India and Thailand and as such the
potential for trade expansion within the BIMSTEC may be modest
(Table 13). Inclusion of Japan could further enhance the
complementarities in the region given that Japan’s comparative
advantage lies in different set of goods, which almost none of the
BIMSTEC countries (other than India and Thailand) display. This is
very evident in the case of Sri Lanka. Sri Lanka’s comparative
advantage lies in textiles and textile articles, vegetable products,
precious stones, plastics and rubber, live animals and animal products
while Japan’s comparative advantage is in transport equipment, optical
and precision instruments, machinery and electrical equipment, and
base metals, providing much scope for bilateral trade expansion.
Chart 3 shows potential trade11 between Sri Lanka and Japan in
terms of sectors (at HS 2 digit level). The annual growth of Japan’s
imports from the world is plotted on the vertical axis and the share of
the Japan in Sri Lanka’s exports is plotted on the horizontal, while
the size of the bubbles represents the size of the potential trade between
the two countries. Reflecting the comparative advantage of Sri Lanka
in textiles and textile articles, the chart shows that the highest potential
for trade lies in the export of textiles and textile articles from Sri
Lanka to Japan. Despite the fact that the sector accounts for more
than half of Sri Lanka’s total exports, less than one percent of the
exports go to Japan and as such the Japanese market remains
unexploited. However, it should be noted that this sector records
comparatively lower growth in terms of imports from Japan. After
textiles and textile articles, plastics and rubber, and precious stones
record the highest potential in terms of exports to Japan. As it can be
seen from the Chart, these sectors also record high import growth in
Japan – the growth rate over the last 5 years is high as 18 percent in
the case of rubber. Vegetable products (namely coffee, tea, mate andTable 13: RCA Indices for BIMSTEC+Japan, 2003
Description BG IN NP SL TH JP
I Live animals and products 2.6 1.4 0.2 1.1 1.6 0.1
II Vegetable products 0.2 2.8 2.6 7.6 1.6 0.0
III Fats and oils 0.0 0.9 24.5 0.5 0.5 0.0
IV Prepared foodstuffs, beverages, etc. 0.1 0.9 1.8 0.6 2.5 0.1
V Mineral products 0.0 1.0 0.1 0.0 0.4 0.0
VI Chemical products 0.1 1.1 0.7 0.1 0.3 0.7
VII Plastics and rubber 0.0 0.7 0.7 1.5 2.3 1.0
VIII Hides and skins, leather, etc. 3.3 3.1 1.8 1.0 1.0 0.1
IX Wood and articles of wood 0.1 0.1 0.6 0.4 0.9 0.0
X Pulp of wood, paper, books, etc. 0.1 0.2 0.8 0.3 0.5 0.3
XI Textiles and textile articles 15.2 3.7 9.0 9.4 1.2 0.3
XII Footwear, headgear, umbrellas, etc. 1.5 1.6 0.9 1.1 1.4 0.0
XIII Articles of stone, cement, etc. 0.2 1.0 0.1 0.8 1.1 0.9
XIV Precious stones, etc. 0.0 8.9 0.3 2.5 1.7 0.2
XV Base metals and products 0.0 1.4 1.6 0.5 0.6 1.0
XVI Machinery and electrical equipment 0.0 0.2 0.0 0.1 1.3 1.5
XVII Transport equipment 0.0 0.2 0.0 0.2 0.5 1.9
XVIII Optical and precision instruments 0.1 0.2 0.0 0.1 0.6 1.7
XX Miscellaneous manufact. Articles 0.1 0.1 0.0 0.0 0.0 0.2
XXI Works of art, etc. 0.1 0.3 0.3 0.5 1.0 0.4
XXII Petroleum Products 0.0 0.6 0.2 0.0 0.7 1.3
31
Source: Computed from using COMTRADE Database32
Chart 3: Potential Trade between Sri Lanka and
Japan in 2005 (‘000)
Codes:
03 Fish, crustaceans, molluscs, aquatic invertebrates nes
09 Coffee, tea, mate and spices
15 Animal, vegetable fats and oils, cleavage products, etc
29 Organic chemicals
38 Miscellaneous chemical products
39 Plastics and articles thereof
40 Rubber and articles thereof
42 Articles of leather, animal gut, harness, travel goods
61 Articles of apparel, accessories, knit or crochet
62 Articles of apparel, accessories, not knit or crochet
63 Other made textile articles, sets, worn clothing etc
69 Ceramic products
71 Pearls, precious stones, metals, coins, etc
74 Copper and articles thereof
84 Nuclear reactors, boilers, machinery, etc
85 Electrical, electronic equipment
87 Vehicles other than railway, tramway
88 Aircraft, spacecraft, and parts thereof
95 Toys, games, sports requisites
99 Commodities not elsewhere specified
Note: Trade potential is defined as the lower value of the amount a market exports
(imports) to the world and the amount the partner country imports (exports) from
the world, minus the existing trade between the two countries under review.
Source: ITC Trade MapYou can also read