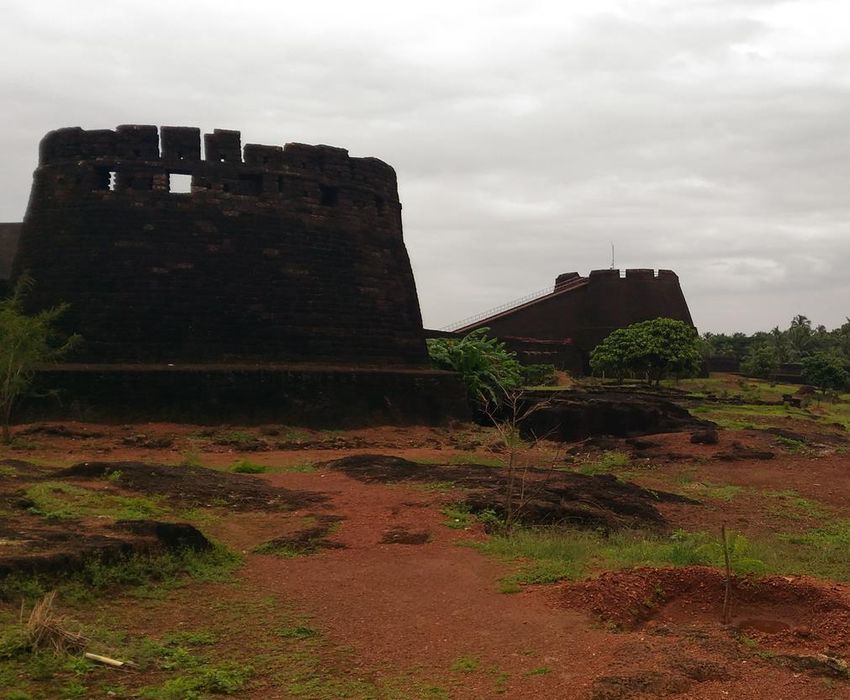
KERALA GOD'S OWN COUNTRY - BEKAL FORT IN KASARGOD, KERALA - IBEF
←
→
Page content transcription
If your browser does not render page correctly, please read the page content below
BEKAL FORT IN KASARGOD, KERALA

 KERALA
 GOD’S OWN COUNTRY

For updated information, please visit www.ibef.org                          March 2018

Table of Content

  Executive Summary……………….….…….3

  Advantage State …………………..….…….5

  Kerala Vision 2030 …………………..……..6

  Kerala – An Introduction……….…….……..7

  Budget 2016-17…………...………………..18

  Infrastructure Status...................................19

  Key Industries…….……….......…………….46

  Doing Business in Kerala…….……….........65

  State Acts & Policies…….……….......……..73
EXECUTIVE SUMMARY … (1/2)
Cultural diversity and Kerala is known as God’s own country. It is one of the few states to have marketed its natural beauty
well developed tourism successfully to the leisure tourism sector. The state’s unique heritage and cultural diversity have helped
sector attract tourists from the world over.
Highest literacy and sex As of census 2011, Kerala has the highest literacy rate of 94.0% and sex ratio of 1,084 women for 1,000 men,
ratio in India. Male literacy rate in the state stands at 96.10%, among all states.
Largest recipient of
In 2016-17, Kerala received NRI remittances of US$ 22.71 billion. Remittances to the state are estimated at
foreign remittances in
36.3% of the net state domestic product in 2016.
the country
Ranks second in Kerala holds second rank in the Investment Climate Index followed by Karnataka, as per a policy research
Investment Climate working paper by the World Bank. The state stands second due to its world-class infrastructure and well-
Index trained human resource pool.
Source: Economic Review of Kerala 2014-15 , NRI Achievers Bureau, MIGRATION AND DEVELOPMENT BRIEF 27 by World Bank, SLBC Kerala
3 KERALA For updated information, please visit www.ibef.org
EXECUTIVE SUMMARY … (2/2)
Kerala is a leading agricultural state in the country & the largest producer of rubber, pepper, coconut & coir.
Strong agricultural
As per budget 2018-19, Government of Kerala has proposed an outlay of US$ 1,131.75 million for the
sector Agriculture, Animal Husbandry and Co-operation.
First international
Kerala has the 1st international transhipment terminal in India, having a design capacity of around 4 million
container transhipment
TEUs & providing better connectivity between Kerala & other ports in India.
terminal
Kerala has been promoting knowledge-based industries such as IT/ITeS, computer hardware &
Presence of world class
biotechnology. It is the first state having a technology park with CMMI level 4 quality certification & a world-
technology park class IT campus in Thiruvananthapuram.
The total cargo traffic handled by Cochin port during 2016-17 was 25 million tonnes, recording an increase of
Cargo Traffic in Cochin
13.16% against 22.09 million tonnes for the year 2015-16. Cargo Traffic during April-February 2018 reached
Port 26.57 million tonnes.
Source: Economic Review of Kerala 2014-15 , Kerala IT Policy, TEU’s = Twenty-foot Equivalent Unit Rubber Board, Ministry of Commerce and Industry, Government of India, Department
of Economics and Statistics, Kerala, Kerala State Co-operative Rubber Marketing Federation, Cochin Port Trust, New Indian Express, State budget 2018-19
4 KERALA For updated information, please visit www.ibef.org
ADVANTAGE: KERALA
2016 2021E
Foreign High economic growth Leader in tourism Foreign
tourist tourist
Kerala’s gross state domestic product (GSDP) surged at In 2015, Kerala was rewarded as the winner of PATA
arrivals: a compound annual growth rate (CAGR) of 11.18% awards by Macau Government Tourism Office (MGTO)
arrivals:
1.04 million between 2005-06 and 2015-16. 3 million
BBC Travel survey has rated Kerala as the top favourite
Kerala is the leader in rubber production; high demand tourist destination among foreign travellers.
of rubber has opened up immense opportunities for the
Foreign tourist arrivals increased by 5.71% during 2016
state in the rubber industry.
over 2015.
Advantage
Kerala
Rich pool of skilled labour Policy and
Kerala has a large base of skilled labour, making it an infrastructure support
ideal destination for knowledge-intensive sectors.
Kerala has a wide range of fiscal and policy incentives
The state has the highest literacy rate in the country. for businesses under the Industrial and Commercial
It has a large pool of semi-skilled and unskilled Policy and has well-drafted sector-specific policies.
labourers. It has a well-developed social, physical and industrial
infrastructure and virtual connectivity, and good power,
airport, IT, and port infrastructure. E-governance
initiatives will further strengthen transparency and bridge
digital divide.
Source: Economic Review of Kerala 2014-15, Tourism Vision 2030, kerala Tourism
5 KERALA For updated information, please visit www.ibef.orgKERALA VISION 2030
Affordable and clean power to all.
Exploit the full potential of hydro-electric
Green, sustainable and safe
generation.
transport.
100% electrified households with 24*7
availability.
Growth oriented labour welfare policy. Provide high quality education at
Transport Energy
Connecting labour supply with affordable rates.
demand. Create a global brand name in
Increasing employment opportunities. Labour education and develop into a
Education knowledge hub by 2030.
Vision
2030 Increase health expenditure to
Increase the share of manufacturing Industry Health GSDP ratio from 0.6% in 2012 to 4-
to 10% of the GSDP by 2030. 5% by 2027−31.
Sustained increase in employment Set up three medical cities by 2030.
in manufacturing. Agriculture &
Forestry Provide health insurance cover to
livestock
all.
Increase the share of forestry in Shift from subsistence farming to
GSDP to 0.5%. highly knowledge intensive,
competitive farming.
Increase the productivity of forests
through improved management of Self sufficiency in supply of fish,
resources. meat, milk and other dairy products
to the local market.
Source: Government of Kerala
6 KERALA For updated information, please visit www.ibef.orgKERALA FACT FILE
There are 44 rivers flowing through Kerala, the major ones being
Periyar (244 km), Bharathapuzha (209 km) and Pamba (176 km).
Out of these 44 rivers 41 are west flowing and 3 are east flowing.
Parameters Kerala
Capital Thiruvananthapuram
Geographical area (sq km) 38,863
Administrative districts (No) 14
Source: Maps of India
Population density (persons per sq km) 860
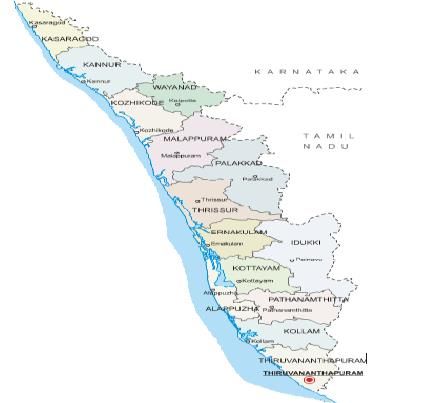
Kerala is located along the coastline to the extreme south-west of the
Total population (million) 33.41
Indian peninsula, flanked by the Arabian Sea on the west and the
mountains of the Western Ghats on the east. The state has a 580 km
Male population (million) 16.02
long coastline.
Malayalam is the most commonly spoken language. Hindi, English Female population (million) 17.38
and Tamil are the other languages used.
Sex ratio (females per 1,000 males) 1,084
Kochi, Kozhikode, Kollam, Thrissur, Alappuzha, Palakkad,
Thalassery, Ponnani and Manjeri are some of the key cities in the
Literacy rate (%) 94.6
state.
Source: Kerala at a glance, Economic Review of Kerala,2014-15 , Government of Kerala website, Census 2011, Central Statistics Office
7 KERALA For updated information, please visit www.ibef.orgKERALA IN FIGURES … (1/2)
Parameter Kerala All states Source
Economy 2016-17 2016-17
“Advanced Estimates” provided by Directorate of
GSDP as a percentage of all states’ GSDP 4.05 100.0
Economics and Statistics of Kerala
“Advanced Estimates” provided by Directorate of
GSDP growth rate (%) 10.59 10.8
Economics and Statistics of Kerala
“Advanced Estimates” provided by Directorate of
Per capita GSDP (US$) 2,679.65 1,548
Economics and Statistics of Kerala
Physical Infrastructure
Installed power capacity (MW) 5,019.23 334,146.91 Central Electricity Authority, as of February 2018
Telecom Regulatory Authority of India, as of
Wireless subscribers (No) 41,141,883 1,151,936,422
January 2018
Telecom Regulatory Authority of India, as of
Internet subscribers (No) 18,930,000 445,960,000
December 2017
National highway length (km) 1,782 115,435 NHAI & Roads and Building Department
Major and minor ports (No) 1+17 13+187 India Ports Association
Airports (No) 3 125 Airports Authority of India
8 KERALA For updated information, please visit www.ibef.orgKERALA IN FIGURES … (2/2)
Parameter Kerala All states Source
Social Indicators
Literacy rate (%) 94.6 73.0 Census, 2011
Birth rate (per 1,000 population) 14.3 20.4 SRS Bulletin September 2017
Investments
Department of Industrial Policy & Promotion, From
FDI equity inflows (US$ billion) 1.93 368.053
April 2000 to December 2017
Industrial Infrastructure
DEA, Ministry of Finance, Government of India,
PPP projects completed & operational (No) 152 9,068
February 2018
Exporting SEZs (No) 19 222 SEZ India, as of December 2017
PPP: Public-Private Partnership, SEZ: Special Economic Zone, SRS: Sample Registration System
9 KERALA For updated information, please visit www.ibef.orgECONOMIC SNAPSHOT – GSDP
GSDP of Kerala at current prices (US$ billion) Per Capita GSDP of Kerala at current prices (US$)
100.00 2800
CAGR 3.44% CAGR 2.94%
90.00 2700
92.0
80.00
85.2
85.03
2,680
2600
77.66
70.00 77.15
75.92
60.00 2500
2,502
2,496
50.00 2400
40.00 2300
2,318
30.00
2,281
2,255
2200
20.00
10.00 2100
0.00 2000
2011-12
2012-13
2013-14
2014-15
2015-16
2016-17
2011-12
2012-13
2013-14
2014-15
2015-16
2016-17
At current prices, Kerala’s GSDP* was about US$ 92.0 billion The state’s per capita GSDP^ stood at US$ 2,680 during 2016-
in 2016-17. 17 as compared to US$ 2317.965 during 2011-12.
The state’s GSDP recorded a CAGR of 3.44% between 2011- Per capita GSDP increased at a CAGR of 2.94% between
12 and 2016-17. 2011-12 and. 2016-17
Growth was mainly driven by secondary and tertiary sectors.
Source: “Advanced Estimates” provided by Directorate of Economics and Statistics of Kerala, GSDP* - Government of Kerala – With Medium Term Fiscal Plan for Kerala 2016-17 to 2018-
19 , Per Capita GSDP^ - calculated using GSDP million US$/Population in million
10 KERALA For updated information, please visit www.ibef.orgECONOMIC SNAPSHOT – NSDP
NSDP of Kerala at current prices (US$ billion) NSDP per capita of Kerala at current prices (US$)
90.00 2,500
CAGR 3.54% CAGR 3.04%
80.00
83.24
2,400
2,425
76.98
76.41
70.00
2,300
69.97
69.22
68.38
60.00
2,254
2,248
50.00 2,200
40.00 2,100
2,089
30.00
2,000
2,047
2,031
20.00
10.00 1,900
0.00 1,800
2013-14
2011-12
2012-13
2014-15
2015-16
2016-17
2011-12
2012-13
2013-14
2014-15
2015-16
2016-17
At current prices, Kerala’s NSDP# was about US$ 83.24 billion Kerala’s per capita NSDP& was US$ 2,425.37 in 2016-17
in 2016-17. compared to US$ 2088.58 during 2011-12.
NSDP of the state grew at a CAGR of 3.54% between 2011-12 Per capita NSDP of the state grew a CAGR of 3.04% between
and 2016-17. 2011-12 and 2016-17.
Source: “Advanced Estimates” provided by Directorate of Economics and Statistics of Kerala,
11 KERALA For updated information, please visit www.ibef.orgECONOMIC SNAPSHOT – PERCENTAGE
DISTRIBUTION OF GSDP
In 2016-17, the tertiary sectorµ contributed 56.13% to the state’s Visakhapatnam
GSDP composition
port trafficby
(million
sectortonnes)
GSDP at current prices, followed by the secondary sector
contributing 20.85%.
100%
The tertiary sector grew at a CAGR of 12.38% between 2011-12 and 53.08% CAGR 56.13%
2016-17. Growth was driven by storage, transport, financial and real 90%
estate segments.
80%
The secondary sector grew at an average rate of 6.94%, between
2011-12 and 2016-17. Growth was led by manufacturing, 70%
12.38%
construction, electricity, gas & water supply.
60%
The primary sector expanded at an average rate of 7.46% between
50%
2011-12 and 2016-17, mainly supported by growth across agriculture
and mining & quarrying segments. 40% 25.26%
20.85%
30% 6.94%
20%
10% 14.04% 7.46% 11.87%
0%
2011-12 2016-17
Primary Sector Secondary Sector Tertiary sector
Source: Directorate of Economics and Statistics of Kerala Economic Survey, Sector-wise%share of GSDPµ -Geometric mean of YoY calculation from 2004-05 to 2014-15
12 KERALA For updated information, please visit www.ibef.orgECONOMIC SNAPSHOT – AGRICULTURAL
PRODUCTION
Agriculture, Forestry and Fishing contributed 12.24% to Kerala’s Crop Annual production – 2016-17 (‘000 MT)
gross state value added in 2015-16. Kerala is one of the leading Total food
Onion 0.28 450.3
pepper and rubber producers in the country. grains
Fruits* 2,451.27 Rice 448.4
As per budget 2017-18, the state government allocated US$ 326.88
million for agricultural sector, US$ 15.83 million for soil and water Plantation* 5,324.24 Pulses 1.7
conservation sector, US$ 47.81 million for animal husbandry, US$
Mango 376.08 Nutmeg 14.19
15.06 million for dairy development and US$ 90.91 million for
fisheries. On other hand, under the 12th Five Year Plan, US$ 1.46 Grapes 15.50 Vegetables* 1,907.72
billion was allocated for agriculture and allied sectors in the state.
Pepper 30.47 Cocoa 7.15
In November 2016, Kerala agreed to implement Food Security Law
Tea 5.47 Turmeric 6.50
in the state. As per the law, the government will make available 5
kg of highly subsidized food grain at Rs 1-3 per kg, to each person
in the state per month.
Note: (2)m.kg 2017E, *2nd advance estimates for 2016-17
Source: Department of Economics and Statistics, Kerala, Department of Agriculture Cooperation And Farmers Welfare
13 KERALA For updated information, please visit www.ibef.orgECONOMIC SNAPSHOT – EXPORTS
Value exports from Kerala increased from US$ 4,028 million in 2013- Total exports turnover from CSEZs (US$ million)
14 to US$ 4,220 million in 2014-15.
Exports of non-basmati rice from the state increased from US$ 28.96
7,000.0
million in 2015-16 to US$ 33.52 million in 2016-17, and were US$
6,000.0
25.21 million for the period April-November, 2017. In 2015-16,
6,108.64
5,998.80
exports of non-basmati rice from Cochin SEZ were valued at US$ 5,000.0
28.92 million. 4,000.0
4,109.16
3,709.03
3,000.0
Exports break-up, Cochin Special Economic Zone Port (2014-
2,532.19
2,000.0 1,486.54
15) 740.06
1,000.0 334.17
Sectors (US$ million) -
2014-15
2008-09
2009-10
2010-11
2011-12
2012-13
2013-14
2015-16
(1)
Agricultural products 252.22
Electronics hardware 76.84
Engineering 4.39
Exports of basmati rice from the state, in value terms, increased from US$
Gem & jewellery 47.25
112.44 thousand in 2014-15 to US$ 175.82 thousand in 2015-16, and were
IT and ITeS 77.73 US$ 36.17 thousand for the period April-November, 2017. Exports of
Miscellaneous 59.16 floriculture products from the state stood at US$ 3.64 million in 2016-17
and were US$ 2.30 million for the period April-November, 2017, while
Plastic and rubber products 14.36
exports of fruits and vegetable seeds from the state was recorded at US$
Textiles & garments 15.21 0.83 million during the same period.
Trading 11.25 Exports from Electronics Technology Parks – Kerala, increased 22.55% in
2015-16 to reach US$ 970 million.
Source: Office of the Development Commissioner, CSEZ - Cochin Special Economic Zone (1)2015-16, APEDA, Kerala Economic Review 2016
14 KERALA For updated information, please visit www.ibef.orgECONOMIC SNAPSHOT – FDI INFLOWS &
INVESTMENTS
According to DIPP, during April 2000 to December 2017, FDI FDIVisakhapatnam
equity inflows, port
2008-09
traffic
to (million
2016-17 tonnes)
(US$ million)
inflows into the state (including Lakshadweep) reached US$ 1.93
billion.
500
The state government has sanctioned investments of US$ 100
471
454
million, US$ 156 million & US$ 8.3 million for the Vizhinjam 400
International Seaport project, Kochi Metro Rail Project & for land
300
acquisition for Kozhikode & Thiruvananthapuram international
airports respectively. 200
230
The Government of Kerala is also planning to launch
171
100 72 70
128
“Magnificent Canals” program during 2016-17, for controlling the 37
90
82
investments & capitalising on the potential of tourism sector in 0
2013-14
2008-09
2009-10
2010-11
2011-12
2012-13
2014-15
2015-16
2016-17
2017-18*
the state. The program would deal with the development of
select canal stretches under the PPP model in order to boost
tourism in the state.
In January 2017, several companies have planned to make
Further, the state government has also decided to propose a tax
investments worth US$ 446.23 million in, Infopark Phase-II &
reduction from 14.5% to 5% for attracting investments across
generate employment for around 20000 IT professionals
automated robotic car parking system, during 2016-17.
In January 2018, the Chief Minister of Kerala proposed a In March 2017, Kerala Infrastructure Investment Board (KIIB)
chamber of commerce using which expatriate businessmen will cleared basic development projects worth US$ 1.19 billion, which
be able to invest funds into profitable and job-generating include development projects for physical infrastructure such as
mercantile ventures in Kerala. roads, bridges, potable water, health, education, SC/ST
development and power transmission grid.
Note #: Public-private partnership, 2017-18* - April – December 2017
Source: DIPP - Department of Industrial Policy & Promotion, 1Including Lakshadweep, Government of Kerala,
15 KERALA For updated information, please visit www.ibef.orgKERALA STATE BUDGET 2018-19
Annual Budget 2018-19
Sector Investment (US$ million) Sector Investment (US$ million)
Education 3,170.82 Roads and bridges 224.59
Medical and Public Health 1,339.51 Ports Department 16.99
Other Social Services 1,892.07 Electricity Sector 286.38
Agriculture, Animal Husbandry and Co-
1,131.75 Arts and Cultural Field 22.24
operation
Irrigation 194.08 Coir Industry 32.59
Public Works 754.24 Fishery Sector 92.68
Industries, Labour and Employment 362.79 Forest 110.14
Transport and Communication 68.83 Others 1,224.31
Source: Finance Department, Government of Kerala, India, Converted using 1USD=64.74Rs
16 KERALA For updated information, please visit www.ibef.orgPHYSICAL INFRASTRUCTURE – ROADS … (1/2)
As per the state budget 2016-17, under the scheme of PPP annuity
model and loan from NABARD, construction work on 20 mega
projects was initiated in the state during 2016-17. Some of these
projects include: Cherupuzha–Payyavur–Ulickal–Vallithod – 59.42
km hill highway, construction of 1st phase of Kodimatha,
Kundannoor flyover, Ramanattukara Flyover, etc.
Under the ambitious Bharatmala scheme, which aims to improve
connectivity particularly on economic corridors, border areas and far
flung areas and quicken movement of cargo, two new road
construction projects were added in Kerala. The projects will involve
167 km and 218 km long development on NH 85 and NH 213,
respectively. Also, the Kerala Infrastructure Investment Board
(KIIFB) has alloted US$ 50.66 million for construction of a bypass at
Source: Maps of India Angamaly and Perumbavoor.
Road development activities in the state are undertaken under
three broad categories of roads and bridges, road transport and
other transport services. In the annual budget 2017-18, a total
outlay of US$ 209.69 million has been proposed by the state Road type Road length (km)
government for improving roads and bridge infrastructure.
National highways 1,782
An outlay of US$ 3.81 million was proposed by the state
government for development and improvement of state State highways 4,341.65
highways including relaying of a 600 km length road during Major district roads 27,469.9
2016-17.
Source: Economic Review of Kerala, 2014-15, Kerala State Industrial Development Corporation Ltd.; Ministry of Road Transport & Highways, Government of Kerala, State budget 2017-18
17 KERALA For updated information, please visit www.ibef.orgPHYSICAL INFRASTRUCTURE – ROADS … (2/2)
Pradhan Mantri Gram Sadak Yojana (PMGSY) was launched in National highway length completed (km)
2000 with the objective of connecting eligible rural habitants. As of
February 2017, about 590,104.62 km of road network was
35.0
completed across India, of which 3,534.89 km was completed in
30.0
Kerala.
25.0 29.00
Pradhan Mantri Gram Sadak Yojana (PMGSY) 20.0
21.40
(as of December 2017) 15.0
10.0 5.72
Habitations benefitted 371 5.0
0.0
2012-13 2013-14 2014-15
Length completed 2,964.32
Total expenditure (US$ million) 19.47*
Expenditure on road works under PMGSY in Kerala
(US$ million)
Source: PMGSY
40.00
To improve efficiency of transportation to Kannur International 35.00
Airport, the state government has decided to convert six roads into 30.00 34.75
four-lane highways. The preparation of a Detailed Project Report 25.00 29.12
(DPR) is currently underway. 20.00 24.86
In the Budget 2018-19, a new scheme is being formulated to 15.00 18.51 19.47
renovate 155 dilapidated bridges and culverts within a period of 5 10.00
years. Another mega scheme is the construction of 42 new rail 5.00
0.00
over bridges beginning in 2018-19.
2013-14 2014-15 2015-16 2016-17 2017-18^
Note: * till March 2018
Source: NHAI, omms.nic.in
18 KERALA For updated information, please visit www.ibef.orgPHYSICAL INFRASTRUCTURE – RAILWAYS
Kerala is well connected to other parts of the country via railways.
The State Government has appointed Kerala State Industrial
Development Corporation Ltd (KSIDC) as the nodal agency for
developing a project to establish a north-south High-speed Rail
Corridor (HSRC) to facilitate smooth and speedy passenger
movement between various cities and towns in the state. As per
state budget 2016-17, the state government approved US$ 10.88
billion for constructing a 570-km corridor from Thiruvananthapuram
to Kasaragod. As per budget 2017-18, the Kerala Rail Development
Corporation is going to undertake construction work of nine rail lines
and detailed project reports of Thiruvananthapuram Light Metro for
US$ 654.84 million and Kozhikode Metro for US$ 389.43 million
have been prepared.
Railway divisions in Thiruvananthapuram, Palakkad and Madurai
jointly carry out railway operations in Kerala.
Under the major infrastructure development projects, for ongoing
and new projects, including Kochi Metro, Suburban Rail Corridor,
and various others, the state government provided these projects
with a common pooled amount of US$ 387.42 million during 2016-
17.
The government announced the launch of Kochi Metro Rail’s
Source: Maps of India commercial services of the 13-km Aluva-Palarivattom section of the
27-km Line-1. Over 600 women from the ‘Kudumbasree Mission’
have been employed & trained for smooth run of the 1st phase of
the metro.
Source: Economic Review of Kerala, 2014-15, Kerala State Industrial Development Corporation Ltd, Government of Kerala, State Budget
19 KERALA For updated information, please visit www.ibef.orgPHYSICAL INFRASTRUCTURE – AIRPORTS
Kerala has 3 airports handling domestic & international flights,
located at Thiruvananthapuram, Kochi & Kozhikode. Aircraft
movement from Cochin airport increased from 56,180 in 2015-16 to
61,688 in 2016-17. Aircraft movement from Thiruvananthapuram
airport increased from 26,001 in 2015-16 to 29,117 in 2016-17.
During April-February 2017-2018, aircraft movement from Cochin &
Thiruvananthapuram airports stood at 63,023 & 30,859,
respectively.
Passenger traffic from Cochin airport increased from 7,749,901 in
2015-16 to 8,955,441 in 2016-17, while passenger traffic from
Thiruvananthapuram airport increased from 3,470,788 in 2015-16 to
3,881,509 in 2016-17. During April-February 2017-2018, passenger
traffic from Cochin & Thiruvananthapuram airport stood at 9.23
million & 4.02million, respectively.
Freight traffic from Cochin airport increased from 79,233 tonnes in
2015-16 to 81,485 tonnes in 2016-17, while freight traffic from
Thiruvananthapuram airport decreased from 35,570 tonnes in 2015-
16 to 28,450 tonnes in 2016-17. During April-February 2017-2018,
freight traffic from Cochin & Thiruvananthapuram airports stood at
68,896 tonnes & 26,241 tonnes, respectively.
An international airport at Kannur is upcoming and is expected to be
operational by September 2018. This airport will be the 4th to have a
Source: Maps of India runway of 4,000 metres. Kannur is airport at the final stage of
completion and inauguration to be announced soon.
In February 2017, Government of Kerala approved setting up of an
airport at Erumely. This step is expected to benefit religious tourism
Source: Airports Authority of India, Kerala State Industrial Development Corporation Ltd. as lakhs of devotees visit Pathanamthitta district every year.
20 KERALA For updated information, please visit www.ibef.orgPHYSICAL INFRASTRUCTURE – PORTS … (1/4)
Kerala has 18 ports, of which, Cochin is the major one. Furthermore, Existing Ports
there are three intermediate and 14 minor ports.
The development activities of the port are taken care of by the Major ports Cochin
Department of Ports, Harbour Engineering Department and Harbour
Engineering Department. Neendakara
Intermediate ports Alappuzha
Under the 12th Five Year Plan from 2012 to 2017, the State
Kozhikode
Government approved an investment of US$ 364.9 million for
development of port infrastructure facilities for handling cargo and
Vizhinjam
passenger transport.
Valiyathura
Vizhinjam International Port Phase-I, with an outlay of US$ 1.05 Vadakara
billion, is the largest harbour project in Kerala. Ponnani
Thankasserry
Head Budget 2018-19 Kayamkulam
Manakkodam
Ports US$ 16.99 million Minor ports Munambam
Beypore
Thalasserry
Manjeswaram
Neeleswaram
Kannur
Azhikkal
Kasaragode
Source: Cochin Port Trust, Kerala Ports, Kerala Budget 2016-17, 2017-18, 2018-19
21 KERALA For updated information, please visit www.ibef.orgPHYSICAL INFRASTRUCTURE – PORTS … (2/4)
During 2016-17, the cargo traffic handled by Cochin port was 25 Cochin port traffic (million tonnes)
million tonnes. The Cochin Port handled 12.078 million tonnes of
crude oil, 816 thousand tonnes of cement 491,087 Twenty Foot
35.0
Equivalent Units (TEUs) in 2016-17. 30.0
25.0
29.14
The cargo traffic handled by Cochin port was 29.14 million tonnes
25.00
20.0
22.09
21.60
20.90
20.10
15.0
19.80
between April-March 2017-18.
17.90
17.40
15.80
15.20
10.0
In addition, the state government has been focussing on 5.0
0.0
development of minor ports.
2014-15
2007-08
2008-09
2009-10
2010-11
2011-12
2012-13
2013-14
2015-16
2016-17
2017-18*
Source: Cochin Port Trust, News articles, Economic Survey 2014-15, India Port
Association
Ports to be developed Budget 2017-18 (US$ million)
Vizhinjam cargo port 3.42
Thankassery, Munambam,
7.16
Beypur and Azheekkal ports
Alappuzha Mareena Port 1.14
Other small ports 0.62
Source: State Budget 2016-17
Source: * - between April-March 2017-18
22 KERALA For updated information, please visit www.ibef.orgPHYSICAL INFRASTRUCTURE – PORTS … (3/4)
The Cochin port is a favourite port-of-call for luxury cruise liners from Number of cruise vessel arrivals at Cochin port
around the world.
During 2016-17, total number of cargo vessels that entered Cochin 50
port were recorded to be 1,666. 40
45
44
44
43
42
41
39
38
30
36
Around 28,342 cruise passengers embarked in Kochi in 2014-15.
34
33
20
26
The arrival of a cruise vessel has an added impact on the regional
10
economy as cruise tourists are high end passengers. On an average,
0
each tourist is estimated to spend US$ 200 during the stopover of
2006-07
2005-06
2007-08
2008-09
2009-10
2010-11
2011-12
2012-13
2013-14
2014-15
2015-16
2016-17
less than a day.
Year Passenger
2011-12 34,768
2012-13 37,389
2013-14 24,535
2014-15 28,342
Source: Cochin Port Trust
23 KERALA For updated information, please visit www.ibef.orgPHYSICAL INFRASTRUCTURE – PORTS … (4/4)
Category Wise Distribution Of Vessels Entering The Cochin Port
Year Number of Vessels
General
Containers Coal Fertilizers & raw materials Others Food Grains Tankers Total Vessels
Cargo
2005-06 421 4 38 8 0 109 383 1225
2006-07 382 7 27 15 5 92 382 225
2007-08 350 6 15 11 2 73 352 269
2008-09 334 6 22 23 0 63 305 293
2009-10 390 5 17 36 0 45 381 359
2010-11 360 2 18 28 0 39 372 396
2011-12 390 2 15 33 0 37 361 504
2012-13 439 1 12 47 0 24 354 449
2013-14 501 0 11 62 0 41 382 399
2014-15 529 2 15 62 0 33 356 440
2015-16 643 2 8 73 3 42 398 418
2016-17 696 1 9 83 7 29 394 403
Source: Cochin Port Trust, New Indian Express
24 KERALA For updated information, please visit www.ibef.orgPHYSICAL INFRASTRUCTURE – POWER … (1/3)
As of February 2018, the state had a total installed power generation Installed power capacity (MW)
capacity of 5,019.23 MW, of which 2,192.48 MW was accounted for
by state utilities, 1,879.76 MW by central utilities and 946.99 MW
6,000.0
under private sector.
5,000.0
5,019.23
4,998.94
Thermal power contributed 2,416.72 MW to total installed power 4,000.0
4,172.00
4,106.00
generation capacity. Hydropower (1,881.50 MW), nuclear power
3,892.00
3,856.40
3,827.70
3,718.80
3,000.0
3,553.70
3,514.00
(362.00 MW), and renewable power (359.01 MW) are the other main
2,000.0
energy sources.
1,000.0
Kerala’s state utilities, which account for 43.81% of overall capacity,
0.0
generate 86.05% of the energy through hydroelectric power plants,
2011-12
2008-09
2009-10
2010-11
2012-13
2013-14
2014-15
2015-16
2016-17
2017-18*
and the remaining 13.95% through thermal and renewable power
generation plants.
Sub Sectors Budget 2017-18 (US$ million)
Agency for Non-conventional
7.45
Energy and Rural Technology
Energy Management Centre 1.24
Source: State Budget 2016-17, Central Electricity Authority, *data till February 2018
25 KERALA For updated information, please visit www.ibef.orgPHYSICAL INFRASTRUCTURE – POWER … (2/3)
Kerala is among the prominent Indian states to have achieved 100% Status of rural electrification in Kerala (100 per cent electrified
rural electrification. since May 2017)
The rural areas or villages in the state were electrified under a Area type Nos.
scheme launched in 2015, “Deendayal Upadhyaya Gram Jyoti
Yojana”. The operational electrification scheme, that is, Rural Total villages 1,017
Electricity infrastructure and Household. Electrification, was
subsumed in the new scheme. Electrified villages 1,017
As on July 31 2017, a total sum of US$ 33.8 million was sanctioned Total rural households 71,03,000
and US$ 32.97 million was disbursed under the DDUGJY scheme
for rural electrification of 29 projects in the state. Electrified rural households 71,03,000
Under Deendayal Upadhyaya Gram Jyoti Yojana scheme, 14 new Un-electrified rural households Nil
projects have been sanctioned for US$ 76.16 million as of July 2017.
Status of rural electrification in Kerala under DDUGJY scheme
(as of July 2017)
Area type Nos.
Intensively electrified villages 1,087
Electrified BPL households 1,50,305
Source: Deendayal Upadhyaya Gram Jyoti Yojana
26 KERALA For updated information, please visit www.ibef.orgPHYSICAL INFRASTRUCTURE – POWER … (3/3)
Budget Highlights - 2018-19:
• Total outlay for electricity sector is US$ 286.38 million.
• The annual scheme includes 49 Hydro Electric Projects, 2 Thermal Projects, 2 Windmill Projects and 1 Solar Project.
• Transgrid 2.0 with project cost of US$ 803.21 million being implemented through KIIFB, is the largest project in the transmission sector.
• Battery operated auto rikshaws will be introduced for connected journeys from Kochi Metro stations. For the recharging of these, bulk charging
stations will be setup under the control of Electricity Board. It will be started in 2018-19.
• A new scheme is being launched to encourage inventions to reduce the electricity misuse and to expand them on an entrepreneurial basis. It
will be implemented under the leadership of Energy Saving and Co-ordination Team of Electricity Board and US$ 4.32 million is allocated for
this scheme.
Source: Finance Department, Government of Kerala, India Converted using 1USD=64.74Rs
27 KERALA For updated information, please visit www.ibef.orgPHYSICAL INFRASTRUCTURE – TELECOM
As of January 2018, Kerala had an overall tele-density of 119.35% Telecom Infrastructure (As of January 2018)
as against an all-India average of 90.61%.
According to the Telecom Regulatory Authority of India (TRAI), as of Wireless subscribers 41,141,883
January 2018, Kerala had 41.14 million wireless subscribers and
Wire-line subscribers 1,977,054
1.98 million wire-line subscribers.
By the end of December 2017, 8,858,141 subscribers had submitted Internet subscribers 18,930,000
requests for mobile number portability in Kerala.
Post offices 5,067(2)
As per state budget 2017-18, free internet connections will be
provided to two million poor families in Kerala under the Kerala Fibre Tele density (in%) 119.35
Optic Network (K-FON). WiFi transmission centres will be Source: Telecom Regulatory Authority of India, 1As of March 2017, 2As of March 2016
established at Akshaya Centres, Friends Janasevana Kendras,
government offices, libraries, and public places under the control of
government. Performance status of Bharat Net Project
(As of December 2017)
No. of GPs in Phase-I 977
Cables laid (km) 830
GPs for which cable laid 1,129
No. of GPs Lit 1,129
Source: Ministry Of Communications And Information Technology, GP - Gram Panchayat
Note: (1) - data upto September 2017
28 KERALA For updated information, please visit www.ibef.orgDEVELOPMENT PROJECTS: URBAN
INFRASTRUCTURE
The Kerala urban area comprises of five Municipal Corporations and Projects & Programmes Budget 2016-17 (US$ million)
60 Municipalities for which the State Government proposed an outlay
Solid Waste Management Project 2.76
of US$ 11.2 billion under the 12th five year plan 2012-17. The Kerala
Sustainable Urban Development Project (KSUDP) is an Asian Kannur City Improvement
1.53
Development Bank-assisted project covering the five municipalities Programme
of Thiruvananthapuram, Kochi, Kozhikode, Kollam and Thrissur. With
Swachh Bhavanam 0.15
an investment of US$ 221.2 million, the project focuses on urban
infrastructure improvement, community upgrading, local government Suchithwa Mission 3.82
infrastructure development and capacity building, and
implementation assistance. Operation Anantha 3.82
In May 2017, the state government proposed to spend about US$
2.97 billion for various urban development projects. The package will
The state government launched Haritha Keralam Mission in
include construction of big roads, IT parks and welfare schemes for
December 2016, to make Kerala clean and protect its water
poor and backward sections of the society. The funds are to be
resources and soil. As per budget 2017-18, US$ 23.28 million will be
arranged by the Kerala Infrastructure Investment Fund Board
invested for establishing 14 septage units, one in each district.
(KIIFB).
Major infrastructure projects such as Kannur Air Port, GAIL Pipeline,
In August 2017, Kerala Infrastructure Investment Board (KIIFB) gave
Kochi-Edamon Electric line and Bypasses at Kollam and Alappuzha
nod to four infrastructure projects. One of the major projects is the
will be inaugurated in 2018-19.
Kerala Fibre Optic Network (K-FON) project which aims to transform
the state into an intelligent, innovative and inclusive society. The
state government is going to lay KSEB transmission lines and
distribution poles which will connect 30,000 government and
educational institutions and 2 million economically backward
households will get free Internet through it.
Source: JNNURM, Ministry of Urban Development, State Budget 2016-17, 2017-18, Business Standard
29 KERALA For updated information, please visit www.ibef.orgDEVELOPMENT PROJECTS: KEY PUBLIC-PRIVATE
PARTNERSHIP (PPP) PROJECTS … (1/2)
Project name PPP type Sector Stage Project cost (US$ million)
Road Upgradation (Kottayam- (DBFOT)
Transport Under construction 20
Thiruvananthapuram) Project Annuity
LNG Port & Terminal Facility (Puthuvypeen) Operation and
(BOT) Annuity Transport 649.1
Project maintenance stage
Multi-User Liquid Terminal (Puthuvypeen)
(BOLT) Transport Under construction 26.38
Project
Clinker handling jetty at Azhicode/Kodungallur
(BOOT) Transport Pre-construction 7.76
Port
Ponnani Port Project - Phase I (BOT) Transport Under construction 118.43
Operation and
Road Upgradation (Thiruvananthapuram) Project (BOT) Annuity Transport 16.29
maintenance stage
Development and operation of an international
ship repair facility at W/island with private sector (BOT) Transport Under construction 77.6
participation
International Container Transhipment Terminal
(DBFOT) Transport Under construction 328.74
(Cochin Port) Project
Vizhinjam International Deepwater Multipurpose
(DBFOT) Transport Under construction 634.67
Seaport
Operation and
Tindivanam to Ulunderpret on NH-45 Road (BOT) Transport 137.75
maintenance stage
Source: DEA, Ministry of Finance, Government of India, BOT: Build-Operate-Transfer, BOLT: Build-Own-Lease-Transfer, BOOT: Build-Own-Operate-Transfer, DBFOT: Design-Build-
Finance-Operate-Transfer,
30 KERALA For updated information, please visit www.ibef.orgDEVELOPMENT PROJECTS: KEY PUBLIC-PRIVATE
PARTNERSHIP (PPP) PROJECTS … (2/2)
Project name Sector PPP type Stage Project cost (US$ million)
Operation and
Thavakkara Bus Station (BOT) Transport 5.12
maintenance stage
Road Upgradation (Walayar-Vadakkancherry) Operation and
(DBFOT) Transport 122.62
Project maintenance stage
Operation and
Crude Oil Handling for Kochi Refineries Ltd (Lease) Transport 109.168
maintenance stage
Operation and
Cochin International Airport (BOO) Transport 47.03
maintenance stage
Bus Terminal Complex (Thiruvalla) Project (BOT) Transport Under construction 6.42
Operation and
Bus Terminal (Angamaly) Project (BOT) Transport 5.18
maintenance stage
Aircraft Maintenance Hangar (Kochi) (BOO) Transport Under construction 18.62
Source: DEA, Ministry of Finance, Government of India, BOT: Build-Operate-Transfer, BOO: Build-Own-Operate, DBFOT: Design-Build-Finance-Operate-Transfer
31 KERALA For updated information, please visit www.ibef.orgDEVELOPMENT PROJECTS: SEZS … (1/3)
Kerala State
Information KSITI, Kasargod
Technology
Infrastructure Limited Kerala Industrial Infrastructure Development Corporation Limited (KINFRA)
(KSITI), Kannur
KINFRA, Kakkancherry
Sutherland Global Services
Hindustan News Print
Infopark
Limited
Cochin Port Trust, Puthuvypeen
Cochin Port Trust, Vallapadom KSITI, Pallipuram
KINFRA, Kochi KSITI, Purakkad
Unitech Real Estate
Electronics
Parsavnath Developers Technology Park
Smart City Infrastructure KINFRA
Carborundum Universal Limited Techno Park SEZ - I
MM Tech Towers, Alwaye KSITI, Kollam
Technopark
Pallipuram
Emmar MGF, Alwaye
Techno Park SEZ - II
Source: Ministry of Commerce & Industry, Government of India,
32 KERALA For updated information, please visit www.ibef.orgDEVELOPMENT PROJECTS: SEZS … (2/3)
As of December 2017, Kerala has 19 exporting SEZs.
Name/Developer Location Primary industry
Cochin SEZ Cochin Multi-product
Cochin Port Trust Vallapadom Port-based
Cochin Port Trust Puthuvypeen Port-based
Infopark Kakkanad IT/ITeS
Electronics Technology Parks - Kerala Attipura IT/ITeS
KINFRA Ayiroopara Animation & Gaming
KINFRA Chelembra Agro-based food processing
Electronics Technology Parks- Kerala Thiruvanthapuram IT/ITeS
KINFRA Thrikkakara Electronics industries
Kerala State Information Technology Infrastructure Limited Pallipuram IT/ITeS
Electronics Technology Parks Kerala (Technopark) Attipura IT/ITeS
Kerala State Information Technology Infrastructure Limited Mulavana IT/ITeS
Carborundum Universal Ltd. Thrikkakara North Solar Photovoltaic
Sutherland Global Services Private Limited Thrikkakara North IT/ITeS
Kerala State Information Technology Infrastructure Limited (KSITIL) Pantheerankavu and Nellikode IT/ITeS
Infoparks Kerala Puthencruz and Kunnathunadu IT/ITeS
Smart City (Kochi) Infrastructure Limited Kakkanad IT/ITeS
Kerala State IT Infrastructure Ltd. (KSITIL) Thrissur IT/ITeS
Uralungal Labour Contract Cooperative Society Limited (ULCCS LTD) Kozhikode IT/ITeS
Source: Ministry of Commerce & Industry, Department of Commerce, SEZ: Special Economic Zone
33 KERALA For updated information, please visit www.ibef.orgDEVELOPMENT PROJECTS: SEZS … (3/3)
As of December 2017, Kerala had 29 SEZs with formal approval and 25 notified SEZs.
Some of formally approved SEZs in Kerala
Name/Developer Location Primary industry
Cochin Port Trust Vallarpadam Port-based
Cochin Port Trust Puthuvypeen, Ernakulam Port-based
Kazhakoottam,
KINFRA Electronics Industries
Thiruvananthapuram
Smart City (Kochi) Infrastructure Pvt Ltd Kakkanad, Ernakulam IT/ITeS
Pantheerankavu
Kerala State Information Technology Infrastructure Ltd (KSITIL) IT/ITeS
and Nellikode, Kozhikode
Infoparks, Kerala Kunnathunad, Ernakulam IT/ITeS
Cochin International Airport Ltd Ernakulam Airport-based
Source: Ministry of Commerce & Industry, Department of Commerce, SEZ: Special Economic Zone
34 KERALA For updated information, please visit www.ibef.orgSOCIAL INFRASTRUCTURE – EDUCATION … (1/2)
Kerala has the highest literacy rate among all states in the country. Educational infrastructure (2016)
As of 2016, the state has a literacy rate of 94.57%; male & female
literacy rates stood at 96.61% & 92.52%, respectively. Schools 12,981
Kerala has 3,021 higher secondary schools as of 2016. Of these, Universities 14
1,162 (38.46%) were government schools, 1,406 (46.54%) aided
Engineering institutions 183
schools & the remaining 453 (15%) unaided schools.
Arts and science colleges 213
As per budget 2018-19, 45,000 hi-tech class rooms and IT labs will
be established in 4,775 schools. The digitalisation will be completed Polytechnics 51
in 3 phases with 20,000 class rooms being completed before the end Source: Economic Review of Kerala
of February, 10,000 class rooms in March and remaining 15,000
class rooms in the months of April – May. Sub sectors Budget 2018-19 (US$ million)
In Budget 2018-19 US$ 5.10 million is allocated for ‘Kerala School education 149.83
Infrastructure and Technology for Education’ which is heading the
Higher education 121.87
digitalisation programme.
In June 2017, the University of Kerala decided to restore private Technical education 38.31
registrations at undergraduate level. A University Institute of Total 3,170.82
Management (UIM) and eight University Institutes of Technology
(UITs) are to be established in various cities of the state this fiscal Source: State Budget 2017-18, (1) 2016-17, Converted 1USD=64.74Rs
year.
35 KERALA For updated information, please visit www.ibef.orgSOCIAL INFRASTRUCTURE – EDUCATION … (2/2)
Kerala primary education statistics (2014-15)
Lower primary: 6,882
Schools (No) Upper primary: 2,979
High schools: 3,021
Lower primary: 0.35
School dropout rate (%) (2013-14) Upper primary: 0.21
High school: 0.44
Pupil-teacher ratio 22.5:1
Nature of schools (2016-17P) Student strength (in million) Share of total student strength (%)
Government 1.12 30.42
Government-aided 2.15 58.27
Unaided 0.41 11.30
Total 3.70 100.0
P: Provisional
Source: Economic Survey of Kerala 2014-15, 2016-17
36 KERALA For updated information, please visit www.ibef.orgSOCIAL INFRASTRUCTURE – HEALTH
The departments that offer health services in the state & are Health indicators (2017)
responsible for development activities are namely, Health Services
Department, Medical Education Department, Ayurveda Department Birth rate
(1)
14.3
(ISM), Ayurveda Medical Education Department, Homoeopathy (1)
Death rate 7.6
Department & Homoeopathy Medical Education Department.
(2)
Infant mortality rate 10
In Budget 2018-19, the state government allocated US$ 1,339.51
million for medical and public health department.
Under the 12th Five Year Plan, the state proposed an outlay of US$ Life expectancy at birth (years) (2014-15)
650.71 million for health sector, of which US$ 295.05 million was
proposed for the Directorate of Health Services, US$ 272.61 million for
Male 71.4
Directorate of Medical Education & US$ 28.02 million for Indian
System of Medicines. Female 76.3
Government of Kerala announced plans to invest US$ 1.68 million for
the establishment of a cath lab in the district hospital at Kollam & the
Health infrastructure (as of March 2018)
general hospital of Kozhikode as per the annual state budget 2016-17.
Further, the state government also allocated US$ 79.7 million to the
Primary health centres 954
Directorate of Health Services to facilitate implementation of different
schemes. Sub-centres 5,841
As of November 2016, the state was declared as the 3rd Open
Community health centres 233
Defecation Free state in the country.
In March 2017, True North, a leading PE fund, announced plans to District hospitals 58
invest over US$ 200 million in Kerala Institute of Medical Sciences.
Note: (1)Per thousand persons, (2)Per thousand live births
Source: Economic Review of Kerala, 2017, State Budget 2016-17, 2017-18, NHRM, Sample Registration System (SRS)
37 KERALA For updated information, please visit www.ibef.orgCULTURAL INFRASTRUCTURE … (1/2)
Kerala has been rated as one of the 13 Paradises of the World by Popular tourist locations
National Geographic Traveller; it has been promoted as ‘God’s Own
Country’.
Beaches Kovalam, Varkala, Marari, Bekal and Kannur
Sri Padmanabhaswamy temple makes the state one of the attractive
religious tourism spots in India. Other temples in Kerala, such as Kumarakom, Alappuzha, Kollam, Kochi and
Backwaters
Guruvayoor & Sabarimala, are also major religious attractions. Kozhikode
US4 2.32 million was allocated in budget 2017-18 for the promotion
Hill stations Ponmudi, Munnar, Wyanad and Vagamon
of Nishagandhi dance and music festivals, Onam celebration, tribal
dance festival, Pooram, Theyyam festivals and boat race etc. Periyar Wildlife Sanctuary,
In June 2015, Kerala organized a road show in Shanghai & Eraviikulam National Park,
Wildlife reserves
participated in Beijing International Tourism Expo (BITE) 2015. The Thattekad Bird Sanctuary
BITE 2015 witnessed participation of 70 buyers from the Chinese Parambikulam Wildlife Sanctuary
travel & tourism industry. The main objective of the initiative was to
strengthen the Spice Route heritage with other countries & promote
Budget 2018-19
sustainable tourism aimed at achieving world peace. Departments
(US$ million)
In June 2017, the state government started a campaign ‘Anuyatra’,
for people with special needs. In this campaign, 23 children suffering Sahithya Academy, Kerala Sangeetha Nadaka
Academy, Kerala Lalithakala Academy and 2.46
from various challenges will become brand ambassadors of the
Kerala Folklore Academy
initiative.
Arts and Cultural fields 22.24
State Central Library 0.56
Kerala State Science and Technology Museum 2.63
Development of Zoos 1.78
Source: State budget, Converted 1USD=64.74Rs
38 KERALA For updated information, please visit www.ibef.orgCULTURAL INFRASTRUCTURE … (2/2)
Art and culture are being fostered and promoted through various New sports infrastructure projects in Kerala
bodies such as: New hockey stadium at Kollam
• Kerala Sahitya Academy – To promote Malayalam literature.
Rajiv Gandhi Indoor Stadium, Kochi
• Kerala Sangeetha Nataka Akademi – To promote traditional arts.
Shooting range at Vattiyoorkkavu, Thiruvananthapuarm
• Kerala Lalithkala Academy – To promote painters and sculptors.
Corporation Stadium, Kollam
• Kerala Folklore Academy – To promote Kerala folklore.
V.K.N. Indoor Hall, Thrissur
• Kerala State Chalachitra Academy – Academy for motion
pictures. VKK Menon Stadium, Kozhikode
• Kerala Kalamandalam – To teach traditional dances.
CSN Stadium, Thiruvananthapuram
The state government proposed an outlay of US$ 22.24 for art and
New football stadium at medical college ground, Kozhikkode
culture million under annual budget 2018-19.
On November 1, 2016, the state celebrated the 60th year of its New multipurpose hall, Kannur
formation. Kariavattom main stadium, Thiruvananathapuam
Synthetic Athletic track at University of Calicut, Malapuram (Approved under
Urban Sports Infrastructure Scheme (USIS))
Source: Department of Tourism, Government of Kerala, Economic Review of Kerala 2014-15
39 KERALA For updated information, please visit www.ibef.orgINDUSTRIAL INFRASTRUCTURE … (1/3)
As of September 2017, Kerala had 29 SEZs with formal approval and 25 notified SEZs. A cyber-park spread over a 68 acre campus is being
developed in Kozhikode.
Infrastructure Project description
The Technopark at Thiruvananthapuram is spread over 760 acres.
It currently hosts over 300 IT and ITeS companies, employing over 46,000 IT professionals.
Technopark Phase-II has been declared an SEZ by the Government of India.
Technopark
The technology park is spread across 7.2 million sq. ft. built-up space (completed) and 3.5 million sq. ft. (work-in-
progress)
As a part of the Phase-IV, named Technocity, Technopark is developing 431 acres of land in Pallippuram, 5 km
north of the main campus on the National Highway-47 to Kollam.
The Infopark at Kochi is best suited for ITeS due to its proximity to the submarine optical-cable landings.
Infopark The total land available with Infopark is 98.25 acres, of which 75 acres has been notified as an SEZ by the Ministry
of Commerce, Government of India.
Apart from the SEZs in Technopark and Infopark, the other SEZs in Kerala include the KINFRA Electronics Park
SEZ in Kalamassery; a multi-product SEZ at Kochi; two port-based SEZs at Vallarpadam and Puthuvypeen at
Special Economic Zones
Kochi; a food processing SEZ near Calicut; a pulp and paper SEZ at Kottayam; and a non-conventional energy
sources SEZ at Kalamassery.
Source: http://www.technopark.org/ , sezindia.nic.in
40 KERALA For updated information, please visit www.ibef.orgINDUSTRIAL INFRASTRUCTURE – INDUSTRIAL
CLUSTERS … (2/3)
Symbol Industries
IT
Engineering
Minerals and mining
Handlooms and power looms
Textile
Tiles
Canning
Coir products
Agriculture and forest-based
Sericulture
Rubber
Food products
Beedi
Source: Maps of India
41 KERALA For updated information, please visit www.ibef.orgINDUSTRIAL INFRASTRUCTURE – INDUSTRIAL
CLUSTERS … (3/3)
District Industries
Kannur Handlooms, power looms, beedi
Alappuzha Coir products
Idukki Agriculture and forest based
Thiruvananthapuram Handlooms, IT
Thrissur Power looms, handlooms, textile, timber, tile, canning
Palakkad Power looms, sericulture
Kollam Minerals and mining
Kozhikode Rubber
Wayanad Minerals and mining
Kasargod Minerals and mining
Kottayam Rubber, food products, engineering
Ernakulam IT
42 KERALA For updated information, please visit www.ibef.orgSMART CITIES
As of June 2017, Kochi and Thiruvananthapuram are proposed to be
developed as smart cities in Kerala. The Kochi smart city would be
spread over an area of 246 acres.
Along with smart cities, 9 cities of Kerala have also been selected for
infrastructure development. The infrastructure development will be
done under the Atal Mission for Rejuvenation and Urban
Transformation (AMRUT) scheme. In July 2015, the state
government allocated US$ 1.47 million for administrative and office
expenses for service level improvement plan or capacity building
under AMRUT scheme.
As per budget 2016-17, the state government is planning to
inaugurate 650,000 square feet space in Kochi smart city, for Thrissur
providing employment to around 90,000 unemployed youth of Kerala.
Smart City Kochi has set a revenue target of US$ 41.79 million for
2017, and US$ 2.40 billion by 2021. Ernakulam
List of cities in Kerala covered under AMRUT Kochin
Cities Area (sq. km)
Kochi 94.88 Tiruvalla
Kollam 58.18
Kollam
Kozhikode 128
Thiruvananthapuram 2,192
Thrissur 101.4
Thiruvananthapuram
Alappuzha 1,414
Palakkad 1,363
Guruvayur 29.66
Kannur 2,961
43 KERALA For updated information, please visit www.ibef.orgKEY INDUSTRIES
Kerala’s strategic location on the trans-national trade corridor, rich Key industries in Kerala
natural resources & simple & transparent procedures are favourably Handlooms and power looms
suited for investments in key sectors like tourism, IT/ITeS,
manufacturing & mining. Rubber
Kerala’s traditional industries include handloom, cashew, coir and Bamboo
handicrafts.
Coir
KINFRA, KITCO Limited (formerly, Kerala Industrial and Technical
Khadi and village industry
Consultancy Organisation Limited), the Directorate of Industries &
Commerce & the Small Industries Development Corporation are jointly Sericulture
responsible for the development of industrial infrastructure in the state.
Seafood and other marine products
Around US$ 35.53 million has been earmarked in the budget 2018-19
for the main parks under KINFRA & KSIDC. Cashew
Forming industrial clusters & developing infrastructure (such as rubber Mining
parks, electronic hardware park, coconut industrial park, organic Tourism
industrial park & food processing parks) have been integral to the
state’s strategies to attract investments in various industries. Food processing
As per budget 2016-17, the MSME sector accounted for higher growth Spices and spice extracts
rate in comparison with other industrial sectors during 2015-16. For
IT & electronics
the development of MSME infrastructure, an amount of US$ 6.96
million was allocated by the state government during 2016-17
The amount allocated to small scale industries by the state
government during 2018-19 is US$ 25.02 million.
Source: Economic Review of Kerala, 2014-15, News articles, State budget 2017-18
44 KERALA For updated information, please visit www.ibef.orgKEY INDUSTRY – COIR AND COIR PRODUCTS … (1/2)
Kerala accounts for 85% of total coir production in India and its coir No. of coir units registered in Kerala as on March 2015
industry provides employment to around 375,000 people.
The Coir Co-operative Marketing Federation (COIRFED) is the apex 10000.0
federation of 842 primary coir co-operatives societies.
8000.0 8,814 8,811
The US is the largest importer of coir products from India, followed
by the Netherlands, the UK, Germany, Italy and Spain. 6000.0
The Coir Kerala trade fair held in February 2015 witnessed the 4000.0
participation of around 170 foreign buyers from over 53 countries.
2000.0
The Coir Board of India facilitates setting up of coir defibering units
3
and coir manufacturing industries in each of the states under various 0.0
schemes such as Coir Udyami Yojana, Development of Production Total Private Public
Infrastructure and Mahila Coir Yojana.
As per budget 2017-18, defibering machines will be provided to coir
co-operative societies at 90% subsidy, to self help groups at 75%
Growth trend of coir units registered in Kerala
subsidy and to individuals at 50% subsidy. The state has a target of
9200.0
opening 100 husk processing mills in 2017-18.
9100.0
As part of the second restructuring scheme the coir cooperative
9,108
9000.0
societies taken up for revival will be provided with working capital
and managerial subsidy. 8900.0
Under state budget 2018-19, US$ 32.59 million is allocated for the 8800.0
8,814
8,790
8,773
coir sector. 8700.0
8,744
8600.0
8500.0
2011-12 2012-13 2013-14 2014-15 2015-16
Source: Economic Review of Kerala, 2014-15, Government of Kerala, Coir Board, News articles, State Budget 2017-18
45 KERALA For updated information, please visit www.ibef.orgYou can also read