Is the Rise in High School Graduation Rates Real? High-Stakes School Accountability and Strategic Behavior - Douglas N. Harris, Lihan Liu, Nathan ...
←
→
Page content transcription
If your browser does not render page correctly, please read the page content below

Is the Rise in High School Graduation Rates Real?
High-Stakes School Accountability and Strategic Behavior

 Photo credit: MD Duran/Unsplash

Douglas N. Harris, Lihan Liu, Nathan Barrett, and Ruoxi Li

March 2020
CONTENTS
Abstract ...................................................................................................................................... 2

I. Introduction .......................................................................................................................... 3

II. Graduation Rate Measures and Data ..................................................................... 9

III. Methods ............................................................................................................................ 18

IV. Results............................................................................................................................... 23

V. Conclusion ........................................................................................................................ 38

References ............................................................................................................................... 40

Appendix A: Graduation Rate Trends by State Types ..................................... 44

Appendix B: Trends in GEDs ....................................................................................... 45

Appendix C: Additional Detail on Louisiana Graduation Rates ................. 46

Acknowledgments............................................................................................................... 58

IS THE RISE IN HIGH SCHOOL GRADUATION RATES REAL? Page | 1
Abstract
High school graduation rates have increased dramatically in the past two decades. Some
skepticism has arisen, however, because of the confluence of the graduation rise and the starts of
high-stakes accountability for graduation rates with No Child Left Behind (NCLB). In this study
we provide some of the first evidence about the role of accountability versus strategic behavior,
especially the degree to which the recent graduation rate rise represents increased human capital.
First, using national DD analysis of within-state, cross-district variation in proximity to state
graduation rate thresholds, we confirm that NCLB accountability increased graduation rates.
However, we find limited evidence that this is due to strategic behavior. To test for lowering of
graduation standards, we examined graduation rates in states with and without graduation exams
and trends in GEDs; neither analysis suggests that the graduation rate rise is due to strategic
behavior. We also examined the effects of “credit recovery” courses using Louisiana micro data;
while our results suggest an increase in credit recovery, consistent with some lowering of
standards, the size of the effect is not nearly enough to explain the rise in graduation rates.
Finally, we examine other forms of strategic behavior by schools, though these can only explain
inflation of school/district-level graduation rates, not rational rates. Overall, the evidence
suggests that the rise in the national graduation rates reflects some strategic behavior, but also a
substantial increase in the nation’s stock of human capital. Graduation accountability was a key
contributor.

Authors
Douglas N. Harris is professor and chair of the Department of Economics and the Schlieder
Foundation Chair in Public Education at Tulane University. He is also founding Director of the
Education Research Alliance for New Orleans, Director of the National Center for Research on
Education Access and Choice (REACH), and a Non-resident Senior Fellow at the Brookings
Institution.
Lihan Liu is a Senior Research Fellow at the Education Research Alliance for New Orleans at
Tulane University. Her research interests include labor economics, economics of education, and
applied econometrics. She holds a Ph.D. in Economics from the University of Wisconsin-
Madison.
Nathan Barrett is the Senior Director of Research and Evaluation at the National Alliance for
Public Charter Schools and a Non-Resident Fellow at the Education Research Alliance for New
Orleans at Tulane University. His research interests in K-12 education include teacher labor
markets, student discipline, and choice and accountability policies.
Ruoxi “Rosie” Li received her B.S. in economics and B.A. in Sociology from Tulane University.
She is currently a first-year Ph.D. student in Economics at Yale University.

IS THE RISE IN HIGH SCHOOL GRADUATION RATES REAL? Page | 2
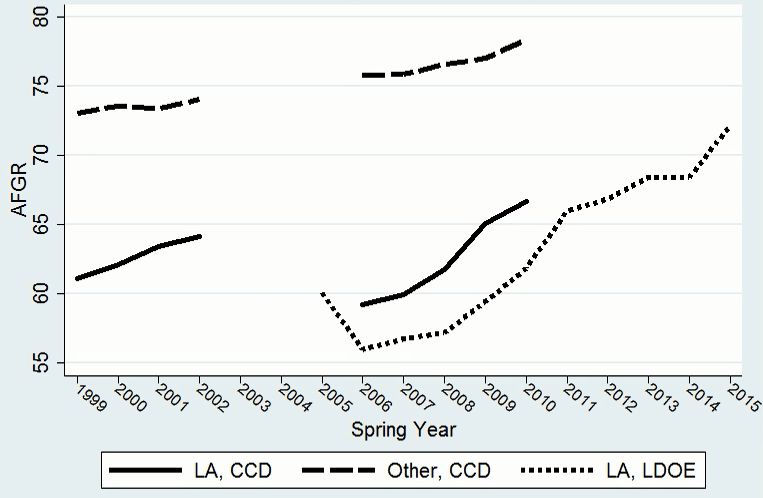
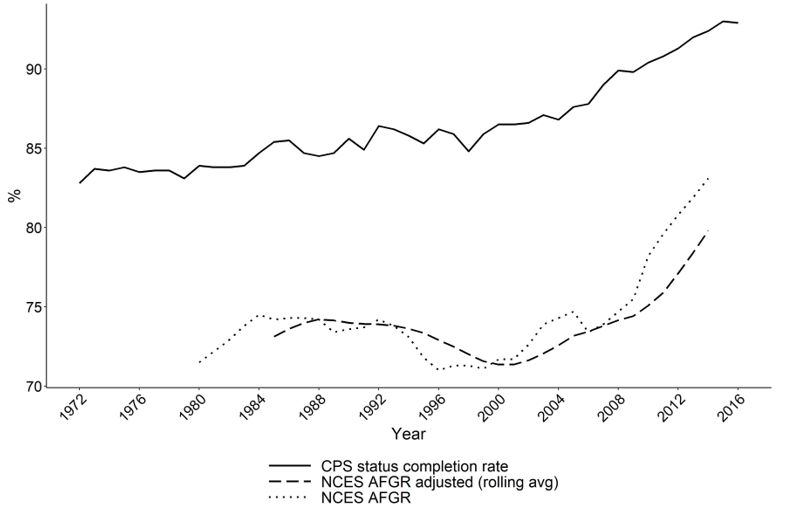
I. Introduction
 High school graduation has long been considered a key marker of human capital

development. The U.S. led the world in high school graduation through the 1960s (Murnane,

2013), which helped drive decades of economic growth throughout the first two-thirds of the

twentieth century (Goldin & Katz, 2008; Gordon, 2015). However, this was followed, in the

1970s through 1980s, by slower growth (Mishel & Roy, 2006) or perhaps even declines in

graduation (Heckman & Lafontaine, 2007). The rest of the world has also been catching up and

the U.S. graduation ranking declined from 1st to 13th (out of 19 countries) in the OECD

(Murnane, 2013).

 While there remains some debate about the graduation trends prior to 2000, there is no

question that U.S. graduation rates began to climb quickly afterwards. The national graduation

rate, calculated from Current Population Survey (CPS) workforce surveys shown in Figure 1,

increased by about 10 percentage points between 2000 and 2016 (OECD, 2012; Murnane, 2013).

President Obama and Secretary of Education, Arne Duncan, touted these as important

accomplishments (Duncan, 2018). However, the low-stakes CPS trend displays a somewhat

different pattern than the two high-stakes trends, reported by the National Center for Education

Statistics (NCES). The growth in the low-stakes graduation rate (or “status completion”) is

almost linear from the 1980s onward, while the NCES graduation rate, based on school-provided

data, increased sharply starting around 2000.1 From 2000-2016, the national high-stakes

graduation measure increased by 18 percentage points, eight points more than in the CPS.

1
 The two measures are not quite on the same scale, which partly explains why the NCES numbers are consistently
about 10 percentage points lower than the CPS. The NCES is the average freshmen graduation rate (AFGR) and
does not include GED and other forms of high school completion. See the figure notes and section II for details.

IS THE RISE IN HIGH SCHOOL GRADUATION RATES REAL? Page | 3
One obvious potential contributor has been a change in federal policy that coincided with the

graduation rate increase. No Child Left Behind (NCLB) became law in 2001 and is well known

for its small or null effects on test scores (Dee & Jacob, 2011). Less recognized is that the

original law also required accountability for high school graduation. At first, states were only

required to include graduation in some fashion; they could set any target and improvement rates

they wished, but those schools that did not meet these goals were threatened with sanction.

Starting in 2010, the U.S. Department of Education (USDOE) started pressuring states to set

higher graduation rate goals (all states set their thresholds above 80% graduation), and requiring

that states generate substantial improvement for schools and districts.2 (States were also required

to adopt the four-year adjusted-cohort graduation rate calculation as the basis for these

calculations.) The timing of these policy changes, during 2002-2010, coincide with the high-

stakes graduation rate increases in Figure 1, suggesting that accountability helped cause the

change. The purpose of this study is to understand the overall effect of accountability on

graduation rates, and to what degree this might reflect an increase in students’ human capital

versus strategic behavior of schools.

 One potential effect is that the NCLB-induced pressure led schools to improve educational

practice in ways that led students to stay in school longer, e.g., increasing teacher quality, doing

more to engage students in school, or helping them see the value of high school for future life

success (Hanushek & Rivkin, 2010; Reback, Rockoff, Schwartz, 2014; Rouse et al., 2013).3 The

additional graduates, in this case, would have experienced more time on task and learned

2
 From 2002-2010, any improvement was a common goal, but, after 2010, typically states required a 2 percent
annual increase. https://www2.ed.gov/admins/lead/account/stateplans03/gradratechart.pdf
3
 Jackson (2018) finds evidence that teachers increase the probability of high school completion and that these
effects are largely unrelated to teacher value-added to test scores.

IS THE RISE IN HIGH SCHOOL GRADUATION RATES REAL? Page | 4
academic, social, and other skills than they would have without the law. In other words, the law

might have increased the stock of human capital.

 Strategic behavior is an alternative explanation. Ample evidence suggests that test-based

accountability has led schools to teach to the test (Koretz, 2009), cheat (Jacob, 2005), and even

change cafeteria food (e.g., Figlio and Winicki, 2005) all in ways that increase scores without

increasing human capital. Consistent with this story, low-stakes NAEP scores have been

increasing much more slowly than high-stakes scores (Koretz, 2009). As Figure 1 suggests, the

same could be happening with graduation rates now that they, too, have become high stakes.

 Two general forms of strategic behavior are possible in this case. First, schools might make

it easier for students to graduate, reducing the quality of credentials. While states set standards

regarding which types of courses student take, schools have considerable autonomy for

determining the content of those courses, the ease of passing them, and, more generally, what

constitutes graduation. Teachers have authority to determine who passes courses and may be

under pressure from school principals to inflate grades and make it easier to pass courses.

Students can also choose between regular diplomas and GEDs, which are widely considered to

be less rigorous than diplomas (Cameron & Heckman, 1993), even if they do seem to benefit

those who obtain them relative to those who drop out with similar baseline skills (Murnane,

Willett & Tyler, 2004).

 Another more recent development is the availability of “credit recovery,” i.e., programs that

help struggling students earn credits for courses they have failed, to stay on track to graduate. In

some of these programs, students can receive course credit simply by passing a state

competency-based test, without meaningful instruction or seat time, similar to the GED

(Heckman & LaFontaine, 2006). Recent evidence suggests that online courses in high school

IS THE RISE IN HIGH SCHOOL GRADUATION RATES REAL? Page | 5
increase high school graduation, but with limited influence on academic achievement (Heinrich

et al., 2019).

 The above degree quality problem can be framed as a concern with the numerator of the

graduation rate. The second potential distortion is with the denominator. Schools control which

students count toward their graduation rate calculation through the exit codes. Since schools

themselves assign these codes, they can remove students from their accountability metrics by

inaccurately assigning certain codes. For example, a recent audit in Louisiana (Louisiana

Department of Education, n.d.) was unable to confirm large numbers of exit codes for students

who were listed as having transferred to private or out-of-state schools, or to home schooling, all

of which removed them from schools’ graduation rate calculations. These exit codes are more

difficult for the state to verify than most others.

 With both forms of strategic behavior—changing graduation requirements and changing

who counts as a potential graduate—the key observation is that the data used to calculate

performance are being created by the schools being held accountable for those measures, with

relatively little oversight or enforcement.4 Anecdotal evidence on the issue does point to

strategic behavior as a real problem. In Washington D.C., credit recovery was used

inappropriately and grading norms began to shift so that essentially all students passed their

courses (McGee, 2018; St. George, 2018).5 In Prince George’s County, Maryland, a state

investigation found improper course grade changes and graduation of students who had absences

from school above the level allowed by state law (St. George and Bui, 2017). In San Diego and

4
 Note that this form of strategic behavior is not reflected in Figure 1 because the AFGR (the only graduation
measure from state-reported data that is available consistently over time) does not remove students receiving these
hard-to-verify exit codes. For this reason, Figure 1 under-states potential accountability distortion. In Louisiana, for
example, the state-reported graduation rate (not the AFGR) increase by 13 percentage points (Perry, Harris, Buerger
& Mack, 2015).
5
 Specifically, teachers sent students home with packets of homework and counted this as course completion; there
were no rules or standards established (McGee, 2018).

IS THE RISE IN HIGH SCHOOL GRADUATION RATES REAL? Page | 6
other school districts in California, the definition of graduation rate did not meet state standards

and inflated the outcome: students who had adult education degrees or passed high school

proficiency exams were counted as graduates, and students who exited the school were

sometimes incorrectly excluded from the calculation of graduation rate (Huntsberry, 2018). In

New Orleans, grades were changed to make it easier for students to pass courses and graduate

(Jewson, 2019).

 In this paper, we test the size and nature of accountability effects using various types of

difference-in-differences (DD) analysis: First, we construct a national state-level data set that

goes back to several years prior to federal accountability requirements. For each state, we

identify the graduation threshold and which districts were below this standard.6 We find that

graduation rates increased more in states that had more districts threatened by sanction; in

models with state fixed effects, we also find that low-graduation-rate districts responded the most

to graduation accountability. These analyses provide evidence that graduation accountability

increased graduation rates.

 Taken together, the above analyses suggest NCLB increased high school graduation. Given

prior evidence of strategic responses to test-based accountability, the divergence of the low- and

high-stakes graduation metrics in Figure 1 provides a prior evidence that not all of the increase

in graduation rates has reflected human capital improvement. Accountability tends to generate

improved outcomes in part through strategic behavior. To provide more direct evidence on the

source of graduation rate increases, we carried out four additional types of analysis.

6
 School-level graduation rates were not available pre-NCLB. Also, for reasons explained later, we cannot use the
same methods as Dee and Jacob (2011) because there was apparently no pre-NCLB cross-state variation in
graduation accountability, as there was with test-based accountability.

IS THE RISE IN HIGH SCHOOL GRADUATION RATES REAL? Page | 7
First, we were able to identify which states required that students pass graduation exams in

order to graduate, at three different time points (2000, 2010, and 2017). Since every student has

to pass the test in order to graduate, schools in states without these exams could more easily

reduce their standards. Therefore, if graduation rate increases were strictly due to strategic

behavior, we would expect the growth in graduation rates to be concentrated in states that did not

have graduation exams. However, we see almost the opposite pattern: graduation rates increased

somewhat more in states with graduation exams. (The potential for quasi-experimental evidence

on this topic appears limited for reasons explained later.) This suggests that lowering graduation

standards is unlikely to be the main explanation.

 Second, we identified reports showing national trends in regular high school diplomas versus

GEDs. Federal graduation accountability guidelines generally exclude GEDs. Apparently as a

result, the number of GEDs has been in a steady decline since NCLB (NCES, 2010; Barshay,

2018). This, again, suggests that the slower increase in CPS graduation is due to a decline in

GEDs and therefore reflects improved credentials rather than lower standards.

 Third, panel data from Louisiana allow us to impute credit recovery courses for individual

students. Specifically, we identify students who retook a course after initially failing it, during a

period when schools had the option of using credit recovery courses. We then tested whether the

trends in these credit recovery courses differed before and after accountability pressures in

Louisiana increased, based on whether schools were threatened with accountability sanctions.

We do find some evidence of an increase in credit recovery in schools threatened by

accountability, though not nearly enough to explain the overall graduation rate increases.

 The above analyses focus on strategic behavior in the numerator. To understand potential

distortion in the denominator, we used detailed Louisiana data to analyze the exit codes that

IS THE RISE IN HIGH SCHOOL GRADUATION RATES REAL? Page | 8
schools used to identify graduates and to exclude students from graduation calculations. Some of

these are difficult for states to verify and are therefore likely candidates for schools seeking to

increase their graduation rates artificially. We see some evidence that graduation rates increased

the use of hard-to-verify exit codes, but these effects are very small relative to the size of the

graduation rate increases, especially in the national numbers. School and district graduation rates

are still subject to distortion through this mechanism, but our interest here is mainly in the

national trends.

 We continue, in Section II, by describing the national state/district-level data and Louisiana

student-level data that we use in our analysis. We also start that section by discussing how

different methods of calculating graduation rates are applied in our analysis, and potential

distortions that arise with each measure, which is necessary later in the interpretation of results.

In section III, we outline our quasi-experimental methods and present results in Section IV.

Section V concludes.

II. Graduation Rate Measures and Data
II.A. Different Rates and Potential Distortion
 Graduation rates can be calculated in many ways, and several of these are useful in our

analysis. The three key distinguishing features are: the method of calculation, the data source,

and the government/geographic unit (school, district, state, etc.).

 The CPS calculates the percentage of 18- to 24-year-olds not enrolled in high school or a

lower education level who hold a high school diploma or an alternative credential, such as a

GED. This rate includes all civilian, noninstitutionalized individuals 18- to 24-year-olds who

have completed high school, including individuals who completed their education outside of the

IS THE RISE IN HIGH SCHOOL GRADUATION RATES REAL? Page | 9
United States.7 This is what we reported in Figure 1. Because it is the only consistent measure

available over many years, we also use it when we test for the role of graduation exams. While

not the focus of our study, there has been debate about the degree to which the CPS status

completion rate might be biased due to the exclusion of military personnel and incarcerated

adults,8 and the degree to which the trends reflects GEDs versus regular diplomas (Heckman &

Lafontaine, 2007; Mishel & Roy 2006).9

 Next, we turn to the various graduation measures created from National Center for

Education Statistics (NCES) data that are reported by schools. The average freshmen graduation

rate (AFGR) divides the number of students receiving regular high school diplomas in a given

year by the simple average of the number of 8th, 9th, and 10th graders in the same government unit

four, three and two years earlier, respectively. The obvious problem with this approach is that it

does not measure exits directly, or even try to distinguish between legitimate and non-legitimate

ones. Instead, exits are captured, only indirectly, in the enrollment figures.10 Nevertheless, this is

the only measure, other than CPS, that is available pre- and post-NCLB. Thus, it is also reported

in Figure 1 and used in the national state-level and district-level DD analysis.11

7
 Data Source: U.S. Department of Commerce, Census Bureau, Current Population Survey (CPS), October.
NCES Definition of status completion rate: https://nces.ed.gov/programs/dropout/ind_03.asp.
8
 Another issue of debate has been the role of immigration in influencing the status completion rate, since maybe
people in the 18-24 range had no experience in U.S. high schools (Heckman & Lafontaine, 2007; Mishel & Roy,
2006). Immigration could affect the status completion even though it does not reflect changes.
9
 Mishel and Roy (2006) rely mainly on the National Educational Longitudinal Survey (NELS), but this data source
is not useful in our analysis.
10
 If a student exits for any reason, this reduces enrollment, which reduces the denominator. Because enrollments
only count for 8th-10th graders, whether the exits affect the AFGR depends on which grades they occur in and the
exact timing vis-à-vis the enrollment “count day.”
11
 While they use different definitions, the AFGR numbers closely track the ACGR, at least in the aggregate. For
instance, in 2012-13, there was less than one percentage point difference between the AFGR (81.9%) and the ACGR
(81.4%) (Source: https://nces.ed.gov/blogs/nces/post/what-is-the-difference-between-the-acgr-and-the-afgr).

IS THE RISE IN HIGH SCHOOL GRADUATION RATES REAL? Page | 10
While the AFGR is created from school-reported data, this measure is not what most states

used, nor has it ever been high-stakes. Pre-NCLB, thirty states reported the NCES graduation

rate (NCES-GR), as recommended by the U.S. Department of Education. The NCES-GR is the

number of graduates divided by the number of graduates plus the number of 12th graders who

dropped out that year, plus the number of 11th graders who dropped out the prior year, and so on

down to the 9th graders from four years earlier.12 The NCES-GR reflects an assumption that all

students either graduate or drop out.

 The current federally mandated standard for graduation rates is the adjusted cohort

graduation rate (ACGR). The ACGR divides the number of graduates by the number students

enrolled in the same school or government unit in their freshmen year or who transferred in,

while subtracting from the denominator the legitimate exits, i.e., those who left the government

unit for legitimate reasons that completely remove the students from the graduation calculation,

as if the students had never entered the exiting school (see examples below). Non-legitimate exits

count against the government unit. Dropout is the most common non-legitimate exit. When

students drop out, this reduces the graduation rate. Missing data are also counted as non-

legitimate exits. The calculation of the ACGR became the federally required method of

calculation in 2010, in part because of improvements in data systems that allowed schools to

track individual students over time. The ACGR calculations are impossible without such detailed

data and were impossible to make on a national scale before NCLB (or for many years

afterwards).

12
 Pre-NCLB, another 10 states used something close to the ACGR. Finally, five states used alternative rates (see
notes to Table 1).

IS THE RISE IN HIGH SCHOOL GRADUATION RATES REAL? Page | 11
Partly because accountability places pressure on schools to raise graduation rate, a key

measurement problem is that non-legitimate exits might be miscoded as legitimate exits, e.g., a

dropout is coded as a transfer. In cases where schools have incentives to inflate graduation rates,

this is especially likely with legitimate exits that are difficult for states to verify. Based on our

conversations with school leaders, the three most difficult-to-verify legitimate exits are: transfers

to public schools outside the geographic unit, transfers to private schools, and transfers to home

schooling. In all three cases, the transfers are moving the student into systems that are outside the

control of state agencies (e.g., private schools), reducing verifiability. Note that these same issues

apply to both the ACGR and the NCES-GR. While the latter focuses on graduates and dropouts,

schools were allowed to eliminate legitimate exits. The potential for miscoding is even greater in

the NCES-GR because state agencies had no way of checking any of the exit codes were indeed

legitimate; with the ACGR, it is possible for state agencies to check transfers to other public

schools, for example.13

 Table 1 summarizes the calculation and potential distortions in each of the four graduation

rate calculations. There is only one option for measuring graduation with the CPS data: status

completion at the state/national level. The AFGR, too, is only available at the state/national level.

The NCES completion rate and ACGR can be calculated at the school/district level or aggregated

up to the state/national level.

 As the table shows, all four measures are subject to strategic behavior in the numerator, i.e.,

to schools lowering their standards and making it easier for students to graduate. However, the

potential strategic behavior with the denominator varies across measures. There is essentially no

13
 This difference is less about the method of calculation than it is about the extent of data necessary to carry out the
calculation. The ACGR requires more fine-grained distinctions in exit codes than the NCES-GR. Given the same
data, the potential for validity checks by state agencies is the same for both measures.

IS THE RISE IN HIGH SCHOOL GRADUATION RATES REAL? Page | 12
way to distort the CPS denominator because it includes the entire population (or really a random

sample of that population). In contrast, with the NCES-GR and the ACGR, there is an incentive

to code non-legitimate exits (especially dropouts) as legitimate exits. This incentive for schools

also affects the state/national calculations; dropouts who are miscoded by schools as transfers to

out-of-state public, private, and homeschooling are also miscoded as such when the data are

rolled up to the state level. With the AFGR, the only way to increase the rate through the

denominator is to is to reduce 8th-10th grade enrollments, but this would be counter-productive

since school funding is partially based on enrollments. So, while there may be errors in the

AFGR, they should not be induced, directly or indirectly, by accountability.14

 In light of the above analysis, it is worth taking a second look at the trends in graduation

rates in Figure 1. The above analysis leads to the important conclusion that the denominators of

the CPS and AFGR are unlikely to be distorted, so that the differences in the trends almost has to

be due to distorted numerators. In addition to relaxed graduation standards for any given

credential, the fact that the AFGR excludes GEDs, and the CPS includes them, could mean that

the larger increase in the AFGR in Figure 1 reflects schools shifting students away from GEDs

toward regular diplomas. Such a shift would not show up in the CPS figures, which counts them

equally, but it would show up in the AFGR.

 This discussion of different graduation calculations argues for the use of multiple graduation

calculations. By analyzing multiple measures, each with different distortions and available over

14
 It is conceivable, not especially likely in our view, that distortions in the NCES-GR and ACGR could show up
indirectly in the AFGR. If the incentives created by the NCES-GR and ACGR led schools to push students out (e.g.,
transfer to private schools) in 8th, 9th, or 10th grade, then this would reduce enrollment levels and therefore inflate
the AFGR. However, the incentive with the NCES-GR and ACGR is to miscode non-legitimate exits, not to increase
exits overall.

IS THE RISE IN HIGH SCHOOL GRADUATION RATES REAL? Page | 13
different time frames, we can better understand the nature of strategic behavior and therefore the

degree to which the rise in the graduation rate reflects strategic behavior versus human capital.

II.B. National District-Level and State-Level Data
 Using data from the Common Core of Data (CCD), we calculated the AFGR for all districts

in the United States. We restrict the sample to those districts that have at least two years of

graduation rates available prior to graduation accountability (1999-2002) and afterwards (2006-
 1516
2010). This yields 4,557 districts in 34 states included in the district-level analysis, or about

40 percent of all districts in the country.17 The post-treatment years stop in 2010 because, at that

point, the law required a switch from the AFGR to cohort graduation rates (CGR), which creates

issues of comparability.18 Also, it does not appear that the cohort graduation rates are available

post-2010 at the district level on a national scale.

 The state-level data set analysis is constructed by taking a weighted average of the district-

level graduation up to the state level. Our analysis also sometimes includes additional control

variables. The district-level expenditure variable is from Common Core of Data (CCD) finance

data files19 and the district-level poverty variable comes from Census Bureau.20

15
 This is, specifically, the “Local Education Agency (School District) Universe Survey Dropout and Completion
Data.” See: https://nces.ed.gov/ccd/drpagency.asp.
16
 The years 2003-2005 are excluded from the analysis mainly because: (a) the data available from 2003-2005 are
incomplete and would thus require either an unbalanced panel with a shifting sample or a balanced, but small
sample; and (b) 2003-2005 is a period of transition for many states that saw large number of revisions of state
accountability policies to meet the federal standard. As a result, these years are not very informative about the policy
effects. We also drop the year 1998 from all parts of the analysis because these data display unusual patterns that
call into question their validity. For each district, we imputed missing graduation rates using linear interpolation
(separately for pre and post treatment years). The same imputation method was also applied to poverty rate and per
pupil expenditure.
17
 The included states are AK, AL, AZ, AR, CT, DE, GA, ID, IL, IA, LA, MA, MD, ME, MN, MO, MS, MT,
ND,NE, NJ, NM, OK, OR, PA, RI, SD, TN, UT, VT, WI , WV,WY. Within these states, roughly 5 percent of
districts having missing data in some years, which we imputed (linear interpolation).
18
 We considered constructing AFGR graduation results from underlying data but the USDOE stopped reporting the
number of graduates by district after 2010.
19
 https://nces.ed.gov/ccd/f33agency.asp
20
 https://www.census.gov/did/www/schooldistricts/data/poverty.html

IS THE RISE IN HIGH SCHOOL GRADUATION RATES REAL? Page | 14
Table 2 summarizes the years of the pre- and post-treatment data we use in the analysis, in

relation to the changes in policy. As the middle column shows, we use 1998-99 and 1999-00

(spring years) as the pre-treatment years. As a robustness check, we also follow Dee and Jacob

(2011) and use 2000-01 and 2001-02 academic years as the pre-treatment years. While NCLB

passed in 2001, the law was not implemented until after 2003 (Swanson 2003). The results are

very similar when we use 1998-99 and 1999-00.

II.C. Louisiana Credit Recovery and Exit Code Data

 Louisiana is a useful state to study because the Louisiana Department of Education (LDOE)

has one of the older and more extensive student-level data systems in the United States, which

allows for more precise understanding of graduation rates. Below, we discuss both the credit

recovery data and the exit codes.

 We cannot, unfortunately, identify credit recovery courses directly because the Louisiana

transcript data do not distinguish these from other in-person courses. What we can observe is

whether students take more than one math class in a year, during a time when we know online

credit recovery courses were available. This measure might over-count credit recovery because

students might have retaken courses in traditional classroom settings and formats. However, our

conversations with school principals, and other evidence below, suggest our approach is a

reasonable approximation. As described later, we are primarily interested in the changes in these

courses after accountability ratcheted up, so our assumption is that these marginal courses are

credit recovery.

 Next, we discuss the exit code data. State-defined student exit codes include dozens of ways

students can leave school, including various forms of credential completion and non-completion,

for the 2001-2015 spring years. As shown in Table 3, in Louisiana, the most common type of

IS THE RISE IN HIGH SCHOOL GRADUATION RATES REAL? Page | 15
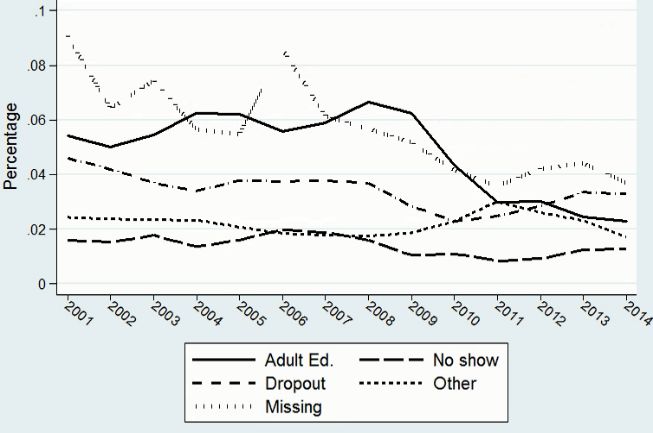
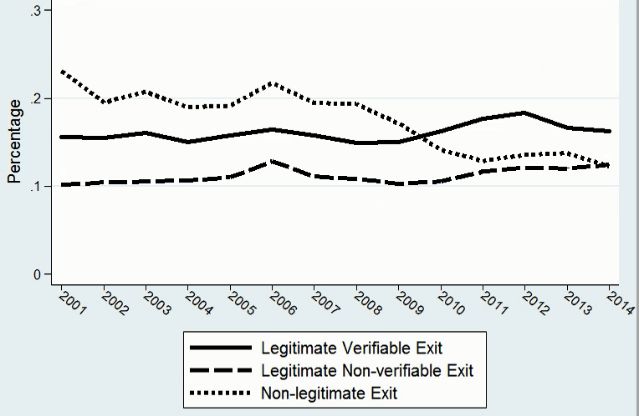
completion by far is graduation with a diploma (49.9 percent of all exits).21 Other forms of

completion include GED (2.7 percent), certificate of achievement (0.9 percent), and other forms

of completion (sum to 1.5 percent). Some of the exits without completion are considered by the

state to be “legitimate” meaning the student is removed from the denominator for purposes of the

cohort graduation rate and therefore removed from the school’s official responsibility. The most

common legitimate exit codes are: transfer to other public schools within state (16.0 percent of

all exits), transfer out of state (7.4 percent), transfer to home study (2.0 percent), and transfer to

private school (1.9 percent).22 All other exits are considered non-legitimate and are counted

against the school. The most common are missing (5.8 percent), transfer to adult ed (4.7 percent

of all exits), dropout (3.4 percent) and no show (1.4 percent), and, expelled (
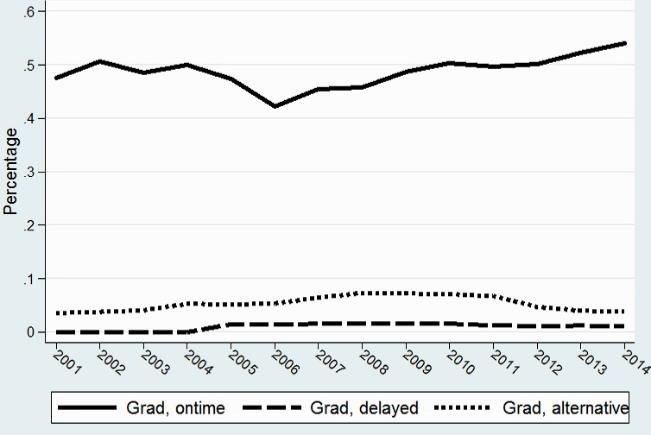
student-level longitudinal data system, is to verify that students have transferred between public

schools within the state, which can be verified directly in the state data.

 Three legitimate codes are particularly difficult for the state to verify: transfers out of state,

transfers to private schools, and transfers to home study, which collectively comprise 11.3

percent of the all exits. The state requires schools to keep written justification for these codes24

and carries out small-sample audits to check their validity. One recent audit was unable to verify

large numbers of these exits, suggesting they are being used inappropriately (Louisiana

Department of Education, n.d.).25 When families seek to home school their children, they are

required to fill out a form, but this form is so simple that some education leaders have expressed

concern to us that schools are having families fill these out even when students are really

dropping out. Schools seeking to reduce their denominator for graduation index and cohort

graduation rate calculations could overstate the number of legitimate-unverifiable exits codes to

increase their measured cohort graduation rates.

 Because there are several important broad categories of exit, we organize the variables into

six groups. We define three different forms of completion: on-time with regular diploma,

delayed graduation with a regular diploma, and alternative completion such as GED (regardless

of whether completion is late). Among the non-completion exits are legitimate exits and these

are further separated into the verifiable and non-verifiable groups. All remaining exit codes are

24
 The federal government is unclear on what constitutes written justification. In private communication, LDOE
indicates that, for transfers to home study (home schooling), schools are supposed to provide a copy of parents’
applications for home. For transfers to private schools or other states, they are supposed to provide a written request
for the students’ records from the receiving school.
25
 The audit involved asking schools to submit paperwork for random subsets of students to whom these hard-to-
verify codes were given. During the period of analysis, these audits were not done regularly. Since then, and at the
time of this writing, the audits have been carried out annually. Also, over the past three years, the data for every
student with a transfer to homeschooling exit code have been audited (not just a sample).

IS THE RISE IN HIGH SCHOOL GRADUATION RATES REAL? Page | 17
non-legitimate exit codes (mostly dropouts and missing exit codes), which schools have

incentives to avoid as they do not remove students from the denominator of the graduation rate.

 In Louisiana, schools can update student exit codes through October 1 of the subsequent

academic year (four months after the school years ends), to address conflicts within the Student

Information System (SIS). We therefore have to use the 2014-15 data to verify 2013-14 exit

codes. Thus, the 2014 graduating class is the most recent available one, leaving an analysis

sample that covers 9th graders for the years 2000-01 through 2010-11 (i.e., the 2004 through

2014 graduating classes). (Throughout the remainder of the paper, years refer to the spring so

that 2013-14 is shortened to 2014.) We also limit the analysis to school districts that were less

affected by Hurricanes Katrina and Rita since these events heavily influenced graduation rates in

2005.26

III. Methods
III.A. National Cross-State Difference-in-Differences Analysis

 We study the effects of accountability on graduation rates using differences-in-differences

(DD). NCLB allowed each state to set its own graduation objective (instead of 100%

proficiency), so we estimated a model that interacts the Post indicator with a continuous variable

capturing the percentage of districts in the state that were below the state-determined graduation

goal just before NCLB became law ( ). This involves, first, calculating district graduation rates

according to each state’s own graduation rate definitions and, second, comparing these district

graduation rates to each state’s own NCLB-based graduation goals, yielding the percentage of

26
 There are only 68 regular districts operating continuously over this period. We included all districts in the
calculation of Louisiana graduation trends, since this is what the state and federal government publicly report. Later,
we restrict only to regular school districts.

IS THE RISE IN HIGH SCHOOL GRADUATION RATES REAL? Page | 18
treated districts in each state that are threatened with sanctions, which is a measure of the

intensity of graduation accountability.27 This yields the following:

 = + ( × ) + + + (1)

where is the graduation rate of the relevant state s in period t; is state percentage of

districts that are below the state accountability standard; is an indicator for the post-

treatment (graduation accountability) period, which does not vary across geographic units within

years; is a set of time-varying independent variables pertaining to the government unit;

is a vector of geographic unit fixed effects (state or district), and is a government unit-level

iid random error.

 In most cases, we are primarily interested in as an unbiased estimate of overall

accountability pressure. However, ̂ is only unbiased so long as is conditionally exogenous;

that is, the state governments did not set their accountability goals based on anything that is

correlated with the change in the future graduation rate. This might be violated if, for example,

more ambitious states institute additional programs at the same time that graduation

accountability increases. On the other hand, if state-level “ambition” varies across states, but it is

fixed over time within them, then this would not introduce bias.

 We cluster the standard errors at the state level. Also, we weight states by their size so that

the estimates are useful in gauging the contribution of accountability to the national increases in

(low-stakes) high school graduation noted in Figure 1. To address the remaining limitations of

27
 The sources of the state graduation goals and definitions are Christie (2005), Swanson (2003), and eed.state.ak.us.
Though we use the state’s own pre-NCLB definition of graduation to determine who is above and below the goal,
we still use the AFGR as the dependent variable ( ) in (1). Also, for states with > 0.25 (AL, AR, LA, SD, TN,
and WY), we restrict treatment assignment to the bottom 25 percent of districts only, under the assumption that
states are unlikely to place pressure on a larger share of districts.

IS THE RISE IN HIGH SCHOOL GRADUATION RATES REAL? Page | 19
the above approaches we also use a second method, which, as explained below, also estimates a

somewhat different set of parameters.

III.B. National Cross-District, Within-State Analysis

 The above cross-state analysis provides some evidence about the effects of graduation

accountability, but the reliance on the share of threatened districts suffers from the fact that the

share of districts threatened may be endogenous. We therefore add a second type of analysis

using within-state variation in district graduation and proximity to NCLB adequate yearly

progress thresholds. In section III.A, we explained how we determined whether districts were

below or above the state-defined goal, to measure . We use the same underlying information

about districts in the district-level analysis (albeit without the above endogeneity problem).

 The following model provides an estimate of the effect of graduation rate accountability

policy using district-level variance:

 = + ( × ) + + + (2)

This is similar to (1) except that d indexes school districts (replacing the state index s) and

therefore represents district fixed effects. In this case, is an indicator set to unity for

districts whose graduation rate in the pre-NCLB era was below the state-determined post-NCLB

goal. Here, the endogeneity issue is quite unlikely because it is the state that chooses the

performance threshold and therefore assigns .

 District fixed effects absorb state fixed effects, so these estimates come from within-

state variation (no districts switched states). The identifying assumption is the same as (1): that

the pressure faced by districts is accurately reflected in the proximity of their pre-NCLB

IS THE RISE IN HIGH SCHOOL GRADUATION RATES REAL? Page | 20
graduation rate to the state goal. We weight by district size and, again, cluster the standard errors

at the state level (since the policy is still at the state level).28

III.C. Louisiana Analysis

 If there are effects of graduation accountability pressure, then the next issue is whether

educator responses reflect strategic behavior. With more detailed data from the state of

Louisiana, we can test for distortions in both the numerator and the denominator.

 We continue to rely on a DD approach, but change the dependent variable and level of

analysis. We start by using indicators for whether students have taken some version of credit

recovery. As shown in equation (3), this is estimated at the student level (i). We focus here on

low-graduate rate schools reflected by , with clustering by district.

 = + ( × ) + + + (3)

Credit recovery courses were first available in 2010 and graduation accountability increased

during 2011-13, so we use data for the 2009-10 school year (pre-treatment) through 2015-16

(post-treatment).

 We also analyze exit codes using the share of exits in each category (e.g., graduation,

dropout, transfer), this time with data aggregated to the school level. This is reflected in equation

(4)

 = + ( × ) + + + (4)

In both (3) and (4), we identify specific schools that are under threat of graduation-based

sanction in Louisiana (instead of states or districts as in earlier analyses), yielding .

Specifically, identify schools that were ever under the most pressure (those deemed failing at

least once over the panel period) and compared them to schools ever under much less pressure

28
 Unweighted results are very similar and available upon request.

IS THE RISE IN HIGH SCHOOL GRADUATION RATES REAL? Page | 21
(those placed in the highest performance category at least once during the panel).29 As above, we

cluster at the district level since this is the lowest possible source of accountability pressure.

 We estimate (4) with three different combinations of years and average across years (within

the pre- and post-treatment periods) to reduce noise. Panel A in Table 7 averages the first two

available years in our panel, 2000-01 and 2001-02, which occurred prior to any graduation

accountability (and prior to all potential NCLB sanctions), and the post-treatment period

averages the last two years (2012-13 and 2013-14). For these years our estimates of (4) reflect

combined effect of both the early test-focused accountability and the subsequent graduation

accountability.

 To disentangle the effect of test-based accountability and graduation accountability, we

further split the whole panel into two shorter ones. To measure the single effect of test-based

accountability, Panel B maintains the first two years (2000-01 and 2001-02) and uses 2004-05 as

the last year. To measure the single effect of graduation accountability, Panel C uses 2004-05

only as pre-treatment year, but maintains the last two years (2012-13 and 2013-14). We use only

2004-05 because this was the last year that clearly preceded graduation accountability and the

later year, 2005-06, was an unusual year for exits with the hurricanes.

29
 In the early years, the top category was based on a five-star system. Later, it was changed to letter grades, based
on School Performance Scores. The top schools in the analysis had five stars or a letter A at least once. The bottom
category had one star or an F at least once. Schools with middle ratings are omitted. We use the ever-labeled
approach to ensure a balanced panel and because the vast majority of schools ever threatened probably feel some
pressure even in the years when they are not deemed failing.

IS THE RISE IN HIGH SCHOOL GRADUATION RATES REAL? Page | 22
IV. Results
IV.A. Cross-State Analysis

 We begin by reporting the DD estimates of equation (1). Our baseline results use the average

state AFGR for the 1999 and 2000 years as the pre-treatment period and the average of the 2009

and 2010 years as the post-treatment period. As noted earlier, the AFGR is the only measure that

we can consistently measure pre- and post-NCLB; and 2010 is the last year the AFGR is

available.

 The results in Table 4 generally reinforce the idea that accountability has driven the increase

in graduation rates shown in Figure 1. In Column (1), the point estimate on the interaction term

shows that graduation rates increased more post-graduation-accountability in states with more

districts below the state graduation threshold pre -graduation-accountability, though this estimate

is statistically insignificant.30

 It turns out, however, that the results above average together two countervailing effects. As

Dee and Jacob (2011) note, some states had test-based accountability pre-NCLB and others did

not. For those without pre-NCLB test-based accountability, NCLB introduced both test- and

graduation accountability at the same time. Moreover, we might expect that it was harder for

schools to increase graduation if they were increasing test accountability at the same time. With

test-based accountability, students are more likely to be retained in grade which might have

made schooling less enjoyable for students.

30
 The specifications that include time-varying state covariates yield noticeably different results (in absolute value).
We give little attention to these results because, upon closer examination, the covariate coefficients are implausibly
large. This is not unexpected given the relatively smaller number of states, and the use of state fixed effects, which
estimate the other covariates from (usually quite small) within-state changes over time.

IS THE RISE IN HIGH SCHOOL GRADUATION RATES REAL? Page | 23
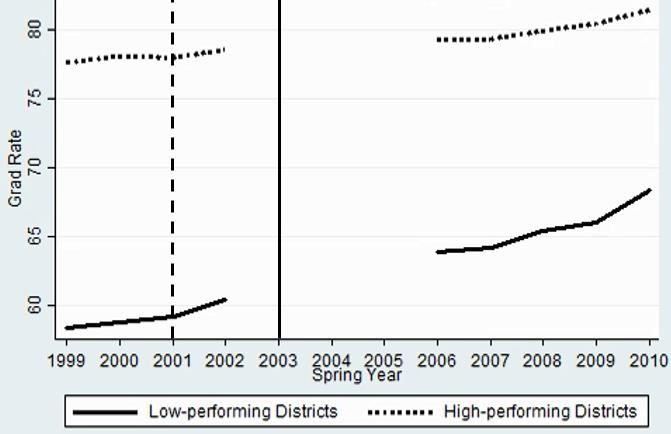
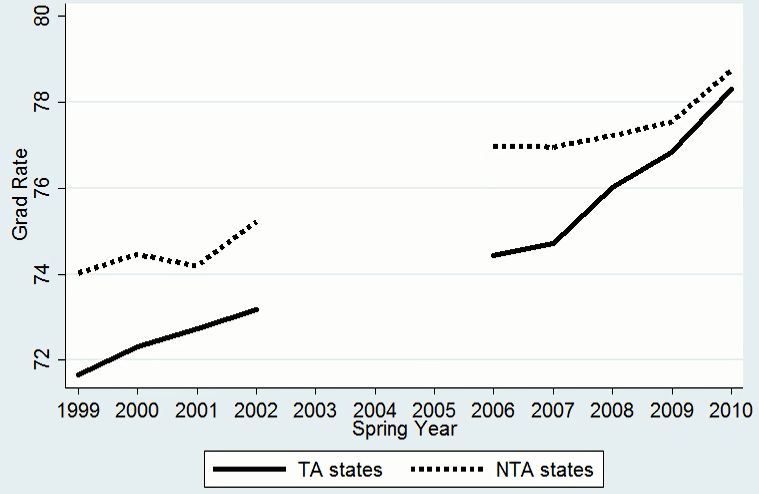
The results are consistent with this theory. In columns (2) and (3), we split the sample into

NTA states (those without test-based accountability prior to NCLB) and TA states (those with

test-based accountability prior to NCLB), respectively. Column (2) shows that, in the NTA

states, where NCLB introduced both forms of accountability at the same time, there was no

disproportionate effect on states with more low-graduation-rate districts (measured by , the

percentage of districts in the state that were below the state-determined graduation goal just

before NCLB became law). Conversely, in TA states, which experienced smaller changes in test-

based accountability, graduation rates increase proportionally to graduation accountability

pressure. The coefficient of 12.3 means that a state going from no districts threatened to all

districts threated would experience a 12.3 percentage point increase in the graduation rate.

 The results in this section imply that graduation accountability likely increased graduation

rates in states where many districts were below the graduation threshold and where the key

policy change was the addition of graduation accountability only. The next section yields the

same conclusion using a different method.

IV.B. Cross-District, Within-State Analysis

 In this section, we leverage variation across school districts, within states. The results are

consistent with the cross-state analysis. The descriptive results in Figure 2 show that districts that

were low-performing during the pre-NCLB era saw larger increases in graduation rates than

initially-high-performing districts. The DD results in Table 4 reinforce this. Column (4) shows

positive and statistically significant effects on both the Post (post-graduation accountability)

coefficient and the interaction term (Low × Post), suggesting that the average district responded

IS THE RISE IN HIGH SCHOOL GRADUATION RATES REAL? Page | 24
to graduation accountability pressure, and low-performing districts, as predicted, responded

more.31

 The DD in columns (5) and (6) in Table 4 reinforce this, showing the same specification as

in column (4), but splitting the sample by NTA and TA states.32 Both coefficients suggest

positive although insignificant effects of Post for both sets of states. Though they are not

statistically different from one another, the interaction term is larger in TA states.33 (Unlike

columns (1) these results are not sensitive to addition of state/district control variables such as

school expenditures.)

 These DD analyses point toward one key conclusion: graduation accountability increased

high school graduation rates. None of the individual analyses on this point is persuasive on its

own but consider: (a) graduation rates clearly increased faster post-graduation-accountability in

low-performing districts than high-performing ones (Figure 2); (b) 11 of the 12 point estimates in

Table 4 are positive and the only negative estimate is among the least precisely estimated; and

(c) in the most well-identified estimates (Table 4, Columns 5 and 6 with district fixed effects), all

four relevant point estimates (the intercept and interaction terms for both TA and NTA states) are

positive and one is statistically significant. Moreover, the effects of graduation accountability are

31
 We also considered carrying out the analysis in a regression discontinuity framework, to examine whether the
effects on districts were larger near the threshold. However, such an analysis is likely to yield a false null because
districts slightly above the threshold still faced pressure to remain just above the threshold; this is especially true
given that most states expected gradual improvement over time in their graduation rates.
32
 This is essentially a triple-difference, but we show the results as two separate DD columns for ease of
comparability.
33
 The appendix also shows this visually in a figure that shows the graduation rate trends for four groups of districts:
high-performing districts in NTA states, low-performing districts in NTA states, high-performing districts in TA
states, and low-performing districts in TA states. If graduation accountability increases graduation rates, we would
expect the effects to be largest in the low-performing/TA districts and smallest in the high-performing/NTA
districts. Our results are also consistent with this pattern. As the DD analysis suggests, the figure shows increases in
graduation rates in both TA and NTA states, but especially in low-performing/TA districts.

IS THE RISE IN HIGH SCHOOL GRADUATION RATES REAL? Page | 25
larger in states that experienced mostly an increase in graduation accountability, not test-based

accountability.

 All of the estimates in Table 4 pass parallel trends tests. This can be seen visually in the

figures, but also in the formal tests shown in the middle of the Table 4. The results are also

robust to switching the pre-treatment years from 1999-2000 to the Dee and Jacob (2011) baseline

of 2001-2002. Nevertheless, one caveat is that the different groups of districts and states have

varying baseline graduation rate levels. This could, in theory create three methodological issues:

(a) ceiling effects; (b) regression to the mean; and (c) endogenous policy adoption. Ceiling

effects do not seem likely in this case since none of the subgroups is near the 100 percent

graduation ceiling. It might be easier to make gains when the initial level is near 50 percent, but

this is not so much a potential source of bias as a contextual factor. If it were easy for districts to

make gains from, say, 60 percent, then they could have already done so without graduation

accountability. Regression to the mean is also an unlikely influence because we averaged two

pre-graduation-accountability years together. Finally, while policy adoption is almost certainly

endogenous, there is no reason to believe that this is true in a time-varying way. States adopting

accountability on their own were no doubt different in unobserved ways, but, so long as these

differences are time-constant, the state/district fixed effects account for them.

IV.C. Graduation Rates and Graduation Exams

 In this section, we address one of the main reasons for skepticism about rising graduation

rates: that schools may have responded to accountability simply by making it easier for students

to graduate. Since accountability could induce this form of strategic behavior in the numerator,

all of the graduation measures discussed in section II are potentially suspect.

 To provide a rough test of whether graduation accountability led to diminished academic

IS THE RISE IN HIGH SCHOOL GRADUATION RATES REAL? Page | 26
standards, we leverage state-level variation in graduation exams. If graduation exams make it

more difficult for schools to lower standards, and if accountability induced states to try to lower

standards, then the lower-graduation-standards theory predicts that we should see smaller

graduation rate increases in states that had graduation exams during the period of the above

analysis. To test this, we identified the presence of state graduation exams in the years 2000

(Goertz & Duffy, 2001), 2010 (various web sites34), and 2017 (Gewertz, 2019).

 Table 5 shows the CPS trends in status high school completion, for states with differing

combinations of graduation exams. We are mainly interested in states that had graduation exams

throughout the 2000-2017 period (N=4) and states that had no graduation during 2000-2017

(N=18). The table also considers states that had a graduation exam in 2000, but not in 2017

(N=7); states that added a graduation exam (N=1), and states that alternated from having exams

in 2000, dropping them in 2010, and adding them back by 2017 (N=3). The pattern of graduation

rates, however, is inconsistent with the theory that graduation accountability led schools to relax

their graduation standards. Graduation rates actually increased faster in states that had graduation

exams throughout 2000-2017 than in those that never had such exams.

 While these results run against the lower-graduation-standards theory, the analysis does have

some limitations. First, the graduation exams might not really have created a barrier to

graduation, given the available exceptions that allow students to graduate even if they fail the

exams (Achieve, 2010). For example, most states have exceptions for special education students

and students had multiple opportunities to re-take the exam. We view this as a somewhat

unlikely explanation for the results in Table 5, however. Research consistently suggests that

34
 The information on graduation exams for 2010 comes from the web sites of state departments of education and
the following organizations: Center for Education Policy, Education Commission of the States, and Education
Week.

IS THE RISE IN HIGH SCHOOL GRADUATION RATES REAL? Page | 27
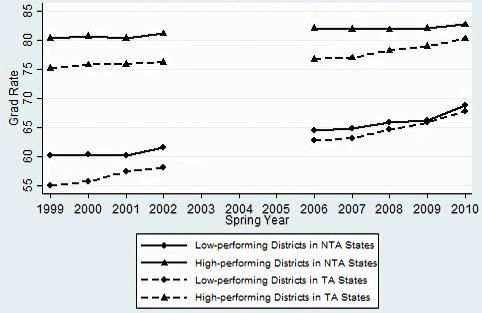
You can also read