Pathways for Youth to the Labour Market: A Synthesis Report - Ron Saunders Pathways to the Labour Market Series - No|9
←
→
Page content transcription
If your browser does not render page correctly, please read the page content below
Pathways for Youth to the Labour
Market: A Synthesis Report

      Ron Saunders

      Pathways to the Labour Market Series – No|9

      CPRN Research Report | September 2008
Canadian Policy Research Networks is a not-for-profit organization. Our mission is to help make
Canada a more just, prosperous and caring society. We seek to do this through excellent and
timely research, effective networking and dissemination and by providing a valued neutral space
within which an open dialogue among all interested parties can take place. You can obtain
further information about CPRN and its work in public involvement and other policy areas at
www.cprn.org.

      The views expressed in the report are the views of the authors and do not necessarily
                                  reflect those of the funders.

Copyright © 2008 Canadian Policy Research Networks Inc.

Permission is hereby granted by CPRN to reproduce this document for non-profit and
educational purposes.
Contents
Acknowledgements ................................................................................................................... ii
Foreword ................................................................................................................................ iii
Executive Summary.................................................................................................................... iv
1. Introduction........................................................................................................................... 1
2. The Pathways That Young People Are Taking through School to the Labour
Market ..................................................................................................................................... 4
3. The Labour Market Outcomes Associated with Different Pathways ......................... 8
4. Skill Use and Skill Development in the Workplace ........................................................ 11
5. Supports and Options Available to Young People Making Choices about
Learning and Career Paths.................................................................................................. 16
6. The Role of Employers in the School-to-Work Transition............................................. 24
7. Policy Implications and Research Gaps ............................................................................ 25
References..................................................................................................................................... 29
Our Support ................................................................................................................................. 33
Figures and Table
Figure 1. Benefits of Completing High School for Access to Skilled Occupations .............. 3
Figure 2. Key Pathways from School to the Labour Market.................................................. 4
Figure 3. Proportion of Youth Aged 18 to 24 Who Follow Particular School-to-Labour
Market Pathways..................................................................................................... 6
Figure 4. Gap or “Mismatch” between Actual Educational Attainment and Perceived
Minimum Education Required for the Job for Those with Post-Secondary
Credentials .............................................................................................................. 13
Figure 5. Distribution of Annual Earning of Canadian Workers with a University Degree
by Age, 2005........................................................................................................... 15
Table 1. Actual Educational Attainment versus Perceived Minimum Education Required
for the Job .............................................................................................................. 12
iAcknowledgements
Helpful comments on a draft of this paper were provided by Jennifer Robson and Rachelle Cochrane.
I would like to thank my colleagues, Richard Brisbois and Larry Orton, for their advice and
support in the preparation of this report and throughout the Pathways project.
As this paper is a synthesis of findings of all of the studies in this project, I am indebted to the
authors of all of the previous papers in the series. They are identified in the introductory section
of the text.
I would also like to thank all participants in the roundtable held on April 30, 2008, to discuss a
draft of this report.
Finally, a special thank you to Patrice de Broucker, my former colleague at CPRN, whose ideas
and research very much influenced the shape of the Pathways project, and who, after his return
to Statistics Canada, continued to contribute as co-author of one of the studies and as an advisor
on the others.
Any errors of interpretation are the responsibility of the author.
iiForeword
Young Canadians are looking for more choice when it comes to learning options – before and
during their careers. That was a strong message coming out of CPRN’s Youth Dialogue in
November 2005. Young people told us that post-secondary education (PSE) should be available
to everyone – whether it is university, college or trades programs. And they told us that there
should be a variety of well-supported learning opportunities.
Our two-year project Pathways for Youth to the Labour Market, which has been examining the
ways young people navigate from high school through to the labour market, is nearing
completion. We have published eight studies over the course of the project. Some have focused
on a quantitative analysis of the learning paths being taken by our youth and the labour market
outcomes associated with different paths. Others have involved qualitative analysis of
government policies and career development practices in our schools, including case studies of
promising programs.
This report, by CPRN’s Vice-President of Research, Ron Saunders, provides a synthesis of the
findings of the Pathways series as well as other recent literature on the school-to-work transition.
It also summarizes the policy implications of the research; sets out recommendations to improve
young people’s ability to identify, select and navigate pathways that lead to rewarding and
productive lives; and identifies areas where more research is needed.
I would like to thank Ron for his leadership of this program of research and all authors of the
reports in the Pathways series for their contribution to improving our understanding of the paths
that Canada’s youth are taking from school to the labour market and for their identification of
policies and practices that can help young people find rewarding careers. I would also like to
thank all sponsors of the series for their financial support for this research: Alberta Advanced
Education and Technology; Alberta Education; Alberta Employment and Immigration;
Gouvernment du Québec – Ministère de l’Éducation, du Loisir et du Sport; Max Bell Foundation;
Ontario Ministry of Education; Ontario Ministry of Training, Colleges and Universities;
RBC Foundation; Statistics Canada; the Canadian Council on Learning’s Work and Learning
Knowledge Centre; the Policy Research Initiative; and an anonymous donor.
Sharon Manson Singer, PhD
September 2008
iiiExecutive Summary
In the spring of 2006, CPRN launched the project Pathways for Youth to the Labour Market. Its
purposes were:
• to better understand the paths that young people take from high school through to regular
participation in the labour market;
• to identify institutional and policy structures that appear to support or hinder young people’s
ability to find pathways that lead to sustained employment with decent pay, good working
conditions and career potential;
• to examine attitudes and underlying values about the different pathways that are or could be
available, how they are shaped and how they influence choices; and
• to develop policy options to improve the ability of young people to identify, select and
navigate pathways that lead to rewarding careers.
Eight studies in CPRN’s Pathways series have been completed and published. This report seeks
to synthesize the findings of the Pathways series as well as other recent literature in this area.
Who Follows Which Path?
The possible learning paths that Canadian youth may follow are numerous, since there are not
only different final destinations in terms of educational credentials but also different routes to a
given destination. Among the findings regarding who takes which pathway are the following:
• Young women are less likely than young men to drop out of high school and more likely to
go on to some type of post-secondary program prior to entering the labour force. They are
also less likely to delay the start of a post-secondary program.
• Aboriginal youth are likely to leave the educational system with a much lower level of
attainment than non-Aboriginal youth.
• Youth with parents who have a high level of education are more likely to participate in post-
secondary education.
• Youth with very low marks in high school are much more likely than those with mid to high
marks to drop out and not return. However, sizable numbers of students with decent marks
are also dropping out.
• Working up to 20 hours per week in high school can be beneficial in terms of educational
attainment. However, the effect of work on education becomes negative at more than 20
hours per week.
• Youth living in large cities are more likely to attend university than rural youth.
• Many of today’s youth are not following straight-line paths from high school to a post-
secondary program to a job, but rather take time off from studies at some point or switch
programs.
ivThe Early Labour Market Outcomes Associated with Different Pathways
Data on young people aged 22 to 24 who were not in school indicate that, not surprisingly,
graduates of university, college and trades programs were more likely to be employed and to
have earned significantly more, on average, than high school dropouts, “second chancers” (those
who dropped out of high school but later went back to school) and those with only a high school
diploma. However, more than a quarter of post-secondary education graduates earned less than
the median for dropouts in December 2003, although this was likely partly a reflection of the
limited opportunity for work experience among the former group.
Women had lower earnings than men, even after statistically controlling for hours of work,
educational attainment and other variables.
University and college graduates who took indirect routes to their degree or diploma were not
worse off five years later than those who chose direct routes, and in some ways were better off.
Skill Use in the Workplace
Data from the Workplace and Employee Survey suggest some mismatch between job
requirements and educational attainment – many people have more education than they see as
being needed in their job. This is particularly the case for those with college diplomas. Other
survey data show that Canada has one of the highest rates of reported overqualification in the
Organisation for Economic Co-operation and Development (OECD). The degree of overqualification
in the Canadian labour market may be related to the persistence of a large low-wage sector in our
economy.
While, on average, workers with post-secondary (especially university) credentials earn more
than the median level of earnings in Canada, a sizable proportion of such workers have low
earnings. For example, 18 percent of those with a university degree earn less than half the
median.
Career Development Programs and Services
Career development programs and services can reduce dropout rates, increase aspirations and
achievement, help people find jobs that match their talents and interests, help employers meet
skill needs and generally improve the allocation of resources in the labour market. However, in
Canada, there is limited awareness of the benefits of career development and no national career
development strategy or standards for service quality or provision. Career development services
for youth are highly decentralized. While this may foster innovation, most provincial
governments are not doing enough to identify, sustain and spread effective practices. Moreover,
career development services in Canada are neither coherent nor comprehensive in scope,
although some provinces are beginning to develop career development service policies from
kindergarten to adult education or from kindergarten to grade 12.
vCareer Pathways Programs in High Schools
Provinces are making an effort to revitalize the vocational curriculum in high schools and to
strengthen partnerships between schools, post-secondary institutions and employers. There are
examples of remarkable initiatives with promising results. In particular, co-operative programs
that provide a clear connection between schooling and a future career seem to have good results.
However, overall, the take-up of vocational options remains very limited. This may be due in
part to attitudes about such pathways and in part to the fact that all provinces have promoted a
decentralized “market” approach to vocational education and training, which relies on locally
developed models to emerge. In most provinces, there has been limited coordination and
unreliable funding.
Formal evaluations of both career development programs and career pathways curricula are
scarce.
Policy Implications and Research Gaps
The key recommendations derived from an analysis of the findings of the Pathways project are
the following:
• All provinces and territories should put in place a strategy for career planning services, for
people of all ages.
• Provinces and territories should enable school boards to expand co-operative program
offerings, in partnership with employers and unions.
• Governments and learning institutions should work to strengthen the bridges between
different learning paths, so that students who start on one path but then change direction are
able to get credit for the work accomplished. This means ensuring that there are good bridges
not only between academic and vocational options in high school but also between
community colleges and universities, while respecting the standards associated with a post-
secondary degree.
• The learning system (and the system of financial aid for post-secondary education) should
make it easy for people to participate at different stages of their lives.
• The provinces and territories should make a more systematic effort to identify successful
practices and share results across Canada; they should provide the funding to sustain such
practices locally and to facilitate their adoption across the province.
• To improve the rate at which young Canadians are able to find rewarding careers, we need
action on the demand side of the economy, not just on the supply side. This issue is
particularly acute in rural Canada.
More research is needed on the question of overqualification, on the trajectories of those who do
not complete learning programs, on the factors that foster completion of post-secondary
education and, especially, on the evaluation of career pathways initiatives, so that we can be
better informed about which specific interventions are generating the best results.
viPathways for Youth to the Labour Market: A Synthesis Report
1. Introduction
It is never a good idea to waste human potential. At a time when population growth and labour
force growth is slowing in Canada, it is particularly important to have policies and programs in
place that enable all Canadians, especially Canada’s youth, to fully realize their potential to
contribute to the economy and to their communities. How can we efficiently and effectively
ensure that our young people are fully able to develop and use their talents?
In the spring of 2006, CPRN launched the project Pathways for Youth to the Labour Market. Its
purposes were:
• to better understand the paths that young people take from high school through to regular
participation in the labour market;
• to identify institutional and policy structures that appear to support or hinder young people’s
ability to find pathways that lead to sustained employment with decent pay, good working
conditions and career potential;
• to examine attitudes and underlying values about the different pathways that are or could be
available, how they are shaped and how they influence choices; and
• to develop policy options to improve the ability of young people to identify, select and
navigate pathways that lead to “success.”
Eight studies in CPRN’s Pathways series have been completed and published:
1. Career Development Services for Canadian Youth: Access, Adequacy and Accountability, by
Donnalee Bell and Lynn Bezanson, July 2006.
2. Pathways of Alberta Youth through the Post-Secondary System into the Labour Market,
1996-2003, by Harvey Krahn and Julie Hudson, November 2006.
3. Pathways for Youth to the Labour Market: An Overview of High School Initiatives, by Alison
Taylor, April 2007.
4. Trading Up – High School and Beyond: Five Illustrative Canadian Case Studies, by Mame
McCrea Silva and Susan M. Phillips, May 2007.
5. Education-to-Labour Market Pathways of Canadian Youth: Findings from the Youth in
Transition Survey, by Darcy Hango and Patrice de Broucker, November 2007.
6. From School to the Labour Market in Québec: Analysis of Student Trajectories in Terms of
Previous Learning Path and Early Labour Market Experience, coordination by Jean-Claude
Bousquet, February 2008.
7. Implementing the School-to-Work Transition in Québec, by Pierre Doray, Louise Ménard and
Anissa Adouane, March 2008.
8. Connecting Supply and Demand in Canada’s Youth Labour Market, by Richard Brisbois,
Larry Orton and Ron Saunders, April 2008.
CANADIAN POLICY RESEARCH NETWORKS 1Each of these studies has been concerned with one or more of the four purposes outlined above. Some have focused on a quantitative analysis of the learning paths being taken by our youth and the labour market outcomes associated with different paths. Others have involved qualitative analysis of government policies and career development practices in our schools, including case studies of promising programs. Most have paid attention to the policy implications of these analyses. The project was motivated in part by some of the outcomes of CPRN’s Youth Dialogue held in November 2005. One hundred and forty-four young Canadians aged 18 to 25 years, randomly selected, were invited to talk together about the kind of Canada they wanted, what choices and trade-offs they were prepared to make as citizens, and what they and others needed to do to make their vision happen. Dialogue participants talked about four issues: learning, work, health and the environment. In their discussion of learning issues, young Canadians stressed the importance of valuing different learning paths to work, in addition to college and university, and of finding some balance to the reliance on academic performance. They also felt that they may not have had the appropriate information about all the options that were available to them either within high school or for post-high school studies. They called for more – and better presented – information on careers and educational options: “Education on career choices is important: should we not spread appropriate courses over two or three years rather than concentrate a career planning course in one year? This would allow young people to broaden their perspective on future job opportunities” (de Broucker, 2006). In particular, they wanted to see better information provided for vocational, trades and entrepreneurial paths and to have these pathways presented as real options to young people. Dialogue participants linked the provision of such options to the greater likelihood that more young people would complete their education and get good jobs without necessarily having to go to university. Concerns about the learning options available to Canada’s youth also emerged from studies by de Broucker in 2005 for CPRN and the Organisation for Economic Co-operation and Development (OECD) on the early labour market experience of young people with different levels of educational attainment (de Broucker, 2005a and b). His findings show that, while completing high school improves young Canadians’ chances of finding employment, a high school diploma with no further credential does little to improve the chances of getting a skilled job in Canada, unlike the case in many other OECD countries. The height of the bars in Figure 1 shows the difference within each OECD country in the proportion of people aged 20 to 24, who are not in school and are holding skilled jobs, between those who have completed high school (and have no higher credential) and those who have not completed high school. In Canada, completing high school makes almost no difference without the addition of a further credential. 2 CANADIAN POLICY RESEARCH NETWORKS
Figure 1. Benefits of Completing High School for Access to Skilled Occupations

         30
         25
         20
         15
         10
    %      5
           0
          -5
        -10
        -15
                        Poland

                                                 Ireland

                                                                                                Sweden

                                                                                                                                                                                                              Switzerland
                                                                                      Finland

                                                                                                                              Denmark

                                                                                                                                                                             UK

                                                                                                                                                                                                      Spain
                                            US

                                                           Italy

                                                                            Belgium

                                                                                                                                                                                                                                      Austria
                                                                   Canada

                                                                                                                  Australia

                                                                                                                                                                                            Iceland
                                                                                                                                                      Luxembourg

                                                                                                                                                                                                                            Czech R
                                                                                                         France

                                                                                                                                        Netherlands

                                                                                                                                                                   Hungary
               Greece

                                 Portugal

                                                                                                                                                                                  Germany
    Source: Reproduced from de Broucker (2005b), Figure 18.

De Broucker (2005b) also finds that, while post-secondary education provides, on average, clear
benefits in terms of employment rates and earnings, one-third of employed 25-to-29-year-olds
with a post-secondary education diploma or degree in Canada and the United States have a low-
skill job – the highest proportion among OECD countries.

These findings raise the question of whether there is scope for Canada to offer choices to its high
school youth that could lead to a greater rate of high school completion (since that does matter
for getting some kind of job and is a precondition for eligibility for post-secondary education)
and would better prepare those who do not go on to post-secondary education for a job. While
the high school dropout rate has been declining in Canada,1 it is much higher than the average in
some communities, is higher for young men than for young women and is very high among
Aboriginal youth.

This report seeks to synthesize the findings of the eight previous publications in the Pathways
series as well as of other recent literature on the issues examined in the Pathways project.
Section 2 outlines what we have learned about the paths that young Canadians are currently
following through school to the labour market. Section 3 examines evidence about outcomes
such as employment and earnings associated with different paths. Section 4 looks at how well the
skills and knowledge of young adults are used on the job. Section 5 reviews the supports and
options available to young people as they make choices about learning and career paths and as
they pursue different learning paths. Section 6 considers the role of employers in the school-to-
work transition. The paper concludes by exploring the policy implications of this research and by
identifying research gaps.

1
        Data from the Labour Force Survey indicate that, in the first quarter of 2007, the proportion of young adults
        who were not in education and had not successfully completed high school was 8.9 percent.

CANADIAN POLICY RESEARCH NETWORKS                                                                                                                                                                                                               3
2. The Pathways That Young People Are Taking through School to the
Labour Market
What are the different paths that young people take from high school to the labour market? How
many follow each type of path? What is the demographic profile of different types of pathways?
To provide a framework for answering such questions, CPRN developed a diagram (shown in
Figure 2) that identifies the most important pathways that young people might take from school
to the labour market, recognizing that no existing database would be able to provide a full picture
for many of the pathways that take a longer time to complete (Hango and de Broucker, 2007).
Figure 2. Key Pathways from School to the Labour Market
Source: Reproduced from Hango and de Broucker (2007), Figure 1.1.
The diagram aims to capture not only educational attainment – whether young people complete
high school, college, a trades program or university – but also the extent to which “non-linear”
paths are followed, such as taking a break from schooling to get a job before going back to
continue education or going to college after university.
4 CANADIAN POLICY RESEARCH NETWORKSHango and de Broucker (2007) start from this diagram in their analysis of pathways from
education to the labour market, using data from the Youth in Transition Survey (YITS). They
focus on youth who were 18 to 20 years old when first surveyed in 2000 and who were followed
up regarding learning status and employment matters two and four years later (so that they were
aged 22 to 24 in the second follow-up). Because of the scarcity of data for certain pathways,
Hango and de Broucker collapsed the 20 CPRN paths into 10, according to the highest level of
educational attainment and whether or not there was a break from studies after high school
(“gappers” versus “non-gappers”). See the text box for descriptions of the 10 pathways.
Hango and de Broucker’s 10 Pathways to the Labour Market
• Path 1 – High school droppers: Youth who had dropped out of high school and who, by
December 2003, had never returned to obtain a high school diploma or any other type of training.
• Path 2 – Second chancers, high school or more: Individuals who had dropped out of high school
but then went back to high school and/or received any type of post-secondary education training –
can be thought of as a “second chance” in the education system.
• Path 3 – High school graduate only: Individuals who had obtained their high school diploma, but
nothing more, prior to entering the labour force by December 2003.
• Path 4 – Non-gappers, post-secondary leavers: Youth who had started a post-secondary program,
did not finish by December 2003 and were not enrolled in a program by this date.
• Path 5 – Non-gappers, college: Youth who had obtained a college diploma by December 2003 and
were no longer enrolled in another program.
• Path 6 – Non-gappers, university: Youth who had obtained at least a university degree.
• Path 7 – Gappers/non-gappers, trade/other: Youth who had obtained a trade certificate or some
other type of post-secondary degree or diploma, regardless of whether there was a gap between
high school and the start of post-secondary studies.
• Path 8 – Gappers, post-secondary leavers: As with Path 4, includes youth who had started a
post-secondary program but had not finished and were not enrolled as of December 2003.
• Path 9 – Gappers, college: Individuals who had received a college diploma.
• Path 10 – Gappers, university: Youth who had received at least a university degree as of
December 2003.
Source: Hango and de Broucker (2007).
Figure 3 shows Hango and de Broucker’s findings regarding the proportion of survey respondents
who took the various paths, as well as those still in school when followed up at ages 22 to 24.
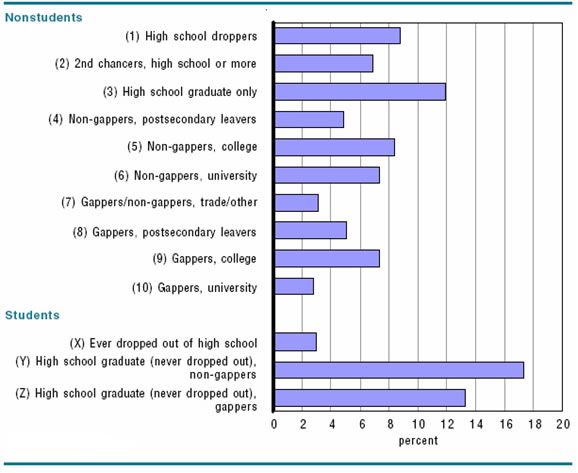
CANADIAN POLICY RESEARCH NETWORKS 5Figure 3. Proportion of Youth Aged 18 to 24 Who Follow Particular School-to-Labour Market
Pathways
Source: Reproduced from Hango and de Broucker (2007), Chart 1.1. using data from the Youth in Transition Survey.
Who Follows Which Path?
The most common pathway shown in Figure 3 is to have a high school diploma only (almost 12
percent of all respondents), but this reflects the splitting of the post-secondary paths into gappers
and non-gappers. If these were combined, the paths leading to a college diploma would show the
largest share. Moreover, as the bottom of the figure shows, many of the survey respondents were
still in school at ages 22 to 24, so the numbers eventually completing a diploma or degree would
be much greater than shown in the upper part of the figure.
Hango and de Broucker (2007) reported numerous interesting findings regarding the characteristics
of people who follow different pathways:
• Young women are less likely than young men to follow the pathway of dropping out of high
school and are more likely to go on to some type of post-secondary program prior to entering
the labour force. They are also less likely than young men to delay the start of a post-
secondary program.
6 CANADIAN POLICY RESEARCH NETWORKS• Aboriginal youth are likely to leave the educational system with a much lower level of
attainment than non-Aboriginal youth.
• Having many siblings is associated with a greater risk of not finishing high school before
entering the labour market, as is living in a single- or step-parent family.
• As other studies have documented, youth with parents who have a high level of education are
more likely to participate in post-secondary education. Higher parental expectations are also
associated with higher educational attainment.
• Marks matter. Youth with very low marks in high school are much more likely than those
with mid to high marks to drop out and not return. Very high marks predict that the teen will
go directly to a post-secondary program after high school rather than delaying. However,
another study using YITS data (Statistics Canada, 2005) suggests that sizable numbers of
students with decent marks are also dropping out. This study examined why people had
dropped out of high school by age 17 in 2001. While, on average, dropouts reported much
lower marks that other students at age 15, more than a third of those who dropped out by age
17 reported marks of 70 percent or higher at age 15, suggesting that they were doing well
enough in school that they would have been expected to graduate.
• Working some hours in high school can be beneficial in terms of educational attainment, but
working over 20 hours per week is associated with a greater risk of dropping out of high
school and with delaying attendance at a post-secondary institution following high school.
• Early family responsibilities (having a child or entering a conjugal union as a teenager)
increases the risk of dropping out of high school.
Similar findings about who follows which pathways are reported by Krahn and Hudson (2006),
based on a seven-year longitudinal study of the Alberta high school graduating class of 1996
(which means their study does not include high school dropouts). Their key findings include the
following:
• A very high proportion of high school graduates (88 percent) had enrolled in a post-
secondary program at some point between 1996 and 2003. Sixty percent acquired at least one
post-secondary education credential. One in three (32 percent) obtained a university degree,
15 percent acquired a community college diploma and 15 percent obtained a technical school
diploma. Only four percent completed an apprenticeship program.
• Young women were more likely to choose university or a community college; young men
were overrepresented in technical schools and apprenticeships.
• Youth living in large cities were more likely to attend university.2
• Youth with at least one parent holding a university degree were much more likely to obtain a
degree themselves.
• Immigrant and visible minority youth were more likely than others to acquire a post-
secondary credential. Aboriginal youth were severely under-represented in this regard.
2
Similarly, Beckstead, Brown and Newbold (2008), using Census data, found that, in 2001, a young person from
a large urban area was twice as likely to obtain a university degree as one from a rural region.
CANADIAN POLICY RESEARCH NETWORKS 7The findings regarding gender, parental education and Aboriginal status are clearly quite similar
in the Alberta study to the results from the analysis of national survey data (YITS) by Hango and
de Broucker (2007). Both studies also show that many of today’s youth are not following straight-
line paths from high school to a post-secondary program to a job. Krahn and Hudson (2006)
found that, of the Alberta high school graduates they surveyed:
• 23 percent had returned for a second year of grade 12;
• 19 percent of those who entered a post-secondary program had transferred between
institutions (often starting a degree program at community college and finishing at
university – easier to do in Alberta than in some other provinces); and
• 14 percent of post-secondary education participants had dropped out of their program.
Hango and de Broucker show that large numbers of 22-to-24-year-olds were “gappers,” people
who took at least six months away from studies after they completed high school before entering
a post-secondary program.
Bousquet et al. (2008), in their analysis of the paths followed by students taking vocational
programs in high school or technical programs in college in Québec, find that most of the graduates
with secondary level vocational training followed paths that were either interrupted or non-linear
(such as participating in higher-level education before taking a vocational program) or both.
Dubois (2007), reports that, in 2000 in Canada, only 36 percent of college graduates and
50 percent of university graduates had no previous post-secondary education (prior to entering
the program from which they graduated) and had entered directly into their program after high
school. In other words, delayed or non-linear paths were common.
3. The Labour Market Outcomes Associated with Different Pathways
So far, this report has reviewed evidence about the learning pathways followed by Canadian
youth in recent years and the characteristics of people who follow the different paths. It is also
important to examine the labour market outcomes associated with each path. Which paths are
associated with moderate-to-high earnings, steady employment and higher job satisfaction?
Unfortunately, the longitudinal data that would help us analyze this question are scarce. The Hango
and de Broucker (2007) study does look at early labour market outcomes in December 2003, when
those surveyed were aged 22 to 24. However, that age limitation means that many had not
completed their formal education, and others had only recently entered the labour force on a full-
time basis. Among the findings (for those not in school in December 2003) are the following:
• Individuals who had delayed post-secondary attendance after high school but then had
graduated from college or university were the most likely to be employed.
• High school dropouts, “second chancers” (those who dropped out of high school but later
went back to school) and those who delayed entry into post-secondary education after
completing high school and then did not complete their post-secondary education program
were the least likely to be employed.
8 CANADIAN POLICY RESEARCH NETWORKS• The odds of employment and the level of earnings were higher for those who had worked more hours while in high school. • University, college and trades graduates earned significantly more, on average, than high school dropouts, second chancers and those with a high school diploma only. However, more than a quarter of post-secondary education graduates earned less than the median for dropouts in December 2003, although this was likely partly a reflection of the limited opportunity for work experience among the former group. • Women had lower earnings than men, earning almost 28 percent less than their working male counterparts. • Young adults who changed province after high school witnessed an increase in earnings compared with youth who remained in the same province. Krahn and Hudson (2006), in their study of Alberta high school graduates, looked at labour market outcomes when their study participants were about 25 years of age at the time of the final follow-up survey in 2003. A sizable minority was still in education, and many had only a few years of adult labour market experience. The key study findings about labour market outcomes included the following: • Seventy-one percent of study participants were employed in a single job, 14 percent were in more than one job, six percent were unemployed and nine percent were out of the labour force. • Most of the employed participants (63 percent), but particularly those with post-secondary credentials (70 percent or more), were working in managerial, professional or skilled occupations. • Those with university or trades credentials earned considerably more than those without post- secondary credentials, other things being equal. (The premium on trades credentials may have something to do with the intensity of activity on the oil sands, even in 2003.) College credentials had not translated into higher earnings at the time of interview. • Women were earning, on average, only two-thirds of what men were earning. Even after statistically controlling for hours of work, educational attainment and other variables, women earned much less than men. This corresponds to one of the findings of Hango and de Broucker (2007) using national data. • Fifty-nine percent of study participants felt that high school had helped them meet their career objectives. Eighty-five percent of those with post-secondary credentials felt their post- secondary program helped with career objectives. Those who had pursued technical training or had completed professional university programs were the most positive in their assessments. • Those who acquired a post-secondary credential were more likely to be satisfied with their job (66 percent) compared with those without a degree or diploma (56 percent). CANADIAN POLICY RESEARCH NETWORKS 9
Bousquet et al. (2008), focusing on vocational pathways, found that graduates of high school
vocational programs or college technical programs in Québec had much better labour market
outcomes, on average, than young people (aged 15 to 29) who did not complete high school and
were not enrolled in education when surveyed.
•    Graduates of high school vocational programs in Québec had an unemployment rate nine
     months after graduation that was about three percentage points lower than that for their age
     group overall. Graduates of college technical programs had a much lower unemployment rate
     than that for youth/young adults in Québec.
•    Among the graduates of high school vocational programs who had a job, 78.5 percent said
     there was a link between their job and their training. For graduates of college technical
     programs, the figure was 81.3 percent.

Dubois (2007) looks at Canada-wide data from the National Graduates Survey to examine labour
market outcomes in 2000 of those students who graduated from college and university in 1995
and obtained no further credential in the intervening years. In particular, she examines whether
delaying entry into post-secondary education or taking a break from studies mid-program had an
impact on employment and earnings after graduation from college or university. After
controlling for other variables, she finds that:
•    taking a break from studies improved the chances that (five years after graduation) a college
     or university graduate would be in the labour force;
•    university graduates who delayed entry were less likely to be unemployed and more likely to
     be in the labour force;
•    college graduates who delayed entry had a lower labour force participation rate; and
•    college graduates who took a break mid-program had earnings that were seven percent higher
     than those who did not.

Dubois also found that the impacts of having had previous post-secondary studies (before
entering the program from which the student graduated) were generally positive, except that
there was a negative impact on the unemployment rate of university graduates.

Overall, Dubois (2007) concludes that graduates who took indirect routes to their degree or
diploma were not worse off than those who chose direct routes, and in some ways were better
off. The only negative impact that persisted over time was that those who delayed entry into
college were less likely to be in the labour force. It is important to keep in mind, however, that
the National Graduates Survey deals only with graduates. It is possible that those people who
take indirect or delayed paths are less likely to complete their program – this element would not
be captured by Dubois’ study.

10                                                              CANADIAN POLICY RESEARCH NETWORKS
4. Skill Use and Skill Development in the Workplace On average, it is clear that those with post-secondary credentials do better in terms of employment and earnings than those without such credentials. (We have also seen that, in Alberta, it is not only university graduates who do well, but also graduates of trades programs.) Nevertheless, a major public policy concern has emerged in recent years regarding the extent to which post-secondary graduates are able to fully use their skills and knowledge in the workplace and whether their jobs provide the opportunity for further skill development. If large numbers of people were not using their skills or not developing them further, that would suggest a waste of human potential, which would be particularly problematic at a time when employers are raising concerns about skill shortages. Presumably, we aim to have learning and labour market systems that not only foster a high level of learning but also find a good match between the skills and knowledge supplied to the labour market and the skills and knowledge required by employers. Brisbois, Orton and Saunders (2008) look at data for 2003 from the Workplace and Employee Survey (WES) to examine these questions. Unfortunately, this survey excludes people who work directly for governments – public servants at all levels of government are not included. (However, employees of the broader public sector, such as schools and hospitals, are included.) The Workplace and Employee Survey includes data on the minimum level of education that workers perceive is required for their current job as well as the actual educational attainment of employees. Table 1 compares these figures. The results suggest some mismatch between job requirements and educational attainment. The mismatch is particularly evident in the under 25 age group, where 40 percent had a post- secondary trade certificate, college diploma or some university (without a degree), but only 11 percent perceived this as being required by their jobs. The figures for a university degree are 5.2 percent and 2.4 percent, reflecting the youth of this group. Brisbois, Orton and Saunders (2008) note that many people in the 15-to-24 age group will be in entry level jobs and will have had little opportunity to test their ability to find jobs that match their skills and knowledge. The key question is whether the mismatch between educational attainment and perceived education required for the job also holds in the older age groups. CANADIAN POLICY RESEARCH NETWORKS 11
Table 1. Actual Educational Attainment versus Perceived Minimum Education Required for the Job

    Minimum
                            15 to 24                  25 to 34              35 to 44                45 to 54                       55+
    Required

                                     Required

                                                               Required

                                                                                     Required

                                                                                                             Required

                                                                                                                                         Required
                          Attained

                                                    Attained

                                                                          Attained

                                                                                                  Attained

                                                                                                                        Attained
    Less than HS          19.4       19.3             7.0        5.7        8.3        7.0       10.8          5.9      19.8               8.1
    High school
                          22.2       33.6           15.2       30.2       20.8       35.1        22.0        34.6       19.3             29.4
    graduate
    Some post-
                          13.0                  X   11.2         5.1      10.2         5.0          9.4        5.1        7.9              5.0
    secondary
    Post-secondary
    trade certificate
                          40.2       10.5           41.8       23.9       41.9       22.4        39.0        21.2       34.2             18.8
    or college
    diploma *
    University
                            5.2        2.4          24.9       18.0       18.8       16.9        18.8        18.1       18.8             18.1
    degree
Source: Workplace and Employee Survey (2003) – Employee Survey. Reproduced from Brisbois, Orton and
        Saunders (2008), Table 4.5.
Note:   X: Cell count too small to be reliable.
        * Includes those with some university but not a degree.

For those aged 25 to 34, 42 percent had a post-secondary trade certificate or college diploma, but
only 24 percent saw this as necessary for their job. Twenty-five percent of those aged 25 to 34
had a university degree, but only 18 percent said that a university degree was the minimum
education required in their work.3

Forty-two percent of workers aged 35 to 44 had a post-secondary trade certificate or college
diploma; 22 percent of them saw this as needed in their jobs. However, the gap with respect to
university education is narrow: 19 percent of workers aged 35 to 44 had a university degree;
17 percent of these workers perceived this to be required by their job. The pattern for those over
45 is similar to that for the 35-to-44 age group.

Figure 4 focuses on the size of the perceived overqualification – actual educational attainment minus
perceived minimum job requirements – for degree holders and for those with post-secondary
certificates or diplomas, by age category. It appears that we are underusing educational skills in
all age groups, especially with regard to college education. A possible explanation for this
greater qualifications gap among college diploma holders is that college graduates are less likely
to be geographically mobile – university graduates may be more likely to move to find a good fit.

3
       It is noteworthy that the total share of those aged 25 to 34 who say a degree, college diploma or trade certificate
       is needed on the job is only about 43 percent. This proportion is in contrast with the oft-cited figure from
       projections generated by the Canadian Occupational Projection System (COPS) that about two-thirds of new
       jobs require a post-secondary credential. This difference may reflect differences in the requirements of old and
       new jobs. It is also worth keeping in mind that the COPS projections refer to occupations usually requiring post-
       secondary education or in management, which means that the actual share of jobs requiring post-secondary
       education might be less than two-thirds.

12                                                                                              CANADIAN POLICY RESEARCH NETWORKS
Figure 4. Gap or “Mismatch” between Actual Educational Attainment and Perceived Minimum
Education Required for the Job for Those with Post-Secondary Credentials
2.8
15 to 24
29.7
6.9
25 to 34
17.9
Age Group
University degree
1.9
35 to 44
19.5 Post-secondary trade certificate
or college diploma
0.7
45 to 54
17.8
0.7
55+
15.4
0 5 10 15 20 25 30 35
Perceived Gap or "Mismatch"
Source: Workplace and Employee Survey (2003) – Employee Survey.
It is important to keep in mind that the data we have from the Workplace and Employee Survey
are for different cohorts. It would be helpful to have longitudinal research to track the extent to
which, for a given cohort, the matching of skill use on the job to educational qualifications
improves with age. It would also be helpful to have such data by field of study.
Brisbois (2003) compared overqualification in Canada with that in 16 other OECD countries,
based on responses to the question “How well do you think your skills match the demands
imposed on you by your job: the demands are too high, they match, the demands are too low, or
don’t know?” He found that the percentage of workers under age 25 who felt overqualified
(24 percent) was highest in Canada, followed by workers in the United States. As in most
countries, the percentage in Canada feeling overqualified declined sharply with age, dropping in
Canada in the 25-to-44 age group to 11.5 percent, under half that reported for the under 25 age
group. However, the figure for the 25-to-44 age group was still relatively high among OECD
countries – 3rd highest among the 17 countries examined.
Krahn and Hudson (2006) found that 31 percent of all employed respondents (about 25 years
old) whom they surveyed in 2003 felt overqualified in their current job. This relatively high
figure may be explained in part by the fact that their survey did not cover those who dropped out
of high school.
CANADIAN POLICY RESEARCH NETWORKS 13Brisbois, Orton and Saunders (2008) point out that the degree of overqualification in the
Canadian labour market may be related to the persistence of a large low-wage sector of our
economy. (This could also explain why the rate of reported overqualification in North America is
higher than in Europe.)4 They argue that, if we want to improve the extent to which high-level
skills and knowledge are used in the Canadian labour market, we need to act not only on the
supply side (facilitating participation in post-secondary education) but also on the demand side
(encouraging a shift in demand toward highly skilled workers, which ought to be accompanied
by more well-paid jobs).
The 2005 data from Statistics Canada’s Survey of Labour and Income Dynamics (SLID) allow
us to examine the distribution of annual earnings of Canadian workers (aged 25 to 64) by
educational attainment and age category (see Figure 5). Data reported are for individuals who
had reported income in 2005. The annual median earnings for the overall group in 2005 are
$33,000. Earnings are then distributed into five groups: less than half the median, between half
the median and the median, between the median and 1.5 times the median, between 1.5 times the
median and two times the median, and more than two times the median.
For the overall group (aged 25 to 64), a sizable proportion of individuals with higher educational
credentials (trade-vocational, college diploma or university degree) have low earnings. For those
with trade-vocational credentials, 26 percent earn less than half the median. For those with a
college diploma, almost one quarter (23 percent) earn less than half the median. Although
32 percent of those with a university degree earn more than two times the median, 18 percent
earn less than half the median.5 This is illustrated in Figure 5.
Clearly, a sizable share of those with post-secondary credentials has relatively low earnings,
including more than one in six of those with university degrees. Together with the data on
perceived overqualification and the findings of de Broucker (2006), cited above, regarding the
high share of young adults with post-secondary credentials who are in low-skill jobs, there is
reason for concern about the capacity of our labour market to provide rewarding careers for all
who attain such credentials.
The Canadian Council on Learning (2007: 8) has come to a similar conclusion: “Canada must
also examine why so many post-secondary education graduates are earning below their expected
potential and determine whether their skill sets are being underutilized, thereby undermining
potential gains in productivity for the country as a whole.”
4
There is some evidence that overqualification is on the rise in Europe. Quintini and Martin (2006), in their study
for the OECD, find that one in five working youth was overeducated in 2005, which is 1.5 percentage points
higher than in 1995.
5
The data are also available by gender. The percentage of university degree holders earning below half the
median is higher for women (22 percent) than for men (15 percent), which may reflect more part-time work
among women.
14 CANADIAN POLICY RESEARCH NETWORKSFigure 5. Distribution of Annual Earnings of Canadian Workers with a University Degree, by Age, 2005
25-64 18.3% 16.2% 17.3% 17.1% 31.2%
25-34 20.2% 21.5% 24.2% 18.6% 15.5%
Less than half the median
Between half the median and the
Age Group
median
Between the median and 1.5 times the
35-44 14.8% 15.3% 16.8% 17.2% 35.9%
median
Between 1.5 times the median and 2
times the median
More than 2 times the median
45-54 12.7% 13.5% 13.3% 16.2% 44.3%
55-64 31.6% 11.3% 10.4% 15.3% 31.4%
0% 20% 40% 60% 80% 100%
Distribution
Source: Survey of Labour and Income Dynamics, 2005. Extracts from special tabulations provided by Statistics
Canada.
It would be helpful to have more research on the implications of overqualification. Do
overqualified workers demonstrate less job satisfaction and less productivity? Are these workers
at medium or longer-term risk of lower economic security? Is overqualification leading to a
potential devaluation of post-secondary education? Does it suggest that there are limits to the
return on the large public investments in post-secondary education?
There is also reason to be concerned about opportunities for further skill development among
employed workers in Canada. Goldenberg (2006) points out that employer investment in
workplace learning in Canada is below that of many of our major competitors, including the
United States.
Concerns about the demand side of the youth labour market are particularly acute in rural
Canada. Looker and Naylor (2008) provide data from a longitudinal study in Nova Scotia
indicating that rural youth who obtain a university degree (and especially those obtaining a
graduate credential) are more likely to be living in an urban centre at age 29 than are other rural
youth. Those who remain in rural communities are much less likely than other youth to have a
full-time job. Corbett (2006: 297) notes the tension between the education imperative and the
efforts of rural communities to retain their young people: “It is fairly clear that formal education
is understood and experienced by most school-successful rural youth as a ticket to elsewhere and
that formal education correlates powerfully with out-migration from rural communities.”
CANADIAN POLICY RESEARCH NETWORKS 155. Supports and Options Available to Young People Making Choices
about Learning and Career Paths
We have seen that young Canadians who obtain post-secondary credentials tend, on average, to
do better than others in terms of future employment and earnings, but that a sizable share of post-
secondary education graduates, including 18 percent of university graduates, has earnings below
half of the median level and that many college graduates report being overqualified for their jobs.
How well are young Canadians supported in making choices about learning and career paths?
Are there policies and programs that could help more young Canadians to find rewarding
careers?
This section of the paper reviews the evidence, largely qualitative, and the supports and options
made available to Canada’s youth regarding career pathways.
Labour Market Information and Occupational Projections
Clearly, to make sound choices about learning pathways, it helps to have good information about
what programs are available (and at what cost)6 but also about what employers are looking for
and what skills are expected to be in short supply. Education and training institutions also need
such information to help plan their course offerings.
Canada is one of few countries that have a national occupational projection system, and it has
received favourable reviews for the quality of the projections. However, Brisbois, Orton and
Saunders (2008) point out that we lack information about how these projections are used. More
research in that regard would be helpful.
There are limitations in what we can expect of occupational projections, particularly in terms of
their reliability when looking at narrowly specified occupations or in looking at local, as opposed
to national, trends.
Much of the labour market information available from the federal government is spread across
several websites. There is no single, integrated, easy to use and youth-friendly national site for
finding and using occupational projections and related education planning information.
Career Development Programs and Services
Career development supports refer to “information, programs and services that help people to
make education-, training- and work-related choices and to manage learning and work and the
transitions between them over their lifespans” (Bezanson et al., 2008: 3). This definition implies
that career development is a lifelong process; it is not a one-time event, nor can it be adequately
supported by a one-time guidance course in grade 12.
6
The ability to analyze information about the costs and benefits of learning programs, and the financial aid
available to reduce costs, is clearly important to making sound decisions about learning pathways. Orton (2007)
speaks to the importance of school curriculum that fosters financial literacy.
16 CANADIAN POLICY RESEARCH NETWORKSBezanson et al. (2008) cite evidence that career development programs and services can reduce
dropout rates, increase aspirations and achievement, help people find jobs that match their talents
and interests, help employers meet skill needs, and generally improve the allocation of resources
in the labour market. The OECD, in Career Guidance and Public Policy: Bridging the Gap
(2004), has made the link between comprehensive, coherent career-development systems and the
advancement of a country’s labour market, social equity and learning goals.
Bell and Bezanson (2006), in a paper jointly published by CPRN and the Canadian Career
Development Foundation, look at career development services available for youth and young
adults in Canada, in school and out of school. Their key findings are as follows:
• In Canada, there is limited awareness of the benefits of career development and no national
career development strategy or standards for service quality or provision. Career
development services for youth are highly decentralized. They are neither coherent nor
comprehensive in scope. Some provinces are beginning to develop career development
service policies from kindergarten to adult education or from kindergarten to grade12.
• Services for youth are offered in schools (primarily), public youth employment centres and
non-profit youth employment centres. Youth (and adults) not in school have much less access
to services. Service provision is primarily career information and support with immediate
education and training decisions rather than career planning and preparation. Most
respondents to a 1999 survey of youth access to career information reported finding it
difficult to obtain what they needed to make an informed career decision.
• Data are scarce on the use of career services, especially by out-of-school youth.
• Decisions about the extent of and access to career services are often made at the school board
or institution level and are vulnerable to shifts in government policy and funding allocation.
• Voluntary “Standards and Guidelines” have been developed by a network of career
development practitioners. However, only Québec regulates the profession.
• A review of (limited, rarely longitudinal) research evidence suggests that career development
programs can:
o increase motivation to continue learning after high school;
o reduce the number of school leavers in either high school or post-secondary institutions;7
o increase career certainty and academic success;
o build work readiness;
o support the integration of labour market information;
o change attitudes to increase career choice (e.g. encourage women to consider non-
traditional occupations); and
o increase focus on a career path when work experience is attached to some form of career
development reflection.
7
Barr-Telford et al. (2003), looking at data from the Post-Secondary Education Participation Survey, found that
approximately 70 percent of students who left post-secondary education before completion cited lack of fit as
their main reason for leaving – the program didn’t interest them or was not what they wanted, or they were
unsure of what they wanted.
CANADIAN POLICY RESEARCH NETWORKS 17You can also read