Strategic Planning Through Transformation Strategies - Sundance, WY April 24, 2018
←
→
Page content transcription
If your browser does not render page correctly, please read the page content below
Strategic Planning Through Transformation Strategies –
Sundance, WY
April 24, 2018

Sponsored by:

Prepared by
Matthew Wagner, Ph.D.
Vice President of Revitalization Programs
National Main Street Center
53 West Jackson Blvd. Suite 350
Chicago, IL 60604
312-610-5617

Introduction
The “Main Street Refresh” initiative aims to rethink the traditional Main Street model so the
program is more responsive to economic context and its outcomes are directly measurable. The
Wyoming Main Street Program, a program of the Wyoming Business Council, has rolled out the
Refresh process in a number of its communities.

Every community has a unique set of place-based assets, anchors, and consumer markets that
help to define a healthy business district. Enhancing those efforts through a targeted economic
development strategy requires a more thorough understanding of the marketplace. One of the
best ways to help retain existing businesses and recruit new ones is by preparing information
about the specific customers who are currently served or who could be served by your business
district. The local commercial revitalization program provides a very important benefit by
developing a comprehensive analysis of the district market that aligns vision and consumer data
with transformation strategies that drive the organization’s revitalization programming. Most
market analysis consultants perform their work and provide local community leaders simply
with information. The Main Street approach is to work together with organization leaders to
understand the market data and develop comprehensive and execution driven strategies to
deliver economic development results. This approach accomplishes several goals.

    •       Builds local knowledge and understanding of your district’s economy to create a
            foundation for successful revitalization;
    •       Identifies current strengths of the business mix and existing business clusters
    •       Supplies relevant consumer data to the revitalization program so it can help existing
            businesses become stronger
    •       Identifies opportunities for future business attraction and business cluster
            expansion
    •       Builds a strategic framework for niche development, including real estate
            development, business development, promotions, marketing, branding, etc.

This philosophy is enveloped within the new Main Street Refresh. At the core of the Main Street
Refresh are economically-grounded “Transformation Strategies.” These Strategies will serve as
the foundation for the revitalization program’s work. Most of activities within the organization’s
annual workplan as part of the 4-Point Approach should then be guided by the Strategies and
aligned around an agreed direction and outcome. As part of the technical assistance, and as an
aid to making the new format easier to adopt, the National Main Street Center developed nearly
20 “off-the-shelf” strategies that can be employed in a range of conditions seen across a variety
of communities. These are, essentially, ready-made Transformation Strategies. They are a place
to begin and can be customized along the way. We have called this initial set “Catalyst
Strategies.” The goal of the provided service was to assist the Sundance community and
program leadership to identify the strategies that are the best fit by using information they
already have in hand or that can be easily obtained through data and survey collection.
Executive Summary
The following relates to a Strategic Planning Transformation Strategy analysis and development
technical assistance visit held on April 24, 2018. Attendees included Linda Klinck, State
Coordinator for Wyoming Main Street, and Matthew Wagner Ph.D., Vice President of
Revitalization Programs, National Main Street Center.

For Sundance, the team participated in a tour of the community, as well as read background
materials, evaluated data, and held a pre-survey exercise. We then evaluated key data sets
(demographics, buying power, sales leakage, and business inventory) and, based on what was
learned from the site visit, market data and community feedback, proposed three possible
Transformation Strategies. The draft strategies were presented at an evening public meeting to
assess reaction and garner feedback.

This memo summarizes the following:
    • Draft Transformation Strategies
    • Workplan Template with Starter Activity Ideas
    • Community Survey Results
    • Basic demographic, psychographic and trade area characteristics
    • Sales leakage
    • Business Mix Characteristics
    • Community Asset Identification

The outcome of the inputs (community survey; review of community and business assets, and
market data) resulted in the development of six (6) recommended transformation strategies for
consideration by the Sundance Main Street program and its key stakeholders. The
recommended transformation strategies are as follows (please note they are explained in
greater detail in the body of the report contained herein):

        •   Convenience – Civic
        •   Outdoor Recreation Lifestyle (Brewery/Café; Bike)
        •   Arts/Artisans
        •   Green Economy
        •   Culinary Experience
        •   Entrepreneurship Ecosystem

The transformation strategies are reflective of either a key identified consumer group, or
business cluster that is already prevalent and thus can be further expanded and/or has potential
and thus will likely require more resources, capacity and “building blocks” to fully establish. For
example, under consumer groups, the prevalent consumers consist of local residents and
outdoor recreation enthusiasts. Under key business clusters, there were no obvious clusters
outside of businesses in which arts and quality foods were part of their experience. While
perhaps a stretch, the two combined with a green economy focus (as demonstrated within the
psychographic findings) may be an interesting strategy to consider in order to layer market
opportunities. A critical factor would be developing programs/incentives that help to cultivate
and grow these businesses from micro enterprises to ones that could support a storefront
location.

The next step in this process will be to align on a selected strategy(s) and to discuss a work
planning process to begin the hard step of incorporating the strategy(s) into current work plans
and new activities that better relate and move the transformation strategies forward. The
Wyoming Main Street Program and National Main Street Center will schedule a visit for June
2018 to continue this process.
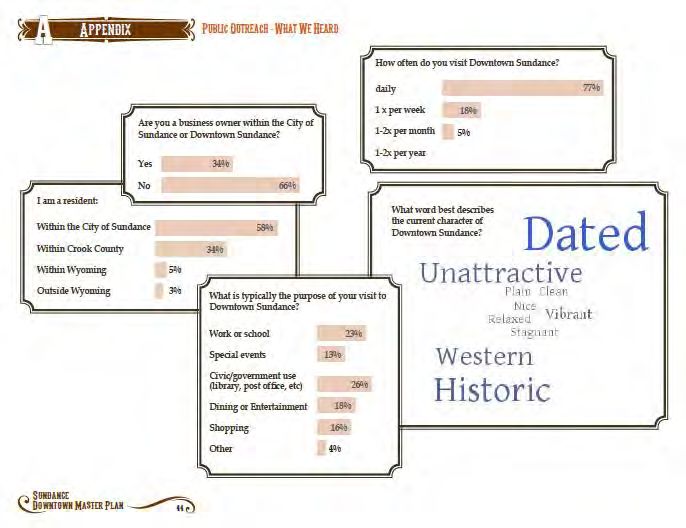
Community Survey Results
For Sundance, the town had recently undergone a quite extensive master planning process that
incorporated a number of community stakeholder meetings. As such, the team reviewed the
master plan meeting notes and it was felt that the findings would be consistent with the Refresh
Pre-Survey exercises. Thus, what is featured below are remarks provided by the community
relative to downtown Sundance during the Master Planning process that the team felt was of
interested and contribute to the findings necessary for development Transformation Strategies.
Results from a SWOT Analysis Process:
Market Overview
The market overview section evaluates the market based on trying to ascertain the inherent
competitive advantages of the Sundance community. Balanced with input from the community,
as well as current place-based assets and anchors we can develop Transformation Strategies.
The following represents summary charts of collected market data based on a series of 3 drive
times (5 min, 10 min and 20 min). All data is also provided in attachments for further review.
Below is the trade area map for which data was extracted.
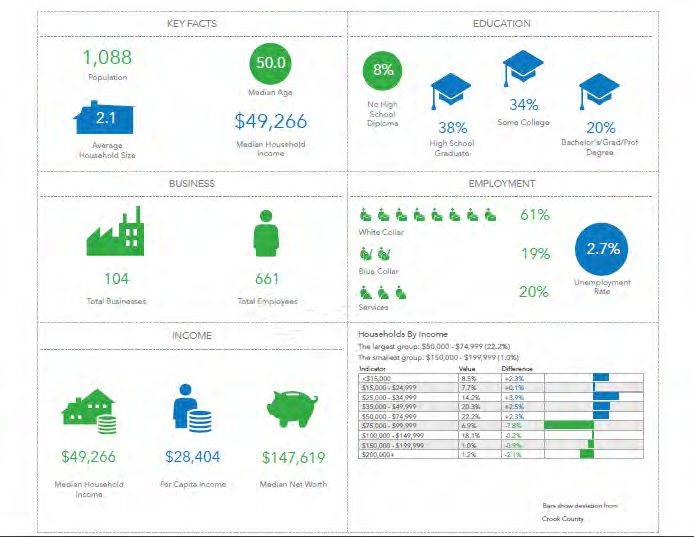
Demographic and Psychographic Characteristics Summary
The following represents a summary of key points that contribute to the development of the
transformation strategies from demographics and psychographics review: (Please note that
additional data is provided an attached document)
Psychographics is the study of personality, values, opinions, attitudes, interests, and lifestyles.
Psychographic studies of individuals or communities can be valuable in the fields of marketing,
demographics, opinion research, prediction, and social research in general. They can be
contrasted with demographic variables (such as age and gender), behavioral variables (such as
usage rate or loyalty), and organizational demographic variables (sometimes called firmographic
variables), such as industry, number of employees and functional area.
When a relatively complete profile of a person or group’s psychographic make-up is
constructed, this is called a “psychographic profile.” Psychographic profiles are used in market
segmentation, as well as in advertising. Some categories of psychographic factors used in
market segmentation include:
• Activity, interest, opinion (AIOs)
• Attitudes
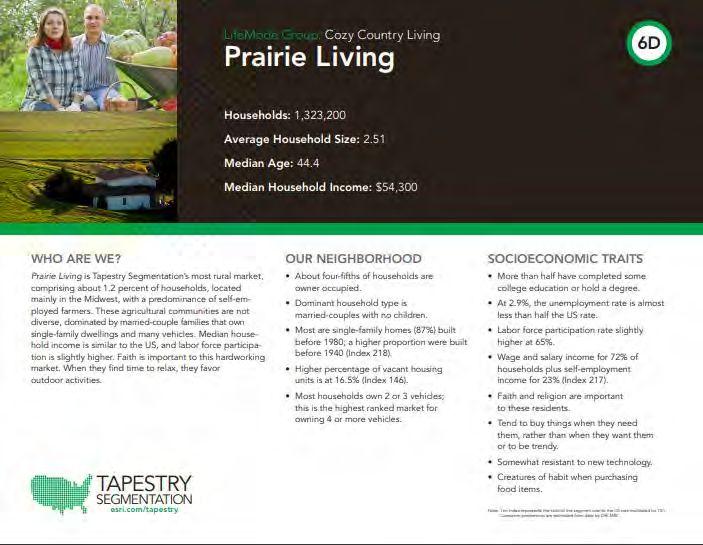
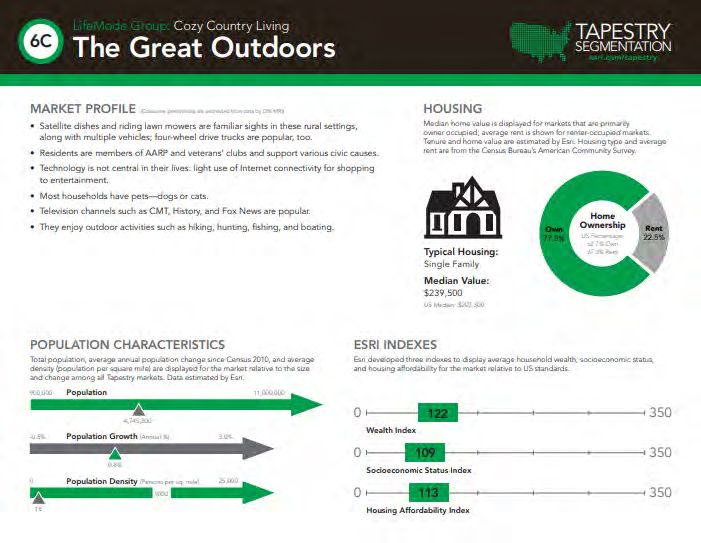
• Values• Behavior Tapestry psychographic data helps communities and businesses understand consumer lifestyle choices, what they buy, and how they spend their free time. Tapestry classifies US residential neighborhoods into 67 unique segments based on demographic and socioeconomic characteristics. The top psychographic profiles for Sundance are used to gauge possible shopping characteristics of downtown’s largest potential shopping demographic. For Sundance this consisted of the “The Great Outdoors” and “Prairie Living” segments. For the top two categories herein, the report are the segments as described by ESRI. In an attached file, each segment is highlighted as an HTML link which can be downloaded as pdfs.
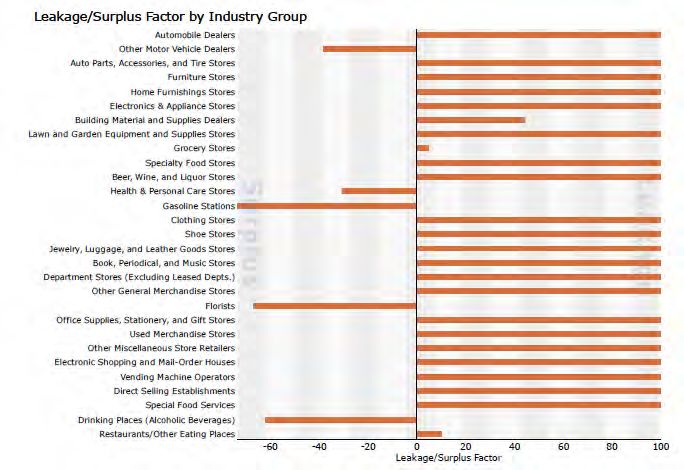
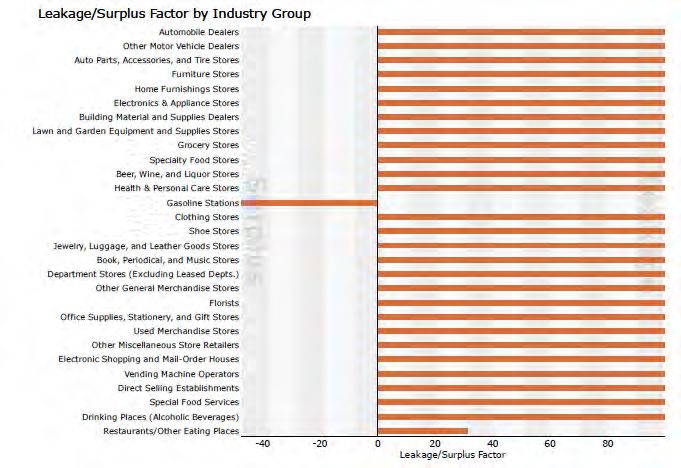
Sales Void Analysis

The Leakage/Surplus report provided for Sundance’s trade area measures the balance between
the volume of retail sales (Supply) generated by retail businesses and the volume of retail
potential (Demand) produced by households within the trade area spending on goods and
services.

          Leakage: Leakage in a trade area represents a condition where demand exceeds supply.
In other words, retailers outside the trade area are fulfilling the demand for retail products at a
greater rate than those within the trade area, therefore, demand is “Leaking” out of the trade
area. Such a condition can on one hand highlight a potential opportunity to recapture those
“leaked” sales, or suggests an inherent weakness within the trade area that may prove too
difficult to pull back those “leaked” sales. Please note the NMSC suggests that in most cases
downtowns should anticipate a 10%-20% recapture rate for “leaked” retail categories given a
robust recruitment and incentive effort.

         Surplus: Surplus in an area represents a condition where supply exceeds the area’s
demand. Retailers are attracting shoppers that reside outside the trade area. The “Surplus” is in
market supply. On one hand, there are many business clusters like Restaurants, Auto Dealers,
etc., in which an over-supply can suggest a large strength that can continue to be enhanced.
Whereas an oversupply in a retail market like floral doesn’t necessary mean the “Pie” can grow
any larger and thus may be fully saturated already and not worthy of further expansion.

The following graphic looks at leakages and surpluses for the downtown Sundance trade area
based on the zip codes designing the primary trade area:
(5 Minute Sales Gap Graph) (20 Minute Sales Gap Graph)
Market Data and Place-Based Asset Summary

In evaluating Transformation Strategies, market data never truly pinpoints the exact market or
competitive advantages for downtown. However, when combined with a review of the existing
business and community assets within both the downtown and on a regional level in some
cases, it can both support the Transformation Strategies, as well as provide the themes that help
to define the unique market position. The following relates to key Place-Based Assets that are
included along with market data and community input to better inform the transformation
strategy development process.

Place-Based Asset Summary –
        •   The Sundance Museum
        •   The Stoner Rehab
        •   The Women’s Business Resource Center
        •   Hardware Store (expansion in recreation focus)
        •   Collection of well-known local artists and gallery space
        •   Local Utility Company that is interested in green energy systems and community
            innnovation

Draft Transformation Strategies
Based on community feedback and survey input, coupled with market data and current business
mix reviews, we evaluated some early considerations by asking a few key questions to ensure
that the Strategies can provide unique, competitive positioning for downtown Sundance.

After some initial feedback we are recommending the following Transformation Strategies for
the Sundance’s Main Street program consideration. The Wyoming Main Street Program and
National Main Street Center would suggest that the Board of Directors consider each of the
possible areas, but select only one or potentially two to work on in the near-term. As with any
program, new or old, it is critical to focus your resources and capacity on transitioning your
efforts within the Four-Point Approach and begin to target, through Transformation Strategies,
specific market areas.
• Convenience – Civic
• Outdoor Recreation Lifestyle (Brewery/Café; Bike)
• Arts/Artisans
• Green Economy
• Culinary Experience
• Entrepreneurship Ecosystem#1. Convenience-Driven Transformation Strategy (Targets Largely Local Residents and Workers) People who work in a commercial district are likely to need a variety of convenience items, from groceries to carry-out meals and from small hardware items to greeting cards. They also need easy access to personal and professional services, such as hair care, daycare, and medical services. And, they are most likely to need things before work, at lunchtime, and immediately after work as they are leaving for home. People who live in and near the district need very similar products and services – but they are more likely to shop in the evenings and on weekends. The Workers + Residents Starter Strategy helps your revitalization program capitalize on these two important “captive” customer groups – and helps you meet more of their needs, making the district an even more appealing place for people to live and work. To maximize this strategy’s success, you will need to learn a bit about the characteristics and work and shopping habits of the district’s workers and residents. Marketing activities will then need to be geared towards their needs and interests and scheduled during times that work best for them. And, the range of products and services that are available in the district should be expanded, either by adding new product lines to existing businesses or by developing new businesses (or both). WHO ARE THE CUSTOMERS FOR THIS STRATEGY? People who work and live in and near the district are likely to encompass a very wide range of demographic characteristics – different ages, different household incomes, different education levels, different ethnicities – and to represent a wide range of shopping habits and preferences. But they almost always share a desire to have convenient access to daily staples, to have comfortable and convenient places to dine with friends and family, and to feel comfortable in and proud of the district in which they spend so much time. Just as customer profiles vary, the price points of the products and services they purchase can vary widely, too – though most businesses that offer convenience products and services to workers and residents fall into a middle price-point range. BENEFITS AND TRADE-OFFS Tapping into the district’s “captive market” of potential customers and expanding sales and services for them helps create a self-sustaining economic ecosystem in the district. It provides opportunities for existing businesses to expand sales by adding new products and services for workers and nearby residents and by offering deliveries within the district. It often generates new demand for housing in and near the district, as workers increasingly see benefits in living within easy walking distance of their work places. And, because workers and residents are a captive market, they do not require extra parking spaces. There are some trade-offs in pursuing a Workers + Residents strategy, albeit relatively minor ones. For instance, business owners must be flexible enough with their hours to be open during the times most convenient for workers and residents. And, because it is unlikely that independently owned businesses can match the prices for daily staples offered by chain grocers
and big-box stores or differentiate themselves on pricing from other nearby shopping venues,
businesses will need to be diligent in promoting their superior convenience, customer and
product knowledge, and friendliness.
SAMPLE ACTIVITIES
There are many different activities that your organization and its partners might do to
successfully implement this strategy. The activities you choose should address problems and
opportunities that are specific to your district. Start with activities that are relatively easy, then
gradually tackle more challenging ones. Be sure to include activities in all Four Points of the
Main Street Approach; this is essential!
Here are some examples:
Sample Design activities:
Create comfortable public lunchtime and weekend gathering places.
Change storefront window displays at least monthly. The people who live and work near the
district see its window displays almost every day. Keeping window displays fresh helps keep
them engaged.
Ensure that the pathways that workers and residents most frequently use to and within the
district are attractive, appealing, safe, and well maintained.
Work with property owners to identify opportunities to create upper-floor apartments and
condominiums for district workers and others interested in living in the district.
Sample Organization activities:
Include one or more district workers and residents on the revitalization organization’s board
of directors and in its committees.
Build and strengthen partnerships with nearby neighborhood associations.
Organize a series of “business after-hours” social events where district workers can meet
one another and become more familiar with district businesses.
Sample Promotion activities:
Schedule promotional activities during lunchtime and immediately after work, when the
district’s workers are most likely to be available.
Offer store deliveries to the district’s workers and residents.
Offer a district-wide customer loyalty program for workers and residents.
Sample Economic Vitality activities:
Add needed product lines to existing businesses.
Create and offer incentives to encourage district workers to live in and near the district.
Create and offer incentives to encourage district property owners to convert unused or
underused upper-floor space to apartments or condominiums. Periodically survey district workers and residents and/or conduct focus groups with them to
learn about their shopping habits, the things they like (and don’t like) about the district.
POTENTIAL PRODUCTS AND SERVICES
Adding new products and services to your district’s offerings does not necessarily mean adding
new, individual businesses. You might not have the market to support a whole new hardware
store, for example, but you might have enough to add some new product lines to an existing
business.
This list is not exhaustive, but illustrates the range of products and services that might be part of
in the Workers + Residents strategy. Product and service lines that might appeal to people who
live and/or work in the district include:
Groceries
Quick service restaurant meals
Sit-down restaurant meals
Prepared, take-home dinners
Pharmaceuticals
Health and beauty products
Office supplies
Coffee shops
Pizza
Greeting cards
Flowers and house plants
Gifts
Daycare
Dry cleaners
Snacks
Postal/pack-and-ship service
Medical and dental services
Accounting and tax services
Banking services
Small hardware items
Gas stations
Auto repair
Hair care
BarsMEASURING PROGRESS
The following tools can be used to track your success in implementing the strategy and in measuring its
impact on the commercial district as a whole:
Conduct on-street surveys when you implement this strategy – then, conduct surveys one year,
three years, and five years later, asking the same questions. Are more people patronizing the district
for its worker and resident-related businesses? Are their impressions and perceptions of the district
improving?
Your surveys should include questions in four specific categories:
o Attitudes and perceptions about the district
o Current shopping habits
o Additional products and services shoppers would like to be able to buy within the district
o Demographic characteristics of those participating in the survey, including home zip code
Track trends in the number of square feet of retail space devoted to strategy-related businesses.
Ask the owners or managers of a representative sample of strategy-related businesses to keep an
informal tally of foot traffic, average transaction amount, and gross sales. Interview the owners and
managers at regular intervals and hold an annual focus group with them. Are the numbers
increasing?
Track the number of changes (in service offerings or product mix) that businesses have made to
serve the worker and resident market.
Choose several intersections or entry points in the district and count the number of people who
walk by during 30 minute intervals. Do this at two or three key points in the day (e.g., morning,
noon, and evening). Repeat the pedestrian counts at least twice a year, at the same times of day.
Are the numbers increasing?
21 | P a g e#2. Outdoor Recreation Transformation Strategy The Outdoor Recreation strategy connects destination outdoor attractions with a nearby downtown or commercial district. The attractions themselves can be wide-ranging, including national or state parks, fishing or hunting areas, skiing, camping or hiking areas, rock (or ice) climbing, kayaking, boating, and others. While the attractions and activities are typically located outside the commercial center, they can be a source of customers for the downtown. Participants can be expected to make purchases in connection with their recreational visit, including things like specialized gear, bike or kayak rentals, specialty shoes, fishing or hunting supplies, specialized clothing, hiring of guides, as well as accommodations and restaurant dining. Communities known for their recreation or outdoor destinations often also attract a resident population that participates in the activities, as well. So, downtown sporting-related businesses may serve residents and visitors equally. Some communities may even incorporate the strategy into downtown public amenities: Boise, for example, built a “whitewater park” in the middle of the Boise River, which runs through downtown. The Outdoor Recreation strategy can also be a generator of local jobs, in retail, guides, hospitality, and other industries. WHO ARE THE CUSTOMERS FOR THIS STRATEGY? While Outdoor Recreation has a logical audience among younger participants in outdoor adventures, the market extends into empty-nesters and retirees. In fact, while older customers fitting this strategy may participate in less extreme activities (they may take day hikes instead of backpacking, for example), they tend to be more affluent, so their spending impact is greater as they take advantage of more retail, services, and hospitality related to the area they are visiting. BENEFITS AND TRADE-OFFS The Outdoor Recreation strategy builds on existing attractions and connects them to the downtown. Because these attractions often attract visitors from elsewhere (regional, national, or beyond), they import new customers and new spending into your community. Among the trade-offs, many outdoor-oriented communities experience seasonal highs and lows for businesses serving the recreation customer. SAMPLE ACTIVITIES There are many different activities that your organization and its partners might do to successfully implement this strategy. The activities you choose should address problems and opportunities that are specific to your district. Start with activities that are relatively easy, then gradually tackle more challenging ones. Be sure to include activities in all Four Points of the Main Street Approach; this is essential! Here are some examples: 22 | P a g e
Sample Design activities:
Add bike paths and bike racks in the commercial district (or other amenities that serve a recreation-
oriented user).
Build a recreational feature downtown, like Boise’s whitewater park.
Install way-finding system from outdoor attractions to downtown.
Sample Organization activities:
Convene the business owners and the managers of parks or recreational sites so they can
understand and further hone the strategy.
Work with the city to assess lodging tax revenues and determine how they could be strategically
used to enhance Sports and Recreation attractions.
Sample Promotion activities:
Develop an event downtown that connects to regional recreational attractions. Steamboat Springs,
Colorado, holds a winter carnival where some ski sports (that normally take place on the mountains)
are brought downtown – including “ski joring”, where a skier is pulled by a horse.
Host a competition series of dubious or spoof sporting events downtown to make a lighthearted
reference to the nearby recreational attraction.
Buy billboard space near recreational attractions, advertising downtown restaurants, lodging, or
other amenities.
Sample Economic Vitality activities:
Gather market data on visitors to sports and recreation destinations (e.g., geographic draw,
demographic profile, length of visit, size of party, etc.)
Develop self-service lodging above downtown storefronts.
POTENTIAL PRODUCTS AND SERVICES
This list illustrates the range of possible businesses, products, and services that might be part of the
Sports and Recreation strategy:
Apparel (casual/athletic)
Bicycle store w rentals
Boating/kayak/sailing/canoe sales/rentals
Camping and outdoor gear and equipment
Fishing equipment w rentals
Hunting equipment/sales
Locally produced products (food or gifts)
Lodging: inns, B&Bs, AirBNB
Pharmacy
23 | P a g e Recreational vehicle rental (off-highway vehicles, snowmobiles, motorcycles)
Restaurants (informal)
Shoes
Ski equipment sales/rental
Taxidermy
Urgent care
MEASURING PROGRESS
The following quantitative and qualitative tools can be used to track your success in implementing the
strategy and in measuring its impact on the commercial district as a whole:
Conduct on-street surveys when you implement this strategy – then, conduct surveys one year,
three years, and five years later, asking the same questions. Are you attracting more people who
visit sports and recreation sites to come downtown?
Ask the owners or managers of a representative sample of strategy-related businesses to keep an
informal tally of foot traffic, average transaction amount, and gross sales. Interview the owners and
managers at regular intervals and hold an annual focus group with them. For businesses that sell or
rent recreational equipment, what are the trends in their sales and rentals?
•
Survey business owners annually about sales trends. The survey should include questions like:
▪ Have you added any new product lines in response to the Sports and Recreation strategy?
▪ Have you added any new sales channels in response to the strategy?
▪ On a scale of 1 to 10, has the Sports and Recreation strategy positively impacted your business?
24 | P a g e#3. Crafts and Artisans Transformation Strategy An “Crafts and Artisans” Transformation Strategy encompasses a very broad range of creative industry businesses, including design, performing, broadcast, and even culinary arts – film, music, dance, sculpture, painting, photography, architecture, live theatre, catering, printing, furniture making, and much more. It also encompasses many other arts-related education, production, and distribution businesses and activities. In essence, it involves all creative industries. People who work in crafts disciplines and in artisan-related businesses are likely to have fairly specific space requirements and to have specialized equipment needs. A furniture maker might need large space with a loading dock and with hefty electrical service, for instance, while a painter might need a smaller space with lots of natural daylight. Some arts-related businesses depend on walk-by traffic and will need storefront space (art galleries, for example), while others prefer to be tucked away out of public view. Many people who work in arts disciplines are drawn to older and historic commercial districts, though – they like the one-of-a-kind spaces and unique architecture. And they like working around other creative people. Districts with significant concentrations of artisan-related businesses are likely to also have plenty of upper-floor housing and housing in nearby neighborhoods, as people who work in creative industries often like to live near where they work. In fact, there are development companies that specialize in creating “live/work” space for artists. They are also likely to be active throughout the day and evening – in part because creative-sector workers often set their own hours and work whenever they wish, and in part because arts businesses that offer live performances (like theatrical companies, jazz clubs, and orchestras) usually operate in the evening and on weekends. These businesses can generate useful (and often essential) business for restaurants, B&Bs, hotels, food stores, and convenience stores – and for other businesses that choose to capitalize on the evening traffic by extending their store hours. Many creative-industry businesses function as regional destinations. Businesses such as musical instrument stores, art galleries, performing arts theatres, for example, tend to attract customers from 50 miles or more. This could provide opportunities for the district to provide exposure for other types of businesses in the district to people visiting the district’s crafts and artisan-related businesses. To maximize this strategy’s success, you will need to learn about the types of work places that artists want, about the types of services and amenities they want and need nearby, and about how they currently exhibit or distribute their work. You will also need to learn something about the people who are likely to support their work – the people who buy their work, who distribute it, and who simply enjoy it. Marketing activities and public space improvements can capitalize on the presence of artsians to enliven the district, reinforcing its creative energy and distinguishing it from other commercial centers within the region. WHO ARE THE CUSTOMERS FOR THIS STRATEGY? The people who work in artisan-related businesses and disciplines are demographically diverse, and their customers are often equally diverse. Certain types of arts are likely to appeal to younger people, while others attract older people. Artisan and crafts preferences are also shaped by ethnicity, income, education, and many other factors. And some creative industries sell their products primarily to other 25 | P a g e
businesses, rather than selling them directly to consumers. Businesses such as neon sign makers and silk screen printers, for example, often sell most of their products to companies. BENEFITS AND TRADE-OFFS A Crafts and Artisans strategy can offer many benefits. For example, with the exceptions of arts-related retailers (like galleries and music stores), many creative industry businesses prefer upper-floor spaces and other peripheral spaces in the district (such as warehouses and garages) that might otherwise be difficult to rent. Because artists, designers, and others who create products often work late into the evening, the district is likely to look and feel livelier on a 24/7 basis. And, these businesses’ creative energy often makes the district more attractive to other types of businesses and to residents, offering the potential to boost the district’s occupancy. There are not many trade-offs involved in a Crafts and Artisans strategy. The most significant drawback is that, because artists and other creative industry workers are often very price-sensitive, increasing rents can sometimes make the district unaffordable for them. SAMPLE ACTIVITIES There are many different activities that your organization and its partners might do to successfully implement this strategy. The activities you choose should address problems and opportunities that are specific to your district. Start with activities that are relatively easy, then gradually tackle more challenging ones. Be sure to include activities in all Four Points of the Main Street Approach; this is essential! Here are some examples: Sample Design activities: Create a public art strategy for the district, tapping into the skills of the district’s creative-sector businesses. Pair district artists with retailers to design unique storefront window displays. Review the city’s zoning laws to ensure that they do not inadvertently discourage development and growth of creative-sector businesses. Sample Organization activities: Actively engage artists in the revitalization initiative’s planning activities. Encourage collaboration between artists and other district businesses for cross-merchandising, Sample Promotion activities: Launch an annual tour of artists’ studios, galleries, and other creative-industry work spaces in the district. Exhibit artists’ works in district businesses and display windows. Organize a culinary arts event, highlighting district restaurants. Sample Economic Vitality activities: Create and offer incentives to encourage artists to live in and near the district. 26 | P a g e
Put together and implement a development strategy to create a small hotel or inn within the district to support evening arts-related activities like theatre and music. Develop a co-working space for artists. POTENTIAL PRODUCTS AND SERVICES Crafts and Artisans represents one of the broadest of all industries. This is by no means an exhaustive list, but it illustrates the range of possible businesses, products, and services that might be part of the Arts strategy: 3D printing shops Architects and architectural design services Arts centers Arts-focused co-working spaces Art galleries Art restoration services Art supplies Bike Makers Craft Breweries Cartoonists Chocolatiers Coffee Roasters Costume rentals and sales Craft supplies Custom apparel and jewelry Custom sign makers Custom woodworking Dance costumes, shoes, and supplies Dance studios Distilleries Editors Fabric stores Fashion designers Film producers and film production studios Freelance musicians Graphic artists and graphic art services Live performance booking agencies Metal fabricators Movie theatres Music production studios Musical instruments Musical instrument repair services Museums Orchestras Performing arts centers Photographers and photography studios Photographic equipment and supplies 27 | P a g e
Picture frames and framing services Portrait painters and painting studios Pottery studios and supplies Publishers Recorded music (vinyl albums, CDs) Silk screening services Song writers Sheet music Tailors Theatrical equipment (lighting, scenery, sound equipment, etc.) Theatrical performance groups Visual arts, dance, music, and theatrical schools and instructional programs Writers Yarn, knitting, and weaving supplies MEASURING PROGRESS Every two years, update the number of square feet used by creative-industry businesses. Conduct pedestrian traffic counts at arts-related promotional events in the district and measure changes in traffic counts throughout the year and from year to year. Through periodic focus groups with a range of artists, business owners, residents, customers, and potential customers, gauge the level of awareness of the presence of arts and creative industries in the district. 28 | P a g e
#4. A Green Products Transformation Strategy

A “Green” strategy pursues an environmentally-friendly economy for the commercial district. It supports
businesses concerned with recycling and upcycling, and service businesses that use sustainable
practices, such as purchasing energy from renewable sources or delivering goods by bicycle.

A Green district prides itself on green building practices (which includes historic preservation) and the
management organization works to be at the leading edge of environmentalism. This may be visible in
public improvements and amenities like extensive bike lanes, rain gardens and water run-off retention,
and street lights designed for both low energy consumption and reduced light pollution. The strategy
should also be visible in the district’s commercial activities, such as small manufacturing businesses that
produce new products from old materials (upcycling) and businesses that commit to zero landfill waste.
Restaurants in a Green district source their products from sustainable suppliers, and they compost their
food waste. There are electric car charging stations throughout the district. If in an urban area, public
transit and car-share services are emphasized over personal cars.

WHO ARE THE CUSTOMERS FOR THIS STRATEGY?

A Green strategy targets customers who tend to be younger, highly educated, values-driven, design-
conscious, and active in their concern for their community and the planet. Core audiences may also
include young families, idealistic and aging “Boomers”, and others who care deeply about the
environment. A preference for locally-made and sustainably-sourced products aligns with these
shoppers’ values.
At the same time, many of environmentally-conscious customers may also be time-constrained
professionals. They often see online shopping (including grocery delivery) as compatible with their local
and environmental values: It is a way to save time and reduce driving. And it is an additional reason why
local businesses may want to invest in opening this sales channel.

BENEFITS AND TRADE-OFFS

The Green strategy is forward-looking and advances a long trend that can trace its origins to the early
1960s, but has only recently come to be almost-universally embraced and part of broad public
consciousness. Even as it is forward-looking, it leverages the layout and infrastructure of historic
commercial districts and traditional town planning, as compact development creates efficiencies in land
and energy use. A Green strategy can have local benefits while also being good for the planet.
While it is hard to argue with the virtues of an environmental friendliness, the Green strategy may prove
difficult in trying to get some existing, old-school businesses to embrace it. (There is also the more
opportunistic practice of “green-washing”, or trying to make non-sustainable products or practices
appear to be environmentally friendly.) In addition, some older or very traditional customers may not
identify with the strategy. Perhaps the greatest potential trade-off or barrier for pursuing the Green
strategy is its impact on price points: Local, organic, and green products tend to be significantly more
expensive than their conventionally produced alternatives.

SAMPLE ACTIVITIES

29 | P a g e
There are many different activities that your organization and its partners might do to successfully
implement this strategy. The activities you choose should address problems and opportunities that are
specific to your district. Start with activities that are relatively easy, then gradually tackle more
challenging ones. Be sure to include activities in all Four Points of the Main Street Approach; this is
essential!
Here are some examples:
Sample Design activities:
Plant rain gardens in the district with a goal of reducing surface run-off.
Incorporate recycled materials into public improvements, such as street furniture or paved surfaces.
Plant more trees in the district.
Install electric vehicle charging stations in the district.
Provide technical assistance for green-roof installations.
Sample Organization activities:
Partner with the city to improve recycling practices downtown.
Partner with local or regional environmental groups to involve them in the commercial district’s
strategy.
Partner with local utility company for plug-in electric car recharging stations.
Sample Promotion activities:
Make Earth Day the biggest “holiday” celebrated in the district.
Assess the district’s graphics and messaging to see if they need to be changed to align with the
Green Economy strategy.
Promote reusable bags.
Sample Economic Vitality activities:
Provide technical assistance to property owners on energy efficiency, geothermal heating and
cooling, insulation, and solar energy production.
Provide technical assistance to businesses on reducing their waste stream and adopting zero-
landfill practices.
Work with a local gym to transform it into a business that produces (rather than consumes)
energy by harnessing the energy people expend while exercising.
Provide assistance to businesses in sourcing more locally grown or manufactured products.
Focus business development activities on strategy-related businesses, such as upcycled, organic,
locally-sourced, or energy efficient products.
Reduce by-right development barriers by reducing parking requirements.
Eliminate paper receipts.
Help businesses buy used fixtures.
30 | P a g ePOTENTIAL PRODUCTS AND SERVICES
Some businesses are directly connected to the green economy, but almost any business can adopt green
practices. The strategy ties closely to customers who value independent businesses and local sourcing.
Here are a few examples:
Architectural salvage (retail)
Bicycles (retail and repair)
Building materials (recycled; eco-friendly)
Contractor with green building practices
Florist (locally sourced)
Furniture (e.g., used or made from salvaged or upcycled materials)
Grocery store (e.g., natural, organic)
Gym (especially energy-producing)
Health and beauty aids (natural)
Pet supplies (natural)
Restaurants (e.g., vegetarian, local sourcing, and/or reduced food waste)
Sporting/outdoor apparel
Thrift shops (recycled clothing, furniture)
Upcycle retailers (housewares, apparel)
MEASURING PROGRESS
The following tools can be used to track your success in implementing the strategy and in measuring its
impact on the commercial district as a whole:
Conduct on-street surveys when you implement this strategy – then, conduct surveys one year,
three years, and five years later, asking the same questions. Are more people patronizing the
district for its “green economy” businesses? Do they perceive the district as having a growing
focus on green products and services?
Your surveys should include questions in four specific categories:
o Attitudes and perceptions about the district
o Current shopping habits
o Additional products and services shoppers would like to be able to buy within the district
o Demographic characteristics of those participating in the survey, including home zip code
Track trends in the number of square feet of retail space devoted to green products and
services.
Ask the owners or managers of a representative sample of green-economy businesses to keep
an informal tally of foot traffic, average transaction amount, and gross sales. Interview the
31 | P a g eowners and managers at regular intervals and hold an annual focus group with them. Are the
numbers increasing?
Track the number of changes (in service offerings or product mix) that businesses have made to
serve the environmentally-conscious consumer.
32 | P a g e33 | P a g e
#5. Culinary Experience Transformation Strategy

Downtowns and neighborhood commercial centers have always offered food, both as groceries and as
prepared meals.

Historically, downtowns were where farmers brought their produce to sell it to the public. Virtually all
small towns in North America designated one or two days each week as “market days”, when farmers
would set up carts or stalls to sell fresh-from-the-fields produce to customers. Many larger cities had
permanent food markets downtown, where shoppers could buy fresh produce directly from farmers
almost every day.

Along with farm markets, downtowns were also the home of food stores. For centuries, these were
specialized stores – green grocers, bakeries, butchers, fish markets, confectioners, and many more. In
the late 18th and early 19th centuries, innovations in the grocery industry led to development of stores
that brought all these food specialties into one business – the modern grocery store. Then, as housing
and commercial development shifted from city centers to the suburbs in the mid-20th century, grocery
stores followed. By the 1970s it was relatively rare to find a grocery store still operating in a historic or
traditional downtown.

While grocery stores left downtowns and neighborhood commercial centers, restaurants and cafes
remained, offering sit-down and carry-out meals, and a social experience to district workers, residents,
shoppers, and visitors. In most communities, these are primarily locally owned businesses (chain
restaurants tend to locate downtown and in neighborhoods only when the market is strong, minimizing
their financial risk). Downtown workers and residents are often their primary customers, but many older
and historic commercial districts have created clusters of restaurants that, together, serve as regional
destinations and that often help support the districts’ entertainment- and arts-related businesses.

As interest in downtown living has grown, the need for downtown food stores has grown, also.
Downtown and neighborhood commercial district revitalization programs have been increasingly
successful in attracting grocery chains and in helping launch independently owned grocery stores to
support the needs of new residents. In addition, a growing number of older and historic commercial
districts serve as food production hubs, offering facilities where restaurateurs, caterers, food cart
operators, and others can prepare and package food for resale.

The Culinary Experience strategy expands the role of food sales and food service in older and historic
commercial districts

WHO ARE THE CUSTOMERS FOR THIS STRATEGY?

Everyone eats food, of course, so everyone is a potential customer. But the core customers tend to be
one of two groups:

▪   People who live or work in or near the district: For the people who live or work nearby, food is a
    convenience product.

34 | P a g e
▪ People looking for a social experience: Restaurants, cafes, and bars offer opportunities for social
interaction – a place to meet friends, to celebrate special events, to casually discuss business, or to
kick back and relax after work. Sociologist Ray Oldenberg calls these “third places” – places that, like
home (“first places”) and work (“second places”), are essential to civic life.
There are other potential customers, also. For instance, grocery stores, grocery wholesalers, and
restaurants might be customers for foods that are produced and packaged downtown. Downtown
restaurants might also provide catering services, serving the entire community or region. And
downtown grocers might offer local deliveries, reaching many potential customers.
BENEFITS AND TRADE-OFFS
The Culinary Experience strategy offers many benefits. Businesses are more likely to come downtown if
there are restaurants nearby where their customers and workers can dine. People are more likely to
rent apartments or buy condominiums downtown, and property owners are more likely to convert
vacant and underused upper-floor spaces into apartments, if there are food stores and restaurants
nearby.
There are a few trade-offs to consider. In particular, start-up costs for both restaurants and food stores
can be high. And, because inventory can spoil, work hours are often log, and profit margins can be thin,
successfully managing a food business is more difficult than managing many other types of businesses.
One often hears that “restaurants never work” in a particular location – but, often, the problem has to
do with the intrinsic challenges of managing a food-related business, not with the location itself.
Successful restaurants sometimes generate noise, and this can be disruptive to nearby residents. This is
more likely to be a problem with groups of restaurants that are open late into the evening. At the same
time, the vibrancy that successful restaurant clusters create can also attract new businesses and new
residents.
SAMPLE ACTIVITIES
There are many different activities that your organization and its partners might do to successfully
implement this strategy. The activities you choose should address problems and opportunities that are
specific to your district. Start with activities that are relatively easy, then gradually tackle more
challenging ones. Be sure to include activities in all Four Points of the Main Street Approach; this is
essential!
Here are some examples:
Sample Design activities:
Develop a public orchard in a pocket park.
Install banners to strengthen the visibility of the district’s restaurants.
35 | P a g eSample Organization activities:
Develop a partnership with the closest culinary school(s) within the region to identify potential
entrepreneurs for new food-related businesses for your district.
Develop a partnership with the US Department of Agriculture’s Rural Development office,
Agricultural Marketing Service, and other programs to identify potential sources of funding and
technical assistance to support some of your Food strategy’s activities.
Sample Promotion activities:
Organize a food festival to spotlight the district’s restaurants and other food-related businesses.
Sample Economic Vitality activities:
Create a program to help establish new restaurants, such as a deferred loan repayment program, an
incentive grant program, or a crowdfunding program.
Identify unique food items created by district restaurants and talk with restaurateurs about the
possibility of packaging and marketing them regionally or nationally.
POTENTIAL PRODUCTS AND SERVICES
There is an almost limitless range of potential food-related products, services, and businesses that a
commercial district might offer as wholesale products, retail products, or restaurant meals or ready-to-
serve foods. Some of the many possibilities include:
Grocery and food production:
“Corner store” small grocery markets
Year-round farm markets
Ethnic specialty food markets
Organic foods
Cheese shops
Herbs and spices
Butchers
Candy, chocolate, and snacks
Dairy store
Pre-prepared take-home meals
Brewpubs
Wineries
Distilleries
Commercial kitchen / food production coworking space
Culinary schools
Caterers
Olive oil and other condiments
Pickles
Cooking equipment and supplies (for home or professional kitchens)
36 | P a g eRestaurants:
Coffee shops, tea shops, juice bars, bubble tea
Breakfast and lunch sit-down restaurants
Quick service restaurants
“White tablecloth” lunch and dinner restaurants
Pizza
Restaurants offering ethnic cuisine (e.g., Chinese, Mexican, Thai, Japanese, German, Irish, Ethiopian,
Greek, Spanish, Korean, Italian, etc.)
Bakeries
Ice cream, frozen yogurt, frozen custard
Barbeque restaurants
Buffets
Cafeterias and automats
Bars and pubs
Diners
Brewpubs, wineries, and distilleries
Donuts
Entertainment:
Arts centers
Arts-focused co-working spaces
Art galleries
Art restoration services
Art supplies
Music production studios
Theatrical performance groups
Visual arts, dance, music, and theatrical schools and instructional programs
Music and jazz clubs
Nightclubs
Party rental spaces
Performance/concert space
Pool and billiards
Record stores (e.g., vinyl)
MEASURING PROGRESS
The following tools can be used to track your success in implementing the strategy and in measuring its
impact on the commercial district as a whole:
Conduct on-street surveys when you implement this strategy – then, conduct surveys one year,
three years, and five years later, asking the same questions. Are more people patronizing the district
for its food-related businesses? Are their impressions and perceptions of the district improving?
37 | P a g eYour surveys should include questions in four specific categories:
o Attitudes and perceptions about the district
o Current shopping habits
o Additional products and services shoppers would like to be able to buy within the district
o Demographic characteristics of those participating in the survey, including home zip code
Track trends in the number of square feet of retail space devoted to food (both restaurants and
groceries/food production).
Ask the owners or managers of a representative sample of restaurants and other food-related
businesses to keep an informal tally of foot traffic, average transaction amount, and gross sales.
Interview the owners and managers at regular intervals and hold an annual focus group with them.
Are the numbers increasing?
Track the number of changes (in service offerings or product mix) that businesses have made to
expand food-related sales or better serve the customers of these products and services.
Choose several intersections or entry points in the district and count the number of people who walk by
during 30-minute intervals. Do this at two or three key points in the day (e.g., morning, noon, and
evening). Repeat the pedestrian counts at least twice a year, at the same times of day. Are the numbers
increasing?
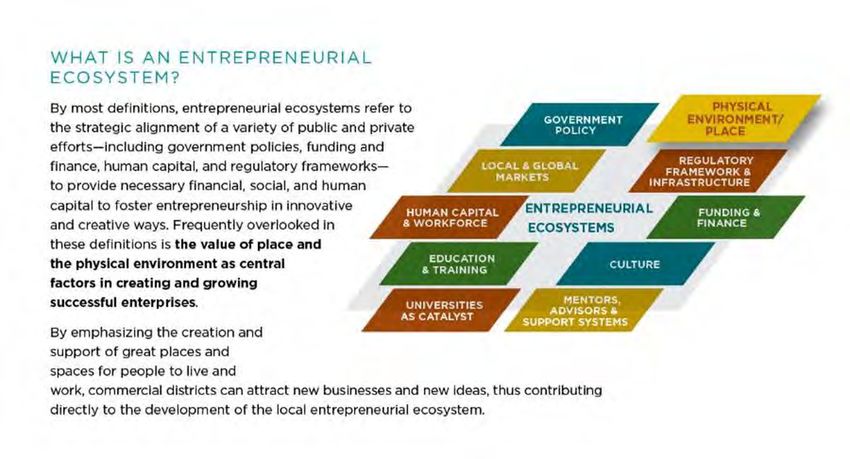
38 | P a g e#6. Building an Entrepreneurship Ecosystem Transformation Strategy In 2017, the National Main Street Center, with support from US Bank, developed a new resource guide entitled, “Entrepreneurship Ecosystems and the Role of Commercial Districts.” That guide is attached and provides several tools for getting started to assess your current entrepreneurship environment, bring together key stakeholders, and begin to develop a plan toward activating your own ecosystem that is supportive to new and growing entrepreneurs. WHO ARE THE TARGETS FOR THIS STRATEGY? Entrepreneurs who work in a commercial district are likely to need a variety of convenience items, from groceries to carry-out meals and from small hardware items to greeting cards. They also need easy access to personal and professional services, such as hair care, daycare, and medical services. And, they are most likely to need things before work, at lunchtime, and immediately after work as they are leaving for home. POTENTIAL PRODUCTS AND SERVICES Within the Entrepreneurship Ecosystem transformation strategy, while there is a focus on the development and support of entrepreneurs for downtown Sundance, an important segment of the ecosystem is creating an external environment and infrastructure supportive of their launch and growth. The following products and services represent both convenience retail and services as well as the “third space” components critical to this place-based focus. 39 | P a g e
Most definitions of third spaces involve the following elements: They represent “anchors” of community
life and facilitate and foster broader, more creative forms of interaction. Examples of third places would
be environments such as cafes, clubs, libraries, civic centers, and most recently breweries.
Convenience Supporting Retail and Services
• Groceries
• Restaurants
• Pharmaceuticals
• Health and beauty products
• Office supplies
• Daycare
• Dry cleaners
• Postal/pack-and-ship service
• Medical and dental services
• Accounting and tax services
• Banking services
• Gas stations
• Hair care
Third Spaces
• Bars/Brewery
• Cafes
• Drop-In Spaces
• Shared Space – Incubator/Accelerator
SAMPLE ACTIVITIES
The following are example tactics that align with the Entrepreneurship Ecosystem strategy using the
Main Street 4 Point Approach as the implementation framework. These should be viewed as near-term
strategies to create momentum and demonstrate incremental progress. Further, please note that any
existing programs facilitated by the community, as well as, local civic organizations that align with the
Entrepreneurship Ecosystem transformation strategy should be added to the workplan to show a more
holistic picture of the work being completed, as well as, to avoid unnecessary duplication of efforts.
Sample Organization Activities:
Invite new and/or emerging entrepreneurs onto your board or committees
Develop downtown clubs or networking activities for young professionals and entrepreneurs
Create New Partnerships
• SBDCs
• Local Universities and Community Colleges
• Tech Groups
• Young Professional Groups
• Media to Market New Ventures
• Developers
Sample Design Activities:
Enhance the local digital infrastructure, including cell, fiber and wi-fi networks
40 | P a g eYou can also read