Metrology of small particles and solute clusters by atom probe tomography
←
→
Page content transcription
If your browser does not render page correctly, please read the page content below
Metrology of small particles and solute clusters by atom probe tomography

                                                                                                           Frédéric De Geusera , Baptiste Gaultb,c
                                                                                             a Univ.
                                                                                                   Grenoble Alpes, CNRS, Grenoble INP, SIMaP, F-38000 Grenoble, France
                                                                                      b Max-PlanckInstitut für Eisenforschung, Max-Planck-Straße 1, D-40237 Düsseldorf, Germany
                                                                            c Department of Materials, Royal School of Mines, Imperial College, Prince Consort Road, London, SW7 2BP, UK

                                                     Abstract
arXiv:1910.10532v2 [cond-mat.mtrl-sci] 24 Feb 2020

                                                     Atom probe tomography (APT) is routinely used for analyzing property-enhancing particles in the nanometer-size range and below,
                                                     and plays a prominent role in the analysis of solute clusters. However, the question of how well these small particles are measured
                                                     has never been addressed because of a lack of a reliable benchmark. Here, to address this critical gap, we use an approach that
                                                     allows direct comparison of APT and small-angle (X-Ray) scattering (SA(X)S) performed on the same material. We introduce the
                                                     notion of an effective spatial resolution for the analysis of particles, which, importantly in this context, is very different than the
                                                     technique’s inherent spatial resolution. This effective resolution is highly specific to the system being considered, as well as the
                                                     analysis conditions. There is no hard limit below which the technique will fail, but particles with a radius of order of ~2σ = 1 nm,
                                                     i.e. ~250 atoms cannot be accurately measured, even though the particles are detected. This thorough metrological assessment of
                                                     APT in the analysis of particles allows us to discuss the pulse spread function of the technique and the physics underpinning its
                                                     limits. We conclude that great care should be taken when analysing solute clusters by APT, in particular when reporting particle
                                                     size and composition.
                                                     Keywords: atom probe tomography; small-angle-scattering; precipitation; solute clustering; metrology

                                                     1. Introduction                                                                     The presence of such clusters is usually assessed by com-
                                                                                                                                    paring the experimental data to an equivalent dataset in which
                                                          Atom probe tomography (APT) has progressively become                      the mass-to-charge ratio has been randomly swapped between
                                                     prominent as a tool for analyzing the composition of microstruc-               all the atoms present in a reconstruction [6, 7] or a statistically
                                                     tural features, i.e. precipitates, in the nanometer-size range and             random distribution [8]. The comparison to a random distribu-
                                                     below [1, 2]. This is particularly true for solute clusters [3].               tion is necessary to characterise a population of clusters [7, 9],
                                                     The detailed analysis of the composition of these precipitates                 but may not be sufficient. Cluster-finding techniques typically
                                                     and clusters is of high relevance to studies of the early stages of            rely on a fixed distance threshold, often referred to as dmax , be-
                                                     nucleation of new phases, which control both the physical prop-                low which atoms are considered to belong to a cluster [3, 10].
                                                     erties of materials and the further evolution of the microstruc-               Various criteria have been proposed to define dmax based on the
                                                     ture. If APT is often presented as a microscopy and microanal-                 comparison to random [11], yet there is no widely spread ap-
                                                     ysis technique, it is primarily a mass spectrometry technique [4]              proach that has been shown to lead to consistent results across
                                                     with a capacity to map the composition in three-dimensions in                  the community [12, 13]. Alternatives have been proposed, us-
                                                     a volume of solid material in the range of 100 × 100 × 500 nm                  ing radial distribution functions [14, 15], and their quantitative
                                                     [5].                                                                           analysis [16, 17].
                                                          There is a significant gap in the literature regarding the size                How to define APT’s effective spatial resolution? For a mi-
                                                     of the smallest microstructural object that can be precisely anal-             croscope, an infinitely small point source observed in the image
                                                     ysed. In a sense, this size could be seen as an effective spatial              plane through the entire imaging system usually appears dis-
                                                     resolution, below which individual objects cannot neither be ac-               torted. The shape and size of the image of the point source can
                                                     curately nor precisely characterized. Yet this concept is difficult            be assumed to be the response of the microscope to an impulse,
                                                     to define because: (i) it is likely highly dependent on the sys-               and is referred to as the point spread function (PSF). The PSF
                                                     tem being studied; (ii) the nature of the very small microstruc-               can be seen as the base unit of an image and it imposes a size
                                                     tural objects or particles, i.e. solute clusters, is ill-defined at the        limit: an object smaller than its size will appear having the size
                                                     atomic scale. There are still debates as to how to define a so-                of the PSF.
                                                     lute cluster and whether it is possible to distinguish between a                    Importantly, the PSF is not the technique’s inherent spatial
                                                     random fluctuation and a “real” cluster.                                       resolution or resolution limit. These two have only been as-
                                                                                                                                    sessed based on the analysis of known crystallographic param-
                                                          Email addresses: frederic.de-geuser@simap.grenoble-inp.fr                 eters of the sampled material and in the case of pure materials
                                                     (Frédéric De Geuser), b.gault@mpie.de (Baptiste Gault)                       [18–21]. The spatial resolution is known to be non-isotropic,

                                                     Preprint submitted to Acta Materialia                                                                                                 February 25, 2020
and better in depth than laterally.                                    tial resolution in the analysis of particles with size below 10 nm,
     Regarding the lateral resolution, local variations of the elec-   including solute clusters. We exploit a framework which allows
trostatic field cause deflections in the ions trajectories in the      direct comparison of APT and small-angle scattering (SAS).
early stage of their flight [22]. This combines with the possi-        We report results with X-Rays (SAXS) performed on the same
bility that atoms have a rolling motion on their nearest neigh-        material as the APT analysis. SAXS allows to detect composi-
bours at the surface before departure to cause a strong uncer-         tional fluctuations on the smallest scale and does not suffer from
tainty on the atomic positions upon reconstruction [23]. Both          the same artefacts as APT. Comparing between techniques for
aspects have a random component and are driven by the local            a range of Al-alloys and steels, we quantify the range of fea-
arrangement of the atoms at the surface and are hence nearly           ture size, i.e. radius of a spherical particle, for which APT fails
impossible to predict and correct. The lateral resolution was          to register the features of interest with relevant accuracy, and
shown to vary with the respective atomic packing on the ter-           discuss the reasons underpinning why APT does not seem able
races corresponding to various sets of crystallographic planes         to report sizes of particles with a radius below ~1 nm. To put
intersecting the specimen’s surface [24].                              our results into a broader perspective, we compare them to val-
     Regarding the depth resolution, it is limited in part by the      ues from the recent literature, including studies that combined
same aberrations but also by the reconstruction protocols. The         small-angle neutron scattering (SANS) or SAXS together with
current algorithm used to build the tomographic reconstruction         APT, highlighting the general character of our observations.
makes use of the sequence in which the ions are collected by
the position-sensitive detector to assign a depth coordinate to
                                                                       2. Framework for APT / SAXS comparison
each reconstructed ion [25]. The depth resolution varies sig-
nificantly across the field of view of a specimen, based on the             The approach we propose here makes use of radial distribu-
relative field evaporation behaviour of different crystallographic     tion functions (RDF) calculated from within the reconstructed
facets, as well as with the experimental conditions and the ma-        APT data [14, 31, 32]. The neighborhood of each ion of a spe-
terial under investigation [24, 26, 27]. Besides, the concept of       cific species is interrogated, and an average composition of each
depth resolution itself is ambiguous since it relates to a direc-      species as a function of the radial distance to each ion is estab-
tion normal to the surface of the specimen, rather than to a fixed     lished. De Geuser and co-workers described how to process
direction with respect to the reconstructed volume [24]. The           RDF from atom probe data using the formalism typically used
high value of the depth resolution can only be reached within a        to process small-angle scattering data [16, 17]. They introduced
sub-volume with a cross-section of only ~ 2 × 2 nm to 5 × 5 nm         an i − j pair correlation function (PCF) [15], γi− j (r), between
positioned close to crystallographic poles [24], and varies from       element i and element j by normalization and scaling of the
pole to pole.                                                          RDF:
     The question of the spatial resolution has thus been essen-                            γi− j (r) = CiCi− j (r) − CiC j           (1)
tially addressed for near-ideal cases and in subvolumes where
the resolutions is best, i.e. close to poles where one or more sets    where Ci− j (r) is the average local composition of j at a distance
of atomic planes were imaged. This can be ascribed to the fact         r of atoms of element i, as typically obtained from any RDF
that, first, atomic planes were the only reliable benchmarks that      computation software. Ci and C j are respectively the average
were available, with the notable exception of [28] who used            composition of element i and j in the considered volume. In
isotopic multilayers, and, second, that the community was in           particular, when i = j, we have:
search of a ultimate spatial resolution value.
     These studies were performed mostly on pure materials and                              γi−i (r) = CiCi−i (r) − Ci2               (2)
leave unanswered the critical question of the accuracy of the              Within this definition, the value of the pair correlation func-
technique in the analysis of actual property-enhancing microstruc-     tion becomes 0 at large r and its value at r = 0 corresponds to
tural features that exhibit a different composition, and poten-        the mean square fluctuation which, in a two-phase system, i.e.
tially structure, compared to the surrounding matrix. In the
                                                                       precipitates and matrix, can be written:
case of secondary phases, examples are sparse but revealing.
Araullo-Peter studied T1 precipitates in an Al-matrix. For a
                                                                                      γi−i (0) = ∆Ci2 = (C p − C)(C − Cm )            (3)
single microstructural feature of interest, they showed that the
decrease in spatial resolution caused by local changes in the          where we have dropped the i indices for the right part of the
field evaporation process can conceal obvious interfacial segre-       equation, and where C, Cm and C p are the average composi-
gation [29]. This work disproved previous claims by Gault et           tion, the matrix composition and the precipitates composition
al. [30].                                                              respectively.
     To our knowledge, the question of the effective spatial res-           A cartoon-view of a typical PCF is shown in Fig. 1. Its
olution for APT in the analysis of particles has never been ad-        typical features are highlighted, namely starting from the mean
dressed. This effective spatial resolution, which relates directly     square fluctuation (C p −C)(C −Cm ) and decreasing to zero, with
to the PSF, results from a combination of lateral and in-depth         a characteristic correlation length, which is related to the size
resolution applied to the study of clusters or precipitates, and       of the compositional fluctuations, and hence of possible precip-
relevant to the entire data set.                                       itates. Using the same formalism to process the PCF from APT
     Here, we discuss an approach to estimate this effective spa-
                                                                   2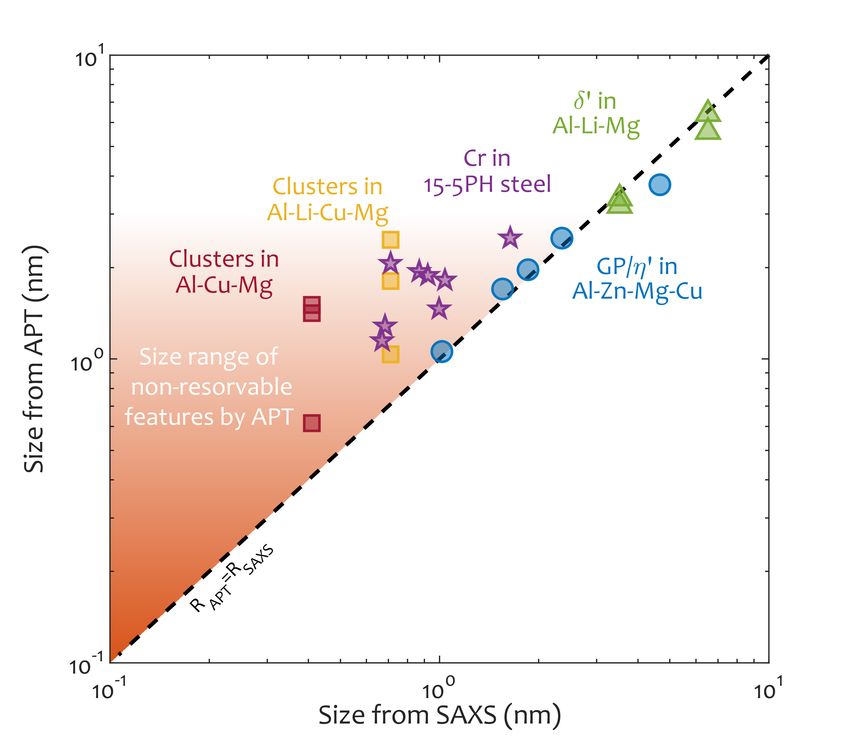
and the intensity from SAXS allows for directly, and consis-
tently, comparing data from both techniques for characterizing
precipitate size, volume fraction, number density for instance.
    The application of the technique is showcased in Fig. 2
across the ageing of a model Al-Zn-Mg-Cu alloy [33]. This
same alloy was used to introduce the protocol for APT data
[17]. In Fig. 2a are the Zn-Zn PCF for different ageing states
from as-quenched to overaged, along with the fitted lines com-
ing from the model. In this case, the model was a distribution
of spheres. The correlation function of a sphere of radius R is
given by [34]:

                    sphere               3r   r3
                   γ0        (r) = 1 −      +                 (4)
                                         4R 16R
when r < 2R and 0 elsewhere. The size distribution can be
integrated numerically. Here we used a lognormal distribution
with a 20% dispersity [17].
     The results indicate an increase of both the value at r =
0 and the correlation length. The amplitude increase can be              Figure 1: Schematic view of a correlation function in a binary solution. The
                                                                         value at r = 0 (which should be understood as a limit) is equal to the mean
related to an increase of volume fraction and/or composition of          square fluctuation which, in a matrix-precipitates system, equals (C p − C)(C −
the precipitates (eq. 3). The correlation length increase shows          Cm ). The width of the correlation function is a correlation length, which is
the growth of the precipitates.                                          related to the size of the fluctuations/precipitates.
     In Fig. 2b is the evolution of the radius of precipitates de-
rived from the PCF compared to a SAXS experiment during
which the sample was heat-treated in-situ at 120 ◦C for 24 h, af-        to the species-specific PCFs for Cu-Cu, Cu-Mg and Mg-Mg,
ter which the temperature is raised to 180 ◦C, in order to create        respectively.
the overaged state. The dashed vertical line marks the change                 The different composition, and potentially crystal structure,
in the temperature of the heat treatment. In this case, the match        of the particles compared to the matrix leads to differences in
in the particles’ radius between the two techniques is particu-          the electric field necessary to provoke field evaporation, which
lar good, with the notable exception of the last APT point in            is termed evaporation field. It is known that a difference in the
the overaged state for which APT size is smaller. This may be            evaporation field leads to the development of a local radius of
explained as the η0 precipitates are low-evaporation-field par-          curvature at the specimen’s surface and hence in the projec-
ticles, and local magnifications make them appear denser and             tion’s magnification [40]. In addition to a non-homogeneous
somewhat compressed [35].                                                magnification, these effects also cause trajectory aberrations and
                                                                         overlaps, leading to the loss of the expected one-to-one map-
                                                                         ping between the detector and the specimen’s surface. Mathe-
3. Results and discussion                                                matically, this is called the bijectivity. The significant additional
                                                                         uncertainty as to from which position at the specimen’s sur-
3.1. Precipitate size
                                                                         face does an ion originate is well documented in the literature
    We have then deployed this approach to a range of different          [40, 41], complemented by results from simulations [42, 43]. It
materials, revisiting data where SAXS and APT had been per-              is important to bear in mind that the atoms that belong to these
formed on the same alloys, which includes Al3 Li precipitation           particles are detected with a similar efficiency as the atoms from
in Al-Mg-Li alloys [36–38], Cr decomposition in 15-5PH steels            the matrix. This independence of the efficiency against the
[16] and clustering in an Al-Li-Cu-Mg alloy and an Al-Cu-Mg              mass-to-charge-state ratio of the incoming ion is a key strength
alloy [39]. In figure 3, we have represented the radius obtained         of APT.
by APT as a function of the radius obtained by SAXS for these                 However, trajectory overlaps will lead to either atoms from
data, along with the results presented in Fig. 2 for the Al-Zn-          the precipitate being imaged within the matrix or vice versa,
Mg-Cu alloy. The remarkable agreement in the case of Al-Zn-              atoms from the matrix being imaged inside the precipitate. This
Mg-Cu was already shown in Fig. 2b and that for Al-Mg-Li had             loss of bijectivity caused by trajectory overlaps is, in many
been discussed in an earlier effort [38]. The decomposition of           ways, much more problematic than a local change in the mag-
Cr in the matrix in 15-5PH steel is however deviating, with the          nification in the sense that it involves a stochastic ”blurring” of
radii obtained from APT about twice larger than those obtained           the positions of the atoms. This is highly relevant for precipi-
by SAXS.                                                                 tates with radii in the range investigated here, i.e. below 10 nm.
    The disagreement is even larger for both the Al-Li-Cu-Mg                  The net effect of this loss of bijectivity is a blurring of the
and Al-Cu-Mg alloys where we expect very small clusters. For             objects so that they appear larger or smaller than they really are,
these two data sets, a single size is reported from SAXS, while          making the data points in Fig. 3 deviate from towards larger
3 distinct sizes have been reported on Fig. 3. These correspond
                                                                     3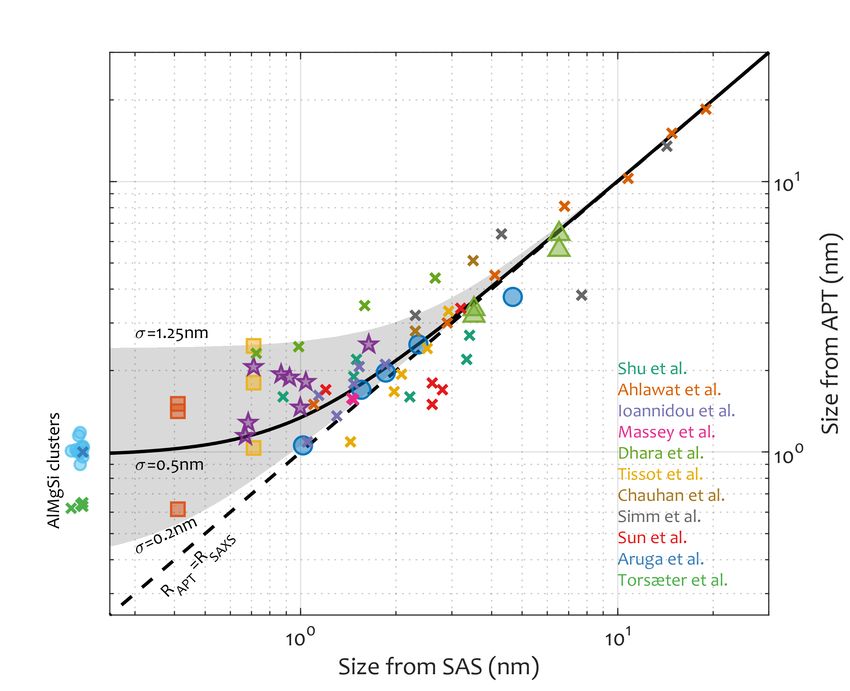
Figure 3: Radius of objects obtained by APT as a function of the radius obtained
                                                                                      by SAXS. If we neglect the uncertainty on the size obtained by SAXS, the
                                                                                      dashed RAPT = RS AXS line should be seen as a reference. The smallest objects
                                                                                      all deviate towards larger APT sizes.

                                                                                      apparent size. This can be understood as if they were subjected
                                                                                      to an effective spatial resolution convoluted with these objects
                                     (a)
                                                                                      within the volume. This effective spatial resolution does not
                                                                                      define the smallest detectable object, but the smallest apparent
                                                                                      size of an object.
                                                                                          The excellent agreement between APT and SAXS appears
                                                                                      for the larger particles, but also in cases where they require a
                                                                                      lower evaporation field compared to the matrix. This leads to
                                                                                      a compression of the trajectories, which, in the case of large
                                                                                      particles, leads to an underestimation of the particle size. This
                                                                                      compression is more markedly visible in the overaged state of
                                                                                      the Al-Zn-Mg-Cu alloy, as seen in 2b. In the case of small
                                                                                      particles, this compression of the trajectories most likely partly
                                                                                      compensates the effect of the trajectory overlaps, leading to the
                                                                                      excellent agreement of the other data points for Al-Zn-Mg-Cu
                                                                                      alloy. This is in stark contrast with the results obtained for
                                                                                      particles with a higher evaporation field than the matrix [35,
                                                                                      40]. For instance here, the Cr-rich particles in the 15-5 PH steel
                                                                                      or the Cu-rich clusters in the Al-Cu-Mg or Al-Li-Cu-Mg alloys
                                                                                      exhibit radius from APT two- to three times larger than those
                                                                                      measured by SAXS, with a large scatter in the radius derived
                                     (b)                                              from APT across different data sets. This lack in accuracy and
                                                                                      precision of the measurement and the discrepancy with SAS
Figure 2: (a) Zn-Zn pair correlation functions (PCF) obtained by APT on a             will be further discussed below.
model Al-Zn-Mg-Cu alloys for different ageing times (circles) along with the
                                                                                          A similar element-specific compression of the trajectories
fits from the method in [17]. Both the amplitudes and correlation lengths in-
crease with ageing times. (b) Size of the precipitates obtained by in situ SAXS       also explains why the sizes obtained on the partial PCFs cal-
(blue dots) and ex situ APT (red circles). The agreement is very good.                culated for same population of clusters are not equal. This is
                                                                                      the case for the Cu-Cu, Cu-Mg and Mg-Mg PCF from data sets
                                                                                      of Al-Cu-Mg and Al-Cu-Li-Mg alloys for instance. This ob-
                                                                                      servation stresses the fact that the effective spatial resolution of
                                                                                      APT should be considered to be element and phase specific, as
                                                                                      already pointed out by other authors [44].

                                                                                  4
3.2. Influence of the instrument however, is that molecular ions are often metastable and can
Our results point to some of the key limitations in detecting dissociate during the flight. Müller et al. reported that such dis-
small particles by APT. The data used in Fig. 3 were acquired sociations leads to a difference in the average distance between
on a range of different instruments, some with a straight flight detector impacts [52], which are indicative of additional trajec-
path, some fitted with a reflectron, and with different detection tory aberrations during the ion flight. Further work confirmed
efficiencies (see section 3.5 for comparisons with even more these trends in the analysis of oxides and nitrides and carbides
experimental configurations). While many authors discuss the [53–56]. Depending on the energetic path during these disso-
detrimental effect of a limited detection efficiency in the con- ciative processes, the possible exchange of energy between the
text of clustering studies, based on present findings, we believe charged fragments that leads to additional aberrations in the ion
that effective spatial resolution is really the first order limiting trajectories that would lead to a further deterioration of the ef-
factor. Even in articles claiming otherwise using simulated data fective spatial resolution [53, 56].
(see [45] for instance), the influence of the detection efficiency
appears minimal. 3.4. Influence of a limited spatial resolution on the RDF
In addition, the data was sometimes acquired with voltage The spatial resolution in APT is non-isotropic, with the depth
or laser pulsing at various base-temperatures. The influence of resolution expected to be better the lateral spatial resolution
the base temperature on the precipitate size measurement was [18, 19]. However, the spatial resolution varies systematically
shown to be limited [46], but issues associated to the asym- across the field-of-view, by a factor of 5 or more across in depth
metrical specimen shapes or variations in the end-radius over and two or more laterally [57]. Changes in resolution with i.e.
the course of the analysis [47] are not accounted for in the re- the base temperature previously reported also mean that during
construction protocol implemented in the commercial software a single analysis in laser pulsing mode, the spatial resolution
used to process the data [48]. These aspects may introduce ad- will also change. Defining an effective resolution that reflects
ditional uncertainties are introduced by the experimental con- an average resolution is hence a more practical but also more
ditions, however these have a rather limited effect on the close- honest way to depict the true performance of the technique.
neighborhood of each atom [49], and their influence on the de- In the case of a particle in a matrix, a limited resolution
tection and size of clusters is hence expected to be limited. The results in an interfacial mixing. Let us consider the case of
reflectron may be more critical as it introduces systematic bi- the Al-Mg-Li alloy. High-resolution electron microscopy stud-
ases in the point density across the field-of-view due to the cur- ies of L12 ordered precipitates in an Al-matrix, such as the δ0
vature of the ion trajectories. Some are corrected by the analysis precipitates in the Al-Mg-Li alloy investigated here, suggest an
software, but how much is difficult to assess. All these effects abrupt interface between precipitate and matrix [58]. Yet, APT
contribute to a worsening of the effective resolution and to the data most often shows a diffuse interface [37], which can be,
scatter observed in the data in Fig. 6. at least partly, attributed to the limited spatial resolution of the
The use of a fixed distance threshold used in the cluster- technique. Other issues could arise from processing of the data
finding algorithms will lead to cluster detection biases across itself [59], but they are likely a second order aspect. The sharp-
the field-of-view, i.e. clusters may appear smaller or larger de- ness of the interface might thus be a first benchmark of the ef-
pending on where they are detected because of the reflectron. fective spatial resolution.
This systematic bias has not been discussed as such. The use of A limited resolution can be modelled by convoluting the
an RDF-based technique, which does not use a fixed threshold, data with a resolution function. Since we describe the objects
allows for circumventing such issues and provides a better aver- by their pair correlation function (PCF), let us model the effect
age view of the distribution of clusters within the reconstructed of the resolution on the shape of the PCF. We can assume the
volume. spatial resolution as being a Gaussian function with a standard
The strongest limitations is the influence of the trajectory deviation σ. Numerically convoluting a PCF shape by the res-
aberrations, which are mostly independent on the design of the olution function leads to a resolution-affected PCF, keeping in
instrument, and underpinned by the physics of the field evapo- mind that the convolution should be performed on γ · r, since
ration process. we are in spherical coordinates, see e.g. [60]. The convolution
of this Gaussian function with a typical PCF from a precipitate
3.3. Influence of molecular ion detection is shown schematically on Fig. 4a.
An initial important consideration is that the use of a Gaus-
Since the effective spatial resolution is dictated by the field
sian function to describe the spatial resolution allows us to quan-
evaporation process, an aspect to consider is the possibility that
tify the smallest apparent radius that can be measured, i.e. 2σ,
molecular ions can be detected, as is often the case in the anal-
since the resulting convoluted PCF will have at least this width.
ysis of carbon and nitrogen in steels [50]. Molecular ions are
Besides a widening of the PCFs, i.e. of the correlation length,
often detected in APT. Since ion trajectories are directly related
the convolution also causes a drop of their amplitude, i.e. of the
to the distribution of the electrostatic potential and are indepen-
apparent composition of the particle, which will be discussed
dent on the voltage and the ion’s mass and charge [51], to a first
further below. Another distinctive effect of the convolution with
approximation, molecular ions should follow the same trajec-
a resolution function is that it tends to flatten the initial slope of
tories as their atomic counterparts emitted from the same posi-
the PCF towards zero. A sharp interface between precipitates
tion at the surface of the APT specimen. An added complexity,
and matrix should give rise to a non-zero initial slope in the
5correlation function. A zero initial slope thus corresponds to
an apparent diffuse interface, as is visible in Fig. 4a. This is
the real space version of what is known in the scattering com-
munity as the Porod law [34], whereby the initial slope of the
correlation function is related to the specific surface, i.e. the
inverse of the particle size for spheres.
Let us consider an experimental case. As discussed above,
the δ0 Al3 (Mg,Li) precipitates can be assumed to possess a rea-
sonably sharp interface. Yet, the Li-Li experimental PCF shown
in Fig. 4b shows a distinctive initial slope characteristic of a dif-
fuse interface. Here, we were able to reproduce this feature by
convoluting the PCF obtained for a sphere by a Gaussian func-
tion with a standard deviation of σexp = 0.66 nm to account for
the spatial resolution. This value of σexp is extracted from a
best fit to the experimental data. This effective spatial resolu-
tion is relative to the analysis of this particular set of particles
and is compatible with the set of observations in Fig. 3 where
APT seems to hit a limit in apparent size at about 2σ = 1 nm.
Beside the effect on the apparent size and on the apparent
sharpness of the interface, we can now evaluate the effect of this
spatial resolution of the apparent composition of the particles
detected by APT. To better illustrate this influence, we gener-
ated a series of virtual data sets containing a spherical particle
with a composition of 100% of solute in a matrix devoid of so-
lutes. The radius of the precipitate was varied in the range of
(a)
0.5–8 nm. To simulate finite spatial resolution, a Gaussian noise
with σ = 0.5 nm is used to randomly shift the position of each
atom. We plot radial composition profiles obtained on each vir-
tual data set in Fig.5a. A radial composition profile is an ideal
situation in that the particles are isotropic by construction and
we know the position of their centre. This emulates the effect
of the resolution as measured by a 1D profile or a proxigram,
suppressing any smoothing effects due to the data processing
itself [59, 61].
For larger precipitates, only an intermixing of the particle
and the matrix appears near the interface. Below 2 nm, how-
ever, the limited resolution causes a significant drop in the com-
position of the particle even at the core of the particle. The
apparent composition drops from 100% down to ~25% for the
smallest precipitate size.
While this gives an estimate of the effect of a spatial resolu-
tion on one-dimensional profiles, it is also interesting to assess
how it would affect cluster identification method results on the
precipitate contents. Let us assume an optimized cluster identi-
(b)
fication methods which correctly identifies all solutes atoms be-
longing to the precipitates. The average composition of the de- Figure 4: (a) Illustration of the effect of the convolution of the PCF with a
tected cluster could then computed from the profiles in Fig. 5a, (Gaussian) spatial resolution. The apparent size is larger, the apparent ampli-
where the average is weighted by the number of atoms in each tude smaller and the initial slope indicates a diffuse apparent interface. (b)
Experimental Li-Li PCF in an Al-Li-Mg alloy [37, 38] showing a zero initial
class. The results are shown in figure 5b, where the average
slope, consistent with the convolution of a sharp interface with a 0.66 nm spatial
composition of each simulated precipitate is represented by the resolution.
colored circles. The grayed area corresponds to the range cov-
ered by the function for values of σ ranging from 0.2–1.5 nm.
The solid line in Fig 5b has been obtained by convoluting an
analytical PCF with a Gaussian function and plotting the drop
in amplitude, confirming that the PCF formalism is affected by
the same bias than the average composition. We can see that the
mean composition is always significantly below 100%, even for
6precipitates as large as 8 nm in radius. It even drops below 10%
for the 0.5 nm particle. It is counter-intuitive that even larger
particles are so much affected, since blurring should affect only
the interfacial area. The reason for this is that, most of the atoms
are, in fact, within the interfacial region.
3.5. Comparison with experimental reports from the literature
Regarding considerations of particle size, we plotted in Fig. 6
the apparent size of the particles as a function of their real size
as reported by experimental studies using both SAXS or SANS
and APT. The crosses correspond to data from recent literature
[62–72] covering a range of alloy systems, including maraging
steels, Fe-Cu alloys, ODS-steels, Al-based alloys. We simply
plot the values reported in tables or graphs. Please note that
the values of the size in SAS were obtained through different
data processing routines. The other symbols correspond to data
already discussed above. The data points to the left of the y-
axis are for Al-Mg-Si alloys for which SAXS does not yield
satisfactory signal, and only APT data is available (see below).
Superimposed as a black line is the result of the convolu-
tion of an analytical PCF with a Gaussian function, and the
resulting apparent size obtained for σ = 0.5 nm. The grayed
area is bound by the curves corresponding to σ = 1.25 nm and
(a) σ = 0.2 nm. Figure 6 confirms that experimental sizes obtained
by APT are compatible with an effective size resolution in the
range σ = 0.5 nm, which does not allow an apparent size below
2σ, i.e. below ~1 nm.
This limit does not correspond to the smallest detectable
objects, but to the precision limit, i.e. the smallest apparent
size APT is able to report. This corresponds to the point spread
function of the instrument, i.e. its response to a sub-resolution
object. It is crucial to remember that this might be specific to an
alloy system, its microstructure and the analysis condition, as
can be inferred from the scatter of the data which is reasonably
captured by the grayed area.
3.6. Comparison with spatial resolutions considered in the lit-
erature
These values of σ are much broader than spatial resolu-
tion values usually reported for APT in the literature. For bet-
ter comparison, it is important to keep in mind that σ is here
the standard deviation of an isotropic Gaussian resolution func-
(b)
tion. The literature often quote the resolution as 2σ or FWHM
Figure 5: (a) Radial composition profiles obtained on simulated data sets con- (2.35σ) which, for the values of σ reported here, would put the
taining spherical precipitates of various sizes, with a random noise reproducing resolution around 1 nm with a minimum of 0.5 nm and values
a Gaussian spatial resolution of σ = 0.5 nm. For smaller sizes, even the core as high as 3 nm in many cases.
composition is affected. (b) Mean composition of the precipitates above, show-
ing that a cluster identification will significantly underestimate the solute con-
In addition, the effective spatial resolution should be con-
tent of precipitates, even for relatively large sizes. The solid line was obtained sidered as a rotational average of the resolution in all directions.
separately by computing the drop in amplitude of an analytical spherical PCF Since APT resolution is considered anisotropic, some APT res-
due to convolution with a Gaussian of σ = 0.5 nm, confirming that the PCf olution estimations report separated values for depth resolution
formalism is affected the same way. The grayed area is bounded by the curves
obtained for σ = 0.2 nm and σ = 1.25 nm. σz and lateral resolution σ xy . In this case, the average effective
resolution can be expressed as
s
2σ2xy + σ2z
σeff = (5)
3
7Figure 6: Radius of objects obtained by APT as a function of the radius obtained by small-angle scattering (SANS or SAXS). The solid line is the modeled effect
of a Gaussian resolution function with σ = 0.5 nm, along with a grayed area bound by the σ = 1.25 nm and σ = 0.2 nm curves. In addition to the data points from
Fig. 3, we have extracted data from recent literature as crosses [62–72]. The symbols outside the axis correspond to clusters in Al-Mg-Si alloys where SAS sizes
are unavailable. Clusters in these alloys are expected to be very small.
Several spatial resolution values for APT can be found in However, up to now, there was a lack of benchmark against
the literature (e.g. [18, 19, 21, 26, 32]) which, for 2σ, are in the which APT sizes could indeed be measured or estimated. Com-
range 0.05 nm in depth and about 0.2 nm laterally in the worse parisons with other techniques were reported for features of a
cases. This corresponds to an effective σ of 0.08 nm where what size that is large enough to be measured by transmission elec-
we report is up to 15 times this value. This should clearly be tron microscopy [46] or secondary-ion mass spectrometry have
attributed to the fact that spatial resolution of APT has tradi- been reported [73]. However, the match was often poor for
tionally been estimated in ideal situations with little practical smaller features like, for e.g., solute clusters, which remain
interests. physically ill-defined and for which there are no reference from
real-space analytical techniques. Here, we used information
gathered from SAS. When the signal is high enough, SAS can
4. General discussions
provide accurate size measurement for extremely small parti-
With APT being sometimes referred to as a microscopy cles. A lower limit is sometimes reported in the literature (e.g.
~1 nm [74] for SANS) but it relates to an instrument-dependent
technique, the question of the resolution very often arises. Ex-
isting attempts at estimating the resolution have focused on the estimation where the signal becomes too low to be detected.
highest achievable spatial resolution, obtained on atomic planes For SAS, the key issue is the signal intensity, and not the spa-
in a limited sub-volume along a given crystallographic direc- tial resolution: if a signal is gathered, it is precise.
tion. The value of this optimal spatial resolution is, however, However, since SAXS relies on electronic density contrast
only marginally useful since it corresponds to situations of vir- and SANS on scattering length density, there are cases where
tually no practical interest. The results shown here are an at- SAS is essentially blind to clusters. It is for instance the case
tempt to estimate an effective spatial resolution in a practical of the Al-Mg-Si alloys which have been subject to numerous
context, namely the study of clusters/precipitates in a matrix. studies since their mechanical properties of industrial relevance
While many authors discuss the detrimental effect of a lim- are due to very fine clusters which prove not resolvable by any
ited detection efficiency in the context of clustering studies, other technique than APT [75].
based on present findings, we believe that effective spatial res- Since it is a classic system for clustering studies, we have
olution is really the first order limiting factor. Even in articles added to Fig 6 the size obtained by APT PCF on several Al-Mg-
claiming otherwise using simulated data (see [45] for instance), Si-Cu alloys in different states in the course of an unpublished
the influence of the detection efficiency appears minimal. study. In total, they represent 12 different metallurgical states.
Since we have no SAXS results to benchmark the values, and
8since we expect them to be small, we represented the 12 data spatial resolution. For instance, Hyde et al. [81] used what
points outside the graph, to the left of the ordinate axis. The can be computed through eq. 5 as an effective resolution of
important result is that they are all about 1 nm in radius. The 0.19 nm, Ghamarian et al. [82] used 0.35 nm and 0.52 nm (and
physical size of the clusters is not often reported in the litera- concluded that clusters below 1 nm were not correctly mea-
ture, but when it is, a value of about 1 nm is often found and we sured), Hatzoglou et al. [83] used 0.16 nm and 0.39 nm (and
have added results from this alloy system as crosses on the left started their analysis on 1 nm precipitates), Hyde et al. [84]
of the axis [71, 72]. In many of the AlMgSi clustering studies, used 0.25 nm and 0.5 nm and Jägle et al. [85] used 0.2 nm.
a radius of 1 nm is actually the smallest detected size. A sphere The values that we report here seem to correspond to the
of radius 1 nm represents 250 to 300 atoms, depending on the worst case scenario of these studies, when problems start to
atomic volume, which is a surprisingly high value for a minimal arise. Possibly, most of the authors expected that the detection
size of detected clusters. efficiency would be the worst offender in terms of cluster iden-
The point spread function of APT can not be considered as tification, while most studies show that is has only marginal
a unique feature, as is possibly the case for some microscopy effects (see e.g. [85]). More worryingly, applying such meth-
techniques. It is directly related to how trajectory aberrations ods could result in the creation of “ghost” clusters, in partic-
will affect the measurement, and this is directly dependent on ular in the case where the matrix contains significant amount
the size and composition of each features of interest. In addi- of solutes. Further investigations are required on these aspects,
tion, it is affected by how the measurement itself is performed supported by field evaporation simulations.
[76, 77], by how the raw data is reconstructed [47, 49] and, in We show that the lack of precision in the measurement and
many cases, by the selection of parameters used to extract infor- the complexity of the relationship between composition, aber-
mation from the reconstructed data [78]. So, again, establishing rations and measurement accuracy make RDF-based analyses
a single value of the spatial resolution or a unique definition of more robust to characterise a population of particles. When it
a point spread function is likely impossible. is difficult do find an unambiguous definition of the limits be-
Nevertheless, we show here that in the context of cluster- tween the objects and their surrounding, one should abandon
ing/precipitation studies, the effective point spread function is the idea of imaging each individual cluster and rather rely on a
relatively well represented by a Gaussian blur of about 0.5 nm statistical evaluation of the compositional fluctuations.
but could possibly be as large as 1.25 nm or more. These val- The measurement of the composition is obviously made dif-
ues should be compared to typical nearest neighbours distances ficult if not impossible by the trajectory overlaps and associated
on a crystalline lattice. They correspond typically to distances blurring of the positions, as demonstrated by Fig. 5b. Our sim-
above the 5th nearest neighbour distance. The original vicin- ulations were performed in an oversimplified case of 100% so-
ity and nearest neighbours on the lattice can not be hoped to be lute precipitates in a 0% solute matrix. The case of less concen-
retrieved, which should be considered when attempting e.g. lat- trated and more diffuse clusters in a matrix containing solute is
tice rectification [79, 80] or when computing short range order clearly more complex, indicating that this situation might lead
parameters from APT data [45]. This means simply that, ex- to results deviating even more from reality. Multi components
cept maybe very locally for very specific cases, all information system, might particularly suffer from this effect. Even in the
on the local neighborhood of the atoms is lost and, generally case where only the solute content obtained from cluster iden-
speaking, so is the crystalline nature of the sample. Only traces tification methods is considered, the ratio between the different
might remain. In fact, Ceguerra et al. tried to estimate the effect elements may be more strongly affected than expected if the
of an imperfect resolution on short range order from APT, but matrix also contains solutes. Some efforts to offer corrections
used values which we now know are unrealistically small (σeff have been pursued [86, 87] but are clearly not applicable to par-
of at most 0.12 nm) [45]. ticles below 1 nm where defining a local density is not trivial,
Overall, there is a need for the APT community to be more and might not be able to correct for the influence of aberrations.
considerate when reporting size and composition of particles We show that composition, volume fraction and sizes are
with radii below ~5–10 nm. The visual aspects of APT are both very much affected by the resolution. This can be seen clearly
a blessing and a curse – practitioners want to see a population in Fig. 4a where the convolution of the PCF with the resolution
of clusters and have developed and applied typical clustering is shown to decrease amplitude and increase size. Using the am-
algorithms. plitude of the RDF alone, as is sometimes done (see for instance
In addition, a value of σ = 0.5 nm is typically in the range ref. [88]), is subject to the same bias and will lead to inaccurate
of the dmax distances used as a threshold in cluster identifica- compositions since it is very much influenced by the convolu-
tions techniques (e.g. maximum separation or other related). tion with the spatial resolution. Comparison of the amplitude
When affected by trajectory aberrations, the identification of between microstructural states should only be performed with
clusters based on a threshold of distance or composition [3] is great care since the resolution varies across data sets.RHowever,
hence likely to fail to assess which atoms physically belong to the conservation of matter imposes that the integral 4πγr2 dr
clusters. While several studies have investigated the effect of be unaffected by the convolution. This integral corresponds to
an imperfect reconstruction (by adding random Gaussian noise a mean square number of excess solutes, which could be a good
to a synthetic APT volume) on cluster identification methods, alternative measure of the advancement of a clustering reaction,
most concluded that it did not yield too strong an effect on as proposed by Ivanov et al. [39] in the context of small-angle
the clusters on the basis of a strongly underestimated effective scattering.
9The message of this work is not that small features are not [5] D. Blavette, B. Deconihout, A. Bostel, J. M. Sarrau, M. Bouet,
detected by APT. What we have evidenced is that the width of A. Menand, The tomographic atom-probe - a quantitative 3-dimensional
nanoanalytical instrument on an atomic-scale, Review of Scientific In-
the point spread function might be wider than what most user struments 64 (10) (1993) 2911–2919.
would expect, so that the image of small features may be vastly [6] M. P. Moody, L. T. Stephenson, P. V. Liddicoat, S. P. Ringer, Con-
deformed when imaged by APT. It is important to acknowledge tingency table techniques for three dimensional atom probe tomog-
this, so that the community can work on reliable metrics which raphy., Microscopy research and technique 70 (3) (2007) 258–268.
doi:10.1002/jemt.20412.
are not too dependent on the spatial resolution. URL http://www.scopus.com/inward/record.url?eid=2-s2.
0-33847766229{&}partnerID=tZOtx3y1
[7] L. T. Stephenson, M. P. Moody, P. V. Liddicoat, S. P. Ringer, New
5. Conclusion techniques for the analysis of fine-scaled clustering phenomena within
atom probe tomography (APT) data., Microscopy and microanalysis : the
To conclude, we have demonstrated that the effective spatial official journal of Microscopy Society of America, Microbeam Analysis
resolution of APT in the context of the metrology of small ob- Society, Microscopical Society of Canada 13 (6) (2007) 448–463.
doi:10.1017/S1431927607070900.
ject is worse than often reported, which will particularly impact URL http://www.scopus.com/inward/record.url?eid=2-s2.
the measurement of solute clusters and small precipitates. The 0-36248950234{&}partnerID=tZOtx3y1
size of the PSF is indeed larger than the usually quoted values [8] M. P. Moody, L. T. Stephenson, A. V. Ceguerra, S. P. Ringer, Quantitative
corresponding to near-ideal situations. We have discussed the binomial distribution analyses of nanoscale like-solute atom clustering
and segregation in atom probe tomography data., Microscopy research
fact that when approaching 1 nm in radius, the measured values and technique 71 (7) (2008) 542–550. doi:10.1002/jemt.20582.
of size and composition of particles by APT should be consid- URL http://www.scopus.com/inward/record.url?eid=2-s2.
ered highly questionable. This was enabled by comparison of 0-47249098613{&}partnerID=tZOtx3y1
results with SAS performed on the same materials, as well as [9] A. Cerezo, L. Davin, Aspects of the observation of clusters in the
3-dimensional atom probe, Surface and Interface Analysis 39 (2-3)
by the use of a common framework to process the data. Our (2007) 184–188. doi:10.1002/sia.2486.
results demonstrate that, while APT is the only technique capa- URL http://www.scopus.com/inward/record.url?eid=2-s2.
ble of analysing clusters of a few atoms, its results should be 0-33847043070{&}partnerID=tZOtx3y1
taken with caution. We also point towards possible routes for [10] E. A. Marquis, J. M. Hyde, Applications of atom-probe tomography to the
characterisation of solute behaviours, Materials Science and Engineering:
more reliable results on very small objects, namely using sta- R: Reports 69 (4-5) (2010) 37–62. doi:10.1016/j.mser.2010.05.
tistical methods such as RDF based analyses and including the 001.
effect of the point spread function in the interpretation of these [11] J. M. Hyde, E. A. Marquis, K. B. Wilford, T. J. Williams, A sensi-
analyses. tivity analysis of the maximum separation method for the characterisa-
tion of solute clusters, Ultramicroscopy 111 (6) (2011) 440–447. doi:
10.1016/J.ULTRAMIC.2010.12.015.
URL https://www.sciencedirect.com/science/article/pii/
Acknowledgements S0304399110003578
[12] E. A. Marquis, V. Araullo-Peters, A. Etienne, S. Fedotova, K. Fujii,
The authors would like to thank Dr H. Zhao for providing K. Fukuya, E. Kuleshova, A. Legrand, A. London, S. Lozano-
the samples used in the in-situ SAXS experiment and kindly Perez, Y. Nagai, K. Nishida, B. Radiguet, D. Schreiber, N. Soneda,
sharing her experimental APT data allowing for direct compar- M. Thuvander, T. Toyama, F. Sefta, P. Chou, A Round Robin Ex-
periment: Analysis of Solute Clustering from Atom Probe Tomog-
ison. raphy Data, Microscopy and Microanalysis 22 (S3) (2016) 666–667.
doi:10.1017/S1431927616004189.
URL https://www.cambridge.org/core/article/
References round-robin-experiment-analysis-of-solute-clustering-from-atom-
EEC9B355EAC1101C934BFD5F5EB37FA7
[1] E. A. Marquis, M. Bachhav, Y. Chen, Y. Dong, L. M. Gordon, [13] Y. Dong, A. Etienne, A. Frolov, S. Fedotova, K. Fujii, K. Fukuya, C. Hat-
A. McFarland, On the current role of atom probe tomography in zoglou, E. Kuleshova, K. Lindgren, A. London, A. Lopez, S. Lozano-
materials characterization and materials science, Current Opin- Perez, Y. Miyahara, Y. Nagai, K. Nishida, B. Radiguet, D. K. Schreiber,
ion in Solid State and Materials Science 17 (5) (2013) 217–223. N. Soneda, T. Toyama, J. Wang, F. Sefta, P. Chou, E. A. Marquis,
doi:10.1016/j.cossms.2013.09.003. Atom Probe Tomography Interlaboratory Study on Clustering Analy-
URL http://www.scopus.com/inward/record.url?eid=2-s2. sis in Experimental Data Using the Maximum Separation Distance Ap-
0-84887018314{&}partnerID=tZOtx3y1 proach, Microscopy and Microanalysis 25 (2) (2019) 356–366. doi:
[2] A. Devaraj, D. E. Perea, J. Liu, L. M. Gordon, T. J. Prosa, P. Parikh, 10.1017/S1431927618015581.
D. R. Diercks, S. Meher, R. P. Kolli, Y. S. Meng, S. Thevuthasan, [14] E. A. Marquis, Microstructural Evolution and Strengthening Mechanisms
Three-dimensional nanoscale characterisation of materials by atom probe in Al-Sc and Al-Mg-Sc Alloys, Ph.D. thesis, Northwestern University,
tomography, International Materials Reviews 63 (2) (2018) 68–101. Evanston, Illinois (2002).
doi:10.1080/09506608.2016.1270728. [15] F. De Geuser, W. Lefebvre, D. Blavette, 3D atom probe study of
URL https://www.tandfonline.com/doi/full/10.1080/ solute atoms clustering during natural ageing and pre-ageing of an
09506608.2016.1270728 Al-Mg-Si alloy, Philosophical Magazine Letters 86 (4) (2006) 227–234.
[3] P. Dumitraschkewitz, S. S. A. Gerstl, L. T. Stephenson, P. J. Uggow- doi:10.1080/09500830600643270.
itzer, S. Pogatscher, Clustering in Age-Hardenable Aluminum Alloys, URL http://www.scopus.com/inward/record.url?eid=2-s2.
Advanced Engineering Materials 20 (10) (2018) 1800255. doi:10. 0-33646756514{&}partnerID=tZOtx3y1
1002/adem.201800255. [16] L. Couturier, F. De Geuser, A. Deschamps, Direct Comparison of Fe-
URL http://doi.wiley.com/10.1002/adem.201800255 Cr Unmixing Characterization by Atom Probe Tomography and Small
[4] J. A. Panitz, S. B. McLane, E. W. Müller, Atom-Probe Field Ion Mi- Angle Scattering, Materials Characterization 121 (2016) 61–67. doi:
croscope, Review of Scientific Instruments 39 (1) (1968) 83–86. doi: 10.1016/j.matchar.2016.09.028.
10.1063/1.1683116. [17] H. Zhao, B. Gault, D. Ponge, D. Raabe, F. De Geuser, Parameter free
10quantitative analysis of atom probe data by correlation functions: Appli- B. Gault, D. Ponge, D. Raabe, Segregation assisted grain boundary pre-
cation to the precipitation in Al-Zn-Mg-Cu, Scripta Materialia 154 (2018) cipitation in a model Al-Zn-Mg-Cu alloy, Acta Materialia 156 (2018)
106–110. doi:10.1016/j.scriptamat.2018.05.024. 318–329. doi:10.1016/j.actamat.2018.07.003.
URL https://www.sciencedirect.com/science/article/pii/ [34] G. Porod, General Theory, in: O. Glatter, O. Kratky (Eds.), Small-Angle
S135964621830318X X-Ray Scattering, Academic Press, London, 1982, pp. 17–51.
[18] F. Vurpillot, G. Da Costa, A. Menand, D. Blavette, Structural analyses [35] F. Vurpillot, A. Bostel, D. Blavette, Trajectory overlaps and local magni-
in three-dimensional atom probe: A Fourier transform approach, Journal fication in three-dimensional atom probe, Applied Physics Letters 76 (21)
of Microscopy 203 (3) (2001) 295–302. doi:10.1046/j.1365-2818. (2000) 3127–3129.
2001.00923.x. [36] A. Deschamps, C. Sigli, T. Mourey, F. de Geuser, W. Lefebvre, B. Davo,
[19] B. Gault, M. P. Moody, F. De Geuser, A. La Fontaine, L. T. Stephenson, Experimental and modelling assessment of precipitation kinetics in an
D. Haley, S. P. Ringer, Spatial Resolution in Atom Probe Tomography, Al–Li–Mg alloy, Acta Materialia 60 (5) (2012) 1917–1928.
Microscopy and Microanalysis 16 (01) (2010) 99–110. doi:10.1017/ URL http://www.sciencedirect.com/science/article/pii/
S1431927609991267. S1359645412000456
[20] T. F. Kelly, E. Voelkl, B. P. Geiser, Practical Determination of Spatial [37] B. Gault, X. Y. Cui, M. P. Moody, F. de Geuser, C. Sigli, S. P. Ringer,
Resolution in Atom Probe Tomography, Microscopy and Microanalysis A. Deschamps, Atom probe tomography investigation of Mg site occu-
15 ((Suppl2)) (2009) 12–13. pancy within delta’ precipitates in an Al-Mg-Li alloy, Scripta Materialia
[21] B. P. Geiser, T. F. Kelly, D. J. Larson, J. Schneir, J. P. Roberts, Spatial 66 (11) (2012) 903–906.
Distribution Maps for Atom Probe Tomography, Microscopy and Micro- [38] F. De Geuser, T. Dorin, W. Lefebvre, B. Gault, A. Deschamps, Comple-
analysis 13 (6) (2007) 437–447. doi:10.1017/S1431927607070948. mentarity of atom probe, small angle scattering and differential scanning
[22] F. Vurpillot, C. Oberdorfer, Modeling Atom Probe Tomography: A calorimetry for the study of precipitation in aluminium alloys, in: Alu-
review, Ultramicroscopy 159 (2015) 202–216. doi:10.1016/j. minium Alloys 2014 - ICAA14, Vol. 794 of Materials Science Forum,
ultramic.2014.12.013. Trans Tech Publications Ltd, 2014, pp. 926–932. doi:10.4028/www.
[23] Y. Suchorski, W. A. Schmidt, J. H. Block, H. J. Kreuzer, Comparative scientific.net/MSF.794-796.926.
studies on field ionization at surface sites of Rh, Ag and Au—differences [39] R. Ivanov, A. Deschamps, F. De Geuser, A combined characterization
in local electric field enhancement, Vacuum 45 (2–3) (1994) 259–262. of clusters in naturally aged Al-Cu-(Li, Mg) alloys using small-angle
URL http://www.sciencedirect.com/science/article/pii/ neutron and X-ray scattering and atom probe tomography, Journal of
0042207X94901848 Applied Crystallography 50 (6) (2017) 1725–1734. doi:10.1107/
[24] B. Gault, M. P. Moody, F. De Geuser, A. La Fontaine, L. T. Stephenson, S1600576717014443.
D. Haley, S. P. Ringer, Spatial Resolution in Atom Probe Tomography, [40] M. K. Miller, The effects of local magnification and trajectory aberrations
Microscopy and Microanalysis 16 (01) (2010) 99–110. doi:10.1017/ on atom probe analysis, Journal De Physique 48 (C-6) (1987) 565–570.
S1431927609991267. [41] S. V. Krishnaswamy, S. B. McLane, E. W. Müller, Aiming performance
[25] F. Vurpillot, B. Gault, B. P. Geiser, D. Larson, Reconstructing atom probe of the atom probe, Review of Scientific Instruments 46 (9) (1975) 1237–
data: A review, Ultramicroscopy 132 (2013) 19–30. doi:10.1016/j. 1240.
ultramic.2013.03.010. [42] F. Vurpillot, A. Gaillard, G. Da Costa, B. Deconihout, A model to pre-
[26] E. Cadel, F. Vurpillot, R. Larde, S. Duguay, B. Deconihout, Depth dict image formation in Atom probeTomography, Ultramicroscopy 132
resolution function of the laser assisted tomographic atom probe in the (2013) 152–157. doi:10.1016/j.ultramic.2012.12.007.
investigation of semiconductors, Journal of Applied Physics 106 (4) [43] D. Larson, B. Gault, B. Geiser, F. De Geuser, F. Vurpillot, Atom probe
(2009) 44908. tomography spatial reconstruction: Status and directions, Current Opin-
URL http://link.aip.org/link/?JAP/106/044908/1http: ion in Solid State and Materials Science 17 (5) (2013) 236–247. doi:
//dx.doi.org/10.1063/1.3186617 10.1016/j.cossms.2013.09.002.
[27] B. Gault, Y. M. Chen, M. P. Moody, T. Ohkubo, K. Hono, S. P. [44] E. A. Marquis, F. Vurpillot, Chromatic aberrations in the field evapora-
Ringer, Influence of the wavelength on the spatial resolution of pulsed- tion behavior of small precipitates., Microscopy and microanalysis : the
laser atom probe, Journal of Applied Physics 110 (9) (2011) 94901. official journal of Microscopy Society of America, Microbeam Analysis
doi:10.1063/1.3657846. Society, Microscopical Society of Canada 14 (6) (2008) 561–570.
URL http://www.scopus.com/inward/record. doi:10.1017/S1431927608080793.
url?eid=2-s2.0-81355124100{&}partnerID= URL http://www.scopus.com/inward/record.url?eid=2-s2.
tZOtx3y1http://www.scopus.com/inward/record.url? 0-55749091143{&}partnerID=tZOtx3y1
eid=2-s2.0-81355124100{&}partnerID=40{&}md5= [45] A. V. Ceguerra, M. P. Moody, R. C. Powles, T. C. Pe-
70e948c1afca4df48dd562d45e87aa03 tersen, R. K. W. Marceau, S. P. Ringer, Short-range order in
[28] Y. Shimizu, Y. Kawamura, M. Uematsu, M. Tomita, T. Kinno, N. Okada, multicomponent materials, Acta Crystallographica Section A
M. Kato, H. Uchida, M. Takahashi, H. Ito, H. Ishikawa, Y. Ohji, 68 (doi:10.1107/S0108767312025706).
H. Takamizawa, Y. Nagai, K. M. Itoh, Depth and lateral resolution of [46] V. Gasnier, B. Gault, H. Nako, Y. Aruga, G. Sha, S. P. S. P. Ringer,
laser-assisted atom probe microscopy of silicon revealed by isotopic het- Influence of experimental parameters on the composition of pre-
erostructures, Journal of Applied Physics 109 (3). doi:03610210. cipitates in metallic alloys, Ultramicroscopy 132 (2013) 199–204.
1063/1.3544496. doi:10.1016/j.ultramic.2013.02.005.
[29] V. Araullo-Peters, B. Gault, F. D. Geuser, A. Deschamps, J. M. Cairney, URL http://www.scopus.com/inward/record.
Microstructural evolution during ageing of Al-Cu-Li-x alloys, Acta Ma- url?eid=2-s2.0-84883771600{&}partnerID=
terialia 66. doi:10.1016/j.actamat.2013.12.001. tZOtx3y1http://www.scopus.com/inward/record.url?
[30] B. Gault, F. De Geuser, L. Bourgeois, B. Gable, S. Ringer, B. Muddle, eid=2-s2.0-84874641166{&}partnerID=40{&}md5=
Atom probe tomography and transmission electron microscopy charac- c69404433284170b1f942f561c0a5b4f
terisation of precipitation in an Al-Cu-Li-Mg-Ag alloy, Ultramicroscopy [47] B. Gault, A. La Fontaine, M. P. Moody, S. P. Ringer, E. A. E. A. Marquis,
111 (6) (2011) 683–689. doi:10.1016/j.ultramic.2010.12.004. Impact of laser pulsing on the reconstruction in an atom probe tomog-
[31] C. Sudbrack, R. Noebe, D. Seidman, Direct observations of nucleation raphy., Ultramicroscopy 110 (9) (2010) 1215–1222. doi:10.1016/j.
in a nondilute multicomponent alloy, Physical Review B 73 (21) (2006) ultramic.2010.04.017.
212101. doi:10.1103/PhysRevB.73.212101. [48] B. P. Geiser, D. J. Larson, E. Oltman, S. S. Gerstl, D. A. Reinhard, T. F.
URL http://www.scopus.com/inward/record.url?eid=2-s2. Kelly, T. J. Prosa, Wide-Field-of-View Atom Probe Reconstruction, Mi-
0-33744724933{&}partnerID=tZOtx3y1 croscopy and Microanalysis 15 (suppl (2009) 292–293.
[32] D. Haley, T. Petersen, G. Barton, S. P. Ringer, Influence of field evapora- [49] B. Gault, M. P. Moody, F. De Geuser, G. Tsafnat, A. La Fontaine, L. T.
tion on Radial Distribution Functions in Atom Probe Tomography, Philos. Stephenson, D. Haley, S. P. Ringer, Advances in the calibration of atom
Mag. 89 (11) (2009) 925–943. probe tomographic reconstruction, Journal of Applied Physics 105 (3)
[33] H. Zhao, F. De Geuser, A. Kwiatkowski da Silva, A. Szczepaniak, (2009) 34913. doi:10.1063/1.3068197.
11You can also read