Geomagnetism Program Research Plan, 2020-2024 - Circular 1469 U.S. Department of the Interior U.S. Geological Survey - USGS ...
←
→
Page content transcription
If your browser does not render page correctly, please read the page content below
Geomagnetism Program Research Plan, 2020–2024

Circular 1469

U.S. Department of the Interior
U.S. Geological Survey
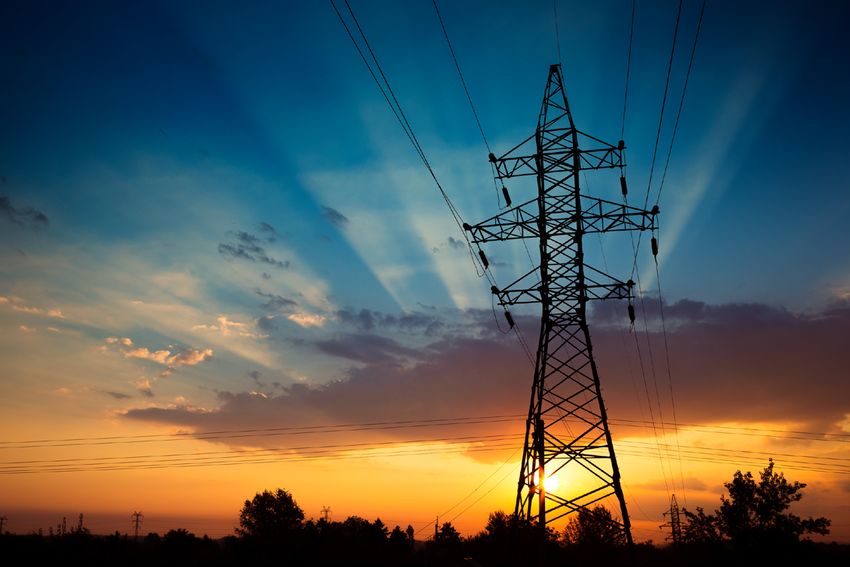
Cover. Powerlines on a sunrise (Photograph by Vladyslav Starohylov, Dreamstime.com LLC,
purchased license).
Geomagnetism Program Research Plan,
2020–2024

By Jeffrey J. Love, Anna Kelbert, Benjamin S. Murphy, E. Joshua Rigler, and
Kristen A. Lewis

Circular 1469

U.S. Department of the Interior
U.S. Geological Survey

U.S. Department of the Interior DAVID BERNHARDT, Secretary U.S. Geological Survey James F. Reilly II, Director U.S. Geological Survey, Reston, Virginia: 2020 For more information on the USGS—the Federal source for science about the Earth, its natural and living resources, natural hazards, and the environment—visit https://www.usgs.gov or call 1–888–ASK–USGS. For an overview of USGS information products, including maps, imagery, and publications, visit https://store.usgs.gov/. Any use of trade, firm, or product names is for descriptive purposes only and does not imply endorsement by the U.S. Government. Although this information product, for the most part, is in the public domain, it also may contain copyrighted materials as noted in the text. Permission to reproduce copyrighted items must be secured from the copyright owner. Suggested citation: Love, J.J., Kelbert, A., Murphy, B.S., Rigler, E.J., and Lewis, K.A., 2020, Geomagnetism Program research plan, 2020–2024: U.S. Geological Survey Circular 1469, 19 p., https://doi.org/10.3133/cir1469. ISSN 2330-5703 (online)
iii

Preface
This circular presents a research plan for the U.S. Geological Survey Geomagnetism Program.
The report was written at the request of the Senior Advisor for Earthquake and Geologic Hazards
and the Director of the Geologic Hazards Science Center.
iv

     Acknowledgments
     The authors thank M.S. Ashman, P.A. Bedrosian, K.A. Hartley, G.P. Hayes, T.M. Larson,
     J. McCarthy, H.J. Singer, J.L. Slate, and A.M. Tocci for reviewing a draft manuscript.
v
Contents
Preface�����������������������������������������������������������������������������������������������������������������������������������������������������������iii
Acknowledgments����������������������������������������������������������������������������������������������������������������������������������������iv
Abstract�����������������������������������������������������������������������������������������������������������������������������������������������������������1
Directives and Priorities�������������������������������������������������������������������������������������������������������������������������������1
Background����������������������������������������������������������������������������������������������������������������������������������������������������2
Program Roles and Capabilities������������������������������������������������������������������������������������������������������������������4
Data Context������������������������������������������������������������������������������������������������������������������������������������������4
Project 1. Historical Magnetic Superstorms������������������������������������������������������������������������������������6
Project 2. Geomagnetic Field Mapping���������������������������������������������������������������������������������������������6
Project 3. Earth-Conductivity Modeling��������������������������������������������������������������������������������������������8
Project 4. National Impedance Map��������������������������������������������������������������������������������������������������8
Project 5. Geoelectric-Field Mapping���������������������������������������������������������������������������������������������10
Project 6. Statistical Maps of Geoelectric Hazards����������������������������������������������������������������������11
Project 7. Electromagnetic-Pulse Hazard Analysis����������������������������������������������������������������������12
Project 8. Gap Analyses and Operational Support������������������������������������������������������������������������13
External Collaborative Projects��������������������������������������������������������������������������������������������������������14
Community Leadership�������������������������������������������������������������������������������������������������������������������������������14
Some Conditional Aspirations�������������������������������������������������������������������������������������������������������������������14
References Cited�����������������������������������������������������������������������������������������������������������������������������������������15
Figures
1. Schematic diagram showing a current (J0) of increasing intensity over time in
the space environment above the Earth’s surface�����������������������������������������������������������������3
2. Schematic depiction of physical processes related to estimation of storm-time
geoelectric fields��������������������������������������������������������������������������������������������������������������������������4
3. Map of USGS and NRCan (Natural Resources, Canada)
geomagnetic-observatory locations and U.S. and Canadian magnetotelluric
(MT) survey sites��������������������������������������������������������������������������������������������������������������������������5
4. Latitude-weighted disturbance time series from the Watheroo, Australia (WAT,
gray), Apia, Samoa (API, yellow), Vassouras, Brazil (VSS, green), and San
Fernando, Spain (SFS, pink) observatories, and the DstWAVS (WAT, API, VSS,
SFS) time series (black) from 00:30 (GMT, Greenwich Mean Time) May 13 to
02:30 May 17, 1921 (Love and others, 2019a). nT, nanotesla��������������������������������������������������7
5. Snapshots of the North American distribution of spherical elementary
current-system-interpolated horizontal magnetic-field vectors during the 2015
St. Patrick's Day magnetic storm (Rigler and others, 2019). nT, nanotesla�������������������������7
6. A synthesized CONUS electrical-conductivity model at a depth of 30 kilometers
obtained from the inversion of EarthScope impedance tensors (Kelbert and
others, 2019)�����������������������������������������������������������������������������������������������������������������������������������9vi
7. Maps showing the amplitude and polarization imparted by magnetotelluric
impedances to the induced geoelectric field for a given geomagnetic field
A, as a function of the azimuthal direction (declination) of the geomagnetic
field, and B, as a function of the azimuthal direction of the induced geoelectric
field, each for variational periods of 10, 100, and 1,000 seconds (smallest to
largest ovals)�������������������������������������������������������������������������������������������������������������������������������10
8. Snapshot from the NOAA-USGS time-dependent mapping project, which is
similar to the map presented by NOAA in real time��������������������������������������������������������������11
9. Once-per-century extreme magnetic-storm-event predictions of
transmission-line voltage (Lucas and others, 2020): high and low hazards are
yellow and purple, respectively�����������������������������������������������������������������������������������������������12
10. Comparison of A, 1-minute north-south Bx geomagnetic-disturbance time
series recorded at the Ottawa, Canada (red, OTT) and Fredericksburg, Virginia
(blue, FRD) observatories during the Halloween storm of October 29–31, 2003
(Balch and others 2004), and B, the difference between the OTT and FRD
time series������������������������������������������������������������������������������������������������������������������������������������13vii
Abbreviations and Acronyms
AFRL Air Force Research Laboratory
AGU American Geophysical Union
CONUS conterminous United States
DC direct current
DOE U.S. Department of Energy
DOI U.S. Department of the Interior
Dst storm-time disturbance
EMAC Electromagnetic Advisory Committee
EMIW Electromagnetic Induction Workshops
EMP electromagnetic pulse
EMPRAD Electromagnetic Pulse Research and Development working group
EO Executive Order for Coordinating National Resilience to
Electromagnetic Pulses
FERC Federal Energy Regulatory Commission
GEM Geospace Environment Modeling program
GIC geomagnetically induced current
GMT Greenwich Mean Time
HAO High Altitude Observatory
IAGA International Association of Geomagnetism and Aeronomy
IEC International Electrotechnical Commission
IGY International Geophysical Year
INTERMAGNET International Real-time Magnetic Observatory Network
IRIS Incorporated Research Institutions for Seismology
km kilometer
LANL Los Alamos National Laboratory
ModEM Modular system for ElectroMagnetic inversion software
NASA National Aeronautics and Space Administration
NCAR National Center for Atmospheric Research
NERC North American Electric Reliability Corporation
NGA National Geospatial-Intelligence Agency
NOAA National Oceanic and Atmospheric Administration
NRCan Natural Resources, Canada
NSF National Science Foundation
NSO National Solar Observatoryviii
NSTC National Science and Technology Council
NSWSAP National Space Weather Strategy and Action Plan
nT nanotesla
PROSWIFT Promoting Research and Observations of Space Weather to Improve the
Forecasting of Tomorrow Act
SECS spherical elementary current system
SWORM Space Weather Operations, Research, and Mitigation working group
SWPCSpace Weather Prediction Center
3D Three-dimensional
U.S. United States
USGS U.S. Geological Survey
V voltGeomagnetism Program Research Plan, 2020–2024
By Jeffrey J. Love, Anna Kelbert, Benjamin S. Murphy, E. Joshua Rigler, and Kristen A. Lewis
Abstract Directives and Priorities
The Geomagnetism Program of the U.S. Geological The National Space Weather Strategy and Action
Survey (USGS) monitors geomagnetic field variation through Plan (NSWSAP) of the National Science and Technology
operation of a network of observatories across the United Council (NSTC, 2019) directs the U.S. Department of
States and its territories, and it pursues scientific research the Interior (DOI), and, by proxy, the Geomagnetism
needed to estimate and assess geomagnetic and geoelectric Program of the U.S. Geological Survey (USGS), to work
hazards. Over the next five years (2020–2024 inclusive) and in collaboration with other agencies to enhance national
in support of national and agency priorities, Geomagnetism protection by refining space-weather benchmarks (NSTC,
Program research scientists plan to pursue an integrated 2019, Their Objective 1.1) and modeling the effects of space
set of research projects broadly encompassing empirical weather (Objective 1.3), in order to support assessing the
estimation and mapping of geomagnetic disturbance, vulnerability of critical infrastructure (Objective 1.2) and
modeling of solid-Earth conductivity structure and surface assessing the cost of space weather (Objective 1.4). The
impedance, and mapping of magnetic-storm-induced program is directed, in collaboration with other agencies, to
geoelectric fields. Analyses are empirically based, relying contribute to the development of improved space-weather
on measured time series as well as statistical and numerical forecasts by supporting fundamental research (Objective 2.3),
modeling of geomagnetic-monitoring data from ground-based enhancing modeling techniques and the development of
observatories and surface-impedance tensors acquired during models (Objective 2.5), and releasing historical datasets
magnetotelluric surveys. The plan describes augmentation (Objective 2.6). Furthermore, program research should
and development of the Geomagnetism Program's existing inform operational priorities within the NSWSAP, including
research portfolio, assuming present funding levels and identifying baseline-observation capabilities (Objective 2.1),
staffing numbers. Because the projects are interdependent, ensuring the continued operation and possible expansion
they cannot be straightforwardly prioritized. They will all of observation capabilities (Objective 2.2), identifying new
be pursued as resources and time permit; additional funding and enhanced measurement methods (Objective 2.4), and
and staffing would enable the projects to be broadened and enhancing accessibility to operational data (Objective 2.8).
more rapidly completed. Where appropriate and subject Under the Executive Order for Coordinating National
to budgetary constraints and staffing numbers, research on Resilience to Electromagnetic Pulses (White House,
specific projects might be accelerated or even judiciously March 26, 2019, 13865, Section 5c), the DOI is directed to
expanded—some opportunities for expansion are discussed pursue research, development, deployment, and operational
in this plan. Results will provide realistic illumination of capabilities that enhance understanding of variations of the
the nature of the ground-level expression of space-weather Earth’s magnetic field associated with electromagnetic pulses
disturbance, a subject of particular importance for projects (EMPs), both natural and anthropogenic.
focused on evaluating the vulnerability of electric-power-grid The research projects of the USGS Geomagnetism
systems. This plan does not cover Geomagnetism Program Program are consistent with the DOI (2018) strategic plan
operations, which are primarily concerned with the operation for providing science to safeguard communities from natural
of magnetic observatories and, now, magnetotelluric surveys, hazards. The program's work is also consistent with the USGS
although the context of such observatories and surveys is Natural Hazards Science Strategy for enhancing observations
discussed. The research element of the program provides (Holmes and others, 2013, their Goal 1), pursuing fundamental
guidance for the expansion of program operations and research understanding (Goal 2), improving hazard assessments
projects. In addition to the research projects summarized (Goal 3), and providing situational awareness (Goal 4).
here, program scientists continue to provide leadership to the Under an act before Congress (as of August 2020, HR
national and international geomagnetic, magnetotelluric, and 5260) known as Promoting Research and Observations of
space-weather communities. Space Weather to Improve the Forecasting of Tomorrow
(PROSWIFT), the DOI is noted as being responsible for
magnetometer operations and for developing “crustal2 Geomagnetism Program Research Plan, 2020–2024
conductivity models to assess and mitigate risks from estimates place the economic cost of such a perfect storm for
space-weather-induced electric ground currents.” Under the United States at $0.6 to 2.6 trillion, with recovery taking
PROSWIFT, the USGS (along with other agencies) is directed years (National Research Council, 2008; Lloyd's, 2013).
to transition space-weather-research findings, models, and Qualitatively, the physical connection between magnetic
capabilities, as appropriate, to the National Oceanic and storms and the interference they can cause to power-grid
Atmospheric Administration (NOAA) and the Department of systems is well understood, and the basic concepts are
Defense (DOD). illustrated in figures 1 and 2. Briefly, geomagnetic disturbance
induces geoelectric fields in the Earth's conducting interior.
Surface geoelectric fields can drive geomagnetically induced
currents (GICs) in power grids through their grounding
Background connections (for example, Molinski, 2002; Piccinelli and
Krausmann, 2014). Two factors affect the nature of surface
Magnetic storms are hazardous to the activities and geoelectric fields (Thomson and others, 2009; Love and
technological infrastructure of modern society. This fact others, 2014; Kelbert, 2020a). First, storm-induced electric
was dramatically demonstrated in March of 1989 when currents in the ionosphere and magnetosphere, driven by
a rare magnetic superstorm (Allen and others, 1989) the dynamic action of the Sun and its solar wind, generate
damaged satellites and interfered with their operation, and ground-level geomagnetic disturbances that can be both
disrupted geophysical surveys and over-the-horizon radio temporally and spatially complicated. Indeed, predicting
communication. This storm caused the collapse of the storm-time geomagnetic disturbance remains a challenging
Hydro-Québec electric power grid in Canada (Bolduc, 2002), goal of space-weather modeling projects (for example,
damaged a high-voltage transformer at a nuclear-power plant National Research Council, 2013; Pulkkinen and others,
in Salem, New Jersey (Barnes and others, 1991; Rossi, 1990), 2017). Second, the geologic structure of the solid Earth is
and, more generally, was responsible for over 200 significant complicated, and therefore surface electromagnetic impedance
anomalies in North American power-grid transmission is complicated as well. All this means that storm-induced
networks (North American Electric Reliability Corporation geomagnetic fields are both highly time dependent, and their
(NERC), 1990). The cost of the March 1989 storm for the amplitude and polarization can have a high degree of localized
Canadian economy has been estimated to have been between geographic granularity.
$3 and $6 billion (in 1989 Canadian dollars) (Government of During an intense magnetic storm, geoelectric-field
Canada, 2002; Riswadkar and Dobbins, 2010). Reflective of intensities of 1 volt per kilometer (V/km) are common in many
the rise of the global economy and an increased reliance on places on the Earth's surface; over relatively resistive geologic
technology, should another Québec-like event occur today, formations, field intensities can exceed 10 V/km. This might
a worldwide economic impact of $2.4 to $3.4 trillion could seem rather modest at first, but given that power-grid lines
be expected, equivalent to a global loss in gross domestic are often more than 100 km in length, integrated voltage can
product of 3.9 to 5.6 percent (Schulte in den Bäumen and possibly exceed 1000 V. Assuming a line resistance of, for
others, 2014). example, 1 ohm, GICs of hundreds of amps over a minute
Longer ago, the great magnetic storm of May 1921 (for or more can be realized. For a power grid designed for
example, Hapgood, 2019; Love and others, 2019b) disrupted alternating current at a frequency of (typically) 60 Hz, such
radio communication and telegraph and telephone systems a GIC is effectively a direct current (DC). This can cause
around the world, and, notably, caused fires in telegraph havoc, tripping relays and causing operational instability (for
stations used by New York State and City railroad companies. example, Kappenman, 2003; Piccinelli and Krausmann, 2014).
The Carrington event of 1859 was, by some measures, the Indeed, this is what brought down the Hydro-Québec system
most intense magnetic storm ever recorded (for example, in 1989 (for example, Boteler, 2001; Bolduc, 2002). Prolonged
Tsurutani and others, 2003; Cliver and Dietrich, 2013); it also periods of DC current can damage high-voltage transformers
disrupted telegraph systems around the world and caused (Girgis and Vedante, 2012), and if they need to be replaced,
fires at telegraph stations. Should a storm of similar intensity restoration of service will be delayed.
occur today, technological systems around the world might An analogous hazard would be an EMP generated by a
be adversely affected. Under some scenarios, the future high-altitude nuclear explosion (for example, Dupont, 2004;
occurrence of a rare “perfect magnetic storm” might have a Rivera and others, 2016; Gombosi and others, 2017). The
widespread impact, possibly including the widespread collapse low-frequency part of an EMP, referred to as E3, resembles
of electric-power networks. Such a potential event, sometimes the impulsive disturbance realized during some magnetic
described as being “high-impact, low-frequency,” could storms, although it has a somewhat shorter period band from
have deleterious consequences for the economy and national about 1 to 1,000 seconds. Like storms, an E3 interacts with
security (for example, NERC and U.S. Department of Energy the Earth's surface impedance to induce geoelectric fields
(DOE), 2010). While acknowledging that economic impact that could interfere with grounded power-grid systems. A hint
can be difficult to predict (Eastwood and others 2017), some of the destructive potential of EMP weapons came during
the U.S. Starfish Prime test of July 9, 1962, above JohnstonBackground 3
Geomagnetic field B0
Generated by
space current
J0 Space current of
increasing intensity
J1
J1 E E E J1
Low conductivity High conductivity
Figure 1. Schematic diagram showing a current (J0) of increasing intensity over time in the space environment above the Earth’s
surface. This current generates a geomagnetic field (B0) that is also increasing in intensity over time. This geomagnetic field, in turn,
induces geoelectric fields (E) in the Earth, generally of high (low) amplitude within rock of low conductivity (high conductivity). These
geoelectric fields then drive electric currents (J1) that flow from the Earth through ground connections at transformer substations and
across high-voltage transmission lines (for example, Pirjola, 2002).
Island in the Pacific Ocean: 1,350 km away from ground zero, (Greetsai and others, 1998). The proliferation of nuclear
burglar alarms were tripped in Honolulu, Hawaii (Glasstone weapons and the fundamental dependence of modern society
and Dolan, 1977), and local street lights went black (Vittitoe, on electricity and electronic technology have motivated recent
1989). Soviet test 184 (also designated K3) on October 22, evaluations of the risk posed by a hostile EMP explosion for
1962, caused fires, destroyed power supplies, and blew fuses national and international security (for example, Graham and
on a long communication-cable system beneath ground zero others, 2008; Popik and others, 2017).4 Geomagnetism Program Research Plan, 2020–2024
Input-signal Convolution Output-signal
time series through a filter time series
Geomagnetic Geoelectric
variation field
Figure 2. Schematic depiction of physical processes related to estimation of storm-time geoelectric fields. As with formal concepts
from time-series analysis, in which an input signal is convolved with a filter function to produce an output signal, geomagnetic
disturbance generated by the Sun and solar wind is filtered through an impedance tensor that is itself a function of the conductivity
structure of the Earth. The resulting geoelectric field is a geophysical quantity that directly interferes with the operation of
electric-power grids.
Program Roles and Capabilities fields. In the coming years, the program's research portfolio is
expected to expand slightly to include analysis of the ground
In support of national priorities for developing and response to EMP. Program research results inform utility
providing information and services in the National interest, the companies in vulnerability evaluations of electric-power
USGS Geomagnetism Program monitors geomagnetic-field grid systems mandated by regulatory agencies, and, more
variation through the operation of a network of observatories generally, they provide realistic illumination on the nature of
across the U.S. and its territories (Love and Finn, 2011), the ground effects of space-weather disturbance.
and it pursues scientific research needed to estimate and
assess geomagnetic and geoelectric hazards. Recent omnibus Data Context
appropriations legislation has expanded Geomagnetism
Program responsibilities to ensure the completion of a USGS Geomagnetism Program research scientists rely
magnetotelluric survey across the conterminous U.S. on time series acquired by magnetometers at ground-based
(CONUS). The program's research element is small: two stations (fig. 3). Program research complements program
scientists are assigned full-time research, and one scientist is operational responsibilities for its network of 14 magnetic
categorized as equipment development grade, and, as such, observatories, 6 of which are in CONUS (Love and Finn,
he concentrates on operational product development; in 2011). Additionally, and of relevance to the emphasis of
addition, the program benefits from occasional 2-year-term, this research plan, geoelectric time series are being acquired
postdoctoral fellows. The program is headquartered in the at the Boulder magnetic observatory (Blum and others,
Geologic Hazards Science Center in Golden, Colorado, along 2017). Program observatories provide a baseline observation
with national and international earthquake programs and the capability (NSTC, 2019, Objective 2.1) that needs to be
national landslides program. Program scientists collaborate sustained (Objective 2.2) and even enhanced (Holmes and
with the USGS Geology, Geophysics, and Geochemistry others, 2013, Goal 1).
Science Center located nearby at the Denver Federal Center. Some Geomagnetism Program observatories have been
Program scientists collaborate with colleagues from allied in operation for over a century, providing long time-series
government agencies and academia and increasingly from the recordings of magnetic storms, quasi-diurnal solar-quiet
commercial sector. tides, and slow secular geomagnetic variation generated
USGS Geomagnetism Program scientists have a diverse in the Earth's core. The program's oldest data, time series
mix of expertise in geology, solid-Earth geophysics, space acquired by analog variometers, are of high accuracy (a few
physics, and data science. In recent years, this expertise nTs; nT, nanotesla) and useful for identifying general features
has been utilized in the pursuit of an influential portfolio of of magnetic storms, but these data have a resolution of
research projects: analysis of historical magnetic superstorms, only 1 hour. Electronic fluxgate magnetometers, a standard
empirical mapping of storm-caused geomagnetic disturbance, instrument for measuring magnetic field variation over time
inverse modeling of solid-Earth electrical-conductivity (for example, Primdahl 1979), and digital acquisition systems
structure, analysis of its surface expression as impedance, and have been operated at the observatories since the 1980s, and
empirical mapping of storm-induced and EMP geoelectric since then the program's basic data product has been 1-minute50° N
120° W 110° W 100° W 90° W 80° W 70° W
CANADA
40° N
UNITED STATES
30° N
EXPLANATION
USGS Geomagnetic Observatories
NRCan Geomagnetic Observatories
EarthScope USArray MT Sites
NASA MTArray MT Sites MEXICO
Program Roles and Capabilities 5
USGS MT Sites
Lithprobe MT Sites
Other MT Sites
Base from Natural Earth 0 200 400 600 800 MILES
0 200 400 600 800 KILOMETERS
Figure 3. Map of USGS and NRCan (Natural Resources, Canada) geomagnetic-observatory locations and U.S. and Canadian magnetotelluric (MT) survey sites. Many
of the magnetotelluric impedance tensors are available through IRIS; additional data (also shown here) are in the process of being archived. Omnibus appropriations
legislation for fiscal year 2020 has provided funds to the USGS for continuation of EarthScope-protocol magnetotelluric-data acquisition in the southwestern and
south-central United States.6 Geomagnetism Program Research Plan, 2020–2024
time series; 1-second resolution data have been acquired the project on EMP (Project 7. Electromagnetic-Pulse Hazard
at the observatories since the early 2010s. The program's Analysis). Fiscal Year 2020 appropriated funds will support
1-minute and 1-second data are transmitted from all the continuation of the magnetotelluric survey across the southern
observatories to program headquarters in Golden, Colorado, CONUS sector not completed by EarthScope.
within minutes of acquisition, they are then made available
to users, both in-house and to external partner agencies.
The program's observatory operations are coordinated with Project 1. Historical Magnetic Superstorms
those in other countries through the International Real-time
In support of priorities for developing space-weather
Magnetic Observatory Network (INTERMAGNET,
benchmarks (NSTC, 2019, Objective 1.1), releasing
https://www.intermagnet.org), a global consortium of magnetic
new datasets (NSTC, 2019, Objective 2.6), and pursuing
observatory institutes (for example, Love and Chulliat, 2013).
fundamental understanding (Holmes and others, 2013,
Geomagnetism Program research scientists also
Goal 2), the USGS Geomagnetism Program is leading projects
use magnetotelluric impedance tensors constructed from
to estimate the intensity of historical magnetic superstorms
data acquired during surveys across North America and
(for example, Love and others, 2019a, 2019b; Love, 2020) and
especially CONUS. In summary, (for example, Chave
the probability of their occurrence in the future (for example,
and Jones, 2012; Unsworth, 2007) at a given geographic
Love and others, 2015); an example of the former is shown in
site, simultaneous time-series measurements are made of
figure 4. Estimating the intensity of storms that occurred after
natural-geomagnetic and geoelectric-field variation. The
1957 is relatively straightforward—during the International
empirical relationship between these measurements is a
Geophysical Year (IGY, 1957–1958), standard measures of
transfer function equivalent to an impedance tensor divided
storm intensity, such as Dst (storm-time disturbance), were
by permeability. Magnetotelluric impedance tensors,
developed, and observatory operations were improved,
constructed from data across a distribution of sites as part
resulting in data of improved accuracy and continuity. Prior to
of a survey (for example, Egbert, 2007a), can be inverted
the IGY, when there were fewer observatories, and operational
for models of the internal conductivity structure of the Earth
continuity was sometimes poor, the situation is more
(for example, Kelbert and others, 2019). For purposes of
challenging. A recent reconnaissance of historical records
geoelectric-hazard analysis, the combination of impedance
by program scientists suggests that useful records exist for
tensors and time series (from observatories or models) can
the most intense storm for each solar cycle since about 1900.
be used to estimate geoelectric-field variation (for example,
With such a compilation and physically justified statistical
Kelbert and others, 2017). Across CONUS, many impedance
models, scientists anticipate that improved estimates can be
tensors (Schultz and others, 2006–2018; Schultz, 2010) used
made of the occurrence frequency of intense storms together
by the program were acquired by the EarthScope project of
with estimates of statistical variance (uncertainty). This project
the National Science Foundation (NSF) (Williams and others,
will augment historical datasets (NSTC, 2019, Objective 2.6)
2010); these tensors have a site spacing of about 70 km and
and inform a subproject on the evaluation of historical
a useful acquisition-period band from about 10 seconds to
magnetic-storm effects.
10,000 seconds. Other tensors, such as from Florida and
northern Arkansas, are derived from data collected by the
U.S. Geological Survey in accordance with EarthScope Project 2. Geomagnetic Field Mapping
protocol; still other tensors are collected as parts of other
projects and often under different protocols. In support of priorities for developing space-weather
In support of priorities for releasing new datasets models (NSTC, 2019, Objective 2.5) and improving hazard
(NSTC, 2019, Objective 2.6), enhancing the accessibility and assessments (Holmes and others, 2013, Goal 3), the USGS
sharing of observational data (Objective 2.8), and enhancing Geomagnetism Program is leading a project for developing
observations (Holmes and others, 2013, Goal 1), the USGS capabilities for real-time and retrospective mapping of
Geomagnetism Program is leading a project for compiling geomagnetic-field disturbance over North America (Rigler
new and historical magnetotelluric impedance tensors (Kelbert and others, 2019); an example of such a map is shown in
and others, 2018; Kelbert, 2020b). These tensors are archived figure 5. This project uses data from the USGS Geomagnetism
in a database (http://ds.iris.edu/spud/emtf) hosted by the Program's observatory network (and that of Natural Resources,
Incorporated Research Institutions for Seismology (IRIS). Canada (NRCan); Newitt and Coles, 2007). Geospatial
The work includes checking and, in some cases, repairing interpolation is required to estimate geomagnetic-field
historical functions. Compilation of historical impedance disturbances at locations far from the observatories. For
tensors, such as those acquired by the Lithoprobe Program various reasons, and especially because they are physically
of the Canadian Natural Sciences and Engineering Research realistic and interpretable, the program has identified spherical
Council, is a high priority. Work on this project has involved, elementary current systems (SECS) (for example, Amm, 1997;
and will continue to involve, collaboration with Oregon State Amm and Viljanen, 1999) as suitable for this interpolation—
University and IRIS. Results will provide input to the national the fields below the ionosphere and above the Earth’s surface
impedance map (Project 4. National Impedance Map) and are assumed to be potential (free of currents). A robustProgram Roles and Capabilities 7 Figure 4. Latitude-weighted disturbance time series from the Watheroo, Australia (WAT, gray), Apia, Samoa (API, yellow), Vassouras, Brazil (VSS, green), and San Fernando, Spain (SFS, pink) observatories, and the DstWAVS (WAT, API, VSS, SFS) time series (black) from 00:30 (GMT, Greenwich Mean Time) May 13 to 02:30 May 17, 1921 (Love and others, 2019a). nT, nanotesla. Figure 5. Snapshots of the North American distribution of spherical elementary current-system-interpolated horizontal magnetic-field vectors during the 2015 St. Patrick's Day magnetic storm (Rigler and others, 2019). nT, nanotesla.
8   Geomagnetism Program Research Plan, 2020–2024

optimal-estimation algorithm enables the SECS functions to       2014; Yang and others, 2015; Murphy and Egbert, 2017)
be fitted to observatory data, and these fits can, in turn, be   or globally at a substantially lower spatial resolution (for
expressed as a map of geomagnetic-field disturbance at the       example, Sun and others, 2015). Initial work has involved the
Earth's surface.                                                 compilation of regional and global 3D conductivity models
      Errors associated with the geomagnetic-field maps          obtained at different resolutions; these have been combined
need to be reduced. Most fundamentally, these errors             into one continuous model (Kelbert and others, 2019) (fig. 6).
could be substantially reduced with data from additional         Incremental updates and improvements are expected as new
magnetic observatories and variometer stations across            data become available. In the long term, consistent modeling
CONUS. Indeed, this project can help justify additional          for all of CONUS will be accomplished by the simultaneous
monitoring stations (Project 8. Gap Analyses and Operational     modeling of thousands of magnetotelluric impedance tensors
Support). Geomagnetism Program scientists are working            through the use of inverse theoretical methods (for example,
to combine the SECS mapping models with physics-based            Egbert, 2007b) and the Modular system for ElectroMagnetic
models of the ionospheric-magnetospheric system by using         inversion (ModEM) software (Kelbert and others, 2014),
machine-learning techniques and data assimilation. Work          modified to accommodate supercomputer-memory needs and
on this project involves collaboration with the NOAA             the spherical geometry of the Earth.
Space Weather Prediction Center (SWPC), the National                   Modeling 3D CONUS electrical conductivity
Aeronautics and Space Administration (NASA), the U.S. Air        is an important steppingstone for several of the
Force Research Laboratory (AFRL), and the High Altitude          other projects outlined here. It supports the National
Observatory (HAO) at the National Center for Atmospheric         Impedance Map (Project 4. National Impedance Map)
Research (NCAR). When combined with work on the national         by enabling geophysically based interpolation between
impedance map (Project 4. National Impedance Map), results       the magnetotelluric survey sites to yield high-resolution,
will provide input for real-time geoelectric-field mapping       gridded impedances in CONUS. The framework of
(Project 5. Geoelectric-Field Mapping).                          this project will further facilitate the investigation of
      In support of priorities for developing space-weather      anomalous, non-plane-wave response to short-spatial-scale
models (NSTC, 2019, Objective 2.5), for pursuing                 geomagnetic-field disturbance realized during storms.
fundamental understanding (Holmes and others, 2013,              Exploration of the limitations of the plane-wave
Goal 2), improving hazard assessments (Goal 3), and              approximation, inherent to magnetotelluric modeling,
providing situational awareness (Goal 4), the USGS               are planned by using realistic ionospheric-current
Geomagnetism Program is developing statistical methods for       sources (Projects 2. Geomagnetic Field Mapping and 5.
separating geomagnetic-disturbance signals from solar-quiet      Geoelectric-Field Mapping). Outside of the Geomagnetism
and secular signals in observatory data (Rigler, 2017)           Program, insights from the geological structure that the
that can be used for the calculation of magnetic indexes         models reveal (for example, Hermance, 2011) inform
(scalar measures of disturbance) that are widely used in the     projects undertaken by the USGS Geology, Geophysics, and
space-weather and terrestrial-geomagnetism communities.          Geochemistry Science Center for the evaluation of mineral
The program has developed statistical maps of geomagnetic        resources (for example, Bedrosian, 2016; Murphy and others,
disturbance (Love and others, 2016a) that, in combination        2019) and projects undertaken by the Earthquake Program
with surface impedance values (Project 4. National Impedance     for the evaluation of tectonic structures in areas prone to
Map), can be used for (simple) statistical estimations of        earthquake hazards. An important plausible extension of this
geoelectric hazards (Love and others, 2016b). These projects     project is consistent modeling of the conductivity structure
could be further developed, for example, by characterizing the   of CONUS and Canada. Collaboration will be with Oregon
statistics of storm-time magnetic declination, which would be    State University.
a product of potential interest for navigation and directional
drilling for oil and gas.
                                                                 Project 4. National Impedance Map
Project 3. Earth-Conductivity Modeling                                 In support of priorities for developing space-weather
                                                                 models (NSTC, 2019, Objective 2.5) and improving hazard
     In support of priorities for pursuing fundamental           assessments (Holmes and others, 2013, Goal 3), the USGS
understanding (Holmes and others, 2013, Goal 2),                 Geomagnetism Program is mapping the surface impedance of
and as a basis for developing space-weather models               CONUS—an important and high-profile product needed for
(NSTC, 2019, Objective 2.5) and improving hazard                 retrospective, real-time, and prospective scenario estimation
assessments (Holmes and others, 2013, Goal 3), the USGS          of geoelectric fields induced by magnetic storms and for the
Geomagnetism Program is developing models of CONUS               prospective estimation of geoelectric fields induced by EMP
subsurface electrical-conductivity structure. Heretofore,        (White House, 2019). Synthetic analyses have already shown
three-dimensional (3D) conductivity models have been             that the amplitude and polarization of induced geoelectric
obtained on a regional basis (for example, Meqbel and others,
Program Roles and Capabilities 9
40°N
30°N
110°W 100°W 90°W 80°W
100 101 102 103 104
R e sist iv it y ( Ωm )
Figure 6. A synthesized CONUS electrical-conductivity model at a depth of 30 kilometers obtained from the inversion of EarthScope
impedance tensors (Kelbert and others, 2019). Depth-dependent models of conductivity structure inform fundamental understanding of
geologic structures. Integration of conductivity models can provide physically realistic and geographically continuous maps of surface
impedance. Lack of structure in the south-central and southwest areas is a result of the lack of magnetotelluric data.
fields are strongly affected by the Earth's surface impedance to facilitate the calculation of line voltages and GICs. An
(for example, McKay and Whaler, 2006; Bedrosian and important plausible extension of this project is modeling of
Love, 2015). CONUS-Canadian surface impedance.
Several variants of the National Impedance Map are Impedance maps inform needed evaluations of the
being developed and maintained, and their utility for real-time quality of data acquired by ongoing magnetotelluric
geoelectric-field mapping (Project 5. Geoelectric-Field surveys, such as that for completing the national survey
Mapping) and statistical-hazard mapping (Project 6. under EarthScope protocols. By illustrating the geographic
Statistical Maps of Geoelectric Hazards) is being evaluated complexity of impedance, the project informs gap analyses
and explored. Most straightforwardly, impedance can be needed to justify additional magnetotelluric surveying
mapped by plotting integrated quantities derived from the (Project 8. Gap Analyses and Operational Support). As new
magnetotelluric tensors—for example, amplitude-polarization magnetotelluric surveys are performed and new impedance
ovals (as shown in figure 7A and B), an empirical impedance tensors become available, the impedance map are planned
map), apparent resistivity, or phase. Geographically dense to be periodically updated. To facilitate checking and
estimates of surface impedance can be obtained by sampling reproducibility by outside investigators, version numbers,
impedances derived from a conductivity model (Project 3. digital object identifiers, and metadata are planned to be used
Earth-Conductivity Modeling). Finally, these impedance for reference data, models, and algorithms.
maps can be interpolated on the power grids themselves10 Geomagnetism Program Research Plan, 2020–2024
40°N
30°N
1 0 −1 100 101 102
Max Scaling [mv/km]/[nT]
Figure 7. Maps showing the amplitude and
polarization imparted by magnetotelluric
40°N
impedances to the induced geoelectric field
for a given geomagnetic field A, as a function
of the azimuthal direction (declination) of the
geomagnetic field, and B, as a function of the
azimuthal direction of the induced geoelectric
field, each for variational periods of 10, 100,
30°N
and 1,000 seconds (smallest to largest ovals).
Generally, due to resistive rock structures,
impedance is high over parts of the Midwest and
the area of the Piedmont east of the Appalachians;
conversely, impedance is low over sedimentary
110°W 100°W 90°W 80°W basins, such as over the state of Michigan.
Project 5. Geoelectric-Field Mapping to implement more realistic models of surface impedance,
including geographically dense sampling of CONUS surface
In support of priorities for developing space-weather impedance derived from conductivity models.
models (NSTC, 2019, Objective 2.5), transitioning Checks on the accuracy of the estimated geoelectric fields
capabilities from research to operations (Objective 2.7), will be made by comparing them directly against measured
and providing situational awareness (Holmes and others, data, such as those now being acquired at the USGS Boulder
2013, Goal 4), the USGS Geomagnetism Program is magnetic observatory (Blum and others, 2017) or those
collaborating with NOAA SWPC and the University of acquired during magnetotelluric surveys. A critical validation
Colorado to provide real-time and retrospective CONUS analysis will include Geomagnetism Program collaboration
maps of geoelectric-field variation (Love and others, 2018; with NOAA and the power-grid industry for examination
see fig. 8). This project is the result of several years of and comparison of modeled geoelectric-field maps as inputs
concentrated effort, which involves time-domain convolution to GIC calculations compared to real GIC measurements in
of magnetic-field maps (Project 2. Geomagnetic Field the power grids (for example, Pulkkinen and others, 2017;
Mapping) with the national impedance map (Project 4. Sun and Balch, 2019). The outcome of such validation
National Impedance Map) (for example, Kelbert and others, exercises will, in turn, inform needed refinements of USGS
2017, 2019). The current real-time map product uses only magnetic-field and national impedance-mapping projects and
one-dimensional, depth-dependent models of surface possibly even motivate denser magnetotelluric surveys and the
impedance. Program scientists are working with NOAA installation of additional magnetic observatories.Program Roles and Capabilities 11
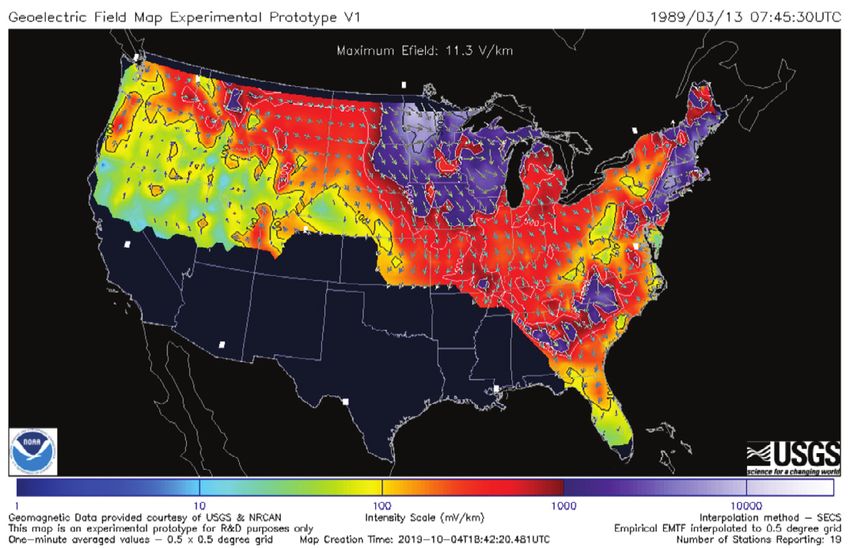
Figure 8. Snapshot from the NOAA-USGS time-dependent mapping project, which is similar to the map presented by NOAA in
real time. Shown here is an instance during the March 1989 magnetic superstorm. NOAA, National Oceanic and Atmospheric
Administration; USGS, U.S. Geological Survey; EMTF, electromagnetic transfer function; NRCan, Natural Resources Canada; UTC,
coordinated universal time.
Scenario mapping of storm-induced geoelectric fields observatories used for geomagnetic-field mapping (Project 2.
that incorporate whole-Earth, physics-based modeling of Geomagnetic Field Mapping). An important and plausible
the magnetosphere, ionosphere, and solid Earth (Projects 2. extension of this project is the consistent, joint mapping of
Geomagnetic Field Mapping, 3. Earth-Conductivity Modeling, CONUS and Canadian geoelectric fields.
and 4. National Impedance Map), will likely show that
some places exhibit localized complexity resulting from a
combination of geomagnetic disturbance and impedance, Project 6. Statistical Maps of Geoelectric
both of which are spatially complicated. Scenario mapping Hazards
constrained by data will enable and inform the analyses
of errors associated with the plane-wave approximation of In support of priorities for facilitating vulnerability
magnetotellurics (Project 4. National Impedance Map), and assessments of critical infrastructure (NSTC, 2019,
it will help users to identify needs for additional and higher Objective 1.2), developing space-weather models
density magnetotelluric surveys (Project 8. Gap Analyses and (Objective 2.5), and improving hazard assessments (Holmes
Operational Support). and others, 2013, Goal 3), the USGS Geomagnetism
Results from this project will inform the electricity Program is leading a project for developing statistical maps
utility industry in their projects for evaluating the of geoelectric hazard across CONUS (Lucas and others,
vulnerability of power-grid systems. Additional 2018; Love and others, 2019c; Lucas and others, 2020). This
Geomagnetism Program projects could include real-time project uses interpolations of magnetic observatory data and
and retrospective estimation of time-varying voltages on magnetotelluric impedance tensors. In the future, the latter
CONUS power grids, similar to that done in the mid-Atlantic could be improved by using a geographically dense sampling
U.S. before the March 1989 storm (Lucas and others, of surface impedance (Project 4. National Impedance
2018), although an ongoing challenge is the sparsity of Map) derived from conductivity models (Project 3.12 Geomagnetism Program Research Plan, 2020–2024
Earth-Conductivity Modeling). Importantly, the geographic Project 7. Electromagnetic-Pulse Hazard
sparsity of observatories is a lesser challenge for statistical
Analysis
analyses than for time-continuous mapping (Project 5.
Geoelectric-Field Mapping). In support of priorities motivated by the EMP Executive
Hazard maps, such as shown in figure 9 as voltages on Order 13865 (White House, 2019), the USGS Geomagnetism
the national power grid, can inform vulnerability-evaluation Program is examining the effects of realistic surface
projects of the NERC mandated by the Federal Energy impedance on E3-induced geoelectric fields. Towards that
Regulatory Commission (FERC) (2013). Once extreme-value end, the program uses some of the methods developed in its
voltage is estimated, GICs can be estimated by using analysis of storm-induced geoelectric fields (Lucas and others,
Kirchhoff's laws, line resistances, and grid interconnectivity; 2018, 2020). An idealized but standard model is being used
in turn, the stress a grid would experience during a for estimating bomb-induced geomagnetic disturbance (Legro
rare magnetic superstorm can be estimated. Recently and others, 1985; International Electrotechnical Commission
initiated work includes the parameterization of maximum (IEC), 1996). This model is convolved with surface impedance
geoelectric-field intensity in terms of global indexes of (Project 4. National Impedance Map) to obtain maps of the
geomagnetic disturbance, permitting retrospective estimation E3 geoelectric field. Both time-dependent-scenario and hazard
of the geoelectric hazards realized during great magnetic maps can be developed in this way.
storms of the past. An important plausible extension of this This project will illuminate the effects of the Earth’s 3D
project is consistent mapping of CONUS and Canadian conductivity structure on the E3-induced geoelectric fields—
geoelectric hazards needed to evaluate the exposure and until now, E3induction was typically considered for idealized
vulnerability of the integrated North American power-grid one-dimensional Earth models (Commission to Assess the
systems. Collaboration is with the USGS Geology, Threat to the United States (U.S.) from Electromagnetic Pulse
Geophysics, and Geochemistry Science Center and the (EMP) Attack, 2017). As for magnetic storms, investigation is
University of Colorado. needed of the non-plane-wave response to short-spatial-scale
geomagnetic-field disturbance.
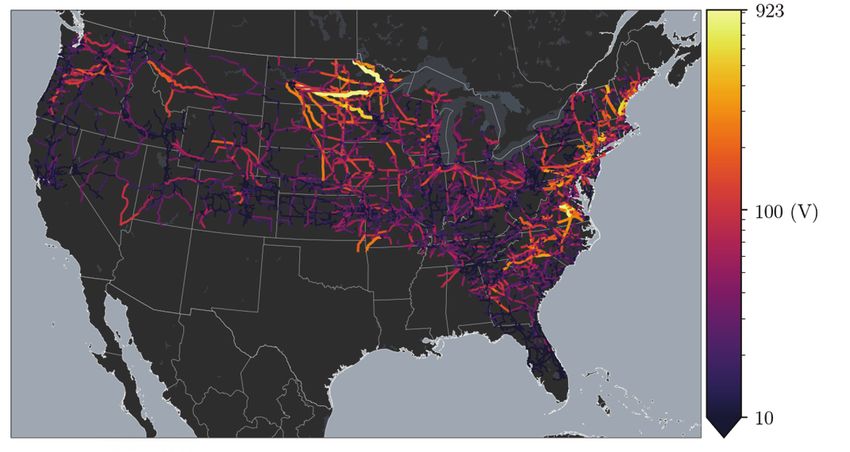
Figure 9. Once-per-century extreme magnetic-storm-event predictions of transmission-line voltage (Lucas and others, 2020): high and
low hazards are yellow and purple, respectively. That the highest hazards are in the northern Midwest and the Piedmont east of the
Appalachians demonstrates the important role that surface impedance plays in determining localized geoelectric hazards.Program Roles and Capabilities 13
This project might benefit from reconnaissance Goal 1); the USGS Geomagnetism Program is examining the
deployments of high-frequency magnetotelluric sensors with a temporal and spatial complexity of storm-time geomagnetic
variety of spacings and orientations in a variety of geological and geoelectric disturbance. As illustrated in figure 10, the
settings across CONUS. Collaboration is needed among difference in geomagnetic disturbance recorded at distant
diverse agencies—possibly including the Los Alamos National but neighboring observatories can be significant. Work on
Laboratory (for example, Rivera and others, 2016)—to enable this project can exploit the geomagnetic-disturbance maps
realistic modeling. Results are likely to be influential for the (Project 2. Geomagnetic Field Mapping) and include analyses of
EMP-assessment projects of the FERC (2013), Electric Power geomagnetic data from the relatively dense observatory network
Research Institute (EPRI) (Horton, 2017), DOE (2017), and in Europe. Geoelectric hazard maps (Project 6. Statistical
the DOD (Siebert and Witt, 2019). Maps of Geoelectric Hazards) can also be used to identify
potential locations for additional observatories or variometer
stations—new stations might, for example, be installed in
Project 8. Gap Analyses and Operational areas where geoelectric hazards are known to be high and far
Support removed from existing observatory locations. The program
plans to also examine the spatial resolution of the National
In support of priorities for ensuring baseline operational Impedance Map (Project 4. National Impedance Map) derived
space-weather-observation platforms, capabilities, and from available magnetotelluric- survey tensors; the 70-kilometer
networks (NSTC, 2019, Objective 2.2); identifying, developing, survey-station spacing under EarthScope protocols might need
and testing innovative approaches to enable enhanced, to be augmented with surveys of finer scale in areas of spatially
more informative, robust, and cost-effective measurements complex impedance. All of this will, in turn, help scientists
(Objective 2.4) and observations (Holmes and others, 2013, to address the challenges of mapping geomagnetic (Project 2.
Figure 10. Comparison of A, 1-minute north-south Bx geomagnetic-disturbance time series recorded at the Ottawa, Canada (red, OTT)
and Fredericksburg, Virginia (blue, FRD) observatories during the Halloween storm of October 29–31, 2003 (Balch and others 2004), and
B, the difference between the OTT and FRD time series. These observatories are separated by 814 kilometers.14 Geomagnetism Program Research Plan, 2020–2024
Geomagnetic Field Mapping) and geoelectric disturbances INTERMAGNET. They serve on the Executive Committee
(Projects 5. Geoelectric-Field Mapping and 6. Statistical Maps of the International Association of Geomagnetism and
of Geoelectric Hazards). Aeronomy (IAGA) and on the program committee of IAGA's
Electromagnetic Induction Workshops (EMIW). Program
scientists have a strong publication record, and notably, their
External Collaborative Projects research results have been reported in the popular press.
USGS Geomagnetism Program scientists collaborate
with several research groups on their projects. For example, as
part of an ongoing collaboration with NCAR on physics-based Some Conditional Aspirations
modeling of the magnetospheric-ionospheric system, staff are
developing (as of August 2020) a Biot-Savart algorithm that The preceding plan (with its eight integrated projects)
can be used to estimate ground geomagnetic-field disturbance. is ambitious, and aspects of each project are currently being
On another front, program scientists are collaborating pursued (as of August 2020). Even with the present level
with (1) the University of Texas at Arlington on numerical of funding and staffing numbers, given the demonstrated
simulations of the most extreme sudden geomagnetic impulse productivity of USGS Geomagnetism Program scientists,
theoretically possible; (2) the National Solar Observatory good progress on all eight projects can be anticipated, as
on analysis of historical records of an intense solar flare and program scientists are fully occupied with their individual
solar-proton event; and (3) the USGS Geology, Geophysics, responsibilities. Given this, we can then imagine what the
and Geochemistry Science Center on several projects related program might be able to do should increased funding and
to geoelectric hazards and the modeling of solid-Earth higher staffing numbers be realized. Most directly, progress on
conductivity structure by using magnetotelluric-survey data. the projects might be accelerated and judiciously expanded.
This would certainly benefit electric-utility companies with
their projects for evaluating the vulnerability of power-grid
systems to the deleterious effects of natural and anthropogenic
Community Leadership geoelectric disturbance.
In more detail, the capability for mapping geoelectric
The scientists of the USGS Geomagnetism Program play fields (Project 5. Geoelectric-Field Mapping) could enable
important roles in the terrestrial geomagnetic, magnetotelluric, retrospective analyses of historical magnetic storms (Project 1.
and space-weather communities. They serve the Nation Historical Magnetic Superstorms) and prospective analyses of
through the NSTC's Space Weather Operations, Research, and physics-based models (Project 2. Geomagnetic Field Mapping)
Mitigation (SWORM) working group and the Electromagnetic of a potential superstorm. Scenario results would help put the
Pulse Research and Development (EMPRAD) working statistical geoelectric-hazard maps (Project 6. Statistical Maps
group, providing expertise in the ground effects of natural and of Geoelectric Hazards) and the time-dependent geoelectric
anthropogenic electromagnetic-field disturbance. They advise maps (Project 5. Geoelectric-Field Mapping) into perspective.
FERC and NERC on storm-induced geoelectric hazards. They Similarly, building on the proposed EMP analysis (Project 7.
advise the National Geospatial-Intelligence Agency (NGA) on Electromagnetic-Pulse Hazard Analysis), physics-based
their World Magnetic Model project. They provide a liaison models of source geomagnetic disturbance would help to
to NSF's Geospace Environment Modeling (GEM) steering put idealized EMP geoelectric maps into perspective. Any
group, and they serve on GEM's metrics-and-validation of these projects would benefit from additional support for
resource group. They serve on an advisory panel for university Geomagnetism Program research, including work done
magnetometer programs and on IRIS's Electromagnetic through postdoctoral appointments.
Advisory Committee (EMAC). They advised NSF's EarthScope If funding were sufficient to support new and
program on its magnetotelluric survey, and they played essential additional Geomagnetism Program observatories (or
roles in the processing of EarthScope magnetotelluric data and simpler variometer stations) across CONUS and (or) new
in archiving related impedance tensors (Kelbert and others, and additional regional magnetotelluric surveys in areas
2018). They have served on the Leadership Council of NSF's that the national-scale survey shows are likely to have
EarthCube (Kelbert, 2014; Aronson and others, 2015), as well high and spatially complicated geoelectric hazards, then
as on its committees for science, technology and architecture, scientific analyses of the new resulting data would provide
and nominations. They have organized conference sessions for more detailed time-dependent geoelectric maps (Project
the American Geophysical Union (AGU) and the International 5. Geoelectric-Field Mapping) and more detailed regional
Union of Geology and Geophysics (IUGG). They have advised geoelectric-hazard maps (Project 6. Statistical Maps of
the domestic oil-and-gas industry on the use of geomagnetic Geoelectric Hazards). Additional support could also enable
data for directional drilling (Buchanan and others, 2013). the analysis of geoelectric hazards that can affect pipelines,
Internationally, USGS Geomagnetism Program railroads, and transoceanic telecommunication cables,
research scientists and leadership support geomagnetic each of which would be qualitatively different from hazard
monitoring (Love and Finn, 2017) by providing guidance for analyses for power grids.You can also read