PROTECTING BENGALURU'S CHILDREN: time to act for clean air around schools - Health and Environment ...
←
→
Page content transcription
If your browser does not render page correctly, please read the page content below
PROTECTING BENGALURU’S CHILDREN:
time to act for clean air around schools

                       Child Health Emerging Leaders Program
About

This report is produced by the Global Climate and Health Alliance (GCHA) and Health and Environment Alliance
(HEAL), as part of the work of the Healthy Air Coalition, Bengaluru and a global initiative for clean air in our cities
in 2030, known as Unmask My City.

Principal researcher and author:

                            Dr K.R.Bharath Kumar Reddy
                            MBBS, MD, DNB, DMLE, DCRL, DAA
                            Fellowship in Paediatric Pulmonology & Sleep
                            European Diplomate in Paediatric Respiratory Medicine
                            Director Shishuka Children’s Hospital

This report includes data from Dr Reddy’s recent study of air quality near schools in Bengaluru, undertaken
as a member of the International Pediatric Association’s IPA LEAD: Child Health Emerging Leaders Program.
This novel, executive-style, global leadership development program for early career pediatricians is designed to
increase leadership capacity and collaboration among the world’s pediatric professional societies, with the goal
of accelerating advances in child health at local, national and global levels.

Dr Reddy is a Consultant Pediatric Pulmonologist at the Indira Gandhi Institute of Child Health ,Sagar Hospital and
Cloudnine Hospital, Bengaluru. He is the National Convenor for the Indian Academy of Pediatrics (IAP) “Consensus
Statement on Impact of Air Pollution on Asthma and Allergic Rhinitis in Children”, and a National Convenor and
Moderator for the IAP Respiratory Chapter “Module on Air Pollution: What Every Pediatrician Must Know and Do”.
In addition, Dr. Reddy serves as a WHO Expert Advisor for ‘Clinical Case Scenarios’ for a WHO Air Pollution Module
and training kit.

Dr Reddy, HEAL and GCHA would like to thank Dr. Linda Arnold, IPA LEAD: Child Health Emerging Leaders
Program & Associate Professor of Pediatrics and Emergency Medicine, Yale School of Medicine, for her critical
review and revision of the report for important intellectual content, and interpretation of study data.

Statistical Analysis: Dr Rashmi Bhopi, MD Pediatrics, MSc candidate, London School of Hygiene and Tropical
Medicine.

Report written by: Vijoleta Gordeljevic (HEAL), Frances MacGuire (GCHA), Anne Stauffer (HEAL).

Review: Dr Linda Arnold, Director, IPA LEAD: Child Health Emerging Leaders Program & Associate Professor of
Pediatrics and Emergency Medicine, Yale School of Medicine. Aishwarya Sudhir (Consultant), Jeni Miller (GCHA),
Dr. Bharath Reddy.

Responsible editor: Genon K. Jensen, HEAL.

Dr. Bharath Reddy, HEAL and GCHA would like to thank the following experts who provided input and feedback
for the report:

Dr Jagadish Chinnappa, President, Indian Academy of Pediatrics (IAP) National Respiratory chapter, Dr Santosh
Soans, Prof. & H.O.D., A. J. Institute of Medical Sciences, IPA LEAD Mentor & Ex-President Indian Academy of
Pediatrics (IAP) (2018), Ms Tristha Ramamurthy, Leading Educationist, Founder, Ekya Schools & Provost CMR
University

2    HEAL, GCHA, Shishuka and IPA LEAD: Protecting Bengaluru’s Children: time to act for clean air around schools
Table of contents

  1.   Executive summary P.4

  2.   Air pollution and health in Bengaluru P.5

  3.   Air quality monitoring and clean air regulations P.7

  4.   The health impacts of air pollution and particularly PM2.5 pollution
       on children’s health P.9

  5.   Rationale for this study: Investigating air quality at schools P.11

  6.   Methodology of the study P.12

  7.   Results and Discussion P.13
           7.1. Air Quality through the year in Bengaluru P.13
           7.2. Air Quality during school hours P.15
           7.3. Air Quality during school arrival and departure time P.16
           7.4. Effects of reducing vehicular traffic in Bengaluru as part of lockdown P.18

  8.   Recommendations P.20

  9.   Annex P.23
           10.1. Number of Schools and Students in the areas studied P.23
           10.2. Population of children in Bangalore city as per 2011/12 census P.23
           10.3 Government air monitoring in Bengaluru P.24
           10.4. The Healthy Air Coalition’s network for air monitoring P.24
           10.5 Location of monitors across Bengaluru P.25
           10.6 The UK’s guidance scheme and policy measures
                to reduce air pollution around schools P.26

  10. References P.27

           HEAL, GCHA, Shishuka and IPA LEAD: Protecting Bengaluru’s Children: time to act for clean air around schools   3
1   Executive summary

    Air pollution is the largest environmental health risk                points over a 14 months period (June 2019 – July 2020)
    worldwide, and also in India. There is a considera-                   around 270 schools in 18 districts of Bengaluru. The
    ble body of evidence on the detrimental impacts of                    data were gathered through an independent network
    breathing in polluted air in the short and long term.                 of air quality monitoring devices that had been set up
    Recent science has also highlighted the impact of                     by the Healthy Air Coalition Bengaluru in 2019. These
    poor air quality on the healthy development of chil-                  gather real-time data on fine particles (PM2.5, PM10 )
    dren from the first point of exposure to air pollutants               and also provide for an air quality index (AQI), acces-
    in utero, to disease in childhood and later life. While               sible to everyone.
    the overall awareness of the health threat of air pol-
    lution has grown, leading to policies and political                   Given that Bengaluru experienced a unique lockdown
    support for clean air, this has not necessarily translat-             and consequent drop in pollution, the results are likely
    ed into a commitment to improving the quality of the                  to be an underestimate.
    air that children breathe, while commuting to school
                                                                          This report proposes a series of recommendations, in-
    and at school, where they spend a significant amount
                                                                          cluding prioritising good air quality around schools and
    of their time when not at home.
                                                                          ensuring compliance with Indian outdoor air quality
    This report aims to shed light on air quality around                  standards, installing more monitors throughout the
    schools in the city of Bengaluru, India. As an educa-                 city to carry out routine monitoring, restricting heavy
    tion hub, Bengaluru holds pride in having some of the                 traffic around schools and introducing school road
    best schools in the country. In recent months, con-                   closures. A change in school hours in areas with heavy
    cerns have grown among local health professionals                     air pollution should also be considered, construction
    about the possible impact of air pollution on children                work during school hours should be avoided, and chil-
    and young people. There has, however, been limited                    dren and families should opt where possible to travel
    research carried out in this field and a lack of data to              to and from school via less busy routes.
    evaluate.
                                                                          Doctors treating children with chronic lung problems,
    Led by Dr. Bharath Reddy, Director & Consultant                       allergies and asthma, should consider air pollution in
    Pediatric Pulmonologist, Shishuka Children’s Speci-                   general and the air quality in the school environment
    ality Hospital, we investigated almost 500,000 data                   specifically.

          The analysis revealed the following:

                  According to World Health Organization recommendations, air quality in Bengaluru is unhealthy
                  for children throughout the year, but especially from October to April. In December and January,
     OCT-APR
                  particulate matter pollution even exceeded the Indian air quality standard, which is nearly double
                  the US EPA standard. Children with chronic conditions like asthma are at a high risk of developing
                  symptoms during this period, as the impact of cold weather on chronic respiratory conditions is
                  further exacerbated by the poor air quality this time of the year.

                  During school hours, two-thirds of the areas studied had high daily concentrations of PM2.5, above
        PM2.5     the US EPA standard (throughout the 14 months). Consequently, children may be breathing pollut-
                  ed air during their break time and in classrooms when windows are kept open.

                  Air quality was found to be especially poor during school departure times (3 to 5 PM).

    4      HEAL, GCHA, Shishuka and IPA LEAD: Protecting Bengaluru’s Children: time to act for clean air around schools
2   Air pollution and health in Bengaluru

    Bengaluru - an overlooked air pollution hotspot
    Air pollution in India is a serious health issue. Accord-         late matter pollution (0.98 million) and household air
    ing to the World Health Organization (WHO) 13 out of              pollution (0.61 million). While the death rate due to
    the 20 most polluted cities in the world are located in           household air pollution decreased by 64% from 1990
    India and one in eight deaths (12.5%) in the country is           to 2019, the rate due to ambient particulate matter
    due to poor air quality 1.                                        pollution increased by 115%. Lost output from prema-
                                                                      ture deaths and morbidity attributable to air pollution
    A recent study in the Lancet on the economic impact               accounted for economic losses of US$28.8 billion and
    of air pollution in India found even greater impact,              $8 billion, respectively, in India in 2019. This total loss
    showing that nearly 1.67 million deaths were attrib-              of $36.8 billion represents 1.36% of India’s gross do-
    utable to air pollution in India in 2019, accounting for          mestic product (GDP)2.
    almost 20% of the total deaths in the country. The
    majority of these deaths were from ambient particu-

                        “Improving air quality, both locally and globally, is key to sustainable
                        development and to advancing “health for all.” Children are especially
                        vulnerable to the adverse health effects of air pollution, but have no control
                        over environments where they live, learn and play. We have a duty to protect
                        children from airborne toxins, because they can’t protect themselves. Doing so
                        requires political will, a multi-sector commitment to improving air quality, and
                        sustained collaboration towards comprehensive solutions. It also requires better
                        monitoring of levels and sources of air pollution, to inform efforts to minimize
                        children’s exposure.”
                        Dr Linda Arnold, Director, IPA LEAD: Child Health Emerging Leaders Program &
                        Associate Professor of Pediatrics and Emergency Medicine, Yale School of Medicine.

    Whereas air pollution has been identified as a national           Bengaluru is one of India’s largest cities, the IT capital
    problem and is frequently in the spotlight in the cap-            of the country and a major economic and cultural hub.
    ital Delhi, it does not receive equal public nor policy           It is also one of the fastest growing cities in India and
    attention across the country, particularly in southern            worldwide. With this rapid urbanisation came a series
    cities such as Bengaluru. Karnataka has been esti-                of pollution problems including a significant increase
    mated to have lost US$2113 million due to premature               of vehicles and traffic4, waste burning, a decline in
    deaths and US$568 million in 2019 due to the effects              green spaces and trees, as well as the release of dust
    of air pollution3.                                                from ongoing construction. The sources of air pollu-
                                                                      tion in the city are mostly local.

                       HEAL, GCHA, Shishuka and IPA LEAD: Protecting Bengaluru’s Children: time to act for clean air around schools   5
Air quality is deteriorating, and ill-health is increasing
Doctors are concerned about an increase in cases                    According to a 2018 study, the prevalence of asthma
of childhood asthma, upper respiratory infections,                  in people under 18, in Bengaluru has increased from
chronic pulmonary disease, as well as heart attacks                 9% in 1979 to 29.5% in 1999. Similarly, allergic rhinitis
in young people. Heart problems, in particular, have                has increased from 22.5% in 1994 to 40% in 2018. As
risen alarmingly in people younger than 40 years, ac-               part of this study, a survey in 12 schools with 6550
cording to doctors at the Jayadeva Institute of Cardi-              children showed higher asthma rates for children
ovascular Sciences and Lakeside Hospital.                           in schools in high traffic areas (19.34% compared to
                                                                    11.15% in low traffic areas), and even higher rates in ar-
Whereas systematic gatherings of data have been                     eas with both heavy traffic and a low socioeconomic
scarce and insufficient, cardiologists and pulmonolo-               status5.
gists are concerned that rising air pollution levels are
a factor in the increase in disease burden among the
city’s population.

                      Allergic airway diseases are a major global epidemic, causing a tremendous
                      psycho-socio-economic health care burden to society.
                      The main factors for their increase include losing our threshold of protection, a
                      change in our food habits, a western lifestyle of living with poor cross ventilation
                      and little sunlight, and a higher exposure to outdoor and indoor air pollution.
                      It is time to act to clean up the air that we breathe”.
                      Prof. H Paramesh , Pediatric Pulmonologist and Environmentalist, Distinguished
                      Professor Divecha Center for Climate Change, Indian Institute of Science, Bengauluru,
                      and author of a study on prevalence of asthma in under 18 year olds.

                      “I was surprised to see an increase in heart attacks in younger people, without
                      them having any of traditional risk factors such as hypertension, diabetes or
                      obesity. With taking a closer look I found that many of these patients were either
                      an auto or taxi driver from in and around Bengaluru. They are the worst hit as they
                      are often stranded in bad traffic for long hours, and are exposed to high levels of
                      pollution. We need to study this phenomenon in more detail”
                      Dr. Rahul Patil, Consultant Cardiologist and Head of Premature Coronary Artery Disease
                      Division at the Jayadeva Institute of Cardiovascular Sciences and Research, Bengaluru, and
                      author of the investigation into cardiovascular disease in under 40 year olds.

6    HEAL, GCHA, Shishuka and IPA LEAD: Protecting Bengaluru’s Children: time to act for clean air around schools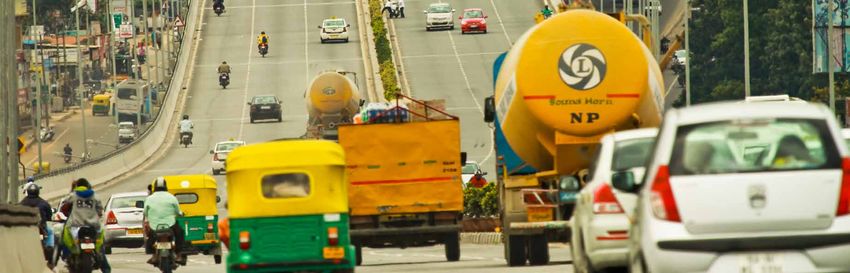
3    Air quality monitoring and clean air regulations

    There is an official, government funded, network of               ones that collect data from time to time, is provided
    monitoring stations in Bengaluru but they are not                 through monthly summary reports7.
    sufficient to cover a city of over 12 million inhabitants.
                                                                      These reports provide information on concentrations
    Currently, there are only 10 online [state-controlled]            of PM10, PM2.5 and other pollutants, and also give an air
    monitoring stations operating in real-time in the city,           quality index (AQI).
    providing data on a 24/7 basis. Five of these went live
    in January 2018 and are located in Hebbal, Jayanagar,             This index is based on daily averages of PM10, PM2.5
    Kavika, NIMHANS, and Silk Board6. In addition to the              and other gas concentrations. It includes a range of
    online monitoring stations that measure PM2.5 con-                pollutants, and uses the parameters of the US Envi-
    centrations, the state pollution control board also has           ronmental Protection Agency (EPA) and not the Indi-
    14 manual monitoring stations which measure PM10 or               an Air quality standards.
    the RSPM (Respirable Suspended Particulate Matter)
                                                                      The monitors of the independent air network were
    on any two days in a week. In addition to the existing
                                                                      set up by the Healthy Air Coalition Bengaluru, which
    network, there is also a mobile van in place for any
                                                                      provided the data for this report.
    emergency measurements that may be needed.

    Publicly accessible information on the results of
    the 10 online real-time monitoring stations, plus the

        Air pollutants and health

       Outdoor and indoor air pollution is the largest environmental risk to health worldwide8. There is a com-
       prehensive body of evidence demonstrating the many effects of short and long-term exposure to pol-
       luted air, and each year, hundreds of new studies are published.

       The main air pollutants include:

            PM10     Particulate Matter (PM): These are particles of less than 10 and 2.5 microns in diameter.
            PM2.5    PM less than 10 microns are known as respirable suspended particulate matter (RSPM).
                     PM2.5 is of particular concern because it can travel deep into the lungs, enter the
                     bloodstream and travel to other organs, even crossing the blood/brain barrier. PM and
                     diesel exhaust have been classified as carcinogenic by WHO’s International Agency for
                     Research on Cancer (IARC).

            NO2      Nitrogen dioxide (NO2): Diesel cars are the major source of this pollutant, which also
                     contributes to the formation of PM. The direct short and long term effects of NO2 are
                     currently under review by WHO.

             O3      Ozone: This pollutant forms through a reaction with heat and sunlight.

       The greatest health burden of air pollution is from premature death, cardiovascular and lung disease.
       Recent studies also show impacts on children’s health (even in utero), and air pollution as a possible
       contributor to obesity and neuro-degenerative disease9. A new WHO review on the science is expected
       for 2021.

                       HEAL, GCHA, Shishuka and IPA LEAD: Protecting Bengaluru’s Children: time to act for clean air around schools   7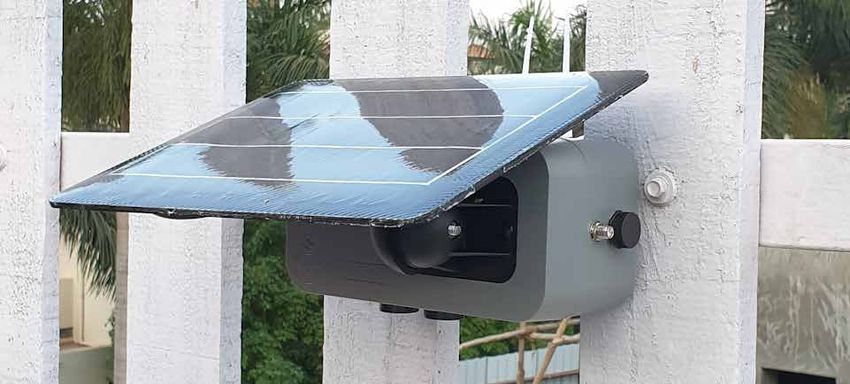
Clean air standards and health-based recommendations
India’s Central Pollution Control Board (CPCB) has set                Emissions suggests that Bengaluru’s pollution levels
regulatory standards for acceptable levels of air pol-                are three times the WHO air quality recommenda-
lution. These are currently set at a much higher level                tions10.
than the WHO recommendations. One study by Urban

    Table 1 - Overview of selected PM2.5 standards and recommendations

                                                                                                     US EPA
Particulate Matter2.5                  Indian Air              WHO guideline
                                                                                         (Environmental Protection Agency)
Standards                              Standard              recommendations
                                                                                                    standards
Daily (24hr mean )                    60 μg/m3                   25 μg/m3                                35 µg/m3

                                                                                             12 µg/m3 (for primary PM)
Annual average                        40 μg/m3                    10 μg/m3
                                                                                          and 15 µg/m3 (for secondary PM)

     The above chart compares particulate matter standards2.5 prescribed by the Indian Govt11 compared
     to the World Health Organization12 and US EPA recommendations (primary PM is formed directly from
     combustion processes, while secondary PM develops through chemical processes)13. The WHO recom-
     mendations for PM and other pollutants are based on an extensive review of accumulated scientific
     evidence by a large team of renowned international experts; they are purely health-based; the US EPA
     standards are also based on a scientific review and consultation with the Agency’s independent scien-
     tific advisors. Indian standards have been set by the Central Pollution Control Board.

                       “Pollution is a serious concern of our times. Its effects on child health is increasingly
                       becoming evident across the world. Doctors and professional medical bodies have
                       a responsibility to help mitigate the negative impact of pollution by educating
                       the community and creating awareness. Health care professionals must be trained
                       in the effects of air pollution and its preventive strategies in conferences. It is
                       also high time air pollution is included in the medical education syllabus. This
                       encourages doctors to take up the cause of clean air for children from early on as
                       doctors are important advocates for social change”
                       Dr Santosh Soans, Prof. & H.O.D., A. J. Institute of Medical Sciences, IPA LEAD Mentor &
                       Ex-President Indian Academy of Pediatrics (IAP) (2018).

8     HEAL, GCHA, Shishuka and IPA LEAD: Protecting Bengaluru’s Children: time to act for clean air around schools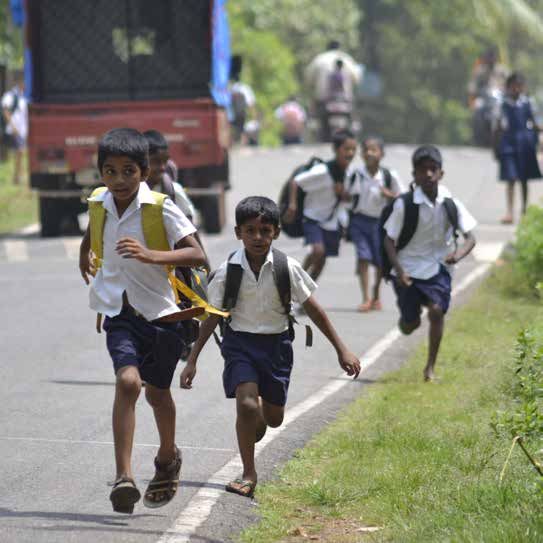
4   The health impacts of air pollution and particularly
    PM2.5 pollution on children’s health

Children are vulnerable to the effects of air pollution          toxification and antioxidant defence system14. Hence,
due to their outdoor play activity, breathing higher             the effects of air pollution on children can be both
concentration of pollutants, more mouth breathing                acute and long-term, impacting a child’s lungs, heart,
behaviour, higher minute ventilation, an ineffective             brain and nervous system15.
nasal filtering capacity, and an underdeveloped de-

PM2.5 has a particularly strong negative impact on children’s health

In the last 60 years, a sharp increase in asthma prev-           obstructive pulmonary disease (COPD)19. Hence early
alence was observed in a number of countries. The                exposure to air pollution can sow the seeds of signif-
effect of poor air quality on childhood asthma and               icant long-term illnesses such as asthma in children.
allergies is well described. Acute increases in air pol-
lution play a significant role in flare-up of asthma in          Bengaluru has seen an increase in the cases of asth-
children16. More than 15% of all asthma flare-ups in             ma over recent years with an increase in urbanisation.
children were found to be related to traffic-related air         A study of hospital based data showed an increase
pollution (TRAP)17, especially in those whose homes              in the prevalence of asthma in Bengaluru from 9% in
were close to roads with heavy vehicular traffic. Expo-          1979 to 29.5% in 1999. The prevalence in urban Ben-
sure to traffic-related air pollution in infancy has also        galuru was found to be higher at 16.6% in comparison
been shown to be associated with a lower lung func-              to 5.5% in the rural area. Children exposed to heavy
tion at the age of 16 years18, which has a potential to          traffic, especially from the less affluent families, had a
lead to asthma in the future and develop into chronic            higher prevalence of asthma of nearly 31%5.

                  HEAL, GCHA, Shishuka and IPA LEAD: Protecting Bengaluru’s Children: time to act for clean air around schools   9
“As a Pediatric Pulmonologist I consult children with asthma and allergic rhinitis on
                      a daily basis.
                      Many of these children have flare-ups of asthma when exposed to indoor and
                      outdoor air pollution.
                      I took up the cause of clean air in Bengaluru city to ensure that our children are
                      protected from the effects of air pollution. ”
                      Dr K.R.Bharath Kumar Reddy, Director & Consultant Pediatric Pulmonologist, Shishuka
                      Children’s Speciality Hospital, and lead investigator for this report.

Exposure to polluted air with higher levels of PM2.5,               the offspring to cardiovascular disease later in life24
nitrogen dioxide (NO2) and ozone (O3) has also been                 as well as a lower lung capacity. Research indicates
shown to increase the chance of developing acute                    air pollutants reach the developing fetus via the pla-
lower respiratory tract infections and pneumonia in                 centa25. A study of an Indian cohort of 1285 pregnant
children20. Children exposed to higher levels of PM2.5              women in the Southern region Tamil Nadu, one of In-
and environmental tobacco smoke also have a higher                  dia’s 28 states, found that a 10 μg/m3 increase in expo-
prevalence of allergic rhinitis and recurrent ear infec-            sure to PM2.5 during pregnancy was associated with a
tions (otitis media) which could lead to hearing loss21.            decrease in birth weight of 4 g and a 2% increase in
                                                                    the prevalence of low birth weight26.
Increasing evidence has come to show an association
between childhood obesity and exposure to air pol-                  Several studies also looked at the impact of increased
lution. Higher exposure to traffic-related air pollution            air pollutant concentrations on infant mortality and
earlier in life was linked with weight gain at a much               found that infant and post-neonatal mortality in-
faster rate in children, resulting in obesity by 10 years           creased with each 10 μg/m3 short-term exposure
of life22. Confounders also need to be considered such              increase in PM2.5. This held true even when concen-
as concurrent poor diet and higher stress levels asso-              trations were below national air quality standards, as
ciated with living in poorer areas with higher air pollu-           was the case in a study done in Japan27.
tion. PM2.5 further plays a key role in the development
of neuroinflammation and neurodegeneration in chil-                 Unfortunately, more of these effects were seen in chil-
dren and has been linked to Alzheimer’s disease later               dren from low and middle-income countries (LMIC).
in life23.                                                          Notably, 98% of all children under 5 years of age in
                                                                    these countries are exposed to levels of fine partic-
Air pollution exposure leaves its mark on the unborn                ulate matter (PM2.5) higher than the WHO air quality
child. Developing babies who are exposed to air pol-                guideline recommended levels24. The annual mean
lution during the prenatal period may experience ad-                levels of PM2.5 in the African, South-East Asian and
verse health outcomes as they mature and through-                   Western Pacific WHO regions was 5-10 times greater
out childhood. There is some evidence that exposure                 than the WHO guideline limit.
to air pollution during pregnancy can predispose

10   HEAL, GCHA, Shishuka and IPA LEAD: Protecting Bengaluru’s Children: time to act for clean air around schools
5 Rationale for this study: Investigating air quality at schools
Globally, in 2016 UNICEF reported that around 300 US Environmental Protection Agency (USEPA) and
million children live in areas where air is hazardous28. the British Lung Foundation have issued guidance to
schools on how to reduce exposure to pollutants in
All over the world, children spend a significant pro-
the air29.
portion of their day at school. A significant amount
of time is spent during travel to and from school as However, in many cases the extent of the air pollution
well. Hence, it can be said that the air that children problem at schools is unclear.
breathe on their way to school, during school hours
In response to local health concerns and the stark
(as pollution travels inside from outside) and on their
increase in health conditions among children and
return route from school can pose a significant impact
young people, increasingly affected by the city’s air
on their health.
pollution crisis, as well as the lack of research in the
Protecting children of school age from air pollution field of children’s health and air pollution in Bengaluru,
requires a combination of taking action to address this assessment aims to to evaluate whether the air
pollution from the root causes and minimising their quality in Bengaluru was a health risk to schoolchil-
exposure to the emissions. Organizations such as the dren during the months June 2019 to July 2020.
Monitoring air quality in and around schools - response to growing concerns
Around the world, concerns about air pollution on of exposure to traffic related air pollutants in school-
children have led to the installation of networks of air children31. A series of measures were proposed to
quality monitors near schools to get baseline data on improve air quality in urban schools. An investigation
pollution to which children may be exposed, includ- by HEAL monitoring 50 schools in 6 EU capitals found
ing agency-led efforts, academic research, as well as that air quality must be improved in order to protect
citizen-led efforts. children’s health and ensure optimal learning32. In the
UK, the National Education Union has issued a guid-
The European Environment Agency (EEA) and the
ance scheme for air quality around schools (see An-
European Network of the Heads of Environmental
nex 10.6). Closing roads around schools to traffic at
Protection Agencies (EPAs), for example, launched
pick up and drop off times has cut nitrogen dioxide
an initiative to monitor air quality around schools in
(No2) levels by up to 23 percent, research published
Europe30. In a study from Barcelona air quality was
by the London mayor`s office has revealed33.
monitored in 39 urban schools to evaluate the effects
Citizen science in Bengaluru
Apart from the official data provided by the Kar- The results were not directly comparable to
nataka State Pollution Control Board (KSPCB), official monitoring data, as the time frame was
at least five other organisations have installed shorter. However, the averages observed over
monitors, including the Healthy Air Coalition air the four-hour auto rides, carried out in two
quality monitoring network, as well as citizen parts, consistently generated averages above
science monitoring projects34. 200 ųg/m3 PM2.5. The WHO recommendation for
the daily average of PM2.5 is 25 ųg/m3. Poor air
An example comes from 2018 from a report pub-
quality levels persisted for several hours every
lished by Climate Trends and Citizen Matters,
day owing to traffic congestion.
highlighting the huge gaps in air quality infor-
mation in Bengaluru6. Using mobile devices, the
groups monitored air quality over a 7 day period,
for peak times at 7 selected transport intersec-
tions. The seven arterial routes had a common
starting point: Jayanagar/Banashankari touching
Marathahalli, Silk Board, Electronic City, White
Field, Uttarahalli, MG Road and Mekhri Circle.
HEAL, GCHA, Shishuka and IPA LEAD: Protecting Bengaluru’s Children: time to act for clean air around schools 116 Methodology of the Study
The data for this investigation was gathered through changes in air quality. Mean of hourly data was cal-
an independent monitoring network that the Healthy culated to determine PM2.5 levels for each of the 24
Air Coalition, through the support of HEAL and GCHA hours in a day. Further a mean value of hourly data
has set up in the city in 28 major locations. These were over 14 months was calculated for each of the 18 ar-
set up especially at, or near, places frequented by vul- eas.
nerable groups, including community health centers.
Mean values of PM2.5 at school arrival (6AM to 10AM),
The monitors are calibrated on an ongoing basis with
during school (8AM to 4PM) and school departure
one monitor co-located with an official, regulatory
(2PM to 6PM) for 5 weekdays (Monday to Friday)
monitor. Data were recorded in real-time on a contin-
were plotted to compare with 24 hour data. Simi-
uous basis for 24 hours a day.
lar data were extracted for the same timings on the
For the schools analysis, data from 18 monitors were weekend (Saturday and Sunday). A comparison of
randomly chosen to avoid any bias in selection of the means between the weekdays versus weekend val-
monitor data. ues was done using the student t-test.
In total, 482,708 data points were analysed to deter- To analyse the change of air quality during the lock-
mine the air quality during school going hours. Are- down imposed during the start of the COVID19 pan-
as were further classified into different zones based demic, we divided the assessed time periods into 3 -
on the levels of PM2.5 and PM10. Zones were further Pre-lockdown, Lockdown and Post-lockdown. The 45
ranked into those with best air quality during school days from February 8th to March 24th 2020 was taken
hours to the worst values. as the pre-lockdown period, the 45 days from March
25th to May 8th 2020 as lockdown period, and the 45
In total, air quality around 270 schools was investigated.
days from May 9th to June 23rd 2020 as post-lock-
Data were extracted from the monitors at 15 minute down period.
intervals for a duration of 14 months from June 2019
Data of PM2.5 divided into these 3 periods were av-
to July 2020. Data were sorted into 2 recorded pa-
eraged, analysed and compared. Humidity and tem-
rameters - PM2.5 and PM10 of which PM2.5 was further
perature values also measured by the monitors were
analysed and described in detail.
used to account for any influence of these on air qual-
The monthly mean with standard deviation of PM2.5 ity recordings.
was calculated and compared to determine seasonal
Figure 1 - Overview of the 18 areas studied in Benglauru
17
Areas include:
13 4
1 Varthur 10 MS Ramaiah City
7
2 Springfield 11 Gottigere (IIM-B)
9
8 3
5 16 3 Doddanekundi 12 HSR Layout
4 Kalyannagar 13 JC Road
15 1
18 14 5 Corporation Circle 14 Koramangala
6
2
12 6 Sarjapur 15 Bellandur
7 Srirampura 16 Brigade Road
10
8 Indiranagar 17 Mathikere
11 9 Ulsoor 18 Jayanagar
12 HEAL, GCHA, Shishuka and IPA LEAD: Protecting Bengaluru’s Children: time to act for clean air around schools7 Results and discussion
7.1. Air Quality through the year in Bengaluru
PM2.5 was found to be significantly increased from the ed to the imposition of a lockdown in the city due to
months of November 2019 to March 2020, in all re- the COVID-19 pandemic in the month of March 2020.
corded areas uniformly. Subsequently, the values de-
clined from March to July 2020. This could be attribut-
Table 2 - Monthly average values of PM2.5 in Bengaluru from June 2019 to July 2020
70
Indian
63 64
National
Standard
55
PM2.5 values
50 51
49
40
38
EPA standard
36 34
30 32
29 30 28
WHO
recommendation
20 23
20
10
0
June July Aug Sept Oct Nov Dec Jan Feb Mar Apr May Jun Jul
Months (2019-2020)
Above the Indian standard Above the US EPA standard Above the WHO recommendation
of daily PM2.5 concentrations for daily PM2.5 concentrations for daily PM2.5 concentrations
(>60ug/m3) (>35ug/m3) (>25ug/m3)
The monthly average PM2.5 concentrations are above and January 2020 when the PM2.5 values cross the In-
the WHO recommendations for daily (>25μg/m3) and dian National clean air standard (>60μg/m3), which is
annual concentrations (>10μg/m3), and above the US known to be ‘unhealthy for sensitive groups’. The an-
EPA standard for 24 hour concentrations (>35μg/m3) nual mean of PM2.5 was noted to be 40.7 ug/m3 which
between the months of October to April. A notable is much above the WHO recommendation for an an-
increase is seen during the months of December 2019 nual concentration of 10 ug/m3.
HEAL, GCHA, Shishuka and IPA LEAD: Protecting Bengaluru’s Children: time to act for clean air around schools 13Table 3 - Monthly average distribution of PM 2.5 in Bengaluru city from June 2019 - July 2020
Month Average PM 2.5 (ug/m3)
2019
June 23
July 20
August 29
September 32
October 38
November 55
December 63
2020 Above the Indian standard
of daily PM2.5 concentrations
January 64
(>60ug/m3)
February 49
March 51 Above the US EPA standard
for daily PM2.5 concentrations
April 36 (>35ug/m3)
May 30
June 34 Above the WHO recommendation
for daily PM2.5 concentrations
July 28 (>25ug/m3)
Annual PM2.5 concentration in Bengaluru: - 40.7 mcg/m3
Why is this happening? Why is this important to note?
The reason for this seasonal change in air quality pa- This study indicates that children were exposed to
rameters could be explained by a change in climatic higher levels of particulate matter during the months
conditions. Atmospheric and weather conditions im- of November 2019 to April 2020 in Bengaluru, par-
pact the levels of air pollution. Colder and denser air ticularly in December and January. Children with un-
settles lower and moves slower than warm air. These derlying chronic respiratory conditions, allergies and
seasonal variations, with poor air quality during win- asthma are at a high risk of developing symptoms and
ter months, have been demonstrated in the northern flare-ups during this period. The impact of the cold
cities such as Delhi. They have always been attributed weather on chronic respiratory conditions is further
to the crop burning seen exclusively during this time worsened by the poor air quality that was noted dur-
in the neighbouring states of Haryana and Punjab. Al- ing this time of the year.
though Bengaluru has been relatively protected from
However, when judged on the health based recom-
the effects of crop burning, we demonstrate a sim-
mendations of WHO, air quality is poor all year round
ilar trend of worsening air quality during the winter
in Bengaluru city.
months of 2019/20 in the city.
14 HEAL, GCHA, Shishuka and IPA LEAD: Protecting Bengaluru’s Children: time to act for clean air around schools7.2. Air Quality during school hours
During school going hours, nearly 83% (15/18) areas ter generation or is an artefact in the data needs to
had PM2.5 values above the WHO recommendations be further studied. Mathikere was one area found to
for daily concentrations and 50% (9/18) areas demon- have values close to the maximum limit recommend-
strating values above the EPA daily standard. Areas ed by Indian National standards.
with poor PM2.5 values, as per EPA standards, were MS
All areas were above the annual WHO recommenda-
Ramaiah City Layout, Gottigere, HSR Layout, JC Road,
tion and US EPA standard for PM2.5, all year round.
Koramangala, Bellandur, Brigade road, Mathikere and
Jayanagar. Jayanagar was seen to have disproportion- 112 schools (primary and secondary) with 39,780 stu-
ately abnormal values of PM2.5 during school hours. dents are present in the areas which had a PM2.5 value
Whether this is attributed solely to particulate mat- above the US EPA daily standard of 35 ug/m3.
Table 4 - Ranking of areas on Average PM2.5 values during school hours
Location Average values of PM2.5 (ug/m3)
Vartur 18
Springfield 20
Doddanekundi 24
Kalyannagar 29
Corporation Circle 29
Sarjapur 29
Srirampura 31
Indiranagar 31
Ulsoor 31
MS Ramaiah City 35
Gottigere (IIM-B) 36
Above the Indian standard
HSR Layout 36 of daily PM2.5 concentrations
(>60ug/m3)
JC Road 37
Koramangala 38 Above the US EPA standard
for daily PM2.5 concentrations
Bellandur 38
(>35ug/m3)
Brigade Road 40
Mathikere 58 Above the WHO recommendation
for daily PM2.5 concentrations
Jayanagar 167
(>25ug/m3)
“Air pollution is a poison that makes children susceptible to severe and
uncontrollable asthma. It is a precursor of lifelong impairment of lung health and
reduction of life span. Schools must be strong advocates against this menace in all
possible ways.“
Dr Jagadish Chinnappa, President, Indian Academy of Pediatrics (IAP) National Respiratory
chapter.
HEAL, GCHA, Shishuka and IPA LEAD: Protecting Bengaluru’s Children: time to act for clean air around schools 157.3. Air Quality during school arrival and departure time
We studied the air quality parameters in the 18 areas It is speculated that this is related to the heavy ve-
in Bengaluru during school arrival time (morning hours) hicular traffic which passes through the city during
and school departure time (evening hours). In Bengalu- the night up to the early morning hours. Heavy vehic-
ru city, school arrival time is commonly between 7AM ular traffic including trucks and transport vehicles are
to 9AM and school departure between 3pm to 5pm. known to contribute significantly to particulate matter
Hence we studied air quality one hour prior and one in the atmosphere which persists in the air due to the
hour after between 6AM to 10AM and 2PM to 6PM. colder weather in the morning hours.
During school arrival time, the overall average values During school departure time, 94.4% (17/18) studied ar-
of PM2.5, for all 18 areas were relatively favourable be- eas had PM2.5 concentrations above the WHO recom-
tween 7am to 9am as measured against the Indian dai- mended daily values between 3pm to 5pm.
ly standard. Only 1 area, Jayanagar showed PM2.5 values
83.3% (15/18) areas showed values of PM2.5 above the
above Indian National standards between 6am to 9am.
EPA values between 3pm to 5pm.
However, 77% of the areas, were above the WHO rec-
Two areas, Jayanagar and Mathikere showed PM2.5
ommended daily values.
values above Indian National standards between 3pm
Between 6am to 7am, 44% of areas crossed the per- to 5pm.
missible EPA values. Similar findings were seen when
This means that the air quality during school departure
tracking the levels of PM10 in these areas between 6am
was found to be unfavourable for sensitive groups in
to 7am. Between 7am to 9am, only 2 areas, Mathikere
all these areas. We further noted that even at 2pm,
and Jayanagar had PM2.5 values above the US EPA daily
the air quality remained relatively poor, negating the
standard.
possibility of reducing exposure by advancing school
departure.
Table 5 - PM2.5 values during School arrival (6AM to 10 AM) and School departure time (2PM to 6PM)
School Arrival Time School Departure Time
Location 6AM 7AM 8AM 9AM 10AM 2PM 3PM 4PM 5PM 6PM
Vartur 20 17 16 15 14 23 22 21 20 19
Springfield 21 20 18 28 17 26 26 25 23 24
Doddanekundi 24 22 21 19 19 34 32 31 32 32
Kalyannagar 30 27 26 24 24 36 37 36 36 36
Corporation circle 35 31 28 25 24 35 37 38 37 37
Sarjapur 30 27 25 24 23 33 36 36 36 36
Srirampura 32 30 38 37 35 42 37 37 36 36
Indiranagar 33 30 27 25 25 38 42 40 37 36
Ulsoor 30 28 26 25 25 38 41 41 40 41
MS Ramaiah City Layout 34 32 30 31 31 41 43 43 43 44
Gottigere (IIM-B) 40 36 33 32 30 39 41 41 40 41
HSR Layout 35 36 30 29 29 49 49 46 44 45
JC Road 45 40 37 36 34 40 42 42 41 40
Koramangala 38 34 31 29 31 41 42 42 40 40
Bellandur 36 32 31 29 28 57 54 50 49 49
Brigade Road 41 38 34 31 30 54 55 54 51 51
Mathikere 48 46 47 44 40 95 70 59 39 34
Jayanagar 108 135 122 112 97 238 110 245 178 188
Above the Indian standard Above the US EPA standard Above the WHO recommendation
of daily PM2.5 concentrations for daily PM2.5 concentrations for daily PM2.5 concentrations
(>60ug/m3) (>35ug/m3) (>25ug/m3)
16 HEAL, GCHA, Shishuka and IPA LEAD: Protecting Bengaluru’s Children: time to act for clean air around schoolsIs the poor air quality contributed by school going vehicular traffic alone?
Considering the high levels of PM2.5 in many areas dur- To obtain an answer to this question, we compared
ing school arrival, and more so during school depar- the air quality parameters during weekdays (Mon-
ture time, the question on whether this is primarily day to Friday) and the weekend (Saturday & Sunday)
contributed by school going traffic does arise. If in- during the same hours of school arrival (7am to 9am),
deed the high levels of PM2.5 during school departure school departure (3pm to 5pm) and school-going
are due to the vehicles going to and from schools, hours (9am to 4pm).
then we would be able to target strategies specifical-
ly towards this group.
Table 6 - Comparison of Average PM2.5 on weekdays and weekends across all areas studied
6AM to 10AM 2PM to 6PM School hours
(School Arrival) (School Departure) (8AM to 4PM)
Weekday (Monday to Friday) 32 45 38
Weekend (Saturday & Sunday) 33 45 39
Average PM2.5 across all 18 areas
32 45 38
studied in Bangaluru
Above the Indian standard Above the US EPA standard Above the WHO recommendation
of daily PM2.5 concentrations for daily PM2.5 concentrations for daily PM2.5 concentrations
(>60ug/m3) (>35ug/m3) (>25ug/m3)
We noted there was no significant change between to the weekday during these hours. This helps us
the weekend and weekday in the values of PM2.5 dur- speculate that school going vehicular traffic did not
ing school arrival, school departure and school going contribute solely to the poor air quality which was
hours. noted during these hours on the weekdays. Further
research in this area is needed.
On the other hand, the values were found to be
slightly higher on the weekend when compared
“This study helps us to understand the air quality during school opening and
closing hours. Schools now have some data which can be useful in planning the
school timings.
Simple measures like restriction of heavy traffic in school zones especially during
school hours will help reduce students’ exposure to PM2.5. We educators must
also open dialogues with our parents and children on the health effects of air
pollution. ”
Dr Tristha Ramamurthy, Doctor of Education EdD (King’s College London), Founder,
Ekya Schools, Bengaluru.
HEAL, GCHA, Shishuka and IPA LEAD: Protecting Bengaluru’s Children: time to act for clean air around schools 177.4 Effects of reducing vehicular traffic in Bengaluru as part of lockdown
There is an increasing need to improve the air qual- tween February 8th to March 24th 2020 was taken as
ity around schools in Bangalore as demonstrated by the pre-lockdown period, 45 days between March
the high and unhealthy levels of PM2.5 in the areas 25th to May 8th 2020 as lockdown period and 45 days
we have studied. However, the question always re- post between May 9th to June 23rd 2020 as post-lock-
mains on how much of an impact would it make on down period. Data was divided into these 3 periods
existing air quality, if vehicular traffic in these areas and the average values recorded for PM2.5 and PM10
were reduced. An answer to this question would help were analysed and compared.
Governmental organisations to implement appro-
We demonstrate in our study a significant drop in PM2.5
priate strategies around schools. We further studied
in all areas from the pre-lockdown to lockdown peri-
the effect of reducing vehicular traffic on air quality
od. Similarly a significant drop in PM2.5 was also seen
in Bangalore.
from the pre-lockdown to post-lockdown periods.
We fortunately had the opportunity of a reduction The % drop in PM2.5 from pre-lockdown to lockdown
in vehicular traffic and other contributing factors to period ranged from 11% to 34% in different areas. The
air pollution during the Nationwide lockdown which % drop in PM2.5 from pre-lockdown to post-lockdown
happened in the city for the COVID19 pandemic. This ranged form 36% to 56%. We thus demonstrate that
posed an opportunity for us to study the changes in significant changes in Air quality with drop in PM2.5
air quality during the lockdown period when the Gov- can be achieved by reduction in vehicular traffics,
ernment had imposed restrictions on vehicular move- construction work and other contributing sources of
ments across the city. This could be equated to the air pollution.
changes that we could probably find on decreasing
vehicular traffic in the city around schools.
We divided the time periods into 3 periods - Pre-lock-
down, Lockdown and Post-lockdown. 45 days be-
Table 7 - Change in PM2.5 concentrations from pre-lockdown to lockdown
70
Indian
National
Standard
64
52.5 57 57
53 54 53
PM2.5 values
51 52
49 50 49 50
47
43
42
EPA standard 35
33
WHO
25 24 25 25 24 24 28 28
recommendation
17.5 21 20 21 23 22
18
16
8
Do
Co
Sa
Va
M
Sr
Ka
JC
M
Be
In
Go
Ko
HS
Ul
Br
at
ira
di
S
rja
rp
r
so
dd
ig
l
lla
Ro
ra
R
tt
th
ya
Ra
hi
ra
ad
or
m
or
pu
ig
m
nd
an
ur
ad
n
ke
na
m
pu
at
er
an
e
ra
Na
ek
ur
re
ai
ga
io
e
rd
ra
ga
un
ah
ga
n
r
l
Ci
a
di
r
Ci
rc
ty
le
Pre Lockdown Lockdown
Above the Indian standard Above the US EPA standard Above the WHO recommendation
of daily PM2.5 concentrations for daily PM2.5 concentrations for daily PM2.5 concentrations
(>60ug/m3) (>35ug/m3) (>25ug/m3)
18 HEAL, GCHA, Shishuka and IPA LEAD: Protecting Bengaluru’s Children: time to act for clean air around schoolsLimitations of this analysis and future research needed
This report is only an initial investigation into air quality around Bengaluru schools.
Limitations include:
The lockdown It is also not The monitors
from March - possible to make were placed at a
May 2020 was any calculation distance ranging
unprecedented and led to of the health effects of poor from 250m through 3km
a reduction in air pollution air quality in children in from different schools in
unlike in other years. It is Bengaluru, to determine the the area. Some studies
therefore not clear if the burden on the healthcare have considered a range
high pollution observed in system in addition to of 50-100m. Hence more
winter 2019/20 continued individual suffering. accurate values can be
well into the spring, or if it obtained if monitors are
is in general lower before placed on school premises.
monsoon.
Which future research is needed
More research and scientific work is needed in the field of air pollution and its impact on child health in
India. The future holds promise in improving the air quality for our children as more data is generated and
strategies to reduce air pollution are implemented accordingly. Key areas for additional research:
PM
Air quality The correlation The lung capacity The development
measurements within between the of children studying of biomarkers
schools (both indoor prevalence of asthma in schools in areas for the impact of
and outdoor) need to and allergic rhinitis where air quality is air pollution in
be measured. in areas of poor air poor needs to be children would help
quality needs to be evaluated. enable physicians
studied. to perform simple
tests to evaluate the
exposure to PM2.5
and ozone in children
with asthma.
HEAL, GCHA, Shishuka and IPA LEAD: Protecting Bengaluru’s Children: time to act for clean air around schools 198 Recommendations
As a city of high popularity with major growth and as er, pollution levels in the city are harmful to health,
India’s IT capital, Bengaluru holds great potential to and a threat especially to children in the city.
pave the way for green, healthy cities in what is now
Here is what needs to happen to prevent further ill-
the world’s most polluted country. Currently, howev-
health for current and future generations:
FOR POLICY-MAKERS
• Prioritise achieving clean air in the school environment and other places where children spend
time.
• Ensure compliance with Indian outdoor air quality standards, with the aim to achieve WHO air
quality recommendations by 2030.
• Increase the number of air quality monitors across the city.
• Invest in clean and green infrastructure changes, e.g. electric vehicles and cycling lanes.
• Allow new schools to be established only at a distance from the main roads and in areas with
good air quality.
• Establish an alert system for areas with poor air quality, and consider pollution reduction
measures for these areas such as:
> Restricting heavy vehicular traffic around school areas.
> Closing school roads to regular traffic.
> Restricting factory and industrial activity around schools.
> If construction work needs to be done near or at school, it should be scheduled during
non-school hours.
20 HEAL, GCHA, Shishuka and IPA LEAD: Protecting Bengaluru’s Children: time to act for clean air around schoolsFOR SCHOOL LEVEL LEADERSHIP & PARENT ORGANISATIONS
• Increase awareness on air quality and its impact on health among parents, children, teachers,
and the general public.
• Encourage car-pooling, use of school buses, cycles and public transport to travel to school.
• Consider shifting school arrival time and departure time based on the changes in air quality in
the area.
• Children must avoid travelling to school through busy roads and business hubs with poor air
quality.
• Invest in improvement of the quality of ventilation in classrooms.
• Greening of the school and its surrounding must be encouraged.
• Parent organisations could create local clean air groups, and work together with existing
initiatives such as clean air community groups, or the “bicycle mayor” (who leads an initiative
which aims to increase safe cycling in Bengaluru).
• During period of poor air quality, additional measures must be taken to reduce exposure to air
pollutants such as:
> Wearing a mask during travel to school.
> Closing the school road.
> Closing windows of classrooms during high pollution hours.
HEAL, GCHA, Shishuka and IPA LEAD: Protecting Bengaluru’s Children: time to act for clean air around schools 21FOR HEALTH PROFESSIONALS
Many health professional organizations throughout the world are focusing increasingly on the ad-
verse health impacts of air pollution on children. While further research is needed in a number of
areas, the scientific evidence is already robust and sufficient for taking clear, concrete steps now to
reduce the exposure of children to air pollution.
Doctors and other health professionals should:
• Share their expertise at an organizational and individual capacity on the health impact of air
pollution on children.
• Advise parents on the effects of air pollution in the school and home environment and the
measures that can be taken to prevent exposure.
• For children with existing respiratory problems, physicians must take a detailed environmental
history with regard to the different sources of pollution exposure.
• Health professionals should engage school and parent organisations and community groups to
advocate for clean air.
• Consult and advise city authorities about projects impacting the city’s air quality and
environmental health.
22 HEAL, GCHA, Shishuka and IPA LEAD: Protecting Bengaluru’s Children: time to act for clean air around schools9 Annex
10.1. Number of Schools and Students in the areas studied
As per the District Information System for Education vate unaided or public schools under the department
(DISE) data of 2011-12, there are 4818 schools in Ben- of education.
galuru city, with 1946 in Bengaluru North and 2872 in
This report considered the following number of
Bengaluru South districts. The schools are categorised
schools and students:
as primary, upper primary, secondary and higher sec-
ondary schools. They include schools which are pri-
Table 8 - Number of Schools and Students in areas studied
Area Number of Schools Total number of students
Vartur 18 5,267
Springfield 17 4,567
Doddanekundi 12 3,201
Kalyannagar 16 4,203
Corporation Circle 8 1,890
Sarjapur 10 2,546
Srirampura 29 6,759
Indiranagar 29 6,269
Ulsoor 19 3,434
MS Ramaiah City 17 5,665
Gottigere (IIM-B) 8 3,240
HSR Layout 11 4,564
JC Road 10 3,546
Koramangala 10 4,560
Bellandur 9 3,450
Brigade Road 12 6,543
Mathikere 17 3,709
Jayanagar 18 4,503
TOTAL 270 77,916
10.2 Population of children in Bengaluru city as per 2011/12 census
Table 9 - Population of children (0-19 years) in Bengaluru city as per 2011-12 census
Male Female Total
0-4 years 340,232 321,653 661,885
5-9 years 327,003 308,185 635,188
10-14 years 328,467 309,698 638,165
15-19 years 346,522 328,273 674,795
TOTAL 1,342,224 1,267,809 2,610,003
HEAL, GCHA, Shishuka and IPA LEAD: Protecting Bengaluru’s Children: time to act for clean air around schools 2310.3. Government air monitoring in Bengaluru
Currently, there are only 10 online monitoring stations In the official monitoring bulletins the number of
operating in real-time in the city, providing continu- monitoring sites is given as 21, as both the real-time
ous data. Five of these stations started operating in monitors as well as the sites with occasional monitor-
January 2018 and are located in Hebbal, Jayanagar, ing are counted. However, only 10 of these actually
Kavika, NIMHANS, and Silk Board. record continuous data.
In addition, the state pollution control board has 14 It was indicated by researchers of the Urbanemissions
manual monitoring stations which measure PM10 or that “at least 41 continuous air monitoring stations
the RSPM (Respirable Suspended Particulate Matter) [were required] to statistically, spatially, and tempo-
on any two days in a week. There is also a mobile van rally, represent the mix of sources and range of pol-
in place for any emergency measurements that may lution in the city”. This suggests there are not enough
be needed. monitors in place in Bengaluru to make a robust as-
sessment of air pollution.
Information on the results of the 10 online real-time
monitoring stations, plus the ones that collect data Furthermore, the installed stations do not measure air
from time to time, is provided through monthly sum- quality at people’s breathing height and therefore do
mary reports. These reports provide information on not provide information about pollution hotspots and
concentrations of PM10, PM2.5, other pollutants, and individual exposure levels.
generate an air quality index. Possible health impacts
are described for each scale.
10.4. The Health Air Coalition’s network for air monitoring
The Healthy Air Coalition aims to provide accessi- Monitoring devices in use by the coalition
ble, high quality air pollution data to the public, pol-
The network of 28 monitoring stations is a fixed sys-
icy-makers and health experts, to assess the health
tem with monitors provided by Clarity Air Monitor-
burden of air pollution in the city and use that infor-
ing Solutions. These fixed sensors provide real-time
mation to drive specific measures for improving Ben-
measurements of two key air pollutants: particulate
galuru’s air.
matter (PM2.5) and Nitrogen dioxide (NO2), as well
Thirty stationary monitoring devices were installed as Temperature (T) and Relative Humidity (RH), data
across Bengaluru in March/April 2019, with the first 15 which are necessary to provide properly calibrated
monitors installed and generating data available to data. Real time data collected by each sensor is made
the public by April 5, 2019. The Coalition is commit- available to the public via openmap.clarity.io and
ted to maintaining these monitors for at least a year, www.healthyaircoalition.org
so that by the end of the monitoring period health
The system uses ‘smart calibration’ to compare the re-
experts can carry out a robust comparative analysis
sults of the devices with local environmental parame-
of annual average concentrations against WHO rec-
ters and government-operated regulatory monitoring
ommendations and Indian standards, in addition to
devices, as well as machine learning algorithms to im-
assessing daily concentrations.
prove aggregate data estimations over different areas
The location of the monitors was chosen in collabora- of the city.
tion with health members of the coalition, especially
health experts at St. John’s Research Institute. For the
list of monitoring sites, see below.
24 HEAL, GCHA, Shishuka and IPA LEAD: Protecting Bengaluru’s Children: time to act for clean air around schools10.5. Location of monitors across Bengaluru
LINK TO ACCESSING DATA: https://openmap.clarity.io/?viewport=12.946895,77.6152781,11.5
No Location RFID
1 Brigade Road ANFLVMRB
2 Mathikere AKKMZZTM
3 MS Ramaiah City ADYYP61M
4 Koramangala ADRMGGNB
5 Bannerghatta Road AGSDMHMM
6 BBMP Head Office, Corporation Circle AN86LJRX
7 Indiranagar AVVXRF39
8 Doddakannelli, Sarjapur A61RWNQK
9 Ulsoor A8VYQKP6
10 Doddanekundi A9GDZF8D
11 Springfield Society AT627RHW
12 Banashankari AX4JNS3T
13 Jayachamarajendra Road AD6LV2QQ
14 NR COLONY - Basavanagudi AP0MS6MH
15 Srirampura l A86YTG4T
16 Bethany’s High School, Koramangala A58C681B
17 Jayanagar AHTXGMB9
18 Electronic City AYBF6SX1
19 Kalyan Nagar AZRY538Z
20 Varthur AVFB4XYG
21 Bannerghatta Road, Gottigere, IIM-B AZDWPFBW
22 White Field ATQDTDDB
24 Bellandur AFWB2LRV
25 Jayaprakash Narayan Nagara ABPXXL9K
26 BTM Layout AKSWN1KT
27 HSR Layout AC3PFTGK
HEAL, GCHA, Shishuka and IPA LEAD: Protecting Bengaluru’s Children: time to act for clean air around schools 25You can also read