Further improvement of wet process treatments in GEOS-Chem v12.6.0: impact on global distributions of aerosols and aerosol precursors - GMD
←
→
Page content transcription
If your browser does not render page correctly, please read the page content below
Geosci. Model Dev., 13, 2879–2903, 2020
https://doi.org/10.5194/gmd-13-2879-2020
© Author(s) 2020. This work is distributed under
the Creative Commons Attribution 4.0 License.

Further improvement of wet process treatments in GEOS-Chem
v12.6.0: impact on global distributions of aerosols
and aerosol precursors
Gan Luo1 , Fangqun Yu1 , and Jonathan M. Moch2
1 Atmospheric   Sciences Research Center, University at Albany, Albany, NY, USA
2 Department   of Earth and Planetary Sciences, Harvard University, Cambridge, MA, USA

Correspondence: Gan Luo (gluo@albany.edu)

Received: 12 January 2020 – Discussion started: 21 January 2020
Revised: 6 May 2020 – Accepted: 29 May 2020 – Published: 30 June 2020

Abstract. Wet processes, including aqueous-phase chem-           and ammonium in the Northern Hemisphere during winter-
istry, wet scavenging, and wet surface uptake during dry de-     time. The NMBs of these species are reduced from 163 %,
position, are important for global modeling of aerosols and      78 %, and 217 % to −13 %, −1 %, and 10 %, respectively.
aerosol precursors. In this study, we improve the treatments     The investigation of impacts of updated wet process treat-
of these wet processes in the Goddard Earth Observing Sys-       ments on surface mass concentrations indicated that the up-
tem with chemistry (GEOS-Chem) v12.6.0, including pH             dated wet processes have strong impacts on the global means
calculations for cloud, rain, and wet surfaces, the fraction     of nitric acid, sulfate, nitrate, and ammonium and relative
of cloud available for aqueous-phase chemistry, rainout ef-      small impacts on the global means of sulfur dioxide, dust,
ficiencies for various types of clouds, empirical washout by     sea salt, black carbon, and organic carbon.
rain and snow, and wet surface uptake during dry deposi-
tion. We compare simulated surface mass concentrations of
aerosols and aerosol precursors with surface monitoring net-
works over the United States, European, Asian, and Arctic        1   Introduction
regions, and show that model results with updated wet pro-
cesses agree better with measurements for most species. With     Aqueous-phase chemistry, wet scavenging, and wet surface
the implementation of these updates, normalized mean bi-         uptake during dry deposition are the three major atmospheric
ases (NMBs) of surface nitric acid, nitrate, and ammonium        wet processes for aerosols and aerosol precursors. Aqueous-
are reduced from 78 %, 126 %, and 45 % to 0.9 %, 15 %,           phase chemistry plays a role as reaction chamber which effi-
and 4.1 % over the US sites, from 107 %, 127 %, and 90 %         ciently converts aerosol precursors to aerosols (Ervens et al.,
to − 0.7 %, 4.2 %, and 16 % over European sites, and from        2011; Walcek and Taylor, 1986). Wet scavenging, a process
121 %, 269 %, and 167 % to −21 %, 37 %, and 86 % over            by which chemicals accumulate in droplets and then are re-
Asian remote region sites. Comparison with surface mea-          moved by precipitation, is the predominant removal pathway
sured SO2 , sulfate, and black carbon at four Arctic sites in-   of aerosols and aerosol precursors (Textor et al., 2006). Dry
dicated that those species simulated with the updated wet        deposition, where chemicals settle out of the atmosphere in
processes match well with observations except for a large        the absence of precipitation, is greatly enhanced due to the
underestimate of black carbon at one of the sites. We also       absorption of water-soluble gases at wet surfaces associated
compare our model simulation with aircraft measurement of        with dew, fog, and rain (Garland and Branson, 1977; We-
nitric acid and aerosols during the Atmospheric Tomography       sely, 1989). These wet processes significantly impact global
Mission (ATom)-1 and ATom-2 periods and found a signif-          mass load and redistribute aerosols and aerosol precursors.
icant improvement of modeling skill of nitric acid, sulfate,     Aerosol mass load and its global distributions are important
                                                                 for studies of aerosol optical properties (Kinne et al., 2006),

Published by Copernicus Publications on behalf of the European Geosciences Union.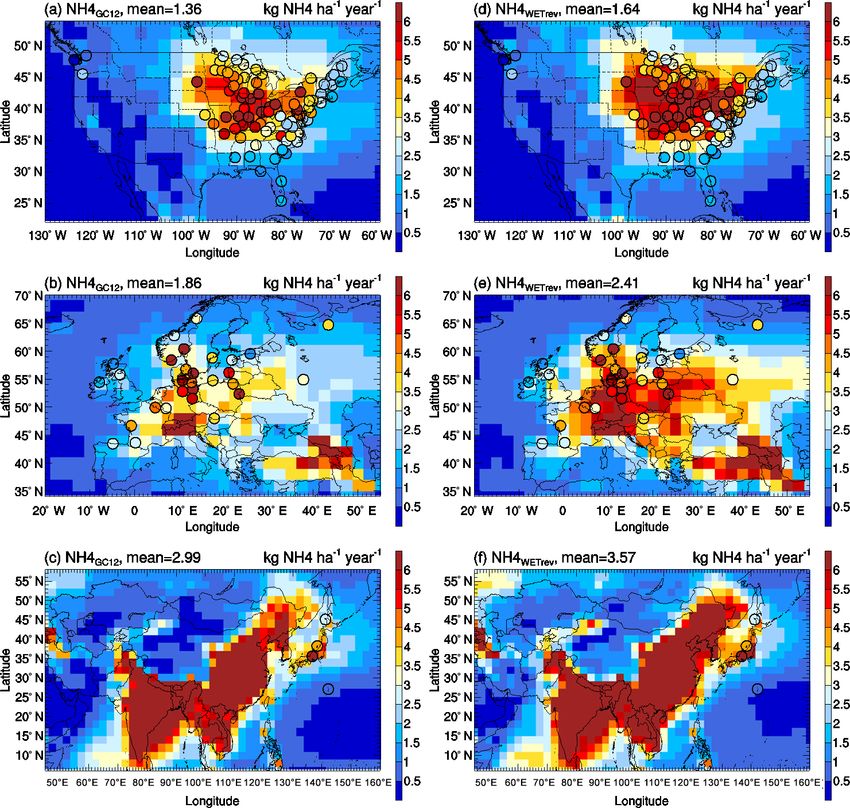
2880                                           G. Luo et al.: Improved wet processes in GEOS-Chem and global validations

aerosol direct radiative forcing (Myhre et al., 2013; Penner        concentrations or aerosols and aerosol precursors are dis-
et al., 1994), and the health effects of particulate matter (Shi-   cussed in Sect. 3.4. A summary of our results is given in
raiwa et al., 2017; Hopke et al., 2006). A better represen-         Sect. 4.
tation of wet processes in global modeling of aerosols and
aerosol precursors can therefore enhance our ability to accu-
rately simulate these different aerosol impacts.                    2   Updates of wet process treatments in GEOS-Chem
   The Goddard Earth Observing System with chemistry                    associated with aerosol precursor and aerosol
(GEOS-Chem) is a widely used community model which is                   modeling
continuously being improved (Holmes et al., 2019; Keller
                                                                    In the publicly released GEOS-Chem version 12.6.0, GC12
et al., 2014; Martin et al., 2003; Bey et al., 2001). Luo et
                                                                    thereafter, in-cloud aqueous-phase chemistry was developed
al. (2019), L2019 hereafter, updated the GEOS-Chem wet
                                                                    by Chin et al. (2000) for SO2 . The wet scavenging scheme,
scavenging scheme by using the Modern-Era Retrospective
                                                                    including rainout due to formation of precipitation from
analysis for Research and Applications version 2 (MERRA-
                                                                    clouds and washout due to falling precipitation from upper
2) spatially and temporally varying cloud and rainwater to
                                                                    layers, was developed by Jacob et al. (2000) and Liu et
replace the assumption of fixed in-cloud condensation water
                                                                    al. (2001) for aerosols and by Amos et al. (2012) for gases.
(ICCW) in the GEOS-Chem rainout parameterization and by
                                                                    Scavenging of aerosol by snow and cold–mixed precipitation
using new empirical rates for nitric acid and water-soluble
                                                                    was updated by Q. Wang et al. (2011, 2014). Wet surface
aerosols in washout. These changes together reduced the nor-
                                                                    uptake during dry deposition is represented with constant
malized mean biases (NMBs) of simulated nitric acid, nitrate,
                                                                    values of effective Henry’s law coefficient for surface resis-
and ammonium mass concentrations at the United States’
                                                                    tance calculations (http://wiki.seas.harvard.edu/geos-chem/
surface monitoring networks from 145 %, 168 %, and 81 %
                                                                    index.php/Physical_properties_of_GEOS-Chem_species#
to 24 %, 25 %, and 13 %, respectively. However, the impacts
                                                                    Definition_of_Henry.27s_law_constants, last access: Octo-
of the updated wet scavenging scheme on simulations over
                                                                    ber 2019).
other regions (Europe, Asia, and remote areas) and the free
                                                                       L2019 showed that the assumption of in-cloud condensa-
troposphere were not investigated. Moreover, L2019 only
                                                                    tion water with a fixed value (1 g m−3 ) in the rainout param-
investigated the changes of nitric acid, nitrate, and ammo-
                                                                    eterization in GC12 is one of the major reasons causing an
nium. The impact of the updated wet scavenging scheme on
                                                                    overestimate in nitrate and ammonium mass concentrations
other aerosols such as sulfate, sea salt, dust, and carbona-
                                                                    compared to surface monitoring networks over the US. After
ceous aerosols was not investigated in that work. Due to the
                                                                    replacing the fixed value of in-cloud condensation water with
large impact of updated wet scavenging on model simula-
                                                                    MERRA-2 cloud and rainwater, we get an updated equation
tions, a comprehensive validation of simulated aerosols and
                                                                    for rainout loss fraction (Luo et al., 2019):
aerosol precursors with ground-based monitoring networks
for surface mass concentrations and aircraft measurements                      Pr
for vertical profiles is needed.                                    F=                 1 − e−k·1t =
                                                                          k · ICCW
   In this study, we further update the treatments of wet pro-                    fc · Pr
cesses (aqueous chemistry, wet scavenging, and wet surface                                           1 − e−k·1t ,               (1)
                                                                       k (LCW + ICW + Pr · 1t)
uptake during dry deposition) in GEOS-Chem and evaluate
comprehensively simulated major inorganic aerosol precur-           where F is the fraction of a water-soluble tracer in the
sors (sulfur dioxide, nitric acid, and ammonia) and aerosols        grid-box scavenged by rainout, and 1t (s) is the model
(sulfate, nitrate, ammonium, black carbon, and organic car-         integration time step. k is the first-order rainout loss rate
bon) by comparison with a large set of in situ observations.        which represents the conversion of cloud water to precip-
The updates to the wet processes are detailed in Sect. 2.           itation water. ICCW (g m−3 ) is in-cloud condensation wa-
Comparisons of simulations with measurements from surface           ter. Pr (g m−3 s−1 ) is the rate of new precipitation forma-
monitoring networks including the United States Environ-            tion. fc , LCW (g m−3 ), and ICW (g m−3 ) are the grid-box
mental Protection Agency (US EPA), the Interagency Mon-             mean cloud fraction, liquid-phase cloud water content, and
itoring of Protected Visual Environments (IMPROVE), the             ice-phase cloud water content, respectively.
Chemical Speciation Network (CSN), the Clean Air Status                L2019 also showed that the difference between observa-
and Trends Network (CASTNET), the Ammonia Monitoring                tions and simulations can be further reduced through (1) the
Network (AMoN), the National Trends Network (NTN), the              update of empirical washout coefficients by rain for water-
European Monitoring and Evaluation Programme (EMEP),                soluble aerosol with the value which was calculated by the
and the Acid Deposition Monitoring Network in East Asia             parameterization of Laakso et al. (2003) for a 500 nm parti-
(EANET) are given in Sect. 3.1. Validations of aerosols and         cle diameter, and (2) the new estimated washout coefficients
aerosol precursors for the Arctic and the Atmospheric To-           for nitric acid by referring to field measurements for particles
mography (ATom) mission are presented in Sect. 3.2 and 3.3.         with a 10 nm diameter (Laakso et al., 2003) and the theoret-
The impact of the updated wet processes on global surface           ical dependence of scavenging coefficients on particle sizes

Geosci. Model Dev., 13, 2879–2903, 2020                                             https://doi.org/10.5194/gmd-13-2879-2020
G. Luo et al.: Improved wet processes in GEOS-Chem and global validations 2881
for particles < 10 nm (Henzing et al., 2006). L2019 only fo- hydrogen ion concentration in cloud/rain droplets and at wet
cused on warm cloud wet scavenging and did not systemat- surfaces, which is related to pH as
ically consider the impact of wet process treatments on the
simulated aerosols and aerosol precursors. Here, we show [H + ] = 10−pH . (6)
that a number of treatments in GC12 and L2019 can be fur-
GC12 calculates cloud water pH iteratively by using the con-
ther updated (as detailed below) to improve the performance
centrations of sulfate, total ammonium (ammonium plus am-
of GEOS-Chem in simulating spatial and temporal variations
monia), total nitrate (nitrate plus nitric acid), SO2 , and CO2
of major aerosols and aerosol precursors on a global scale.
based on their effective Henry’s law coefficients and cloud
2.1 pH for cloud, rain, and wet surface liquid water content in corresponding grid box (Alexander et
al., 2012). This iterative calculation is updated to use New-
Water pH is important for dissolution and subsequent ton’s method in order to arrive at a consistent result (Moch
aqueous-phase reactions of water-soluble gases (Turnock et et al., 2020). To implement Newton’s method, the equilib-
al., 2019; Ervens, 2015; Pandis and Seinfeld, 1989). Based rium expressions for the concentrations of each soluble semi-
on Henry’s law, dissolution of water-soluble gases can be cal- volatile ion (SSVI) in terms of H + and the derivatives for
culated as these equilibrium expressions are each solved explicitly so
that Newton’s method equation is in the form of
1
fw = 1 − , (2)
SSVI Hn+ + [SNVI]
1+H∗ ·R ·T · LW +
Hn+1 = Hn + +
(7)
,
d
SSVI Hn+
where fw is the dissolution fraction for water-soluble gases, dH +
H ∗ (mol L−1 atm−1 ) is the effective Henry’s law constant, R where SNVI is the concentration of soluble nonvolatile ions.
(0.08205 L atm K−1 mol−1 ) is the gas constant, T (K) is the For Eq. (7), the concentrations of each ion are multiplied by
temperature, and LW (m3 m−3 ) is the liquid water content. the ion charge (e.g., the terms for SO2− 3 concentrations are
H ∗ represents the impact of temperature, water acidity, multiplied by −2).
and aqueous-phase equilibrium on solubility of water-soluble In tests with this new calculation, the solution always con-
species (Seinfeld and Pandis, 2016). For SO2 , H2 O2 , and verged to an answer in less than 20 iterations, but if a maxi-
NH3 , which are important for aerosol precursor and aerosol mum of 50 iterations is reached, we set it so that the last two
simulation, H ∗ can be calculated as (Seinfeld and Pandis, solutions are averaged together. We here considered the so-
2016) lution to converge if the difference between Hn+ and Hn+1 +
+
was less than 0.01. By default, the initial guess for H is set
∗ =H K1 K1 ·K2
HSO SO2 1 + [H + ]
+ + 2 , to 4.5, but we tested initial guesses ranging from a pH of 2
2 [H ]
10.55 298.15
T −1
to 13 and found no change in the values at which the answer
HSO2 = 1.22e ,
(3) converged.
6.75 298.15
T −1
K1 = 1.3 × 10⁻² e , To represent the removal of aerosols due to rainout, GC12
assumes 30 % of sulfate, nitrate, and ammonium are removed
298.15
−8 5.05 T −1
K2 = 6.31 × 10 e
away from cloud water before cloud water pH calculation.
HH∗2 O2 = HHO2 1 + [HK+3 ] ,
To take into account the variations in the amount of these
298.15
species rained out, we use the real-time rainout fractions for
4 24.82 T −1 (4) corresponding species which are calculated during the treat-
HH2 O2 = 8.3 × 10 e
,
12.52 298.15
T −1
ment of wet scavenging to replace this constant value (i.e.,
K3 = 2.2 × 10⁻¹² e
30 %). Additionally, in GC12, sulfate is assumed to be the
[H + ]
∗
HNH 3
= HNH3 1 + K5K 4
,
only SNVI in cloud water, while ammonium and nitrate are
treated as volatile species similar to ammonia and nitric acid:
298.15
14.1 T −1
HNH3 = 59.8e ,
(5)
h i
[SNVI] = 2 SO2−
−22.5 298.15 T −1
. (8)
K4 = 1.0 × 10⁻¹⁴ e
,
4
298.15
−5 −14.5 T −1
K5 = 1.7 × 10 e
Previous studies found that observed ammonium–sulfate
aerosol molar ratio is lower than 2 over the US (Silvern et al.,
where HSO2 , HH2 O2 , and HNH3 are Henry’s law constants 2017; Hidy et al., 2014). Guo et al. (2018) found ammonium–
(M atm−1 ) for SO2 , H2 O2 , and NH3 , respectively. K1 (M), sulfate aerosol molar ratio during the Wintertime Investi-
K2 (M), K3 (M), K4 (M2 ), and K5 (M) are rate coefficients gation of Transport, Emissions, and Reactivity (WINTER)
for SO2 reaction, HSO− 3 reaction, H2 O2 reaction, H2 O reac- study to be 1.47 ± 0.43 and pointed out that this phenom-
tion, and NH3 reaction, respectively. The values of Henry’s ena indicates an important role of soluble nonvolatile cations
law constants and rate coefficients are the same as those used in aerosol thermodynamics. To reflect the impact of soluble
in GEOS-Chem aqueous-phase chemistry. [H + ] (M) is the nonvolatile cations on cloud water pH, we assume that total
https://doi.org/10.5194/gmd-13-2879-2020 Geosci. Model Dev., 13, 2879–2903, 20202882 G. Luo et al.: Improved wet processes in GEOS-Chem and global validations
amount of soluble nonvolatile cations associated with aerosol where faq is aqueous-phase cloud fraction, LCW (g m−3 ) is
thermodynamics (SNVC) is 25 % of sulfate. We also con- grid-box mean liquid-phase cloud water content, and ICW
sider the contribution of calcium and magnesium based on (g m−3 ) is grid-box mean ice-phase cloud water content.
simulated dust mass in GC12, assuming that 3 % of dust mass
is soluble calcium and 0.6 % is soluble magnesium (Farlie et 2.3 Rainout efficiencies
al., 2010; Moch et al., 2020), to SNVIs:
2.3.1 Warm cloud
h i h i h i
[SNVI] = 2 SO2−
4 −2 [SNVC]−2 Ca
2+
−2 Mg2+ . (9) GEOS-Chem uses rainout efficiencies to represent the ab-
sorptions of water-soluble gases and aerosols in the cloud
Rainwater pH, which is used for the calculation of effective condensate phase (Jacob et al., 2000; Mari et al., 2000; Liu
Henry’s law constants of water-soluble gases in rain droplets et al., 2001). After applying these efficiencies with the up-
(Eqs. 3–5), is assumed to be a constant value of 4.5 in GC12. dated parameterization for rainout loss fraction (Luo et al.,
Rainwater pH is determined by the cloud water pH where 2019), we get the new equation as
the rain is produced, uptake of water and ions during rainfall
fc · Pr
processes, and evaporation of rain droplets. In addition, rain- F= 1 − e−Er ·k·1t , (11)
water pH also depends on temperature (Smith and Martell, k (LCW + ICW + Pr · 1t)
1976). Although it is difficult to fully trace rainwater pH in where Er is the rainout efficiency for corresponding species.
the model based on current available information in GC12, Equation (11) is the same as Eq. (1) except Eq. (11) contains
we use cloud pH where rainout occurs to represent rainwater Er in the rainout calculation.
pH for rainout process and rainwater-mass-weighted cloud In GC12, rainout efficiencies for water-soluble aerosols
pH above where washout occurs to represent rainfall water are assumed to be 100 %, while those for water-soluble gases,
pH for washout processes in this work. The calculated rain- except nitric acid and SO2 , are calculated via Henry’s law
water pH in this study varied from 4.3 to 6.9. constants (Jacob et al., 2000). Er of nitric acid is assumed to
pH values also affect dry deposition of water-soluble gases be the same as water-soluble aerosols due to its high solu-
via its impact on the uptake due to dissolution at wet sur- bility. Er of SO2 is assumed to be the same as water-soluble
faces. The origin of surface water where this uptake occurs aerosols but limited by the availability of H2 O2 in the precip-
is therefore important to account for the effect if varying pH. itating grid box (Chin et al., 1996). It means rainout of SO2
GC12 calculated the effective Henry’s constant for dry depo- in GC12 is attributed to the aqueous-phase oxidation of SO2
sition by assuming a temperature of 298.15 K and leaf water by H2 O2 rather than the absorption by cloud water. How-
pH of 7. Surface water on land is dominated by leaf water ever, GEOS-Chem already accounted for in-cloud oxidation
whose pH is ∼ 7. The pH of ocean surface water varies from of SO2 as part of the aqueous-phase chemical calculation
8 to 8.5 (Antonov et al., 2010; Jacobson, 2005). de Caritat et which converts in-cloud SO2 to sulfate, so doing the same
al. (2005) found the pH of the meltwater of the Arctic snow in the scavenging calculation would be double-counting the
varies from 4.6 to 6.1 with a median value of 5.4. We assume removal of SO2 . Considering the low solubility of SO2 in wa-
the pH values at wet surface are 7 for land, 8.2 for ocean, and ter, it is more appropriate to calculate rainout efficiency for
5.4 for snow in this work. SO2 based on Henry’s law. In the present work, we assume
Er of SO2 equals its dissolution fraction:
2.2 Fraction of cloud available for aqueous-phase
chemistry Er_SO2 = fw_SO2 , (12)
In GC12, the fraction of cloud available for aqueous-phase with fw_SO2 calculated with Eq. (2).
chemistry is assumed to be 100 % of the grid-box cloud In the present work, we also modified rainout efficiencies
fraction when temperatures are above 258 K and 0 % of the for hydrophilic black carbon (BC) and primary organic car-
grid-box cloud fraction when temperatures are below 258 K. bon (POC) from 100 % in GC12 to 50 %. The rationale for
This means aqueous-phase chemistry in mixed clouds where the modification is that, although the aging of BC and POC
temperatures are often below 258 K is not considered in in the atmosphere converts these aerosols from hydropho-
GC12. However, many studies have indicated that super- bic to hydrophilic, they are not as easily activated into cloud
cooled cloud water can exist when temperatures are above droplet as water-soluble aerosols (e.g., sulfate, nitrate, am-
237 K (Rosenfeld and Woodley, 2000; Sassen, 1985). There- monium). The composition of the particles decides the hy-
fore, we calculate aqueous-phase cloud fraction based on groscopic parameter kappa which is important for cloud ac-
MERRA-2 cloud liquid content and cloud ice content when tivation calculation (Abdul-Razzak and Ghan, 2000). If BC
temperatures are higher than 237 K: and POC are internally mixed with the sulfate, nitrate, and
ammonium (SNA) aerosols, then they all have similar com-
LCW positions. However, in the actual atmosphere, many particles
faq = fc , (T > 237 K), (10) are externally mixed: some particles are pure SNA, while
LCW + ICW
Geosci. Model Dev., 13, 2879–2903, 2020 https://doi.org/10.5194/gmd-13-2879-2020G. Luo et al.: Improved wet processes in GEOS-Chem and global validations 2883
others are primary particles (BC, POC, dust, etc.) coated with ∼ 40 % of pre-existing aerosol mass is incorporated in ice
SNA (Fassi-Fihri et al., 1997). It takes time for primary par- crystals. In this work, we assume cold cloud rainout efficien-
ticles to gain coating through condensation, coagulation, and cies are 40 % for water-soluble aerosol, 50 % for hydropho-
aqueous chemistry. The amount of SNA coated on primary bic black carbon, and 100 % for dust, respectively. Addition-
particles depends on the aging time and abundance of SNA ally, rainout of cold clouds is limited to below the MERRA-2
in the air. Based on a detailed size- and mixing-state-resolved troposphere since stratospheric water in MERRA-2 is known
advanced particle microphysics (APM) simulation which ex- to have unphysical behavior.
plicitly resolves the amount of SNA coating (Yu et al., 2012), In GC12, cold cloud wet scavenging of nitric acid is
the hygroscopic parameter kappa of coated BC and POC is treated the same as water-soluble aerosol. However, in cold
roughly about half of that of SNA. More robust calculation clouds (T < 237 K), nitric acid is removed by the partition-
of rainout efficiencies for BC and POC should consider the ing on ice crystals (Kärcher and Voigt, 2006; Voigt et al.,
amount of soluble species coated on these particles (Yu et 2006), while water-soluble aerosol is removed by homoge-
al., 2012; Yu and Luo, 2009), but this will be the subject of neous freezing nucleation. Kärcher et al. (2008) used a clima-
future work. tology of cirrus ice water content together with observed mo-
lar ratios of HNO3 /H2 O in cirrus ice particles to estimate the
2.3.2 Mixed and cold clouds range of nitric acid content in cirrus ice (185–240 K). Their
study showed that less efficient nitric acid uptake limits the
In GC12, aerosols in mixed clouds (237 K ≤ T < 258 K) nitric acid content in cirrus ice at higher temperatures and
and cold clouds (T < 237 K) were assumed to be removed small ice water content permits only little nitric acid in ice
through heterogeneous and homogeneous freezing nucle- at low temperatures. The fraction of nitric acid in ice gen-
ation (Q. Wang et al., 2014). GEOS-Chem assumed that het- erally increases with decreasing temperature. Kärcher and
erogeneous nucleation dominates ice formation at 237 K ≤ Voigt (2006) attributed this behavior to less efficient nitric
T < 258 K (mixed cloud) and results in 100 % rainout effi- acid trapping at higher temperatures despite faster ice growth
ciencies only for dust and hydrophobic black carbon which rates, which is caused by an increasingly rapid escape of ad-
are considered as ice nuclei (IN). Homogeneous nucleation sorbed nitric acid into the gas phase. A parameterization of
takes place at T < 237 K (cold cloud) and results in 100 % nitric acid partitioning in cold clouds developed by Kärcher
rainout efficiencies for both water-soluble aerosol and IN. et al. (2008) is employed here to calculate Er of nitric acid in
Ice nucleation processes and their impacts on aerosol cold clouds when temperature is below 240 K:
wet scavenging by mixed and cold clouds are largely un- h i
T
clear. However, it is known that ice nucleation rates depend 10−(−26.5×1.00155 +30.7) · 63 · LCW+ICW
18 fc vmr
strongly on temperature (DeMott et al., 2015; Kanji and Ab- Er = , (14)
batt, 2010). To take this into account, we parameterize rain- [HNO3 ]vmr
out efficiencies at warmer temperatures based on the fraction h i
where LCW+ICW fc is the volume mixing ratio of in-cloud
of dust in mixed clouds contributing to IN, which can be cal- vmr
culated as a function of T according to DeMott et al. (2015) water and in-cloud ice, and [HNO3 ]vmr is volume mixing ra-
as tio for nitric acid gas.
e0.46(273.16−T )−11.6 2.4 Empirical washout coefficients by rain and snow
Er_mixed_dust = ,
153.5
(237 K ≤ T < 258 K). (13) Washout coefficients by rain and snow in GC12 were up-
dated by Wang et al. (2011) by adopting the parameteriza-
In addition to T , ice nucleation efficiency of particles also tion constructed by Feng (2007, 2009) for individual aerosol
depends on their sizes, and smaller particles (diameter < modes. Accumulation-mode washout coefficients were used
500 nm) are less likely to act as IN (Niedermeier et al., 2015). for all aerosols except dust and sea salt, for which the coarse-
While most of the mass of dust particles is dominated by mode coefficients were used. Previous studies noticed that
those larger than 500 nm (Zender et al., 2003), a significant washout rates by rain derived from field measurements are 1
fraction of BC particles are smaller than 500 nm (Sahu et al., to 2 orders of magnitude larger than the values from theoret-
2012). Based on the sectional aerosol microphysics calcula- ical calculation (Wang et al., 2010; Luo et al., 2019). There-
tion in GEOS-Chem APM (Yu and Luo, 2009), the mass frac- fore, L2019 recommended using empirical washout coeffi-
tion of BC particles with diameter > 500 nm is ∼ 50 %. In cients for the simulation of washout by rain.
this study, we assume Er for hydrophobic BC in both mixed X. Wang et al. (2014) found that the large differences in
clouds (237 K ≤ T < 258 K) and cold clouds (T < 237 K) is washout rate between field measurements and theoretical cal-
50 % of those values for dust. culation not only appear in washout by rain but also appear
Water-soluble aerosols are 100 % removed via homoge- in washout by snow. In this work, we use the semi-empirical
neous freezing nucleation in cold clouds (Q. Wang et al., parameterization developed by X. Wang et al. (2014) for the
2014; Liu et al., 2001). Strom et al. (1997) observed that calculation of nitric acid and aerosol washout by both rain
https://doi.org/10.5194/gmd-13-2879-2020 Geosci. Model Dev., 13, 2879–2903, 20202884 G. Luo et al.: Improved wet processes in GEOS-Chem and global validations
and snow. Washout rate is calculated by an exponential equa- at wet surface on the values of H ∗ (Erisman et al., 1994;
tion: Wesely et al., 1990), and the values of H ∗ for SO2 , H2 O2 ,
b and NH3 are calculated with Eqs. (3)–(5). Wet surface pH
Pd
kwash = 3 , (15) values discussed in Sect. 2.1 are used to reflect the impact
fr of wet surface acidity on dissolution during dry deposition.
where kwash (s−1 ) is the washout rate, Pd (mm h−1 ) is rain Wet surface pH values are only determined by land type
or snow falling from upper layers, fr is rainfall area fraction, and are not altered by precipitation. Ganzeveld et al. (1998)
3 is washout scavenging coefficient, and b is an exponential reported that observations and physical–chemical model
coefficient. simulations indicated SO2 dry deposition velocity increases
The values of 3 and b for nitric acid and aerosol washout from a minimum value of 0.01 cm s−1 for a temperature of
by rain (T > 268 K) and snow (248 K < T < 268 K) are 253 K to a value of 0.15–0.25 cm s−1 for 273 K. Therefore,
shown in Table 1. We assume precipitation at tempera- in this work, we assume SO2 dry deposition velocity over
tures lower than 248 K is dominated by ice. GC12 assumed snow and ice is 0.01 cm s−1 when temperatures are lower
washout of aerosol by ice is the same as that by snow. How- than 253 K.
ever, uptake of aerosol by ice and by snow is different.
Schneider et al. (2019) found specific surface area (SSA)
of ice crystals is approximately one-fifth of SSA of snow. 3 Results and discussions
Therefore, in this work, we roughly assume washout rate by
ice (T < 248 K) is one-fifth of that by snow. Washout of ni- To investigate the impacts of updated wet processes on
tric acid uses the same values as in L2019 but we extend global simulation of aerosols and aerosol precursors, we run
the temperature limitation from 268 to 248 K. Washout of ni- GEOS-Chem for three cases: (1) standard Geos-Chem ver-
tric acid by ice is assumed to be one-fifth of that by snow. sion 12.6.0, called GC12; (2) the same as case GC12 ex-
Empirical washout coefficients by rain and snow for coarse cept using wet scavenging described in the work of Luo et
aerosol and hydrophobic fine aerosol in this work are based al. (2019), and this case is named L2019; (3) the same as the
on the values in X. Wang et al. (2014). Because the rain case L2019 except considering the updated wet processes de-
washout rate for water-soluble aerosols measured by Laakso scribed in Sect. 2, and this case is called WETrev. All simula-
et al. (2003) is still ∼ 20 times larger than that calculated tions are run with 2◦ × 2.5◦ horizontal resolution and 47 lay-
by the semi-empirical parameterization, we used the value ers from surface to 0.01 hPa. Emission over Europe is based
of 1 × 10⁻⁵ to replace 5 × 10⁻⁷ for hydrophilic aerosol’s on the EMEP inventory. Other emissions are produced by the
washout by rain. The washout coefficient of hydrophilic default setting of HEMCO (Keller et al., 2014) for all simu-
aerosol by snow is replaced with the value of 2×10⁻⁴ , which lations presented in this work.
is 20 times higher than the value by rain. The assumption
of different washout coefficients for hydrophobic and hy- 3.1 Comparison with surface monitoring networks
drophilic aerosols is because the rain washout rate for water- over the US, Europe, and Asia
soluble aerosols measured by Laakso et al. (2003) is larger
than that calculated by the semi-empirical parameterization. To validate model results with surface monitoring networks,
One of the possible reasons is that droplet–particle collec- we use observational data taken at US EPA, CASTNET,
tion mechanisms for hydrophobic and hydrophilic aerosols AMoN, IMPROVE and CSN, EMEP and EANET sites. The
are different. Washout by ice is assumed to be one-fifth of criterion of observations used for model validation is that
that by snow. valid data are available for every month in 2011. For EANET
observations, due to too much missing data, the criterion is
2.5 Wet surface uptake during dry deposition loosened to monthly mean data available for each month dur-
ing a 3-year period (2010–2012). Seto et al. (2007) pointed
Uptake of water-soluble gases at wet surfaces is strongly out that EANET observations at urban sites are much higher
influenced by dissolution processes. The solubility of SO2 , than those at remote sites. Since the number of the Asian
H2 O2 , and NH3 at wet surfaces needs to be calculated via sites is very limited, to make the validation more appropri-
the effective Henry’s law coefficient because it is associated ate, only remote and rural sites are used for model valida-
with a series of aqueous-phase reactions (Seinfeld and tion. Table 2 shows the number of sites with observations
Pandis, 2016). In GC12, H ∗ of SO2 , H2 O2 , and NH3 and the number of sites satisfying these criteria. Figure 1 and
for dry deposition are assumed to be the constants with Table 3 present the comparisons of observed secondary inor-
the values of 105 , 5 × 10⁷ , and 2 × 10⁴ M atm−1 , respec- ganic aerosol precursors and secondary inorganic aerosols at
tively (http://wiki.seas.harvard.edu/geos-chem/index.php/ surface monitoring networks and the simulated mass concen-
Physical_properties_of_GEOS-Chem_species#Definition_ trations by the GC12, L2019, and WETrev cases described
of_Henry.27s_law_constants, last access: October 2019). In above. As shown in Fig. 1a–c, simulated SO2 for the three
this work, we consider the impacts of temperature and pH cases is lower than observed values over the US but higher
Geosci. Model Dev., 13, 2879–2903, 2020 https://doi.org/10.5194/gmd-13-2879-2020G. Luo et al.: Improved wet processes in GEOS-Chem and global validations 2885
Table 1. List of 3 and b values in Eq. (15) for rain and snow washout parameterizations.
Rain Snow
> T > 268 K 248 K < T < 268 K
3 b 3 b
GC12
HNO3 2.8 × 10⁻⁵ 1.0 0 0
Coarse aerosol 2.6 × 10⁻⁴ 0.79 4.2 × 10⁻⁴ 0.96
Fine aerosol 4.3 × 10⁻⁶ 0.61 8.8 × 10⁻⁶ 0.96
This work
b b
HNO3 3 × 10⁻³ 0.62b 3 × 10⁻³ 0.62b
a a
Coarse aerosol 2 × 10⁻⁴ 0.85a 2 × 10⁻³ 0.7a
a a
Hydrophobic fine aerosol 5 × 10⁻⁷ 0.7a 1 × 10⁻⁵ 0.6 a
c c
Hydrophilic fine aerosol 1 × 10⁻⁵ 0.7a 2 × 10⁻⁴ 0.66a
a From X. Wang et al. (2014) assuming fine aerosol with diameter of 100 nm and coarse aerosol
with diameter of 6 µm. b From Luo et al. (2019). c This work.
than the observations over Europe and Asia. Over the US, Table 2. Number of sites with surface concentration observation
simulated SO2 is ∼ 20 % lower than observations. One pos- (NVO) and number of sites satisfying criterion (NSC) at surface
sible reason is that a large amount of US EPA observations monitoring networks in the US, Europe, and Asia.
are located at urban regions where SO2 concentrations are
much higher than rural and remote regions. There were 288 USA Europe Asia
US EPA sites with valid data in each month of 2011. Only NVO NSC NVO NSC NVO NSC
69 of these sites were with the mark of “not in a city”. After
considering the updates of wet scavenging by L2019, NMBs SO2 US EPA EMEP EANET
464 288 42 20 14 3
are increase from 20 % to 23 % over the US, reduced from
74 % to 59 % over Europe, and reduced from 63 % to 43 % HNO3 CASTNET EMEP EANET
over Asia, respectively. Consideration of updated wet pro- 84 77 25 8 25 5
cesses in this work further reduces NMBs to 51 % in Europe NH3 AMoN EMEP EANET
and 23 % in Asia, respectively. 53 17 40 15 25 10
Figure 1d–f are the results for nitric acid. NMBs of sim-
ulated nitric acid by GC12 for the US, Europe, and Asia SO4 IMPROVE+CSN EMEP EANET
371 214 52 21 25 9
are 78 %, 107 %, and 121 %, respectively. GC12 significantly
overestimates the surface mass concentration of nitric acid NIT IMPROVE+CSN EMEP EANET
in these regions. Simulations by L2019 and WETrev indi- 371 213 66 22 25 8
cate that wet scavenging is the dominant process causing the NH4 IMPROVE+CSN EMEP EANET
overestimation of nitric acid in GEOS-Chem. NMBs of sim- 371 178 66 24 25 9
ulated nitric acid in WETrev for the US, Europe, and Asia are
reduced to 0.9 %, −0.7 %, and −21 %, respectively. We also BC IMPROVE EMEP
168 122 11 5
notice that WETrev underestimates nitric acid at low temper-
atures for US and European sites. These underestimates may OC IMPROVE EMEP
be associated with the updated uptake coefficients by Holmes 168 118 11 5
et al. (2019) for heterogeneous chemistry. If we switch back
to the old heterogeneous chemistry in GEOS-Chem version
12.5, the underestimation of nitric acid at low temperatures Figure 1j–l are observed and simulated sulfate over the US,
is reduced (not shown). Figure 1g–i show that the biases of Europe, and Asia. NMBs of the GC12 case over the three re-
model-simulated ammonia by the three cases over the three gions are −1.1 %, 6.9 %, and 5.5 %, respectively. The appli-
regions are small. Since the increasing ammonia wet depo- cation of updates to wet scavenging in L2019 leads to a sig-
sition is compensated by less equilibrium partitioning with nificant underestimation of sulfate during wintertime, reach-
decreased nitric acid in the air, wet processes show a rela- ing up to 50 % over the three regions. Based on our inves-
tively small impact on the simulation of ammonia. tigation, we found that the absence of aqueous-phase chem-
https://doi.org/10.5194/gmd-13-2879-2020 Geosci. Model Dev., 13, 2879–2903, 20202886 G. Luo et al.: Improved wet processes in GEOS-Chem and global validations
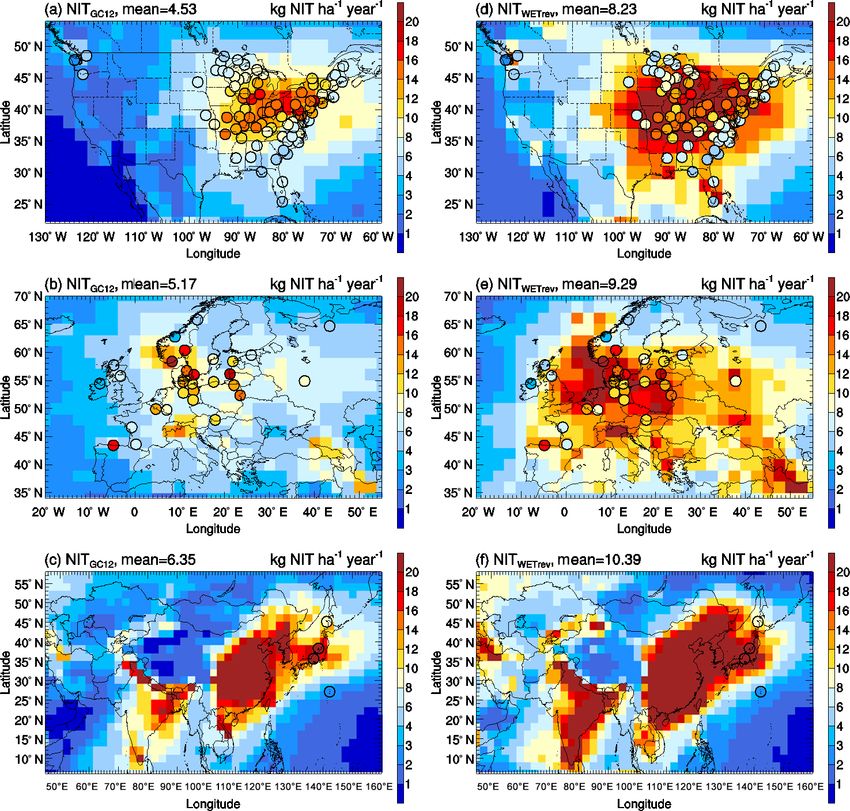
Table 3. Observed and simulated annual mean surface concentrations of aerosols and aerosol precursors in the US, Europe, and Asia.
Comparisons include annual mean surface concentrations (M, µg m−3 ), normalized mean bias (NMB, %), and correlation coefficient (r,
when the number of samples > 10) between observed and simulated annual mean values for the eight species by GC12, L2019, and WETrev
cases.
USA Europe Asia
GC12 L2019 WETrev GC12 L2019 WETrev GC12 L2019 WETrev
SO2 M: 5.61 4.48 4.29 4.32 M: 1.36 2.36 2.16 2.05 M: 2.51 4.08 3.58 3.08
NMB −20 −23 −23 NMB 74 59 51 NMB 63 43 23
r 0.49 0.49 0.48 r 0.53 0.50 0.50 r
HNO3 M: 0.83 1.47 0.83 0.83 M: 0.67 1.40 0.66 0.67 M: 0.86 1.90 0.64 0.68
NMB 78 0.9 0.9 NMB 107 −2.4 −0.7 NMB 121 −26 −21
r 0.57 0.59 0.60 r r
NH3 M: 1.00 1.02 1.04 1.21 M: 0.83 0.84 0.91 1.07 M: 0.96 0.95 0.88 1.06
NMB 2.6 4.4 21 NMB 0.9 8.7 28 NMB −1.7 −8.6 10
r 0.26 0.28 0.29 r 0.90 0.89 0.91 r
SO4 M: 1.30 1.29 0.91 1.17 M: 1.29 1.38 0.87 1.24 M: 2.63 2.77 1.69 2.46
NMB −1.1 −30 −10 NMB 6.9 −33 −4.3 NMB 5.5 −36 −6.3
r 0.92 0.92 0.92 r 0.92 0.90 0.92 r
NIT M: 0.71 1.60 0.78 0.81 M: 1.66 3.77 1.54 1.73 M: 0.60 2.23 0.89 0.83
NMB 126 10 15 NMB 127 -7.5 4.2 NMB 269 47 37
r 0.53 0.58 0.61 r 0.85 0.86 0.86 r
NH4 M: 0.61 0.89 0.54 0.64 M: 0.88 1.67 0.82 1.02 M: 0.58 1.55 0.82 1.08
NMB 45 −13 4.1 NMB 90 −7.3 16 NMB 167 42 86
r 0.76 0.79 0.79 r 0.79 0.81 0.81 r
BC M: 0.20 0.18 0.16 0.17 M: 0.51 0.38 0.32 0.34
NMB −7.0 −20 −14 NMB −25 −37 −32
r 0.54 0.54 0.54 r
OC M: 1.01 0.80 0.68 0.72 M: 1.97 1.00 0.77 0.85
NMB −20 −33 −29 NMB −49 −61 −57
r 0.63 0.65 0.65 r
istry in mixed clouds appears to be the main reason of un- fate wet scavenging and the lower sulfate mass due to the
derestimated sulfate at low temperatures. As we discussed in absence of aqueous-phase chemistry in mixed cloud and hy-
Sect. 2, aqueous-phase chemistry in GC12 is only simulated droxymethanesulfonate chemistry. As shown in Fig. 1m–r,
when temperatures are higher than 258 K. Conversely, in the simulated nitrate and ammonium in the GC12 case over the
WETrev case, the temperature limitation of aqueous-phase three regions are much higher than observations. As dis-
chemistry is extended from 258 to 237 K. This change allows cussed in Luo et al. (2019), the overestimation is associated
aqueous-phase chemistry to be simulated when temperatures with the underestimation of rainout and washout of nitric
are low. After employing the new approaches of cloud water acid and nitrate. Updated wet scavenging in L2019 success-
pH and aqueous-phase cloud fraction calculation, NMBs of fully reduces NMBs of nitrate over the three regions from
the WETrev case in the three regions are −10 %, 4.3 %, and 126 % to 10 %, 127 % to 7.5 %, and 269 % to 47 %, respec-
6.3 %, respectively. It significantly reduces the bias shown tively. NMBs of ammonium over the three regions are re-
in the L2019 case. The absence of aqueous-phase hydrox- duced from 45 % to −13 %, 90 % to −7.3 %, and 167 % to
ymethanesulfonate chemistry may also be a potential rea- 42 %, respectively. Updated wet processes in this work show
son for the remaining model biases with sulfate, but this is a relatively small impact on simulated nitrate and ammonium
not explored here (Moch et al., 2018). NMB of sulfate sim- surface mass concentrations over the three regions.
ulated by WETrev in the US is higher than that of GC12. For simplicity, the WETrev case includes all updates to
However, the good agreement between GC12 sulfate and the wet processes as described in Sect. 2. To understand the con-
observation can be attributed to the coincidental offsets of tribution of various updates to the overall changes in the pre-
the higher sulfate mass due to the underestimation of sul- dicted concentrations of aerosols and aerosol precursors, we
Geosci. Model Dev., 13, 2879–2903, 2020 https://doi.org/10.5194/gmd-13-2879-2020G. Luo et al.: Improved wet processes in GEOS-Chem and global validations 2887
Figure 1. Variations of monthly means for the year 2011 showing the comparisons of SO2 , nitric acid, ammonia, sulfate, nitrate, and
ammonium surface mass concentrations which are observed over (left column) the US, (center column) European, and (right column) Asian
sites (black) and simulated by GC12 (blue), L2019 (yellow), and WETrev (red) cases.
carry out five numerical sensitivity study cases (RO, WO, RP, GC12. Relative contributions to the changes are calculated as
DD, and AC). The RO case is the same as the WETrev case
except using rainout rate in GC12; the WO case is the same RCi =
as the WETrev case except using washout rate in GC12; the nsite
RP case is the same as the WETrev case except assuming
P
Ci,j − CWETrev,j
j =1
pH of rainwater for wet scavenging is 4.5; the DD case is Pnsite Pnsite Pnsite ,
j =1 |CRO,j −CWETrev,j |+ j =1 |CWO,j −CWETrev,j |+ j =1 |CPR,j −CWETrev,j |
the same as the WETrev case except using dry deposition Pnsite Pnsite
+ j =1 |CDD,j −CWETrev,j |+ j =1 |CAC,j −CWETrev,j |
treatment in GC12; and the AC case is the same as the WE-
Trev case except using aqueous-phase chemistry treatment in (16)
where RC is the relative contribution (%), C is simulated sur-
face mass concentration (µg m−3 ), i is the numerical sensitive
https://doi.org/10.5194/gmd-13-2879-2020 Geosci. Model Dev., 13, 2879–2903, 20202888 G. Luo et al.: Improved wet processes in GEOS-Chem and global validations study case index (e.g., when i = 1, Ci,j refers to CRO,j ), and The criteria of observations used for model validation are j is the site index. (1) valid data are available for each month in 2011 and (2) the Relative contributions of RO, WO, RP, DD, and AC to the difference between observed and simulated monthly precipi- changes of January and July surface concentrations over the tation is within a factor of 4 (Paulot et al., 2014). The num- US, European, and Asian sites are summarized in Table 4. In ber of sites with observations and the number of sites satis- the US, the changes of SO2 are mainly caused by DD and fying these criteria are shown in Table 5. For the compar- AC, whose contributions are up to 54.2 % and 25.0 % in Jan- ison shown in Table 6, model-simulated wet deposition is uary and 50.5 % and 22.3 % in July. Rainout and washout corrected following Paulot et al. (2014) to remove bias due both show a relatively small impact on the changes of SO2 . to precipitation. As shown in Fig. 3 and Table 6, GC12 un- In contrast, rainout and washout are important to the changes derestimates SO2 +SO4 wet deposition over the US and Eu- of nitric acid, sulfate, nitrate, and ammonium. The contribu- rope. NMBs of SO2 +SO4 wet deposition simulated by GC12 tion of wet scavenging to the changes of these species ex- over the two region are −21 % and −46 %, respectively. Af- ceeds 50 % in both January and July. For nitric acid, nitrate, ter considering the updated wet processes in WETrev, NMBs and ammonium, the contribution of wet scavenging can be as of SO2 +SO4 wet deposition are reduced to −9.0 % over the high as 70 %–90 %. For sulfate, AC also plays an important US and −6.2 % over Europe, respectively. However, all the role with relative contributions in January and July of 29.5 % three cases significantly underestimate SO2 +SO4 wet depo- and 17.5 %, which is comparable to the contributions of RO sition over Asia. One possible reason is that GEOS-Chem and WO. For ammonia, most of the changes are caused by may underestimate eruptive volcanic emission near the four DD and AC, with the sum of the two processes contributing Japanese sites. For HNO3 +NIT wet deposition over the US, > 50 % of the changes. The contribution of RP to SO2 , sul- the values simulated by GC12 are close to observations, fate, ammonia, and ammonium is small in January and large while the values simulated by WETrev are ∼ 2 times higher in July. In July, the contribution of RP to SO2 , sulfate, am- than observations. However, wet deposition data are col- monia, and ammonium is 8.5 %, 4.4 %, 13.4 %, and 4.1 %, re- lected weekly at NTN sites. It is hard to estimate the uncer- spectively. The relative contribution from RO, WO, RP, DD, tainty due to the evaporation of HNO3 from the collected pre- and AC at the sites over Europe and Asia are similar to those cipitation water. Over Europe and Asia, wet deposition fluxes over the US (Table 4). are observed daily at most of EMEP and EANET sites. The Figure 2 is a comparison of observed BC and OC over the values of HNO3 +NIT wet deposition simulated by GC12 are US and Europe. Simulated BC over the US is close to obser- lower than observations, while the values simulated by WE- vations except for a 10 %–20 % underestimate during sum- Trev are higher than observations. For NH3 +NH4 , GC12 un- mer and fall. The underestimate is likely associated with the derestimates wet deposition over the US, Europe, and Asia. underestimated wildfire emissions in the western US (Mao NMBs over the three regions are −10 %, −33 %, and −10 %, et al., 2015). Simulated OC over the US is close to observa- respectively. NMBs of NH3 +NH4 wet deposition simulated tions during summer but 50 %–60 % lower than observations by WETrev are reduced to −7.7 % over Europe and −2.5 % during spring and fall. GEOS-Chem (all three cases) signifi- over Asia, respectively. cantly underestimates BC and OC over Europe and the possi- ble reasons behind the bias remain to be investigated. NMBs 3.2 Comparison of SO2 , sulfate, and BC mass of the BC and OC in Europe are up to −37 % and −61 %, concentrations at Arctic sites respectively. The differences of simulated BC and OC in the three cases are small for the US and Europe which indicates We also study the impact of updated wet processes on SO2 , wet processes have a small impact on the simulation of BC sulfate, and BC surface mass concentrations at several Arctic and OC in these regions. The small impact of wet processes sites where measurements are available. Figure 6 shows the on BC in the US and Europe is because 80 % of emitted BC comparison of SO2 at Nord (81.6◦ N, 16.7◦ W) and Zeppelin is assumed to be hydrophobic aerosol which needs 1.15 d (78.9◦ N, 11.9◦ E). GC12 matches well with the observed to be converted to hydrophilic BC. Updated wet processes SO2 at Nord but overestimates SO2 at Zeppelin in January have little impact on hydrophobic aerosol in the lower tropo- and December by a factor of 3. The updated wet scaveng- sphere where wet scavenging is dominated by warm clouds. ing (yellow line) shows a small impact on simulated SO2 in OC consists of primary organic aerosol (POA) and secondary the Arctic., with simulated SO2 reduced slightly during win- organic aerosol (SOA) which is formed through the oxidation ter and spring. In WETrev, we assumed SO2 dry deposition of organic gaseous precursors. Due to the low dissolution of velocity is 0.01 cm s−1 when temperatures are lower than POA and organic gaseous precursors in water, wet processes 253 K. WETrev slightly enhances SO2 at the higher-latitude also have little impact on these species. site (Nord) during winter. At Zeppelin, temperature in De- Wet deposition of simulated SO2 +SO4 , HNO3 +NIT, and cember is higher than that in January and February, and SO2 NH3 +NH4 are compared with NTN observations over the concentration is enhanced due to the modification of dry de- US (Fig. 3), EMEP observations over Europe (Fig. 4), and position in this work. However, there is more aqueous-phase EANET observations over remote regions in Asia (Fig. 5). chemistry in December which consumes the enhanced SO2 . Geosci. Model Dev., 13, 2879–2903, 2020 https://doi.org/10.5194/gmd-13-2879-2020
G. Luo et al.: Improved wet processes in GEOS-Chem and global validations                                                               2889

Table 4. Relative contribution (%) of modified rainout (RO), washout (WO), rain pH (RP), dry deposition (DD), and aqueous chemistry (AC)
to the changes of January and July surface concentrations at the US, European, and Asian sites.

                                  USA                                         Europe                               Asia
                   RO     WO       RP      DD       AC          RO     WO       RP     DD     AC     RO     WO      RP    DD     AC
        January
        SO2        5.0    15.3     0.5     54.2     25.0        11.7   24.1    12.0    19.0   33.1    3.6   15.3    0.2   27.7   53.2
        HNO3      15.5    73.4     0.5      5.3      5.2        25.2   60.1     1.3     2.4   11.0    8.7   63.1    0.1    8.4   19.6
        NH3        7.9    23.7     1.6     30.5     36.3         9.0   20.4    31.3    14.9   24.4    3.9    7.0    5.8   26.2   57.1
        SO4       46.6    17.3     0.4      6.2     29.5        74.3    8.5     0.9     2.1   14.3   29.4   17.5    0.1    5.8   47.3
        NIT       37.7    46.7     0.7      5.3      9.6        56.5   34.1     1.4     1.5    6.5   17.4   43.9    0.3   10.7   27.6
        NH4       48.7    34.3     0.7      6.0     10.3        78.3   13.2     1.0     2.2    5.2   40.6   22.9    0.3    3.1   33.0
        July
        SO2        5.6    13.1     8.5     50.5     22.3         3.0   31.3     1.3    31.0   33.4   13.3   15.9   15.2   23.5   32.1
        HNO3       5.8    91.3     0.5      2.0      0.4         5.2   93.8     0.2     0.7    0.1   11.4   86.8    0.5    1.2    0.1
        NH3        6.7    21.7    13.4     49.9      8.2         5.7   53.2    11.5    26.6    3.0    4.8   17.9   28.7   45.0    3.6
        SO4       48.7    16.5     4.4     12.9     17.5        66.0   11.7     0.7     3.0   18.7   63.9   16.2    2.6    8.4    8.8
        NIT       16.1    68.7     2.7     10.9      1.6        12.3   82.6     1.5     3.2    0.4   24.4   64.7    3.3    6.9    0.7
        NH4       35.7    36.4     4.1     13.0     10.8        27.2   63.7     1.0     2.6    5.5   52.6   29.1    3.3    8.9    6.2

Figure 2. Variations of monthly means for the year 2011 showing the comparisons of black carbon and organic carbon surface mass concen-
trations which are observed over (a, c) the US and (b, d) European sites (black) and simulated by GC12 (blue), L2019 (yellow), and WETrev
(red) cases.

Table 5. Number of sites with wet deposition observation (NVO)                 By switching from GC12 to WETrev, NMB of SO2 is in-
and number of sites satisfying criterion (NSC) at surface monitoring           creased from −23 % to 32 % at Nord and decreased from
networks in the US, Europe, and Asia.                                          27 % to 22 % at Zeppelin. Figure 7 compares the observed
                                                                               and simulated sulfate and BC at Alert (82.5◦ N, 62.5◦ W),
                      USA             Europe                Asia               Barrow (71.3◦ N, 156.6◦ W), and Zeppelin. Observations at
                      NTN             EMEP                 EANET               the three sites show that both sulfate and BC are high in
                                                                               spring and low in summer. The model simulations gener-
                  NVO     NSC      NVO      NSC       NVO         NSC
                                                                               ally capture seasonal variation at these Arctic sites. How-
 SO2 +SO4          250       86       62       25          53          4       ever, GC12 overestimates sulfate mass concentration at the
 HNO3 +NIT         250       86       67       30          53          4       three sites by a factor of 2–3. Simulated BC by GC12 is 50 %
 NH3 +NH4          250       85       64       29          53          4       lower than observation at Alert during winter and spring and
                                                                               a factor of 2 higher than observations at Barrow and Zeppelin
                                                                               during winter. Updated wet scavenging significantly impacts

https://doi.org/10.5194/gmd-13-2879-2020                                                         Geosci. Model Dev., 13, 2879–2903, 2020
2890 G. Luo et al.: Improved wet processes in GEOS-Chem and global validations Figure 3. Horizontal distributions of SO2 +SO4 deposition over the US (a, d), Europe (b, e), and Asia (c, f). Filled circles are annual mean wet deposition at NTN, EMEP, and EANET corrected following Paulot et al. (2014) to remove bias due to precipitation. simulated sulfate and BC in Arctic regions. Simulated sulfate duced from −67 % to −40 % at Barrow and from −75 % to by L2019 is much closer to observations except for a 50 % −46 % at Zeppelin due to the switch from L2019 to WETrev. underestimation at Alert during winter and spring, while sim- ulated BC at the three Arctic sites by L2019 is much lower 3.3 Vertical profiles of nitric acid and aerosols: than observations. The comparison with model results from comparison with ATom-1 and ATom-2 aircraft WETrev shows the underestimation of sulfate at Alert during measurements spring is compensated by considering aqueous-phase chem- istry in mixed clouds. Most of BC in Arctic regions is trans- To evaluate the impact of updated wet processes on sim- ported from midlatitude to low-latitude source regions with ulated vertical profiles of aerosols and aerosol precursors, open fire and anthropogenic emissions (Xu et al., 2017), and we compare simulated nitric acid and aerosols for the during the long-range transport hydrophobic BC is aged and three cases with the aircraft measurements of ATom-1 in converted to hydrophilic BC. The assumption of reduced hy- July–August 2016 and ATom-2 in January–February 2017 drophilic BC rainout efficiency in the WETrev case increases (Jimenez et al., 2019; Wofsy et al., 2018) over the Northern simulated BC mass concentration and enhances agreement Hemisphere (Fig. 8) and the Southern Hemisphere (Fig. 9). with observations at these Arctic sites. NMBs of BC are re- Nitric acid was measured by chemical ionization mass spec- Geosci. Model Dev., 13, 2879–2903, 2020 https://doi.org/10.5194/gmd-13-2879-2020
G. Luo et al.: Improved wet processes in GEOS-Chem and global validations                                                 2891

Figure 4. The same as Fig. 3 but for HNO3 +NIT.

trometer, while aerosols were measured by CU aircraft high-           As shown in Fig. 8, GC12 overestimates nitric acid and un-
resolution time-of-flight aerosol mass spectrometer (HR-           derestimates black carbon and organic carbon over the North-
ToF-AMS) (Hodzic et al., 2020). The work of Brock et               ern Hemisphere during both ATom-1 and ATom-2. NMBs of
al. (2019) indicated that there is very good quantitative agree-   the three species are 66 %, −77 %, and −55 % during ATom-
ment between AMS and volume data. For ATom data, OC is             1 and 163 %, −10 %, and −27 % during ATom-2. GC12 sim-
calculated by OA_PM1_AMS/OAtoOC_PM1_AMS. For the                   ulated sulfate and ammonium match well with observations
model, we used 1.8 for SOAs. Flight tracks over land or in the     during ATom-1 but are much higher than observations dur-
stratosphere are filtered out for the comparison (see Fig. S1      ing ATom-2 whose values are high: up to 78 % for sulfate
in the Supplement for flight tracks of ATom-1 amd ATom-2).         and 217 % for ammonium. After considering the updated wet
We filter out the flight tracks over land because ATom obser-      scavenging in L2019, the overestimates of nitric acid, sul-
vations over land, whose values vary greatly, only account         fate, and ammonium during ATom-2 and nitric acid during
for 28 % of total measurements. The exclusion of these data        ATom-1 are reduced to 5 %, −11 %, −30 %, and −36 %, re-
makes the comparison more appropriate. Vertical profiles of        spectively. However, L2019 significantly underestimates ni-
nitric acid and aerosols over land, which are similar to those     tric acid at the upper troposphere where pressure is lower
in Figs. 8 and 9, are shown in Fig. S2.                            than 300 hPa. As we mentioned earlier, L2019 may overes-
                                                                   timate cold cloud wet scavenging of nitric acid due to treat-

https://doi.org/10.5194/gmd-13-2879-2020                                            Geosci. Model Dev., 13, 2879–2903, 2020
2892 G. Luo et al.: Improved wet processes in GEOS-Chem and global validations Figure 5. The same as Fig. 3 but for NH3 +NH4 . Figure 6. Variations of multiyear monthly means showing the comparisons of SO2 surface mass concentrations which were observed at (a) Nord (2008–2013) and (b) Zeppelin (2008–2013) sites (black) and simulated (2011) by GC12 (blue), L2019 (yellow), and WETrev (red) cases. Geosci. Model Dev., 13, 2879–2903, 2020 https://doi.org/10.5194/gmd-13-2879-2020
G. Luo et al.: Improved wet processes in GEOS-Chem and global validations                                                       2893

Table 6. Observed and simulated annual mean wet deposition of aerosols and aerosol precursors in the US, Europe, and Asia. Comparisons
include annual mean wet deposition (M, kg ha−1 yr−1 ), normalized mean bias (NMB, %), and correlation coefficient (r, when the number
of samples > 10) between observed and simulated annual mean values by GC12, L2019, and WETrev cases. Simulated values at sites were
corrected following Paulot et al. (2014) to remove bias due to precipitation.

                                      USA                                    Europe                                    Asia
                            GC12     L2019    WETrev               GC12     L2019     WETrev                GC12     L2019    WETrev
 SO2 +SO4       M: 10.3       6.8      8.0        9.4    M: 6.3       3.4      5.0        5.9    M: 28.6      10.3     11.1       13.2
                NMB          −35      −23        −9.0    NMB         −46      −21        −6.2    NMB          −64      −61        −54
                r            0.81     0.79       0.81    r           0.56     0.55       0.49    r
 HNO3 +NIT      M: 9.5        9.6      18.1       19.1   M: 9.9       6.8     14.3        14.0   M: 14.6     13.3      15.8       15.5
                NMB           0.6        89        100   NMB         −31        45          42   NMB         −9.2       8.1        6.2
                r             0.9      0.85       0.88   r           0.84     0.59        0.64   r
 NH3 +NH4       M: 3.6        3.2       4.0        4.2   M: 3.9       2.6      3.9        3.6    M: 3.9        3.5      3.3        3.8
                NMB          −10         12         16   NMB         −33      −1.6       −7.7    NMB          −10      −14        −2.5
                r            0.85      0.87       0.85   r           0.75     0.55       0.67    r

Figure 7. Variations of multiyear monthly means showing the comparisons of (a–c) sulfate and (d–f) black carbon surface mass concen-
trations which were observed at (a, d) Alert (2008-2012), (b, e) Barrow (2008–2013), and (c, f) Zeppelin (2008–2013) sites (black) and
simulated (2011) by GC12 (blue), L2019 (yellow), and WETrev (red) cases.

ment of cold cloud rainout of nitric acid as same as water-          Trev between 500 and 300 hPa are much lower than those
soluble aerosol with 100 % rainout efficiency. With updated          simulated by L2019 and GC12. This is because WETrev con-
cold cloud scavenging in WETrev, the bias of nitric acid sim-        siders washouts of nitric acid by snow and ice which were
ulated by L2019 in the upper troposphere is reduced during           absent in L2019 and GC12. Figure 8g shows the impact of
ATom-2 and is enhanced during ATom-1. This indicates fur-            updated aqueous-phase chemistry in mixed clouds on the sul-
ther understanding regarding ice uptake and removal of nitric        fate vertical profile. Considering aqueous-phase chemistry in
acid is needed. Nitric acid concentrations simulated by WE-          mixed clouds significantly enhances sulfate mass concentra-

https://doi.org/10.5194/gmd-13-2879-2020                                                Geosci. Model Dev., 13, 2879–2903, 2020
You can also read