Wetter environment and increased grazing reduced the area burned in northern Eurasia from 2002 to 2016
←
→
Page content transcription
If your browser does not render page correctly, please read the page content below
Biogeosciences, 18, 2559–2572, 2021
https://doi.org/10.5194/bg-18-2559-2021
© Author(s) 2021. This work is distributed under
the Creative Commons Attribution 4.0 License.

Wetter environment and increased grazing reduced the area
burned in northern Eurasia from 2002 to 2016
Wei Min Hao1 , Matthew C. Reeves2 , L. Scott Baggett3 , Yves Balkanski4 , Philippe Ciais4 , Bryce L. Nordgren1 ,
Alexander Petkov1 , Rachel E. Corley1 , Florent Mouillot5 , Shawn P. Urbanski1 , and Chao Yue6
1 United  States Forest Service, Rocky Mountain Research Station, Fire Sciences Laboratory,
5775 Highway 10 West, Missoula, MT 59808, USA
2 United States Forest Service, Rocky Mountain Research Station, Forestry Sciences Laboratory,

800 East Beckwith, Missoula, MT 59801, USA
3 United States Forest Service, Rocky Mountain Research Station, 240 West Prospect, Fort Collins, CO 80526, USA
4 Laboratoire des Sciences du Climat et de l’Environnement, LSCE–CEA–CNRS–UVSQ, 91191 Gif-Sur-Yvette, France
5 UMR CEFE 5175, Centre National de la Recherche Scientifique (CNRS), Université de Montpellier, Université Paul Valéry

Montpellier, Ecole Pratique des Hautes Etudes (EPHE), Institut de Recherche pour le Développement,
34293 Montpellier CEDEX 5, France
6 Institute of Soil and Water Conservation, Northwest A&F University, Yangling, Shaanxi 712100, P.R. China

Correspondence: Wei Min Hao (wei.hao@usda.gov) and Shawn Urbanski (shawn.p.urbanski@usda.gov)

Received: 19 April 2020 – Discussion started: 7 May 2020
Revised: 19 January 2021 – Accepted: 24 February 2021 – Published: 22 April 2021

Abstract. Northern Eurasia is currently highly sensitive to       1   Introduction
climate change. Fires in this region can have significant im-
pacts on regional air quality, radiative forcing and black car-   Fire activity worldwide is very sensitive to climate change
bon deposition in the Arctic which can accelerate ice melt-       and human actions, especially over high-latitude ecosystems
ing. Using a MODIS-derived burned area dataset, we report         (Goetz et al., 2007). Identifying and unraveling confound-
that the total annual area burned in this region declined by      ing drivers of fire is critical for understanding the recent and
53 % during the 15-year period from 2002 to 2016. Grassland       future impacts of fire activity. In northern Eurasia, fire activ-
fires dominated this trend, accounting for 93 % of the decline    ity impacts of chief concern include carbon cycling, boreal
in the total area burned. Grassland fires in Kazakhstan con-      ecosystem dynamics, fire emissions (Hao et al., 2016a), ac-
tributed 47 % of the total area burned and 84 % of the decline.   celerated ice melting in the Arctic (Hao et al., 2016a; Evan-
A wetter climate and increased grazing are the principle driv-    geliou et al., 2016), early thawing of permafrost and the hy-
ing forces for the decline. Our findings (1) highlight the im-    drological cycle at high latitudes (IPCC, 2014). In addition,
portance of the complex interactions of climate–vegetation–       fire activity affects air quality in Europe, Asia and North
land use in affecting fire activity and (2) reveal how the re-    America. An improved understanding of the region’s fire dy-
sulting impacts on fire activity in a relatively small region     namics can also be applied to develop climate change mitiga-
such as Kazakhstan can dominate the trends in burned areas        tion policy and can be incorporated into the fire modules of
across a much larger landscape of northern Eurasia.               Earth system models to improve their predictions (Hantson
                                                                  et al., 2016).
                                                                     The global mean surface temperature rose by approxi-
                                                                  mately 0.72 ◦ C from the year 1951 to 2012 according to
                                                                  the Fifth Assessment Report (AR5) of the Intergovernmental
                                                                  Panel on Climate Change (IPCC, 2013), but it remained rel-
                                                                  atively constant (“warming slowdown”) from 1998 to 2013
                                                                  (Fyfe et al., 2013, 2016; Cowtan and Way, 2014; Tren-

Published by Copernicus Publications on behalf of the European Geosciences Union.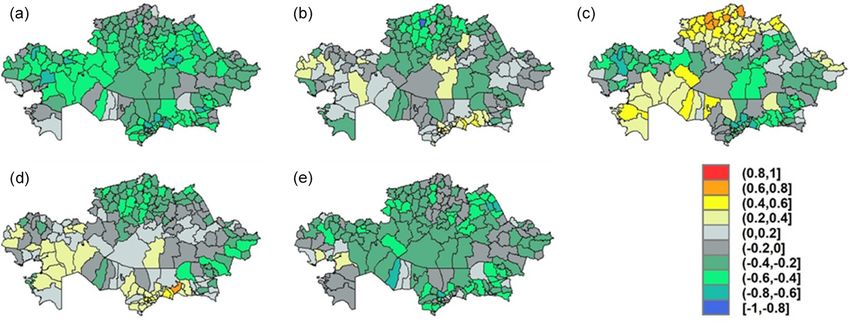
2560          W. M. Hao et al.: Wetter environment and increased grazing reduced the area burned in northern Eurasia

berth et al., 2014). Nevertheless, extreme high-temperature          2     Methodology
events continued to occur even during the warming slow-
down (Seneviratne et al., 2014; Trenberth et al., 2015). Since       2.1    Study area
2013, the global temperature has risen rapidly (NASA Global
Climate Change, 2019), and there were hemispheric temper-            First, we study the area of northern Eurasia, a region from
ature anomalies from 1850 to 2015 (Jones et al. 2016). In            35◦ N to the Arctic and from the Pacific Ocean to the At-
the Northern Hemisphere, temperatures have increased more            lantic Ocean. The region comprises 21 % of the Earth’s land
profoundly than in the Southern Hemisphere since the 1980s,          area and encompasses diverse ecosystems from the steppes
as they are greatly affected by the sources of greenhouse            of central Asia to the Arctic. Forest is the major ecosystem
gases and many other factors. High latitudes are projected           in this region, covering 27 % of the area, followed by grass-
to have the largest temperature increase globally by 2100            lands, which cover 16 % (Friedl et al., 2010).
(IPCC, 2013). At the same time, however, climatic compo-                Second, to understand the forces driving the decline in
nents of the fire weather index (FWI), an index of fire inten-       burned area, we focus on the effects of drought and grazing in
sity potential, have experienced regional divergence at these        Kazakhstan. From 2002 to 2016, Kazakhstan had the highest
latitudes with a positive FWI trend in East Asia and a nega-         rate of decline in burned area in northern Eurasia (Figs. 1, 2).
tive trend in Kazakhstan (Jolly et al. 2015), suggesting diver-      In Kazakhstan, grassland is the dominant ecosystem and
gent regional climate impacts. In northern Eurasia, current          grazing is the major agricultural activity (Food and Agricul-
accelerated high temperatures in the summer have also been           ture Organization FAO Live Animals Database, 2016).
observed on the eastern European Plain and in central Siberia
                                                                     2.2    Mapping burned areas
(Sato and Nakamura, 2019).
   Over the past 20 years, a decline in total area burned in         Burned area in northern Eurasia
Eurasia has been observed (Giglio et al., 2013; Hao et al.,
2016a, Andela et al., 2017). We will investigate trends in the       Since 2000, global burned area has been mapped by remote
spatial and temporal distribution of area burned from 2002           sensing (e.g., Mouillot et al. 2014) with different sensors and
to 2016 across different land cover types and geographic re-         detection algorithms (Chuvieco et al., 2019), leading to mul-
gions in northern Eurasia, a region highly sensitive to climate      tiple datasets with a significant uncertainty in the magnitude
change. The geographic subregion with the largest declining          of spatial distribution, interannual variability and trends in
trend is examined, and the influence of the confounding fac-         burned area (Hantson et al., 2016). We used the daily NASA
tors of climate and human activity on burned area is explored.       MODIS (Moderate Resolution Imaging Spectroradiometer)
   Our study seeks to evaluate the decline in burned area as a       dataset at a 500 m × 500 m resolution. Our MODIS-derived
function of variable fuel conditions (Krawchuk and Moritz,           burned area algorithm was validated in eastern Siberia with
2011), land use and relative moisture conditions (Pausas and         the Landsat-derived burned area (30 m × 30 m) (Hao et al.,
Ribeiro 2013). Beside these climate variables, on a global           2012). The ratio of these two satellite-derived burned areas
scale, abrupt changes have been observed to significantly            was 1.0 with a standard deviation of 0.5 % over 18 754 grid
impact long-term or recent fire history (Pausas and Keeley,          cells. Among other sources of variability, surface and crown
2014), along with other mechanisms such as herbivory from            fires generate significantly different spectral signals, so that
native and domestic ungulates and humans (e.g., fire pre-            the detection algorithm depends on vegetation type classifi-
vention). Considerable research has been done to understand          cation (Chuvieco et al., 2019).
climate–fire–grazing interactions in grassland ecosystems. In           The burned area data were analyzed at multiple spatial
grasslands, reductions in fuel availability due to decreasing        and temporal scales using frequentist statistical methods (see
net primary production, grazing or other management activi-          Sect. 2.4) to identify regional trends. Assessing burned area
ties can be the key variables limiting fire spread (Moritz et al.,   changes in northern Eurasia over this time period benefits
2005). For instance, in the western United States, research          from the lack of fire suppression in this region (Goldammer
has significant implications on forest and rangeland manage-         et al., 2013), so the impact of climate and land use on
ment (e.g., Bachelet et al., 2000; Gedalof et al., 2005; Riley       fire activity can be better understood. Our methodology for
et al., 2013; Abatzoglou and Kolden, 2013). Similar issues           mapping daily burned area is very similar to that used by
have been investigated on an African savanna for maintain-           Hao et al. (2016a, b), which was specifically developed for
ing sustainable grassland (e.g., Archibald et al., 2009; Ko-         this region. For the study of Hao et al. (2016a, 2016b), the
erner and Collins, 2014). In this study we closely examine           MCD12Q1 land cover map of 2015 was used for 2002–2016.
the interactions of climate, fire, grazing and fuel availabil-       For this present study, a temporally consistent and up-to-date
ity in Kazakhstan, the country in northern Eurasia with the          land cover product was used for 2002–2013 and the 2013
largest decline in burned area during the 2002–2016 period.          land cover map was used for 2014–2016, as current versions
                                                                     were not available for present and previous studies.

Biogeosciences, 18, 2559–2572, 2021                                                      https://doi.org/10.5194/bg-18-2559-2021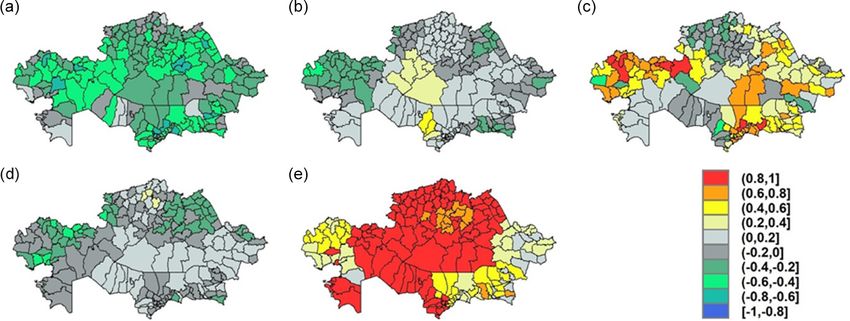
W. M. Hao et al.: Wetter environment and increased grazing reduced the area burned in northern Eurasia 2561
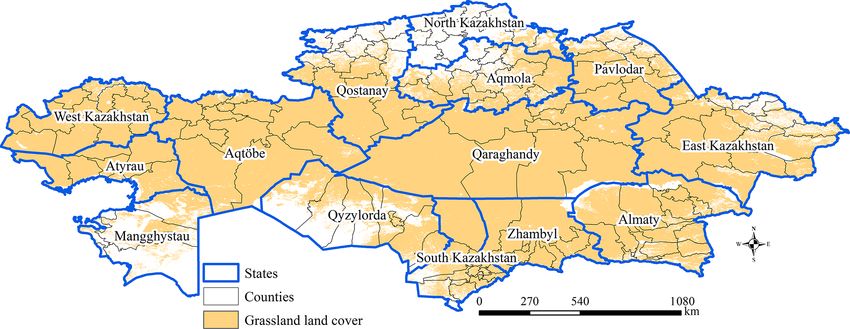
Figure 1. The distribution of grassland cover in Kazakhstan with counties and states shown as administrative boundaries.
Figure 2. Spatial distributions of robust linear trends in the area burned for each 0.5◦ × 0.5◦ grid cell in northern Eurasia from 2002 to 2016.
The border of Kazakhstan is also illustrated in Fig. 1.
2.3 Data sources of drought, livestock, annual biomass PDSI data from March to July, defined as the fire season (Roy
production and land cover et al., 2008), to compute a cumulative drought effect index.
The gridded PDSI data were available at a spatial resolution
The following data sources for estimating the factors af- of ∼ 4 km and were aggregated to the county within the study
fecting the burned area in Kazakhstan are described be- area (Fig. 1). The PDSI varies from +4 for wet conditions to
low: drought, livestock, annual biomass production and land −4 for dry conditions.
cover. All data were evaluated at the county level for 174
counties during the period from 2002 to 2016 (Fig. 1). We
Livestock
focused on Kazakhstan, as it was the region with the largest
decline in burned area in northern Eurasia (see Sect. 3.1).
The annual population of livestock in each of the 14
Drought provinces, each consisting of multiple counties, of Kaza-
khstan from 2002 to 2016 were compiled from the offi-
The Palmer Drought Severity Index (PDSI) from the Ter- cial agriculture statistics of the Ministry of National Econ-
raClimate site (http://www.climatologylab.org, last access: omy of the Republic of Kazakhstan Committee on Statistics
9 April 2021) was used to estimate drought throughout Kaza- (MANE, 2019). These data included yearly numbers of large
khstan (Abatzoglou et al., 2018). The PDSI was developed horned livestock and sheep and goats at the province level,
by Palmer (1965) and is widely used to estimate a rough soil which is coarser than the county level. Livestock populations
water budget based on monthly precipitation and potential are only available at the province level, and the population
evapotranspiration, with varying soil properties for the avail- was distributed proportionally to the size of the county area
able water content in order to account for pedological vari- so that all potential drivers of fire activity could be evaluated
ations and species roots access to water. We used monthly on a common spatial scale. Thus, the livestock density for
https://doi.org/10.5194/bg-18-2559-2021 Biogeosciences, 18, 2559–2572, 2021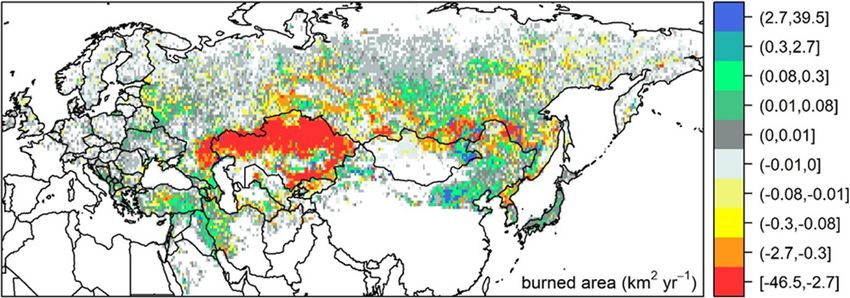
2562          W. M. Hao et al.: Wetter environment and increased grazing reduced the area burned in northern Eurasia

each county is defined as the ratio of the number of animals
to the area of the county.

Annual biomass production

We estimated the annual biomass production within the
grassland domain of the study area (Fig. 2) using the produc-
tion subroutine of the Rangeland Vegetation Simulator (RVS)
model (Reeves, 2016) which applied the methods of Reeves
et al. (2020). The RVS, which was originally developed
for simulating rangeland vegetation dynamics in the con-
tinental United States, models annual production based on
the MODIS normalized difference vegetation index (NDVI)
at a 250 m spatial resolution (MOD13Q1). The MOD13Q1
NDVI data are composited on a biweekly basis and are
available at a spatial resolution of 250 m. The quality as-
surance/quality control (QA/QC) flags were used to isolate
only the best-quality NDVI pixels. At each pixel, the highest-
quality maximum value composite on an annual basis was
retained for further analysis. The relationships between the
estimates of annual net primary production (ANPP) and max-
imum NDVI were divided into two groups to enable different
models to be fit to the upper and lower ends of production.
The upper and lower ends of production are given as follows:      Figure 3. Comparison of burned areas between the Forest Service
                                                                  Fire Emission Inventory – Northern Eurasia (FEI-NE) dataset and
y = 240.31 × e3.6684 x,                                    (1)    MODIS MCD64. The FEI-NE (blue) and MCD64 (pink) bands il-
                                                                  lustrate the 95 % confidence intervals.
where y is the estimated ANPP (in kg ha−1 of dry weight),
and x is the NDVI for the upper range (x ≥ 0.46); and             the presence of within-cell variation. We chose to use M-
                                                                  estimation to mitigate the effect of large within-cell varia-
y = 971.1 × ln x + 1976,                                   (2)    tion due to a relatively small within-cell samples such that
                                                                  the map presents a consistent surface. If computed using or-
where y is the estimated ANPP (in kg ha−1 ), and x is the
                                                                  dinary least squares (OLS) estimates, such large within-cell
NDVI for the lower range (x < 0.46). The partitioning into
                                                                  variation could result in some cells having inconsistent or
two groups was done, in part, because of the asymptotic
                                                                  “outlier” trends compared with their neighbors. The trends
nature or “saturation” feature (Santin-Janin et al., 2009) of
                                                                  were estimated using the R platform (R Core Team, 2019)
NDVI with respect to ANPP.
                                                                  with the rlm R function in the MASS package (Venables and
Land cover                                                        Ripley, 2002). Pairwise robust rank correlations (Figs. 5, 6)
                                                                  were computed as described in Kendall (1938) using the cor
The MODIS land cover product (MCD12Q1) Version 6 was              R function.
used to assess factors affecting the burned area in Kaza-            To validate our estimates on burned areas, we compare our
khstan. The product is available at a 500 m spatial resolu-       annual northern Eurasian burned areas from the Forest Ser-
tion and describes the distribution of broad vegetation types.    vice Fire Emission Inventory – Northern Eurasia (FEI-NE)
We screened these data to subset only those vegetation types      with the latest version of the MODIS burned area product
considered to represent grassland vegetation (Class 10 in the     (MCD64A1, Collection 6; Giglio et al., 2018) from 2002 to
MCD12Q1 dataset) from 2000 to 2016. In each year of the           2016 (Fig. 3). The burned areas reported by FEI-NE and
assessment, the number of grassland pixels was summed to          MODIS MCD64 were each modeled separately by year.
enable estimates of grassland area throughout the study area.     The models each include a first-order autoregressive term
                                                                  on the residuals to account for the presence of temporal au-
2.4    Statistical analysis                                       tocorrelation. The response was assumed to be gamma dis-
                                                                  tributed (Bickel and Doksum, 2015). A generalized linear
For each 0.5◦ × 0.5◦ pixel, the annual trend (Fig. 2) was esti-   mixed model (GLMM) approach was used that was esti-
mated as the robust linear slope computed from burned area        mated with the glmmTMB R function (R Core Team, 2019)
on year using M-estimation as described in Huber (1981).          in the glmmTMB R package (Brooks et al., 2017).
Our objective was to present consistent grid cell trends in

Biogeosciences, 18, 2559–2572, 2021                                                 https://doi.org/10.5194/bg-18-2559-2021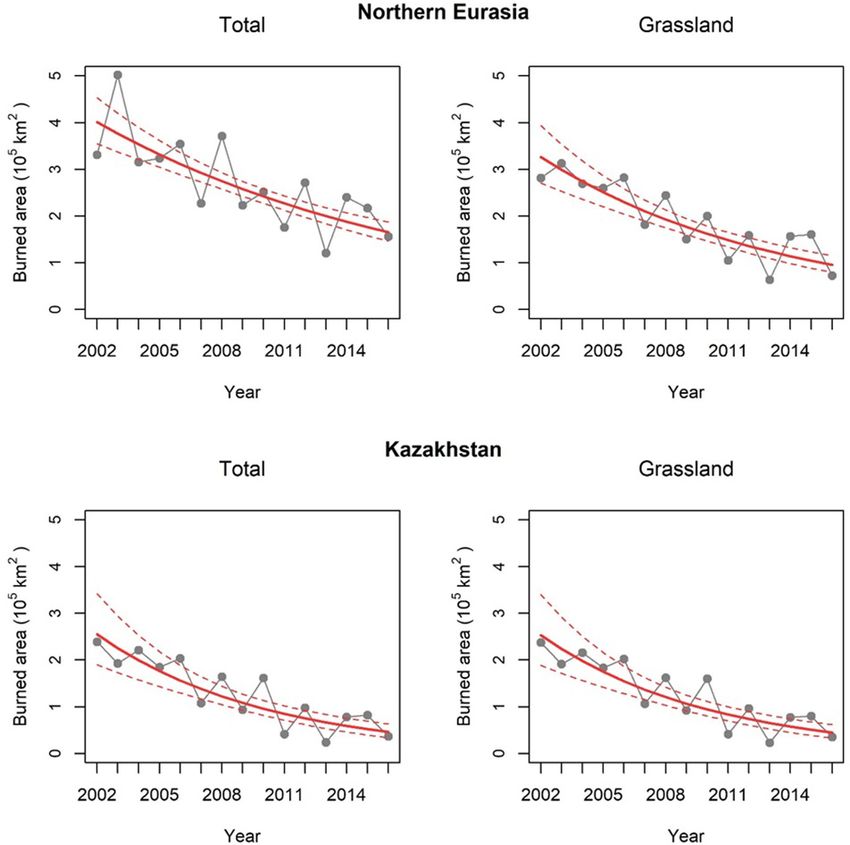
W. M. Hao et al.: Wetter environment and increased grazing reduced the area burned in northern Eurasia                     2563

   The potential driving forces of burned area at the county         Grasslands of Kazakhstan dominate changes in burned
level for 174 counties over a period of 15 years from 2002 to     area with significant declines mostly in central and north-
2016 were modeled using the GLMM approach to interpret            ern Kazakhstan, adjacent to the Russian border. The temporal
the effects on the extent of the area burned. The proportion of   trend in annual burned areas over all vegetation types and in
burned area per county was modeled on the effects of year,        grasslands in northern Eurasia and in Kazakhstan from 2002
PDSI during the fire season (May–July), proportion of grass       to 2016 are shown in Fig. 4. The burned area trends shown
area, ANPP and livestock density along with two-way inter-        in Fig. 4 were modeled in the same way as those reported
actions. The model included a random effect that accounts         in Fig. 3, with the same response distribution. The trends
for spatial correlation within each region along with a first-    in wave-like burned areas are typical for burned area trends
order autoregressive term on the residuals within each county     worldwide (e.g., Andela et al., 2017). The annual total area
that accounts for temporal autocorrelation. The response was      burned over northern Eurasia during this period decreased by
assumed to be beta distributed (Bickel and Doksum, 2015).         53 %, from 3.3 × 10⁵ km2 in 2002 to 1.6 × 10⁵ km2 in 2016
The model was estimated with the glmmTMB R platform (R            (Table 1), or at a rate of 1.2 × 10⁴ km2 (or 3.5 %) yr−1 . The
Core Team, 2019) in the glmmTMB R package (Brooks et              grassland area burned during the 15 years declined by 74 %,
al., 2017).                                                       from 2.8 × 10⁵ km2 in 2002 to 7.3 × 10⁴ km2 in 2016, or at
                                                                  a rate of 1.3 × 10⁴ km2 (or 4.9 %) yr−1 . Grassland fires in
                                                                  Kazakhstan accounted for 47 % of the total areas burned but
3     Results                                                     contributed to 84 % of the declining trend. The annual for-
                                                                  est burned area varied by a factor of 5, from 21 243 km2 in
3.1    Spatial and temporal distribution of burned areas
                                                                  2010 to 111 019 km2 in 2003, but there is no trend over the
       in northern Eurasia
                                                                  15 years (Table 1).
The declining trends in the spatial distribution of the area
                                                                  3.3   Regional trends in driving forces over time in
burned from 2002 to 2016 in northern Eurasia at a 0.5◦ ×0.5◦
                                                                        Kazakhstan
resolution are shown in Fig. 2. The majority of the area
burned was grassland in Kazakhstan in central Asia. How-          One of our objectives was to evaluate trends in the primary
ever, substantial areas were also burned in the Russian Far       drivers responsible for reducing area burned, especially in
East along the Chinese border because of illegal logging          grasslands at the county level. Pairwise correlation results
(Vandergert and Newell, 2003) and the subsequent fires to         are shown in Fig. 5. Each panel in Fig. 5 illustrates the coef-
burn the remaining forest residues. The annual areas burned       ficient of correlation between a key variable and year (2002–
according to ecosystem and geographic region are summa-           2016) for the 174 counties of Kazakhstan. The major factors
rized in Table 1. The interannual burned area in northern         affecting the trend in area burned in Kazakhstan are wetter
Eurasia varied by about 4 times: from 5.0 × 10⁵ km2 in 2003       climate (represented as PDSI), the proportion of grassland
to 1.2 × 10⁵ km2 in 2013 with an average of (2.7 ± 1.0) ×         cover, ANPP and livestock density (Table 2). Both grassland
105 km2 (n = 15). Grassland accounted for 71 % of the to-         partition and ANPP enable spreading fires.
tal area burned, despite comprising only 16 % of the land            The declining trends in the fraction of the area burned an-
cover (Friedl et al., 2010). Almost all of the grassland fires    nually are shown in Fig. 5a. The trend in PDSI from March
occurred in Kazakhstan in central and western Asia (Table 1).     to July during the 15-year period is illustrated in Fig. 5b.
In contrast, forest is the major ecosystem that covers 27 % of    A higher PDSI value indicates a wetter environment. In-
northern Eurasia (Friedl et al., 2010), but it only contributes   creasing wetness, i.e., higher PDSI, during the fire season
to 18 % of the total area burned. About 90 % of the forest        reduces the probability of fire ignition and fire spread. The
area burned occurred in Russia.                                   declining trend in the burned area (Fig. 5a) is then consistent
                                                                  with the increasing trend in PDSI (wet conditions), especially
3.2    Trends in burned areas in northern Eurasia
                                                                  in central and southern Kazakhstan (e.g., East Kazakhstan,
Comparisons of our annual northern Eurasian burned areas          Qaraghandy, Zhambyl and Almaty) (Fig. 5b).
(FEI-NE) with the latest version of the MODIS burned area            Through time, the proportion of grassland cover has been
product (MCD64A1, Collection 6; Giglio et al., 2018) from         asymmetric with some counties having exhibited strong de-
2002 to 2016 are shown in Fig. 3. The burned areas in these       creases, such as in the north-central region of Kazakhstan,
two datasets agree better in recent years after 2010. Both        while others have seen increases, such as in the northwestern
FEI-NE and MCD64A1 demonstrated declining trends and              region (Fig. 5c). This north-central region has also exhibited
similar interannual variability. The FEI-NE dataset was used      decreases in burned area (Fig. 5a). Similarly, some regions
to analyze the driving forces for the decline in burned area in   have shown increasing trends in grassland cover through time
Kazakhstan (see Sects. 3.3–3.4).                                  without commensurate increases in the proportion of burned
                                                                  area (Fig. 5a, c).

https://doi.org/10.5194/bg-18-2559-2021                                                  Biogeosciences, 18, 2559–2572, 2021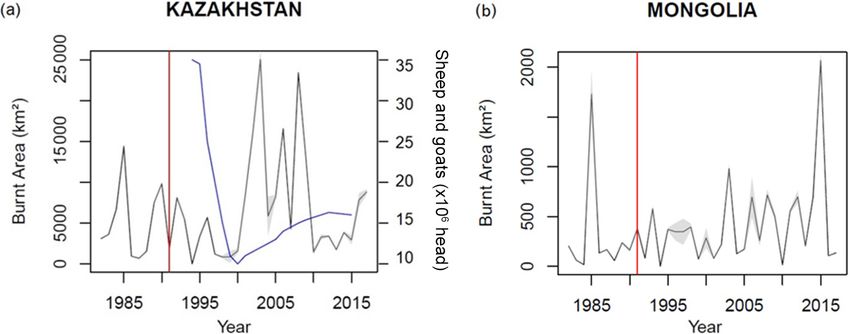
2564                  W. M. Hao et al.: Wetter environment and increased grazing reduced the area burned in northern Eurasia

Table 1. The area burned in forest, grassland, shrubland and savanna in geographic regions from 2002 to 2016. The data of the area burned
in Kazakhstan are listed for comparison only and are not included in the tabulation.

 Burned area (km2 )
 Region                      2002      2003        2004     2005      2006       2007       2008       2009       2010        2011       2012       2013       2014      2015      2016       Total
                                               Forest (evergreen needleleaf, evergreen broadleaf, deciduous needleleaf, deciduous broadleaf and mixed)
 Russia                    26 458    99 944    16 715      20 561    32 929     23 731     72 671     33 356     19 309     43 910     73 920     29 791      62 701    38 511    51 718    646 223
 East Asia                  1483      9697      6368        4202      2814       2524       4597       6676       1258       3379       4189       1819        3151      2944      1336      56 436
 Central and West Asia        131       206       367         259       388        469        641        389        348        159        321        307         517       726       455      5684
 Europe                       376     1172        467         592       491      1170         850        863        328      1206       2307         537       1224      1756        575     13 911
 Subtotal                  28 448   111 019    23 917      25 613    36 623     27 894     78 758     41 283     21 243     48 653     80 736     32 455      67 592    43 937    54 084    722 254
 Grassland
 Russia                    32 019    97 754    33 372      61 755    62 973     55 220     65 144     46 375     30 634     43 760     37 261     21 114      51 745    49 857    22 178    711 160
 East Asia                 10 643    21 235    15 551      12 433    14 456     16 819     15 278     11 259      8097      18 716     23 870     18 123      26 689    29 361    13 962    256 492
 Central and West Asia    239 160   193 580   220 080     185 531   204 627    109 248    163 814     92 592    161 668     41 943     97 363     24 364      78 203    81 517    36 369   1930 057
 Europe                       128       271       108         555       241        616        325        217        104        401        526        150         186       237       179      4242
 Subtotal                 281 948   312 840   269 112     260 273   282 296    181 903    244 560    150 443    200 503    104 819    159 021     63 752     156 822   160 972    72 688   2901 951
 Kazakhstan               237 335   191 466   215 977     182 968   202 292    106 558    162 474     91 873    160 318     40 995     96 420     23 195      76 977    80 251    35 249   1904 348
 Shrubland (closed shrubland and open shrubland)
 Russia                      7042    27 749     4894       13 149     5924       2868      10 901     13 096     18 854       6697     12 650     10 918       5717      3486     14 529    158 470
 East Asia                    337        79       264         828      934        675         790        645        375        914        796        193        317       153        191      7490
 Central and West Asia       1022     2836      5632        2384      1255       1728         999      1217       3279         964        769        845       1066      1287      1720      27 001
 Europe                        20        38        23          70       39        121         112         87         21         83         70         11         13        10         17        732
 Subtotal                    8421    30 701    10 813      16 430     8152       5391      12 802     15 044     22 529       8657     14 285     11 966       7112      4934     16 457    193 693
 Savanna (woody savanna and savanna)
 Russia                    11 136    43 574     8307       19 343    25 129     10 465     33 347     14 191      6745      12 473     16 387     12 076       8324      6261     12 039    239 796
 East Asia                    589     3504      3257        1275      1564         694      1268       1349         465        611        660        205         147       510       131     16 226
 Central and West Asia        575       500       437         395       442        317        413        391        261        115        193        112         161       301       178      4791
 Europe                        83       207       110         293       200        653        340        400        113        319        426        212         201       142       243      3941
 Subtotal                  12 383    47 785    12 110      21 306    27 335     12 128     35 368     16 330      7584      13 517     17 666     12 604       8832      7215     12 592    264 753
 Total                    331 199   502 346   315 951     323 621   354 405    227 317    371 488    223 100    251 859    175 646    271 707    120 777     240 358   217 058   155 820   4082 650

Table 2. Model parameters and associated p values.

                         Parameter                                                                          Estimate         Std. error                  z    Pr(> |z|)
                         Year × ANPP                                                                            −0.02                 0.01      −4.03          < 0.001
                         Year × PDSI                                                                             0.00                 0.00       0.20            0.838
                         Year × Proportion of grass area                                                        −0.26                 0.04      −6.77          < 0.001
                         Year × Livestock density (head km−2 )                                                   1.04                 0.61       1.70            0.089
                         ANPP × PDSI                                                                            −0.01                 0.01      −0.92            0.360
                         ANPP × Proportion of grass area                                                         0.72                 0.19       3.83          < 0.001
                         ANPP × Livestock density (head km−2 )                                                   0.88                 3.22       0.27            0.784
                         PDSI × Proportion of grass area                                                        −0.24                 0.11      −2.20            0.028
                         PDSI × Livestock density (head km−2 )                                                  −3.30                 1.62      −2.04            0.042
                         Proportion of grass area × Livestock density (head km−2 )                              37.78                28.32       1.33            0.182
                       “Estimate” denotes a parameter estimate from GLMM, “Std. error” refers to the standard error of the parameter estimate, “z” is the
                       z statistic, and “Pr(> |z|)” is the p value.

   The impacts of year, PDSI, land cover, ANPP and live-                                               Finally, we investigated livestock density as a potential
stock density on the extent of the area burned and the corre-                                       non-climatic driver affecting fuel amount. The population
lations of burned area with these driving forces are illustrated                                    density of livestock increased with time in all counties and
in Fig. 6. Area burned and PDSI were negatively correlated                                          was greatest in the central, northern and southern counties of
in most of the counties in Kazakhstan (Fig. 6b). Therefore,                                         Qostanay, Pavlodar and Qaraghandy (Fig. 5e). The coupling
as Kazakhstan becomes wetter during the fire season, the                                            of livestock density with PDSI affected the extent of the area
area burned declined over the 2002–2016 period. At the same                                         burned (Fig. S1.4 in the Supplement) with p = 0.042 (Ta-
time, grassland cover decreased across most of Kazakhstan,                                          ble 2). The area burned was negatively correlated with the
with a notable exception being the north-central and south-                                         population of livestock throughout nearly all of Kazakhstan
western regions (Fig. 6c). The ANPP decreased with time                                             (Fig. 6e). This observation suggests that the increasing popu-
over most of Kazakhstan, with the exception being the cen-                                          lation of grazing livestock may have reduced fuel-bed con-
tral and southwestern counties (Fig. 6d).                                                           tinuity, contributing to the decrease in the area burned in
                                                                                                    Kazakhstan. Since 2000, the numbers of sheep, goats and cat-

Biogeosciences, 18, 2559–2572, 2021                                                                                              https://doi.org/10.5194/bg-18-2559-2021
W. M. Hao et al.: Wetter environment and increased grazing reduced the area burned in northern Eurasia                              2565

Figure 4. Declining trends in the total area and grassland area burned in northern Eurasia (including Kazakhstan) and Kazakhstan from 2002
to 2016. The solid lines are the trend lines, and the dotted lines are 95 % confidence intervals.

tle have increased by 60 % in Kazakhstan based on MANE                 3.4.1   Proportion of grassland cover and year
statistics (2019) (Figs. S2 and S3 in the Supplement). Thus,
increased livestock grazing could decrease the amount of               Both year and the proportion of grassland area had signif-
herbaceous fuel across the landscape and offset increases in           icant effects on burned area when they interacted (Table 2,
fuel quantity due to expanded grassland cover. The net result          p < 0.001). When the proportion of grassland cover in a
would be reductions in fire spread and the area burned.                county was very low (e.g., 0.48 %), only about 0.6 % of the
                                                                       area was burned annually during the period from 2002 to
3.4   Interactions of driving forces                                   2016 (Fig. S1.1, upper left panel). On the contrary, when the
                                                                       grassland cover was 25 % or greater, the area burned declined
The driving forces (e.g., year, PDSI, proportion of grass-             steadily from 1.5 % in 2000 to 0.6 % in 2016 (Fig. S1.2 lower
land cover, ANPP and livestock density) for the decline in             right panel). This observation is consistent with grassland en-
the burned areas in Kazakhstan from 2002 to 2016 are in-               hancing the spread of fires in the absence of opposing factors.
terrelated. It is, therefore, critical to evaluate their interac-
tions. For instance, Figs. S1.1–S1.4 illustrate the proportion         3.4.2   PDSI and the proportion of grassland area
of burned area affected by the interactions of the driving
forces in 174 counties over 15 years (see table Table 2 for            Both the PDSI and the proportion of grassland area had sig-
more information).                                                     nificant effects on burned area when they interacted (Table 2,
                                                                       p = 0.028). As in Fig. S1.2, for a PDSI ranging from −4.5
                                                                       to ∼ 2, the percentage of the area burned remained at about
                                                                       0.6 % for a grassland area of 0.5 % (upper left panel). On
                                                                       the other hand, when grassland cover was 60 %, the frac-
                                                                       tion of area burned declined from 2.2 % to 0.8 % (lower right

https://doi.org/10.5194/bg-18-2559-2021                                                         Biogeosciences, 18, 2559–2572, 2021
2566 W. M. Hao et al.: Wetter environment and increased grazing reduced the area burned in northern Eurasia
Figure 5. Pairwise robust rank correlations of year with (a) fraction of burned area, (b) PDSI, (c) proportion of grassland layer, (d) ANPP
and (e) livestock density without considering their interactions.
Figure 6. Pairwise robust rank correlations of fraction of burned area with (a) year, (b) PDSI, (c) proportion of grassland layer, (d) ANPP
and (e) livestock density without considering their interactions.
panel). This analysis is consistent with grassland enhancing 3.4.4 PDSI and livestock density
the spread of fires, as in the previous section discussing the
proportion of grassland cover through time, and illustrates The interaction between the PDSI and livestock was signifi-
that increasing wetness significantly decreases burned area, cant with respect to the area burned (p = 0.042). Figure S1.4
mostly when grassland cover is high. shows the decline in the proportion of burned area with PDSI
at different livestock densities. As the PDSI increases (wet-
3.4.3 Livestock density and year ter landscape), less area is burned. However, the declining
trends differ with livestock density. This relationship is quite
We investigated livestock density as a potential non-climatic different for livestock densities of 0.002 (Fig. S1.4, upper
driver affecting fuel amount and area burned. The effects of left panel) and 0.05 head km−2 (Fig. S1.4, lower right panel).
grazing on the area burned from 2002 to 2016 are shown in For instance, for a low PDSI (−4, dry), 1.5 % of the area
Table 2 (p = 0.089). The declining trend in the area burned was burned for all livestock densities. In contrast, at a high
with time for different livestock densities are illustrated in PDSI (+2, wet), the percentage of burned area decreases
Fig. S1.3. A higher livestock density results in less available with increasing livestock density. Thus, the area burned is
biomass to burn and less area burned (lower right panel). This unaffected by grazing intensity during dry years, but during
provides additional evidence that grazing could reduce the wet years with high biomass (based on our RVS analysis
area burned in Kazakhstan. of Reeves, 2016), high grazing intensity tends to decrease
burned area.
Biogeosciences, 18, 2559–2572, 2021 https://doi.org/10.5194/bg-18-2559-2021W. M. Hao et al.: Wetter environment and increased grazing reduced the area burned in northern Eurasia 2567
4 Discussion 2011). During this time period, the livestock population was
negatively correlated with the area burned.
Burned area The fire activity data for Kazakhstan and Mongolia can be
estimated from 1985 to 2017, as shown in Fig. 7, based on the
recently released Advanced Very High Resolution Radiome-
The spatial and temporal extent of the area burned was exam-
ter (AVHRR) long-term fire history (Otón et al., 2019). This
ined in different ecosystems in northern Eurasia from 2002
new information extends the analysis to before our observed
to 2016, during which the average area burned was (2.7 ±
decrease during the 2002–2016 period and shows that fire
1.0) × 105 km2 yr−1 . The burned area in grasslands declined
activity only increased in Kazakhstan during the economic
by 74 %, from ∼ 282 000 km2 in 2002 to ∼ 73 000 km2 in
collapse and the associated reduction in livestock around the
2016, at a rate of 1.3 × 10⁴ km2 yr−1 . The area burned in for-
year 2000. This opposite trend supports our interpretation re-
est showed no trend over time. Our burned area is higher than
garding the relationship between grazing and burned area,
the MODIS MCD64 Collection 6, in which the average an-
particularly when this variation in burned area is not clearly
nual burned area was 9.7×10⁴ km2 in boreal Asia during the
observed in neighboring Mongolia, where grazing collapse
same period (Giglio et al., 2018). Boreal Asia in MCD64 has
did not occur.
a similar geographic region to our northern Eurasia. Never-
In the steppe of neighboring Mongolia, overgrazing also
theless, the interannual variability and the trends in burned
affected fire activity from 1988 to 2008 (Liu et al., 2013) in
area for the two datasets are consistent (Fig. 3).
a manner similar to Kazakhstan. However, extreme winter
Our results regarding burned area trends are consistent
freezing and inadequate preparation affected the increasing
with other published results (Giglio et al., 2013; Hao et al.,
livestock trend driven by the poorly prepared feeding of hay
2016a; Andela et al., 2017) which concluded that the area
and foliage. This led to higher livestock reductions during
burned in northern Eurasia declined, contrary to the projec-
the colder season than the average period of 2000 to 2014
tions of increased fire frequency driven by climate change
(Nandintsetseg et al., 2018), highlighting the potential impact
(Groisman et al., 2007; Kharuk et al., 2008). Uncertainty in
of climate on the livestock population in addition to human
global burned area remains a critical challenge, with trends
management decisions and practices (Xu et al., 2019).
and interannual variability reported by sensors and process-
We investigated grazing and land use as the main drivers of
ing algorithms exhibiting large differences (Hantson et al.,
changes in fuel availability in grasslands that could abruptly
2016; Chuvieco et al., 2019).
impact the fire regime, as observed for Africa (Holdo et
al., 2009; Andela et al., 2017) or globally over long peri-
Grassland fires and grazing ods (Marlon et al., 2008). Political changes can be associ-
ated with additional human processes affecting fire activity
Grassland fires in Kazakhstan accounted for 47 % of the to- or fire spread. Among others, decreasing population density
tal area burned but comprised 84 % of the decline in the to- (−10 % observed in Kazakhstan after 1991) could decrease
tal area burned in northern Eurasia during the 15 years from fire activity or suppression effort and firefighting capacities,
2002 to 2016. The grassland fires are a human-induced issue as mentioned for the post-Soviet period (Mouillot and Field,
caused by the production of fresh grass for grazing (Lebed 2005), as well as local conflicts potentially exacerbating fire
et al., 2012) with a cycle of about every 2 years. A similar ignitions, as observed in Africa (Bromley 2010). These ef-
temporal pattern characterizes grassland fire occurrence on fects might contribute less significantly than the direct effects
the African savanna (Hao and Liu, 1994; Andela and van der of grazing and land use on fuel loading and the subsequent
Werf, 2014). fire activity in the region. Gathering social information re-
Central Asia experienced tremendous socioeconomic mains a challenge with respect to better understanding the
change, with the collapse of the Soviet Union in the 1990s human impact on fire activity.
leading to a full restructure of the agricultural system, fol-
lowed by a rapid collapse of cattle industry which has pro- Modeling fire and grazing interactions
gressively recovered over the last 20 years (Figs. S2 and S3;
Food and Agriculture Organization, 2016). This change has Accounting for confounding factors related to burned area
potentially altered the fuel available to burn, as observed and the subsequent effects on ecosystems, biosphere–
in other ecosystems (Robinson and Milner-Gulland, 2003; atmosphere interactions and climate have been a challenge
Holdo et al., 2009; Vigan et al., 2017). The coincident decline in developing fire modules in global vegetation models
in burned area with increasing livestock population suggests (Hantson et al., 2016). Climate (drought, temperature and
that changing agricultural practices may have exerted an in- humidity), land cover and fuel amount are the main drivers
fluence on fire activity in Kazakhstan and northern Eurasia. related to fire activity in dynamic global vegetation models
In addition, a relationship between the livestock population (DGVMs) coupled with human-related information such as
and the burned area was observed in arid grassland in a small population density and countries’ wealth (Gross Domestic
region of southern Russia from 1986 to 2006 (Dubinin et al., Product). Our understanding of land use dynamics (Prestele
https://doi.org/10.5194/bg-18-2559-2021 Biogeosciences, 18, 2559–2572, 20212568 W. M. Hao et al.: Wetter environment and increased grazing reduced the area burned in northern Eurasia
Figure 7. Yearly burned area (in km2 ) in (a) Kazakhstan and (b) Mongolia for the 1982–2017 period based on the AVHRR LTDR (long-term
data record) remotely sensed burned area of the FireCCI project (https://geogra.uah.es/fire_cci/fireccilt11.php, last access: 13 April 2021).
The black line represents the mean burned fraction, and the gray area represents the burned area 95 % uncertainty delivered by FireCCILT10.
The blue line represents the sheep and goat population for the 1994–2014 period. The red line represents the end year of the Soviet Union.
Note that the scale of the area burned (y axis) in Kazakhstan (a) is 10 times greater than that in Mongolia (b).
et al., 2017), especially forest management, fire prevention ments cover disease projections (Perry et al. 2013), and mod-
and grazing practices, is still developing (Rolinski et al., eling efforts are increasingly devoted to the more complex
2018), and better data assemblage and modeling processes human aspect, including human consumption behavior, in-
are needed (Pongratz et al., 2018). In our study, we showed equality, and subsequent potential issues (Motesharrei et al.
the strong impact of political events (here, the collapse of the 2016) or social conflicts (Neumann et al. 2011). Our study
political regime) on grazing intensity and the subsequent ef- demonstrates that grazing can be highly variable as a fast
fect on fire activity. These stochastic events are hard to fore- response to or abrupt change in agricultural policies or po-
cast and simulate so that DGVMs cannot fully capture long- litical regime. These abrupt changes can have a significant
term trends in burned area (Kloster et al., 2010; Yue et al., impact on fire activity. Better integration of human process
2014) when compared with observed burned area reconstruc- on grazing activities in DGVMs, even as stochastic events,
tions (Mouillot and Field 2005). would capture this important process to account for probable
The Soviet economic collapse provides fruitful infor- political collapse/agricultural policies, societal decisions or
mation on the potential amplitude and impact of grazing widespread animal diseases. These improbable factors could
changes on ecosystem functioning. The 1998 Russian fi- affect the future global carbon budget.
nancial crisis led to a dramatic decrease in the consump-
tion of livestock in neighboring countries such as in Kaza-
khstan. Both sheep and goats (Fig. S2) and cattle (Fig. S3)
5 Conclusions
declined substantially from 1992 to 1998. As the economy
improved after late 1990s, the consumption of livestock has
The spatial and temporal extent of the area burned was exam-
grown steadily. Integrating grazing into DGVMs has recently
ined in different ecosystems in northern Eurasia from 2002
emerged for global models (Chang et al., 2013; Pachzelt et
to 2016. We conclude that the burned area in grasslands de-
al., 2015; Dangal et al. 2017) and for local studies (Bachelet
clined 74 %, from ∼ 282 000 km2 in 2002 to ∼ 73 000 km2 in
et al., 2000; Caracciolo et al., 2017; Vigan et al., 2017). Graz-
2016, or at a rate of 1.3 × 10⁴ km2 yr−1 . The area burned in
ing processes as implemented in DGVMs can capture the
forest did not show a trend. Grassland fires in Kazakhstan ac-
climate impact on livestock populations which could be af-
counted for 47 % of the total area burned but comprised 84 %
fected by climate extremes (Nandintsetseg et al., 2018) and
of the decline in the total area burned in northern Eurasia dur-
lack of forage or water (Tachiiri and Shinoda 2012; Vriel-
ing the 15 years. A wetter climate and the increase in grazing
ing et al., 2016). However, they still lack abrupt and stochas-
livestock in Kazakhstan are the major factors contributing to
tic changes in the projections of socioeconomic processes or
the decline in the area burned in northern Eurasia. The pop-
infectious disease potentially affecting livestock density, as
ulation of livestock increased in most of Kazakhstan from
shown in Africa by Holdo et al. (2009) after rinderpest virus
2002 to 2016, decreasing the burned area due to fuel removal
curation.
from grazing. The major factors affecting the availability of
Paleo-fire reconstructions have already captured grazing
the fuels resulting in the decline in burned area are climate,
as a keystone process through dung fungi spore residues in
the proportion of the grassland cover, the aboveground net
sediments (Cordova et al. 2019). Current modeling develop-
primary production and the livestock density. These factors
Biogeosciences, 18, 2559–2572, 2021 https://doi.org/10.5194/bg-18-2559-2021W. M. Hao et al.: Wetter environment and increased grazing reduced the area burned in northern Eurasia 2569
interact to reduce the area burned in Kazakhstan, especially ern United States, Int. J. Wildland Fire, 22, 1003–1020,
in grasslands. https://doi.org/10.1071/WF13019, 2013.
Abatzoglou, J. T., Dobrowski, S. Z., Parks, S. A., and Hegewisch,
K. C.: Terraclimate, a high-resolution global dataset of monthly
Data availability. All data and materials are available in the paper climate and climatic water balance from 1958–2015, Sci. Data,
or Supplement. The original geospatial dataset of the burned area is 5, 170191, https://doi.org/10.1038/sdata.2017.191, 2018.
large and will be made available upon reasonable request. However, Andela, N. and van der Werf, G. R.: Recent trends in
a derived dataset has been used to estimate black carbon emissions African fires driven by cropland expansion and El Niño
from fires in the same region. This dataset has been archived on the to La Niña transition, Nat. Clim. Change, 4, 791–795,
Forest Service Data Archive website (https://doi.org/10.2737/RDS- https://doi.org/10.1038/nclimate2313, 2014.
2016-0036; Hao et al., 2016b). Andela, N., Morton, D. C., Giglio, L., Chen, Y., van der Werf, G.
R., Kasibhatla, P. S., DeFries, R. S., Collatz, G. J., Hantson, S.,
Kloster, S., Bachelet, D., Forrest, M., Lasslop, G., Li, F., Man-
geon, S., Melton, J. R., Yue, C., and Randerson, J. T.: A human-
Supplement. The supplement related to this article is available on-
driven decline in global burned area, Science, 356, 1356–1362,
line at: https://doi.org/10.5194/bg-18-2559-2021-supplement.
https://doi.org/10.1126/science.aal4108, 2017.
Archibald, S., Roy, D. P., van Wilgen, B. W., and Scholes,
R. J.: What limits fire? An examination of drivers of burnt
Author contributions. WMH led both the project and the writing area in Southern Africa, Glob. Change Biol., 15, 613–630,
of the paper. MCR simulated aboveground biomass ANPP and of- https://doi.org/10.1111/j.1365-2486.2008.01754.x, 2009.
fered advice on the statistical analysis. LSB was responsible for the Bachelet, D., Lenihan, J. M., Daly, C., and Neilson, R. P.:
statistical analysis. YB, PC and FM suggested the use of the PDSI Interactions between fire, grazing and climate change at
and livestock population to explain the declining burned areas. BLN Wind Cave National Park, SD, Ecol. Model., 134, 229–244,
analyzed the data and contributed certain figures. AP mapped the https://doi.org/10.1016/S0304-3800(00)00343-4, 2000.
burned areas. REC conducted GIS analysis. SPU offered advice on Bickel, P. J. and Doksum, K. A.: Mathematical Statistics: Basic
the execution of the project. CY advised on the trend in the burned Ideas and Selected Topics, Volume I, Chapman & Hall/CRC
areas. All authors contributed to writing the paper. Texts in Statistical Science, 2nd Edition, Mathematical Statistics,
Taylor & Francis Group, New York, 2015.
Bromley, L.: Relating violence to MODIS fire detections
Competing interests. The authors declare that they have no conflict in Darfur Sudan, Int. J. Remote Sens., 31, 2277–2292,
of interest. https://doi.org/10.1080/01431160902953909, 2010.
Brooks, M. E., Kristensen, K., van Benthem, K. J., Magnusson, A.,
Berg, C. W., Nielsen, A., Skaug, H. J., Machler, M., and Bolker,
Acknowledgements. Wei Min Hao received funding from the US B. M.: glmmTMB balances speed and flexibility among pack-
Department of State, the US Forest Service Research and Devel- ages for zero-inflated generalized linear mixed modeling, The R
opment, and the NASA Terrestrial Ecology Program. Yves Balkan- Journal, 9, 378–400, 2017.
ski and Philippe Ciais received funding from the European Union’s Caracciolo, D., Istanbulluoglu, E., and Noto, L. V.: An ecohy-
Horizon 2020 Research and Innovation program (grant no. 641816; drological cellular automata model investigation of juniper tree
CRESCENDO). Florent Mouillot received funding from the Euro- encroachment in a western north American landscape, Ecosys-
pean Space Agency FireCCI program. tems, 20, 1104–1123, https://doi.org/10.1007/s10021-016-0096-
6, 2017.
Chang, J. F., Viovy, N., Vuichard, N., Ciais, P., Wang, T., Co-
Financial support. This research has been supported by the Eu- zic, A., Lardy, R., Graux, A.-I., Klumpp, K., Martin, R.,
ropean Union’s Horizon 2020 Research and Innovation program and Soussana, J.-F.: Incorporating grassland management in
(grant no. 641816; CRESCENDO), the European Space Agency ORCHIDEE: model description and evaluation at 11 eddy-
(FireCCI program), the Department of State, the US Forest Service covariance sites in Europe, Geosci. Model Dev., 6, 2165–2181,
Research and Development, and the NASA Terrestrial Ecology Pro- https://doi.org/10.5194/gmd-6-2165-2013, 2013.
gram. Chuvieco, E., Mouillot, F., van der Werf, G. R., San Miguel, J.,
Tanase, M., Koutsias, N., García, M., Yebra, M., Padilla, M., Gi-
tas, I., Heil, A., Hawbaker, T. J., and Giglio, L.: Historical back-
Review statement. This paper was edited by Nicolas Brüggemann ground and current developments for mapping burned area from
and reviewed by two anonymous referees. satellite Earth observation, Remote Sens. Environ., 225, 45–64,
https://doi.org/10.1016/j.rse.2019.02.013, 2019.
Cordova, C. E., Kirsten, K. L., Scott, L., Meadows, M., and
Lucke, A.: Multi-proxy evidence of late Holocene paeloen-
vrionmental change at Princessvlei, South Africa, The effect
References of fire, herbivores and humans, Quat. Sci. Rev., 221, 105896,
https://doi.org/10.1016/j.quascirev.2019.105896, 2019.
Abatzoglou, J. T. and Kolden, C. A.: Relationships be-
tween climate and macroscale area burned in the west-
https://doi.org/10.5194/bg-18-2559-2021 Biogeosciences, 18, 2559–2572, 20212570 W. M. Hao et al.: Wetter environment and increased grazing reduced the area burned in northern Eurasia
Cowtan, K. and Way, R. G.: Coverage bias in the Had- Global Change, edited by: Goldammer, J. G., Freiburg, Germany,
CRUT4 temperature series and its impact on recent tem- 51–78, 2013.
perature trends, Q. J. Roy. Meteorol. Soc., 140, 1935–1944, Groisman, P. Y., Sherstyukov, B. G., Razuvaev, V. N., Knight,
https://doi.org/10.1002/qj.2297, 2014. R. W., Enloe, J. G., Stroumentova, N. S., Whitfield, P. H.,
Dangal, S. R. S., Tian, H., Lu, C., Ren, W., Pan, S., Yang, J., Di Førland, E., Hannsen-Bauer, I., Tuomenvirta, H., Aleksander-
Cosmo, N., and Hessl, A.: Integrating herbivore population dy- sson, H., Mescherskaya, A. V., and Karl, T. R.: Poten-
namics into a global land biosphere model: plugging animals tial forest fire danger over Northern Eurasia: Changes dur-
into the earth system, J. Adv. Model. Earth Sy., 9, 2920–2945, ing the 20th century, Global Planet. Change, 56, 371–386,
https://doi.org/10.1002/2016MS000904, 2017. https://doi.org/10.1016/j.gloplacha.2006.07.029, 2007.
Dubinin, M., Luschekina, A., and Radeloff, V. C.: Climate, live- Hantson, S., Arneth, A., Harrison, S. P., Kelley, D. I., Prentice, I. C.,
stock, and vegetation: what drives fire increase in the arid Rabin, S. S., Archibald, S., Mouillot, F., Arnold, S. R., Artaxo,
ecosystems of southern Russia?, Ecosystems, 14, 547–562, P., Bachelet, D., Ciais, P., Forrest, M., Friedlingstein, P., Hickler,
https://doi.org/10.1007/s10021-011-9427-9, 2011. T., Kaplan, J. O., Kloster, S., Knorr, W., Lasslop, G., Li, F., Man-
Evangeliou, N., Balkanski, Y., Hao, W. M., Petkov, A., Silverstein, geon, S., Melton, J. R., Meyn, A., Sitch, S., Spessa, A., van der
R. P., Corley, R., Nordgren, B. L., Urbanski, S. P., Eckhardt, S., Werf, G. R., Voulgarakis, A., and Yue, C.: The status and chal-
Stohl, A., Tunved, P., Crepinsek, S., Jefferson, A., Sharma, S., lenge of global fire modelling, Biogeosciences, 13, 3359–3375,
Nøjgaard, J. K., and Skov, H.: Wildfires in northern Eurasia af- https://doi.org/10.5194/bg-13-3359-2016, 2016.
fect the budget of black carbon in the Arctic – a 12-year retro- Hao, W. M. and Liu, M.-H.: Spatial and temporal distribution of
spective synopsis (2002–2013), Atmos. Chem. Phys., 16, 7587– tropical biomass burning, Global Biogeochem. Cy., 8, 495–503,
7604, https://doi.org/10.5194/acp-16-7587-2016, 2016. https://doi.org/10.1029/94GB02086, 1994.
Food and Agriculture Organization FAOSTAT Live Animals Hao, W. M., Petkov, A., Nordgren, B., Corley, R. E., and Urban-
Database, http://www.fao.org/faostat/en/#home (last access: 12 ski, S. P.: Comparison of MODIS-derived burned area algorithm
April 2021), 2016. with Landsat images in eastern Siberia, Russia. in: Proceedings
Friedl, M. A., Sulla-Menashe, D., Tan, B., Schneider, A., Ra- of the 2012 International Emission Inventory Conference: Emis-
mankutty, N., Sibley, A., and Huang, X.: MODIS collection sion Inventories – Meeting the Challenges Posed by Emerging
5 global land cover: algorithm refinements and characteriza- Global, National, Regional and Local Air Quality Issues, Tampa,
tion of new datasets, Remote Sens. Environ., 114, 168–182, FL, 13–16 August, 2012.
https://doi.org/10.1016/j.rse.2009.08.016, 2010. Hao, W. M., Petkov, A., Nordgren, B. L., Corley, R. E., Silver-
Fyfe, J. C., Gillett, N. P., and Zwiers, F. W.: Overestimated global stein, R. P., Urbanski, S. P., Evangeliou, N., Balkanski, Y., and
warming over the past 20 years, Nat. Clim. Change, 3, 767–769, Kinder, B. L.: Daily black carbon emissions from fires in north-
https://doi.org/10.1038/nclimate1972, 2013. ern Eurasia for 2002–2015, Geosci. Model Dev., 9, 4461–4474,
Fyfe, J. C., Meehl, G. A., England, M. H., Mann, M, E., San- https://doi.org/10.5194/gmd-9-4461-2016, 2016a.
ter, B. D., Flato, G. M., Hawkins, E., Gillett, N. P., Xie, S.- Hao, W. M., Petkov, A., Nordgren, B. L., Corley, R. E., Silverstein,
P., Kosaka, Y., and Swart, N. C: Making sense of the early- R. P., and Urbanski, S. P.: Daily black carbon emissions data from
2000s warming slowdown. Nat. Clim. Change 6, 224–228, fires in Northern Eurasia for 2002–2015, Forest Service Research
https://doi.org/10.1038/nclimate2938, 2016. Data Archive, https://doi.org/10.2737/RDS-2016-0036, 2016b.
Gedalof, Z., Peterson, D. L., and Mantua, N. J.: Atmospheric, Holdo, R. M., Holt, R. D., and Fryxell, J. M.: Grazers, browsers, and
climatic, and ecological controls on extreme wildfire years fire influence the extent and spatial pattern of tree cover in the
in the northwestern United States, Ecol. Appl., 15, 154–174, Serengeti, Ecol. Appl., 19, 95–109, https://doi.org/10.1890/07-
https://doi.org/10.1890/03-5116, 2005. 1954.1, 2009.
Giglio, L., Randerson, J. T., and van der Werf, G. R.: Analy- Huber, P. J.: Robust Statistics, in Wiley series in probability and
sis of daily, monthly, and annual burned area using the fourth- mathematics statistics, John Wiley & Sons, New York, 1981.
generation global fire emissions database (GFED4), J. Geophys. IPCC: Climate Change 2013: The Physical Science Basis. Contri-
Res.-Biogeo., 118, 317–328, https://doi.org/10.1002/jgrg.20042, bution of Working Group I to the Fifth Assessment Report of the
2013. Intergovernmental Panel on Climate Change, edited by: Stocker,
Giglio, L., Boschetti, L., Roy, D., Humber, M. L., and Jus- T. F., Qin, D., Plattner, G.-K., Tignor, M., Allen, S. K., Boschung,
tice, C. O.: The collection 6 MODIS burned are mapping J., Nauels, A., Xia, Y., Bex, V., and Midgley, P. M., Cambridge
algorithm and product, Remote Sens. Environ., 217, 72–85, University Press, Cambridge, United Kingdom and New York,
https://doi.org/10.1016/j.rse.2018.08.005, 2018. NY, USA, 1535 pp., 2013.
Goetz, S. J., MacK, M. C., Gurney, K. R., Randerson, J. T., and IPCC: Climate Change 2014: Synthesis Report. Contribution of
Houghton, R. A.: Ecosystem responses to recent climate change Working Groups I, II and III to the Fifth Assessment Report of
and fire disturbance at northern high latitudes: observations and the Intergovernmental Panel on Climate Change, edited by: Core
model results contrasting northern Eurasia and North Amer- Writing Team, Pachauri, R. K. and Meyer, L. A., IPCC, Geneva,
ica, Environ. Res. Lett., 2, 045031, https://doi.org/10.1088/1748- Switzerland, 151 pp., 2014.
9326/2/4/045031, 2007. Jolly, W. M., Cochrane, M. A., Freeborn, P. H., Holden,
Goldammer, J. G., Stocks, B. J., Sukhinin, A. I., and Ponomarev, E.: Z. A., Brown, T. J., Williamson, G. J., and Bowman,
Current fire regimes, impacts and likely challenges – II: forest D. M. J. S.: Climate-induced variations in global wild-
fires in Russia – past and current trends, in: Vegetation Fires and fire danger from 1979 to 2013, Nat. Commun., 6, 7537,
https://doi.org/10.1038/ncomms8537, 2015.
Biogeosciences, 18, 2559–2572, 2021 https://doi.org/10.5194/bg-18-2559-2021W. M. Hao et al.: Wetter environment and increased grazing reduced the area burned in northern Eurasia 2571
Jones, P. D., Parker, D. E., Osborn, T. J., and Briffa, ture developments, Int. J. Appl. Earth Obs., 26, 64–79,
K. R.: Global and hemispheric temperature anoma- https://doi.org/10.1016/j.jag.2013.05.014, 2014.
lies: land and marine instrumental records (1850–2015), Nandintsetseg, B., Shinoda, M., Du, C., and Munkhjargal, E: Cold-
https://doi.org/10.3334/CDIAC/cli.002, 2016. season disasters on the Eurasian steppes: Climate-driven or man-
Kendall, M. G: A new measure of rank correlation, Biometrika, 30, made, Sci. Rep., 8, 14769, https://doi.org/10.1038/s41598-018-
81–93, 1938. 33046-1, 2018.
Kharuk, V. I., Ranson, K. Jon, and Dvinskaya, M. L.: Wildfires dy- NASA Global Climate Change, https://climate.nasa.gov/
namic in larch dominance zone, Geophys. Res. Lett., 35, L01402, vital-signs/global-temperature/ (last access: 12 September
https://doi.org/10.1029/2007GL032291, 2008. 2019), 2019.
Kloster, S., Mahowald, N. M., Randerson, J. T., Thornton, P. E., Neumann, M., Braun, A., Heinke, E.-M., Saqalli, M.,
Hoffman, F. M., Levis, S., Lawrence, P. J., Feddema, J. J., Ole- and Srbljinovic, A.: Challenges in modelling social
son, K. W., and Lawrence, D. M.: Fire dynamics during the conflicts: Grappling with polysemy, JASSS, 14, 9,
20th century simulated by the Community Land Model, Bio- https://doi.org/10.18564/jasss.1818, 2011.
geosciences, 7, 1877–1902, https://doi.org/10.5194/bg-7-1877- Otón, G., Ramo, R., Lizundia-Loiola, J., and Chuvieco,
2010, 2010. E.: Global detection of long-term (1982–2017) burned
Koerner, S. E. and Collins, S. L.: Interactive effects of graz- area with AVHRR-LTDR data, Remote Sens., 11, 2079,
ing, drought, and fire on grassland plant communities in https://doi.org/10.3390/rs11182079, 2019.
North America and South Africa, Ecology, 95, 98–109, Pachzelt, A., Forrest, M., Rammig, A., Higgins, S. I, and Hickler, T.:
https://doi.org/10.1890/13-0526.1, 2014. Potential impact of large ungulate grazers on African vegetation,
Krawchuk, M. A. and Moritz, M. A.: Constraints on global fire carbon storage and fire regimes, Global Ecol. Biogeogr., 24, 991–
activity vary across a resource gradient, Ecology, 92, 121–132, 1002, https://doi.org/10.1111/geb.12313, 2015.
https://doi.org/10.1890/09-1843.1, 2011. Palmer, W.: Meteorological drought, US Department of Commerce,
Lebed, L. V., Qi, J., and Heilman, P.: An ecological assess- Weather Bureau, Research Paper, 45, 58 pp., 1965.
ment of pasturelands in the Balkhash area of Kazakhstan Pausas, J. G. and Keeley, J. E.: Abrupt climate-independent
with remote sensing and models, Env. Res. Lett., 7, 025203, fire regime changes, Ecosystems, 17, 1109–1120,
https://doi.org/10.1088/1748-9326/7/2/025203, 2012. https://doi.org/10.1007/s10021-014-9773-5, 2014.
Liu, Yi. Y., Evans, J. P., McCabe, M. F., de Jeu, R. A. M., van Dijk, Pausas, J. G. and Ribeiro, E.: The global fire-productivity
A. I. J. M., Dolman, A. J., and Saizen, I.: Changing climate and relationship, Global Ecol. Biogeogr., 22, 728–736,
overgrazing are decimating Mongolian steppes, PLoS ONE, 8, https://doi.org/10.1111/geb.12043, 2013.
e57599, https://doi.org/10.1371/journal.pone.0057599, 2013. Perry, B. D., Grace, D., and Sones, K.: Current drivers
MANE: National Economy of the Republic of Kazakhstan Commit- and future directions of global livestock disease dy-
tee on Statistics, http://www.stat.gov.kz/faces/wcnav_externalId/ namics, Proc. Natl. Acad. Sci. USA. 110, 20871–20877,
homeNumbersAgriculture (last access: 9 April 2021), 2019. https://doi.org/10.1073/pnas.1012953108, 2013.
Marlon, J. R., Bartlein, P. J., Carcaillet, C., Gavin, D, G., Har- Pongratz, J., Dolman, H., Don, A., Erb, K.-H., Fuchs, R.,
rison, S. P., Higuera, P. E., Joos, F., Power, M. J., and Pren- Herold, M., Jones, C., Kuemmerle, T., Luyssaert, S.,
tice, I. C.: Climate and human influences on global biomass Meyfroidt, P., and Naudts, K.: Models meet data: Chal-
burning over the past two millennia, Nat. Geosci., 1, 697–702, lenges and opportunities in implementing land management
https://doi.org/10.1038/ngeo313, 2008. in earth system models, Glob. Change Biol., 24, 1470–1487,
Moritz, M. A., Morais, M. E., Summerell, L. A., Carlson, J. https://doi.org/10.1111/gcb.13988, 2018.
M., and Doyle, J.: Wildfires, complexity, and highly optimized Prestele, R., Arneth, A., Bondeau, A., de Noblet-Ducoudré, N.,
tolerance, Proc. Natl. Acad. Sci. USA, 102, 17912–17917, Pugh, T. A. M., Sitch, S., Stehfest, E., and Verburg, P.
https://doi.org/10.1073/pnas.0508985102, 2005. H.: Current challenges of implementing anthropogenic land-
Motesharrei, S., Rivas, J., Kalnay, E., Asrar, G. R., Busalacchi, use and land-cover change in models contributing to cli-
A. J., Cahalan, R. F., Cane, M. A, Colwell, R. R., Feng, K., mate change assessments, Earth Syst. Dynam., 8, 369–386,
Franklin, R. S., Hubacek, K., Miralles-Wilhelm, F., Miyoshi, T., https://doi.org/10.5194/esd-8-369-2017, 2017.
Ruth, M., Sagdeev, R., Shirmohammadi, A., Shukla, J., Srebric, R Core Team: R: A language and environment for statistical com-
J., Yakovenko, V. M., and Zeng, N.: Modeling sustainability: puting, R Foundation for Statistical Computing, Vienna, Austria.
population, inequality, consumption, and bidirectional coupling https://www.R-project.org/ (last access: 31 December 2020),
of the earth and human systems, Natl. Sci. Rev., 3, 470–494. 2019.
https://doi.org/10.1093/nsr/nww081, 2016. Reeves, M. C.: Development of the rangeland vegetation simulator:
Mouillot, F. and Field, C. B.: Fire history and the global carbon A module of the forest vegetation simulator, Final report to the
budget: a 1◦ × 1◦ fire history reconstruction for the 20th century, Joint Fire Science Program, Boise, Idaho, 2016.
Glob. Change Biol., 11, 398–420, https://doi.org/10.1111/j.1365- Reeves, M. C., Hanberry, B. B., Wilmer, H., Kaplan, N. E.,
2486.2005.00920.x, 2005. and Lauenroth, W. K.: An assessment of production trends on
Mouillot, F., Schultz, M. G., Yue, C., Cadule, P., Tansey, K., the Great Plains from 1984 to 2017, Rang. Ecol. Manage.,
Ciais, P., and Chuvieco, E.: Ten years of global burned https://doi.org/10.1016/j.rama.2020.01.011, 2020.
area products from spaceborne remote sensing – a re- Riley, K. L., Abatzoglou, J. T., Grenfell, I. C., Klene, A.
view: analysis of user needs and recommendations for fu- E., and Heinsch, F. A.: The relationship of large fire oc-
currence with drought and fire danger indices in the west-
https://doi.org/10.5194/bg-18-2559-2021 Biogeosciences, 18, 2559–2572, 2021You can also read