Nine residues in HLA DQ molecules determine with susceptibility and resistance to type 1 diabetes among young children in Sweden - Nature
←
→
Page content transcription
If your browser does not render page correctly, please read the page content below
www.nature.com/scientificreports
OPEN Nine residues in HLA‑DQ molecules
determine with susceptibility
and resistance to type 1 diabetes
among young children in Sweden
Lue Ping Zhao1*, George K. Papadopoulos2,10, Antonis K. Moustakas3, George P. Bondinas2,
Annelie Carlsson4, Helena Elding Larsson5, Johnny Ludvigsson6, Claude Marcus7,
Martina Persson8, Ulf Samuelsson6, Ruihan Wang9, Chul‑Woo Pyo9, Daniel E. Geraghty9 &
Åke Lernmark5
HLA-DQ molecules account over 50% genetic risk of type 1 diabetes (T1D), but little is known about
associated residues. Through next generation targeted sequencing technology and deep learning
of DQ residue sequences, the aim was to uncover critical residues and their motifs associated with
T1D. Our analysis uncovered (αa1, α44, α157, α196) and (β9, β30, β57, β70, β135) on the HLA-DQ
molecule. Their motifs captured all known susceptibility and resistant T1D associations. Three motifs,
“DCAA-YSARD” (OR = 2.10, p = 1.96*10−20), “DQAA-YYARD” (OR = 3.34, 2.69*10−72) and “DQDA-
YYARD” (OR = 3.71, 1.53*10−6) corresponding to DQ2.5 and DQ8.1 (the latter two motifs) associated
with susceptibility. Ten motifs were significantly associated with resistance to T1D. Collectively,
homozygous DQ risk motifs accounted for 43% of DQ-T1D risk, while homozygous DQ resistant motifs
accounted for 25% protection to DQ-T1D risk. Of the identified nine residues five were within or near
anchoring pockets of the antigenic peptide (α44, β9, β30, β57 and β70), one was the N-terminal of the
alpha chain (αa1), one in the CD4-binding region (β135), one in the putative cognate TCR-induced αβ
homodimerization process (α157), and one in the intra-membrane domain of the alpha chain (α196).
Finding these critical residues should allow investigations of fundamental properties of host immunity
that underlie tolerance to self and organ-specific autoimmunity.
Type 1 diabetes (T1D) is an autoimmune disease, due to the destruction of normal pancreatic islet beta-cells by
the host immune system, and accounts for the majority of all diabetes among young children1,2. Further, earlier
twin and family studies underline the major role of genetic factors together with environmental f actors1–4. Using
modern genotyping technologies, recent genome wide association studies (GWAS) have uncovered ~ 50 single
nucleotide polymorphisms (SNPs) in multiple non-HLA immune genes explaining probably less than 25% T1D
associations5–7. In contrast, class II genes in the human leukocyte antigen (HLA) system have been researched
for several decades, and strongly contribute to the genetic association with T1D, accounting for ~ 50% of genetic
association with T 1D8,9. Class II genes include the multiallelic HLA-DR*A1-B1 haplotype coding for the DRαβ
heterodimer (α-chain essentially monomorphic), and the HLA-DQ*A1-B1 haplotype coding the DQαβ heterodi-
mer. Due to their genetic proximity, HLA-DR and -DQ genes are in linkage disequilibrium (LD), and thus empiri-
cally separating their individual associations with T1D is challenging9–11. Conventionally, DQ molecules exhibit
1
Public Health Sciences Division, Fred Hutchinson Cancer Research Center, 1100 Fairview Ave NE, Seattle,
WA 98109, USA. 2Laboratory of Biophysics, Biochemistry, Biomaterials and Bioprocessing, Department of
Agriculture, Faculty of Agricultural Technology, University of Ioannina, Ioannina, Greece. 3Department of Food
Science and Technology, Faculty of Environmental Sciences, Ionian University, GR26100 Argostoli, Cephalonia,
Greece. 4Department of Pediatrics, Lund University, Lund, Sweden. 5Department of Clinical Sciences, Lund
University CRC, Skåne University Hospital, Malmö, Sweden. 6Department of Clinical and Experimental Medicine,
Crown Princess Victoria Children´S Hospital, Region Östergötland and Div of Pediatrics, Linköping University,
Linköping, Sweden. 7Department of Clinical Science and Education Karolinska Institutet and Institution of
Medicine, Clinical Epidemiology, Karolinska Institutet, Stockholm, Sweden. 8Department of Medicine, Clinical
Epidemiological Unit, Karolinska Institutet, Stockholm, Sweden. 9Clinical Research Division, Fred Hutchinson
Cancer Research Center, Seattle, WA, USA. 10George K. Papadopouls is retired. *email: lzhao@fredhutch.org
Scientific Reports | (2021) 11:8821 | https://doi.org/10.1038/s41598-021-86229-8 1
Vol.:(0123456789)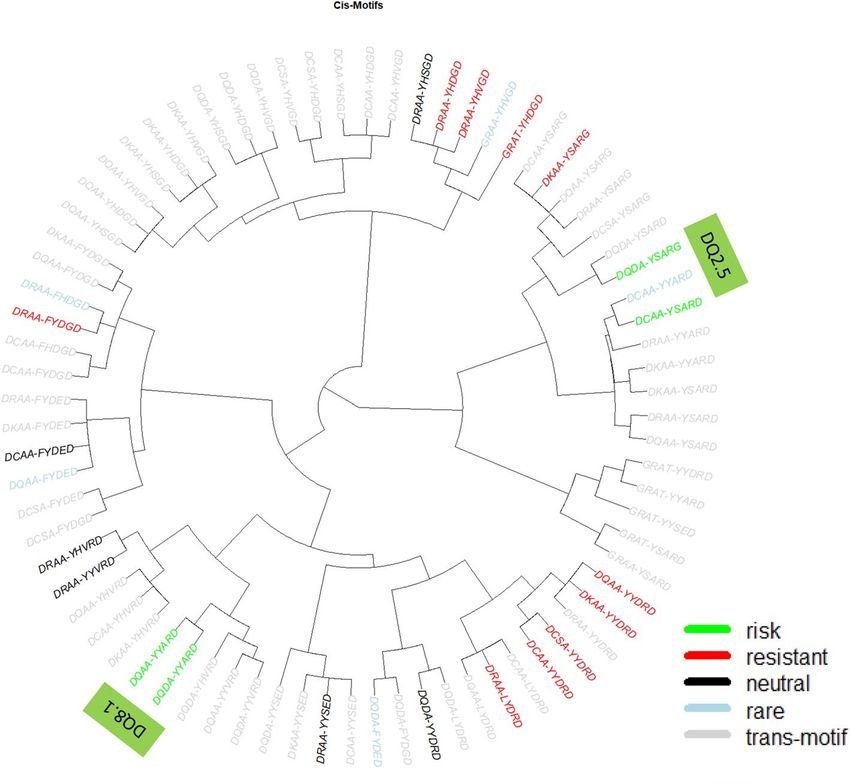
www.nature.com/scientificreports/
Figure 1. Phylogenic representation of all cis DQ motifs that are risk to (p < 0.05 and OR > 1, colored green),
resistant to (p < 0.05, OR < 1, colored red), neutral (p > 0.05, black), and rare (with fewer than 5 observed motif
copies, colored blue), together with all trans-DQ motifs (colored gray).
stronger empirical associations with T1D. Our recent effort focused on identification of specific DQ risk residues
among subjects with high-risk HLA-DQ haplotypes (DQ2.5 and DQ8.1)12 as well as those resistant residues
among subjects with low risk HLA-DQ h aplotypes13, complementing earlier works on HLA-DR m olecules14,15.
Integrating susceptible and resistant DQ residues, the current investigation was to explore their genotypic
associations with T1D, especially, assessing heterodimeric associations with DQA1 and DQB1 alleles on the
same chromosome (cis) and between homologous chromosomes (trans), with specific focus on the DQ2.5 and
DQ8.1 haplotypes. Furthermore, we assessed if DR3 and DR4, two major risk alleles of HLA-DRB1, confounded
HLA-DQ associations with T1D through haplotypic association analysis. To gain insight into autoimmunity, we
centered our analysis on DQ motif associations with six biochemically defined islet autoantibodies measured
at the time of T1D diagnosis16. To replicate discovered associations, we utilized a case–control study from the
Type 1 Diabetes Genetic Consortium (T1DGC) to carry out T1D associations with discovered motifs17. Last, in
a final analysis we estimated how much susceptibility and resistant DQ motifs contributed to either the excess
or reduction of risk for T1D.
Results
Critical residues among subjects with risk or resistant DQ haplotypes. DQA1 and DQB1, which
are in high LD and their alleles mostly form cis-haplotypes, are translated to form respectively the alpha and beta
chain of the heterodimeric HLA-DQ molecule. DQ haplotypes were polymorphic and had 45 unique haplotypes
in our case–control study, each of which consisted of unique residues (complete lists of amino acid sequences of
mature molecules in Supplementary Figs. S1 and S2). Our phylogenic analysis of sequence similarities showed
that these DQ haplotypes were hierarchically organized into seven haplotype clusters; 1 to 7 (Fig. 1). Clusters
2 and 4 included susceptible motifs DQ2.5 and DQ8.1 (motifs colored green), and carriers of all DQ motifs in
these two clusters were at high T1D risk. Among high-risk subjects, hierarchically organized haplotype (HOH)
analysis identified three critical residues (α44, β57, β135) that captured disease association with HLA-DQ among
subjects with high-risk DQ haplotypes12. The remaining clusters included largely resistant DQ haplotypes, and
the HOH analysis of subjects revealed seven critical residues (αa1, α156, α196, β9, β30, β57, β70) that accounted
for autoimmunity in T1D13.
Scientific Reports | (2021) 11:8821 | https://doi.org/10.1038/s41598-021-86229-8 2
Vol:.(1234567890)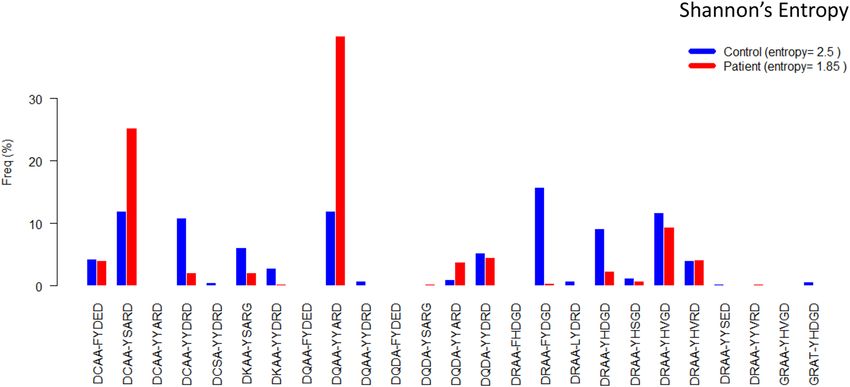
www.nature.com/scientificreports/
Residue AA High Risk Carrie rs Low Risk Carrie rs
Control Pa ent OR HS p Control Pa ent OR HS p
1) αa1 D 441 (34.67) 1404 (72.97) 2.10 20.28 1.84E-91 822 (64.62) 519 (26.98) 0.42 -19.97 9.79E-89
G 9 ( 0.71) 1 ( 0.05) 0.07 -2.97 2.99E-03
2) α44 C 153 (12.03) 485 (25.21) 2.10 9.26 1.96E-20 202 (15.88) 120 (6.24) 0.39 -8.90 5.42E-19
K 114 (8.96) 46 (2.39) 0.27 -8.23 1.85E-16
Q 174 (13.68) 873 (45.37) 3.32 19.74 1.00E-86 70 (5.5) 63 (3.27) 0.60 -3.01 2.59E-03
R 559 ( 43.95) 337 ( 17.52) 0.40 -16.20 5.20E-59
3) α157 A 420 (33.02) 1300 (67.57) 2.05 18.15 1.27E-73 763 (59.98) 457 (23.75) 0.40 -19.98 7.83E-89
D 21 (1.65) 104 (5.41) 3.27 5.33 9.57E-08 61 (4.80) 63 (3.27) 0.68 -2.12 3.43E-02
S 7 ( 0.55)
4) α196 A 441 (34.67) 1404 (72.97) 2.10 20.28 1.84E-91 823 (64.70) 519 (26.98) 0.42 -20.02 3.63E-89
T 8 ( 0.63) 1 ( 0.05) 0.08 -2.73 6.38E-03
5) β9 F 260 ( 20.44) 85 ( 4.42) 0.22 -13.87 9.44E-44
L 9 ( 0.71) 1 ( 0.05) 0.07 -3.25 1.14E-03
Y 441 (34.67) 1404 (72.97) 2.10 20.28 1.84E-91 562 (44.18) 434 (22.56) 0.51 -12.53 5.25E-36
6) β30 H 344 ( 27.04) 320 ( 16.63) 0.61 -7.34 2.09E-13
S 231 (18.16) 532 (27.65) 1.52 6.37 1.85E-10
Y 210 (16.51) 872 (45.32) 2.75 17.83 4.45E-71 487 (38.29) 200 (10.40) 0.27 -17.91 1.02E-71
7) β57 A 392 (30.82) 1370 (71.21) 2.31 21.12 5.46E-99 5 (0.39) 7 (0.36) 0.93 -0.13 8.94E-01
D 49 (3.85) 34 (1.77) 0.46 -3.54 3.93E-04 603 (47.41) 230 (11.95) 0.25 -20.83 2.23E-96
S 19 ( 1.49) 17 ( 0.88) 0.59 -1.61 1.08E-01
V 204 ( 16.04) 266 ( 13.83) 0.86 -1.76 7.80E-02
8) β70 E 61 ( 4.80) 79 ( 4.11) 0.86 -0.94 3.47E-01
G 493 ( 38.76) 248 ( 12.89) 0.33 -16.58 8.99E-62
R 441 (34.67) 1404 (72.97) 2.10 20.28 1.84E-91 277 (21.78) 193 (10.03) 0.46 -8.86 7.76E-19
9) β135 D 363 (28.54) 1357 (70.53) 2.47 21.65 6.06E-104 831 (65.33) 520 (27.03) 0.41 -20.28 1.84E-91
G 78 (6.13) 47 (2.44) 0.40 -5.20 2.00E-07
Table 1. Results from association analysis of nine selected residues (αa1, α44, α157, α196, β9, β930, β57, β70,
β135) with T1D in the case-control study with 636 control and 962 patients with estimated allelic frequencies
(%), odds ratio, hap-score and p-value among carriers of DQ2.5 and DQ8.1 and non-carriers.
Four alpha and five beta residues were critically associated with T1D risk. Integrating all risk and
resistant residues in the DQ molecule led to four alpha residues (αa1, α44, α157, α196) and five beta residues
(β9, β30, β57, β70, β135) that were critically associated with either susceptibility or resistance to T1D. To assess
roles of these residues in T1D associations, we investigated residue-specific frequencies of corresponding amino
acids between controls and patients, who had high and low DQ risk haplotypes (Table 1). Residue α44 took
four possible amino acids (C, K, Q, R); α44C and Q were strongly associated with high T1D risks (OR = 2.10
and 3.32, p = 1.96*10−20 and 1.00*10−86, respectively), α44K was strongly associated with resistance to T1D risk
(OR = 0.27, p = 1.85)13 and α44R was absent among high-risk DQ subjects. Among low risk DQ subjects, the
resistant α44C and Q had significant associations with resistance to T1D risk (OR = 0.39 and 0.6, p = 5.42*10−19
and 2.59*10−3, respectively), and the residue α44R was highly associated with the resistance to T1D (OR = 0.40
and p-value = 5.20*10−59). Interestingly, the amino acid α44K was absent in low risk subjects. When contrasting
the associations of α44C and Q between high and low risk subjects, their differences of risk and resistant associa-
tions were highly significant (exact Fisher’s p-value = 2.16*10−31 and 1.92*10−19, respectively). On the other hand,
the beta chain residues β57A (OR = 2.31; p = 5.46*10−99) and D (OR = 0.46; 3.93*10−4) had reverse associations
with T1D risk among high-risk subjects. Among the low risk subjects, the first residue, β57A, had no significant
association to T1D risk (OR = 0.93, p = 0.89), while the second residue, β57D, was associated with resistance to
T1D (OR = 0.25, p = 2.23*10−96). Two amino acids, β57S/V, were absent among high-risk subjects and had no
associations (p = 0.11 and 0.78, respectively). Last, β135D and G had opposite associations with T1D high-risk
subjects (OR = 2.47 and 0.40, p = 6.06*10−104 and 2.00*10−7, respectively). Among the low risk subjects, β135D
had significant resistance to T1D (OR = 0.41, p = 1.84*10−91), while β135G was absent. The disease associations
with residue β135D were completely opposite to each other between high and low risk subjects (Fisher’s exact
test; p = 2.88*10−117).
From the perspective of resistant residues, αa1D and G among low risk subjects were significantly associated
with resistance to T1D (OR = 0.42 and 0.07, p = 9.79*10−89 and 2.99*10−3, respectively). Among high-risk subjects,
residue αa1D had significant association with susceptibility to T1D (OR = 2.10, p = 1.84*10−91), while αa1G was
absent. The association with αa1D was significantly different between low and high-risk subjects (exact Fisher’s
Scientific Reports | (2021) 11:8821 | https://doi.org/10.1038/s41598-021-86229-8 3
Vol.:(0123456789)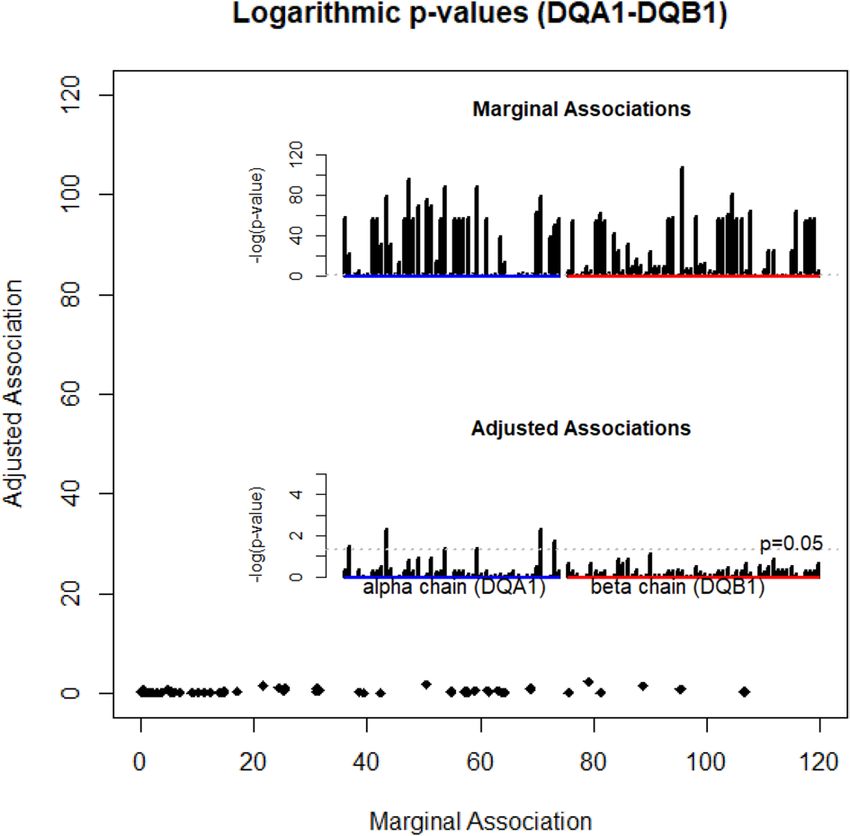
www.nature.com/scientificreports/
α157
α196
β135
ID cis Mof Control Paent OR Z p Sera Allele Group
α44
αa1
β30
β57
β70
β9
1 DCAA-FYDED 55 (4.32) 77 (4.00) 0.93 -0.45 6.53E-01 DQ4 *04:02-*04:02~*04:01-*04:02~*04:04-*04:02 . C A. F . . E .
2 DCAA-YSARD 153 (12.03) 485 (25.21) 2.10 9.26 1.96E-20 DQ2.5 *05:01-*02:01~*05:05-*02:01 . C A. . S A. .
1
3 DCAA-YYDRD 139 (10.93) 40 (2.08) 0.19 -10.41 2.32E-25 DQ7 allele group . C A. . . . . .
4 DCSA-YYDRD 7 ( 0.55) *05:03-*03:01 . C S . . . . . .
5 DKAA-YSARG 78 ( 6.13) 41 ( 2.13) 0.35 -5.76 8.47E-09 DQ2.2 *02:01-*02:02 . K A. . S A. G
6 DKAA-YYDRD 36 ( 2.83) 5 ( 0.26) 0.09 -6.36 1.99E-10 DQ9.2 *02:01-*03:03 . K A. . . . . .
7 DQAA-YYARD 152 (11.95) 769 (39.97) 3.34 17.98 2.69E-72 DQ8.1 *03:01-*03:02~*03:01-*03:04~*03:01-*03:05 . . A. . . A. .
8 DQAA-YYDRD 9 ( 0.71) DQ7.3 *03:01-*03:01~*03:01-*03:03 . . A. . . . . .
9 DQDA-YSARG 6 ( 0.31) DQ2.3 *03:02-*02:02 . . . . . S A. G
10 DQDA-YYARD 13 (1.02) 73 (3.79) 3.71 4.81 1.53E-06 DQ8.1 *03:02-*03:02~*03:02-*03:04 . . . . . . A. .
3
11 DQDA-YYDRD 67 (5.27) 88 (4.57) 0.87 -0.87 3.82E-01 *03:02-*03:03~*03:03-*03:01 DQDA Y Y DR D
12 DRAA-FYDGD 201 ( 15.8) 8 ( 0.42) 0.03 -16.39 2.25E-60 DQ6.2 *01:02-*06:02 . R A . F . . G.
13 DRAA-LYDRD 9 ( 0.71) 1 ( 0.05) 0.07 -3.25 1.14E-03 *01:03-*06:01 . R A . L . . . .
14 DRAA-YHDGD 117 (9.2) 44 (2.29) 0.25 -8.86 7.72E-19 DQ6.3 allele group2 . R A . . H. G.
15 DRAA-YHSGD 16 ( 1.26) 15 ( 0.78) 0.62 -1.36 1.75E-01 *01:02-*05:02 . R A . . HS G.
16 DRAA-YHVGD 149 (11.71) 180 (9.36) 0.80 -2.15 3.12E-02 *01:01-*05:01~*01:02-*05:01 . R A . . HV G.
17 DRAA-YHV RD 52 ( 4.09) 80 ( 4.16) 1.02 0.10 9.22E-01 DQ6.4 *01:02-*06:04 . R A . . HV . .
18 DRAA-YYSED 3 ( 0.24) 2 ( 0.10) 0.44 -0.92 3.55E-01 *01:02-*05:04 . R A . . . S E .
19 DRAA-YYV RD 2 ( 0.16) 6 ( 0.31) 1.98 0.86 3.91E-01 *01:02-*06:09 . R A . . . V . .
20 GRAT-YHDGD 8 ( 0.63) 1 ( 0.05) 0.08 -2.73 6.38E-03 *01:04-*05:03 GR A T Y H. G.
1) allele group: *05:05-*03:01~*05:05-*03:19~*05:05-*03:09~ *05:10-*03:01~*05:09-*03:01~*06:01-*03:01~ *04:01-*03:03
2) allele group: *01:01-*05:03~*01:03-*06:03~*01:02-*06:03~ *01:07-*05:03~*01:10-*06:03. The combina on
DQA1*01:07-B1*05:03 cannot appear, bound with an an genic pep de, on the cell membrane of an APC because of
α 70
β
combina on DQA1*01:07-B1*06:04, not found here in cis may be allowed in trans
3) mo f ID=11: DQDA-YYDRD is selected as a reference mo f
Table 2. Allelic association analysis of type 1 diabetes with DQA1-DQB1 motifs of (αa1, α44, α157, α196, β9,
β30, β57, β70, β135): estimated frequency (%) among control and patient, estimated odds ratios, Z-score, and
p-value, corresponding serotype, and equivalent allelic groups, in addition to profiles of amino acids across all
motifs Five rare motifs, with fewer five observed motif copies, are excluded. In total we have 1266 and 1921
motif copies observed in 636 controls and 962 patients, respectively, after excluding 6 and 3 motif copies from
respective groups.
p = 7.87*10−102). The next residue α157 took three possible amino acids (A, D, S); the first two, α157A/D, had
significant resistance associations (OR = 0.40 and 0.68, p = 7.83*10−89 and 0.034, respectively), while α157S was
absent among patients but had seven allelic copies among controls with low risk DQ haplotypes. Among high-risk
subjects, α157A/D were significantly associated with susceptibility to T1D (OR = 2.05 and 3.27, p = 1.27*10−73 and
9.57*10−8, respectively), while the third residue, α157S, was absent. Again, T1D risk associations with α157A/D
were significantly different between low- and high-risk subjects (exact Fisher’s p = 9.18*10−97 and 4.93*10−8,
respectively). The next residue, β9, had three amino acids associated with resistance (F, L, Y; OR = 0.22, 0.07 and
0.51, p = 9.44*10−44, 1.14*10−3 and 5.25*10−36, respectively) among low-risk subjects. Among high-risk subjects,
β9F and L were absent, while β9Y was associated with T1D risk (OR = 2.10, p = 1.84*10−91), and the association
was significantly different between high and low risk (exact Fisher’s p = 3.74*10−66). Among low-risk subjects, resi-
due β30 had two resistant amino acids β30H/Y (OR = 0.61 and 0.27, p = 2.09*10−13 and 1.02*10−71, respectively),
and β30S was not observed in such carriers. Among high-risk subjects, β30S/Y had significant associations with
susceptibility to T1D (OR = 1.52 and 2.75, p = 1.85*10−10 and 4.45*10−71, respectively), but β30H was not observed
in these subjects. For amino acid β30Y, its association with T1D was significantly different between low- and
high-risk subjects (Fisher’s exact test; p = 7.62*10−106). The ninth residue, β70, had two amino acids significantly
associated with resistance, G and R (OR = 0.33 and 0.46, p = 7.76*10−19 and 1.84*10−91, respectively), and had one
amino acid, β70E, with a neutral association (OR = 0.86, p = 0.34) among low-risk subjects. No high-risk subjects
were found with β70E or G, while β70R was significantly associated with T1D (OR = 2.10, p = 1.84*10−91), and
its association was significantly different between high- and low-risk subjects (exact Fisher’s p = 2.19*10−45).
In summary, all these nine residues had highly significant associations with T1D among subjects with either
low- or high-risk DQ haplotypes. Strikingly, the same amino acids could exhibit paradoxical associations between
low- and high-risk subjects. Further, some of common amino acids in the high-risk group are absent from the
low-risk group, and vice-versa. Note that some motifs listed in Table 2 had fewer than 10 observed copies, e.g., ID
13, 18, 19 and 20, and their associated p-values were not robust enough and should be taken as suggestive values.
Motifs of nine residues account for DQ susceptibility and resistance to type 1 diabetes
risks. Four alpha residues and five beta residues originated from transcription in cis and haplotypes of these
nine amino acids are referred to as cis DQ motifs. In total, there were 25 unique DQ motifs: four susceptibility
Scientific Reports | (2021) 11:8821 | https://doi.org/10.1038/s41598-021-86229-8 4
Vol:.(1234567890)www.nature.com/scientificreports/
motifs (highlighted in green), ten resistance motifs (highlighted in red), and six neutral motifs with insignificant
associations (p-values > 0.05) (Table 2). Five rare motifs with fewer than five observations were shown only in the
Supplementary Table S1. The motif “DCAA-YSARD”, corresponding to DQA1*05:01-B1*02:01 and A1*05:05-
B1*02:01, was significantly associated with susceptibility to T1D (OR = 2.10, p = 1.96*10−20), and is equivalent to
the traditionally known DQ2.5 serotype. The motifs “DQAA-YYARD” and “DQDA-YYARD”, corresponding to
traditionally known DQ8.1 serotypes, had significant association with T1D susceptibility (OR = 3.34 and 3.71,
p = 2.69*10−72 and 1.53*10−6, respectively). Last, the susceptible motif “DQDA-YSARG” was absent among con-
trols and had six copies with allelic frequency of 0.31% among patients.
Among twenty HLA-DQ motifs, ten were associated with resistance to T1D. The motif “DRAA-FYDGD”,
uniquely corresponding to the well-known protective DQ6.2 haplotype, conveyed significant resistance to T1D
risk (OR = 0.03, p = 2.25*10−60). The next resistance motif “DCAA-YYDRD”, motif 3, corresponding to a group
of HLA-DQ haplotypes listed in the footnote, was significantly resistant to T1D (OR = 0.19, p = 2.32*10−25). The
third most protective motif, “DRAA-YHDGD”, was associated with resistance to T1D (OR = 0.25, p = 7.72*10−19).
The other five protective motifs were “DKAA-YSARG”, “DKAA-YYDRD”, “DRAA-LYDRD”, “DRAA-YHVGD”
and “GRAT-YHDGD”, with p-values less than 0.05. Two motifs, “DCSA-YYDRD” and “DQAA-YYDRD”, were
observed (with more than five copies) only among controls (Table 2).
Given the substantially different genetic distributions of residues between low- and high-risk subjects
(Table 1), we assessed motif associations stratified by low or high DQ risks. As expected, distributions of DQ
motifs were rather distinct between subjects with low and high DQ risks (Table S1). The most of commonly
observed motifs were specific to subjects with high or low risk DQ haplotypes, and their associations with T1D
were largely consistent with those in the combined low and high-risk subjects. For example, the motif “DCAA-
YSARD” was observed only among high-risk subjects, and “DCAA-YYDRD” was observed only among low
risk subjects. Hence, in all combined data, their respective association with susceptibility or resistance for T1D
were largely unchanged. One exception, to this general observation, was the motif “DQDA-YYARD”, which was
significantly associated with susceptibility to T1D risk among high-risk subjects (OR = 4.56, p = 4.30*10−7) but
was relatively uncommon among low risk subjects and showed no indication of associations with T1D risks
(OR = 0.88, p = 0.87).
Subtle variations of residues alter association profiles with T1D. The directly constructed pro-
file of disease-associated motifs permitted us to examine how subtle variations of specific residues may alter
their T1D associations (right panel of Table 2). The motif “DCAA-YSARD”, corresponding to DQ2.5, differed
from the adjacent motif “DCAA-YYDRD” with only two residues at β30 and β57, but their T1D associations
were completely opposite and reverted from susceptibility to resistance (OR = 2.10 and 0.19, p = 1.96*10−20 and
2.32*10−25, respectively), the difference between the two was significant (Fisher’s extact test; p = 4.24*10−39). The
next motif pair “DQAA-YYARD”, corresponding to DQ8.1, and “DKAA-YYDRD”, differed only at α44 and β57,
and their T1D associations were opposite (OR = 3.34 and 0.09, p = 2.69*10−72 and 1.99*10−10, respectively), the
difference was significant (Fisher’s exact test; p = 5.04*10−22). The next DQ8.1 motif “DQDA-YYARD” differed
from the adjacent motif “DQDA-YYDRD” only at residue β57, but the former was associated with susceptibility
to T1D (OR = 3.71, p = 1.53*10−6) and the other was neutral (OR = 0.87, p = 0.38). The difference of the associa-
tions between these two motifs was significant (Fisher’s extact test; p = 7.48*10−6). It was also of interest to con-
trast the uncommon motif 8, “DQAA-YYDRD”, with motif 7, “DQAA-YYARD”, and they were nearly identical
except for β57. In fact, all five alleles in both motifs had an identical alpha chain, DQA1*03:01. Their associations
differed significantly from each other (Fisher’s exact test; p = 1.16*10−7).
Genotypes of DQ motifs have profound associations with T1D. Each subject carries a pair of DQ
motifs, i.e., a motif genotype, and two motifs were jointly associated with T1D. The combination of 20 motifs
(Tables 2 and S2) resulted in several rare genotypes with fewer than 5 observations. Upon merging of all rare
genotypes into a single category, there was a total of 60 distinct genotypes (Table S2), and 25 were deemed to
have neutral associations with corresponding p-values greater than 0.05. The genotype association results for 35
genotypes were sorted by Z-scores (Table 3). The first eight genotypes were significantly associated with suscep-
tibility to T1D, with OR ranging from 2.46 to 14.54 (p-values ranged from 0.012 to 4.14*10−21). Next thirteen
genotypes were significantly associated with resistance to T1D risk with OR ranging from 0.07 to 0.30 (p-values
ranged from 0.038 to 3.69*10−9). The last fourteen genotypes, which had frequencies of five or more copies were
observed among controls, and none were among patients, and were thus deemed to be highly resistant, perhaps
protective, to T1D risks.
DQ2.5 and DQ8.1 genotypic effects. Out of 20 common DQ motifs, three motifs “DCAA-YSARD”,
“DQAA-YYARD” and “DQDA-YYARD”, and the relatively uncommon “DQDA-YSARG”, were significantly
associated with susceptibility to T1D. Given their susceptibilities, it was important to investigate specific geno-
type associations of these three DQ motifs, with themselves (homozygotes), with each other (doubly heterozy-
gote), with neutral motifs (showing motif-specific effect), and with resistant motifs (showing additive motif
effect); neutral motifs included all motifs with associated p-values greater than 0.05 and resistant motifs with
p-values less than 0.05 and odds ratios less than 1. We conducted a univariate association analysis to compare
each genotype compared to all other genotypes combined through a logistic regression model, estimating coef-
ficient, odds ratio, standard error, Z score and p-value (Table 4).
Pairing the motif “DCAA-YSARD” (DQ2.5) with neutral motifs, itself, two DQ8.1 motifs and resistant motifs
resulted in five possible genotypes (Table 4). The heterozygote with neutral motifs showed a significant associa-
tion with susceptibility to T1D (OR = 2.54, p = 0.035), which was largely due to the motif “DCAA-YSARD”. As
Scientific Reports | (2021) 11:8821 | https://doi.org/10.1038/s41598-021-86229-8 5
Vol.:(0123456789)www.nature.com/scientificreports/
DQ Mof Genotype Control Paent OR Z p
1 DCAA-YSARD/DQAA-YYARD 21 (3.3) 269 (27.96) 8.47 9.43 4.14E-21
2 DQAA-YYARD/DQAA-YYARD 5 (0.79) 97 (10.08) 12.83 5.56 2.64E-08
3 DQAA-YYARD/DRAA-YHVGD 13 (2.04) 83 (8.63) 4.22 4.83 1.38E-06
4 DCAA-FYDED/DQAA-YYARD 9 (1.42) 48 (4.99) 3.53 3.47 5.22E-04
5 DCAA-YSARD/DCAA-YSARD 10 (1.57) 46 (4.78) 3.04 3.19 1.43E-03
6 DQAA-YYARD/DRAA-YHVRD 11 (1.73) 41 (4.26) 2.46 2.66 7.91E-03
7 DCAA-YSARD/DQDA-YYARD 1 (0.16) 22 (2.29) 14.54 2.62 8.83E-03
8 DQAA-YYARD/DQDA-YYARD 1 (0.16) 20 (2.08) 13.22 2.52 1.17E-02
9 DCAA-YYDRD/DCAA-YYDRD 7 (1.1) 2 (0.21) 0.19 -2.08 3.77E-02
10 DCAA-FYDED/DRAA-YHDGD 8 (1.26) 2 (0.21) 0.17 -2.28 2.28E-02
11 DKAA-YYDRD/DQAA-YYARD 8 (1.26) 1 (0.1) 0.08 -2.35 1.87E-02
12 DQDA-YYDRD/DRAA-YHDGD 9 (1.42) 1 (0.1) 0.07 -2.48 1.32E-02
13 DCAA-YSARD/DCAA-YYDRD 16 (2.52) 6 (0.62) 0.25 -2.91 3.58E-03
14 DRAA-YHVGD/DRAA-YHVGD 13 (2.04) 3 (0.31) 0.15 -2.94 3.33E-03
15 DRAA-YHDGD/DRAA-YHVGD 13 (2.04) 2 (0.21) 0.10 -3.01 2.62E-03
16 DCAA-YSARD/DRAA-YHDGD 16 (2.52) 4 (0.42) 0.17 -3.22 1.28E-03
17 DCAA-YYDRD/DRAA-YHVGD 16 (2.52) 2 (0.21) 0.08 -3.32 8.86E-04
18 DCAA-YYDRD/DRAA-YHDGD 17 (2.67) 3 (0.31) 0.12 -3.43 6.02E-04
19 DRAA-FYDGD/DRAA-YHVGD 25 (3.93) 1 (0.1) 0.03 -3.56 3.68E-04
20 DQAA-YYARD/DRAA-FYDGD 29 (4.56) 6 (0.62) 0.14 -4.44 9.18E-06
21 Rare Genotypes (www.nature.com/scientificreports/
First Mof Second Mof Control paent Coef OR SE Z p
DCAA-YSARD Neutral 21 (3.3) 47 (4.89) 0.93 2.54 0.44 2.11 3.48E-02
(DQ2.5) DCAA-YSARD 10 (1.57) 46 (4.78) 1.65 5.21 0.50 3.32 8.97E-04
DQAA-YYARD 21 (3.3) 269 (27.96) 2.68 14.52 0.42 6.36 1.99E-10
DQDA-YYARD 1 (0.16) 22 (2.29) 3.22 24.93 1.08 2.97 2.95E-03
Resistant 87 (13.68) 53 (5.51) -0.37 0.69 0.39 -0.94 3.48E-01
DQAA-YYARD Neutral 34 (5.35) 122 (12.68) 1.40 4.07 0.40 3.47 5.14E-04
(DQ8.1) DQAA-YYARD 5 (0.79) 97 (10.08) 3.09 21.99 0.58 5.33 9.64E-08
DQDA-YYARD 1 (0.16) 20 (2.08) 3.12 22.67 1.08 2.88 3.99E-03
Resistant 86 (13.52) 162 (16.84) 0.76 2.13 0.38 2.00 4.51E-02
DQDA-YYARD Neutral 1 (0.16) 13 (1.35) 2.69 14.73 1.10 2.45 1.42E-02
(DQ8.1) DQDA-YYARD 0 (0) 0 (0)
Resistant 10 (1.57) 18 (1.87) 0.71 2.04 0.53 1.34 1.79E-01
Neutral Neutral 17 (2.67) 15 (1.56) -0.13 0.88 0.35 -0.35 7.24E-01
Table 4. Results from the univariate association analysis for three high risk DQ motifs (DQ2.5: DCAA-YSARD,
DQ8.1: DQAA-YYARD and DQ8.1: DQDA-YYARD), after accounting for all neutral and resistant motifs.
Numbers and frequence percentages of genotype groups are listed for controls and patients, and so are estimated
coef (log odds ratio), standard error, Z score, and p-value. The reference genotype is the specific genotype versus
all others.
contribution of the motif “DQAA-YYARD” to T1D, with a significant association with susceptibility to T1D
(OR = 4.07, p = 5.14*10−4). The homozygote had much elevated association with T1D susceptibility (OR = 21.99,
p = 9.64*10−9). The heterozygote with another DQ8.1 “DQDA-YYARD” was also highly associated with increased
susceptibility (OR = 22.67, p = 3.99*10−3). Last, the heterozygote with resistant motifs had much weaker associa-
tion (OR = 2.13, p = 0.014), because resistant motifs compromised some of disease associations but not to the
same extent (ORs from 0.03 to 0.35, Table 2).
Examining in the same manner another DQ8.1 motif, motif 10, i.e. “DQDA-YYARD”, its heterozygote with
neutral motifs had significant association with T1D susceptibility (OR = 14.73, p = 0.0142), which captured its sole
contribution. There were no homozygotes in this relatively large study population, since the expected genotype
frequency is in the order of 1.44*10−3. The heterozygote with resistant motifs showed insignificant association
with T1D risk (OR = 2.04, p = 0.18), probably due to relatively low genotypic frequency.
By estimated odds ratios, the heterozygote “DCAA-YSARD/DQAA-YYARD” had an OR of 14.52, which was
slightly greater than the product of individual contributions 10.34 (= 2.54 × 4.07) from “DCAA-YSARD/neutral”
and “DQAA-YYARD/neutral”, respectively. Similarly, the heterozygote “DCAA-YSARD/DQDA-YYARD” had
an OR of 24.93, which was slightly less than the product of individual contributions 37.41 (= 2.54 × 14.73) from
“DCAA-YSARD/neutral” and “DQDA-YYARD/neutral”.
Expression in trans of DQA1 and DQB1 motifs enriches cellular diversity of DQ heterodimers
but has limited associations with T1D. Heterodimeric formation of the DQ molecule with doubly het-
erozygous DQA1 and DQB1 genotypes could produce four different DQ molecules: two cis-formations with
alleles on the same chromosome and two trans-formations across homologous chromosomes, which may not
be observed experimentally, as some are structurally prohibited18 (see also Fig. 1). For homozygotes or semi-
homozygotes, DQA1-B1 motifs on different chromosomes, formed trans-DQ motifs (whenever structurally
allowed) that were the same as those cis-DQ motifs. In total, in trans-formation created 73 DQ motifs, of which
48 were new -DQ motifs, several of which were structurally forbidden18–20 (see Supplementary Table S3). In a
systematic assessment of all trans-motifs, we evaluated potential conditional association of each trans-motif
with T1D, after adjusting for all cis-motifs. After excluding trans-motifs with fewer than five copies, we reported
conditional associations with 45 trans-motifs. Most of trans-motifs did not exhibit any meaningful adjusted
associations, with a few exceptions, e.g., “DQDA-YYARD” (p = 0.01) (see Supplementary Table S3). The many
permitted trans-motifs are indicated in the column “Prmt”. In the table, estimated coefficient quantifies adjusted
log odds ratio for cis-motifs, together with estimated standard error, Z-score and p-value. Should there be an
interest in marginally estimated odds ratio, it was possible to take the ratio of patient and control trans-motif
frequencies. For example, the trans-motif 24 “DQAA-YSARD” had the marginal odds ratio of 8.37, but the
adjusted odds ratio was 1.26, which was not significantly different from null (p-value = 0.387), because associated
cis-motifs explained most of the risk associations. In summary, trans-motifs did not appear to exhibit additional
associations, after accounting for all 25 cis-motifs. However, this empirical result from the conditional adjust-
Scientific Reports | (2021) 11:8821 | https://doi.org/10.1038/s41598-021-86229-8 7
Vol.:(0123456789)www.nature.com/scientificreports/
ID DR DQ Control Paent OR Z p
1 *01 DRAA-YHVGD 136 (10.69) 173 (8.99) 0.84 -1.59 1.11E-01
2 *03 DCAA-YSARD 153 (12.03) 485 (25.21) 2.10 9.26 1.96E-20
3 *04:01 DQAA-YYARD 71 (5.58) 593 (30.82) 5.52 17.69 4.94E-70
4 *04:01 DQDA-YYARD 7 (0.55) 45 (2.34) 4.25 3.94 7.98E-05
5 *04:01 DQDA-YYDRD 41 (3.22) 55 (2.86) 0.89 -0.57 5.67E-01
6 *04:02 DQAA-YYARD 7 (0.55) 27 (1.40) 2.55 2.25 2.47E-02
7 *04:03 DQAA-YYARD 11 (0.86) 2 (0.10) 0.12 -3.31 9.18E-04
8 *04:04 DQAA-YYARD 61 (4.8) 146 (7.59) 1.58 3.10 1.91E-03
9 *04:05 DQDA-YYARD 3 (0.24) 23 (1.20) 5.07 2.97 2.99E-03
10 *04:07 DQDA-YYDRD 9 (0.71) 1 (0.05) 0.07 -3.28 1.05E-03
11 *07 DKAA-YSARG 78 (6.13) 41 (2.13) 0.35 -5.76 8.47E-09
12 *07 DKAA-YYDRD 36 (2.83) 5 (0.26) 0.09 -6.36 1.99E-10
13 *08 DCAA-FYDED 55 (4.32) 76 (3.95) 0.91 -0.52 6.00E-01
14 *09 DQDA-YYDRD 10 (0.79) 28 (1.46) 1.85 1.72 8.57E-02
15 *11 DCAA-YYDRD 89 (7.00) 20 (1.04) 0.15 -8.99 2.57E-19
16 *12 DCAA-YYDRD 29 (2.28) 14 (0.73) 0.32 -3.67 2.45E-04
17 *13 DCAA-YYDRD 11 (0.87) 5 (0.26) 0.30 -2.38 1.73E-02
18 *13 DRAA-YHDGD 91 (7.15) 39 (2.03) 0.28 -7.28 3.38E-13
19 *13 DRAA-YHVRD 52 (4.09) 80 (4.16) 1.02 0.10 9.22E-01
20 *14 DRAA-YHDGD 20 (1.60) 4 (0.21) 0.13 -4.46 8.09E-06
21 *15 DRAA-FYDGD 197 (15.49) 8 (0.42) 0.03 -16.24 2.49E-59
22 *16 DRAA-YHSGD 14 (1.10) 13 (0.68) 0.61 -1.29 1.97E-01
Table 5. Haplotype association analysis of type 1 diabetes with HLA-DRB1 and DQA1/B1: estimated haplotype
frequency (%) among control and patient, estimated odds ratio, Z-score, and p-value, for those haplotypes with
five or more copies.
ment did not exclude their potential biological associations between trans DQ motifs and T1D as the cellular
expression of DQ heterodimers are enriched.
DQ associations may be influenced by its linkage‑disequilibrium with DRB1. DQA1 and DQB1
were genetically nearby DRB1, and in high LD with each other, i.e., DR3 and DQ2.5 were linked, and so were
DR4 and DQ8.1. With DQ motifs of nine residues, we performed haplotype association analysis of DQ motifs
and DRB1, with six DR4 subtypes specified by four-digit resolution. Clearly, DR3 was uniquely linked with the
motif “DCAA-YSARD” (DQ2.5), and their joint haplotype had significant association with T1D susceptibility
(OR = 2.10, p = 1.96*10−20) (Table 5). Similarly, DRB1*04:02, *04:03, *04:04, *04:05 and *04:07 were linked DQ
motifs with variable associations. Hence, these empirical haplotype associations prohibited separating DRB1
and DQ associations. However, the same DRB1*04:01 was on the same haplotypes with DQ motifs “DQAA-
YYARD”, “DQDA-YYARD”, or “DQDA-YYDRD”. These three haplotypes had variable associations (OR = 5.52,
4.25 and 0.89, p = 4.94*10−70, 7.98*10−5 and 0.57, respectively), implying that DQ motifs dictated T1D asso-
ciation in the background of DRB1*04:01. DRB1*04:03 reduced T1D susceptibility when in LD with DQ8.1
(OR = 0.12, while for the DQ8.1 alleles collectively OR = 3.34) even though the number of patients and controls
with this haplotype was very low. In the case of the DRB1*15 molecule, the OR is identical to the very tightly
linked DQA1*01:02-B1*06:02 haplotype. In fact, the number of patients and controls is nearly identical concern-
ing two nearly congruent groups.
Motifs of nine residues account for all DQ associations with T1D. Besides selected residues on
alpha and beta chains, there were 95 polymorphic amino acids across DQ haplotypes in this study population.
Due to LD, many residues were expected to have significant marginal associations. We evaluated these marginal
associations via a logistic regression of T1D with polymorphic residues. By the log-likelihood ratio test, p-values
were computed for each residue, and were shown in the top panel of the bar plot in the Fig. 2. Evidently, many
p-values greatly exceeded the threshold of 0.001, and some were approaching 10−100 or even less, showing strong
marginal associations with T1D. By adjusting for the motifs of selected nine residues, we repeated the same
logistic regression analysis, estimating p-values from log-likelihood ratio test (the lower bar plot of the Fig. 2).
Indeed, most p-values were insignificant, i.e., p > 0.05, except that several p-values were slightly less than 0.05.
Scientific Reports | (2021) 11:8821 | https://doi.org/10.1038/s41598-021-86229-8 8
Vol:.(1234567890)www.nature.com/scientificreports/
Figure 2. Logarithmic p-values computed for association of type 1 diabetes with the individual residue, with
(y-axis) and without (x-axis) adjusting for DQA1-DQB1 motifs.
Figure 3. Frequencies of all DQ motifs among 636 controls and 962 patients involved in BDD study.
We plotted adjusted p-values against marginal p-values as an x–y plot, showing that adjusting motifs accounted
for most of the marginal associations (Fig. 2).
DQ motifs are less diverse among patients than among controls. DQ motifs of selected nine
residues retained all susceptibility and resistance to T1D associations that were identified by DQ haplotypes but
had reduced polymorphisms due to merging of some DQ haplotypes, especially those rare DQ haplotypes with
relatively common ones. The frequencies of 25 DQ motifs among controls and patients (Fig. 3) indicates that
the two motifs “DCAA-YSARD” and “DQAA-YYARD”, corresponding to DQ2.5 and DQ8.1, had exceptionally
higher frequencies among patients than controls. Further, controls tended to have modest frequencies across
many motifs. For this reason, DQ motifs among controls, with a Shannon’s entropy value of 2.50, tended to be
more diverse than those among patients with an entropy value of 1.85, where the entropy was used to quantify
diversity of genetic polymorphisms21.
Motifs of nine residues capture DQ associations with islet autoantibodies. Our study meas-
ured six autoantibodies among newly diagnosed patients, i.e., IAA, GADA, IA-2A, ZnT8RA, ZnT8WA and
ZnT8QA, which were scored as positive or negative. Focusing on 11 DQ motifs observed more than 10 times
among patients, we evaluated the association of each DQ motif with the positivity for each type of autoantibody
(Table 6). T1D subjects with the motif “DCAA-YSARD”, corresponding to DQ2.5, tended to have an increased
Scientific Reports | (2021) 11:8821 | https://doi.org/10.1038/s41598-021-86229-8 9
Vol.:(0123456789)www.nature.com/scientificreports/
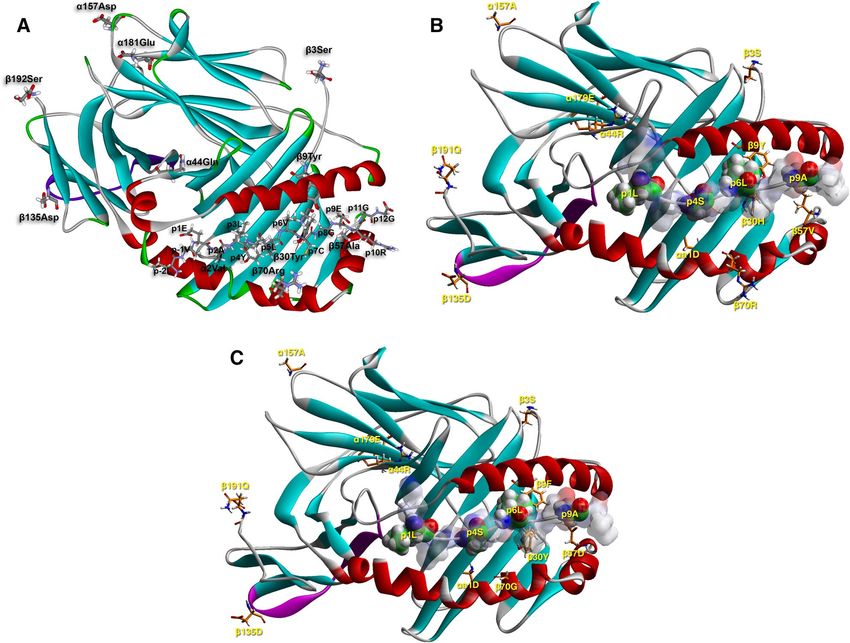
Figure 4. A-C. Molecular depiction of a T1D-susceptible HLA-DQ molecule (DQ8—InsB11-23/B24Gly; 1jk8.
pdb, A.), a neutral one (DQB1*06:04—InsB5-15, B.) and a T1D-resistant molecule (DQB1*06:02—InsB5-15,
C.) in complex with a so-restricted antigenic peptide from insulin (parts B. and C. obtained upon molecular
simulation reported in23 based on the crystal structure of the HLA-DQB1*06:02—hypocretin 1–13 complex,
1uvq.pdb69. Binding has been demonstrated to the respective epitopes, and in the first case several C D4+ T cell
clones, specific to this peptide and restricted to HLA-DQ8 have been isolated from patients. The binding register
has not been questioned, yet there is evidence that cognate TCRs from T cell clones isolated from patients with
T1D recognize an epitope with a shifted register by one residue towards the peptide C-terminus38. The HLA-
DQ-insulin peptide complexes are depicted in their secondary structure formation (α-helix in red, β-sheet
in turquoise, β-turn, random coil or any other form, such as poly-proline II helix of the antigenic peptide
backbone, in grey), and the β134-148 CD4-binding stretch in purple. The HLA-DQ AA residues in question
are depicted in stick form (atom color convention: carbon, grey; oxygen, red; nitrogen, blue; sulfur, yellow;
hydrogen, white). The antigenic peptide is shown in stick form in (A) (thinner sticks, with the same color
convention), and in space-filling form in (B). and (C). with the p1Leu, p4Ala, p6Leu and p9Ala anchor residues
opaque, and the remaining residues non-transparent surfaces colored by atom charge (red, negative; blue
positive, partial charges colored with hues in-between), in order to appreciate the positioning and orientation of
the selected β-chain residues; same atomic color conventions as in (A) (except for carbon that is in green).
frequency of GADA (OR = 1.56; p = 6.35*10−8) but a depressed frequency of IA-2A (OR = 0.59, p = 6.55*10−11).
Among subjects with the motif “DQAA-YYARD” corresponding to DQ8.1, patients had a reversed association
pattern, i.e., depressed GADA (OR = 0.87; p = 4.50*10−3) but elevated IA-2A (OR = 1.52, p = 2.18*10−9) frequency.
Importantly, subjects with the motif “DQDA-YYARD”, corresponding to a slightly different DQ8.1 allele, had an
elevated IA-2A positivity (OR = 5.67, p = 5.42*10–4), while its association with GADA was neutral (OR = 0.91,
p = 0.67). Lastly, the motif “DRAA-YHVRD” corresponding to DQ6.4 (itself a neutral allele regarding T1D sus-
ceptibility) seemed to associate with increased frequency of ZnT8A (RA, WA and QA; OR = 1.92, 1.72 and 1.57,
p = 6.25*10−3, 0.017 and 0.041, respectively), while having negative associations with GADA and IA-2A frequen-
cies. In order to delineate possible pathways for T1D manifestation and resistance via islet-autoantigen-specific
epitope presentation restricted by susceptible and resistant motifs, respectively, we have chosen three examples
of: a susceptible (DQ8—InsB11-23), a neutral (DQB1*06:04—InsB5-15) and a resistant (DQB1*06:02—InsB5-
15) heterodimer (Fig. 4A–C, and Supplementary Fig. S3A-C)22,23.
Scientific Reports | (2021) 11:8821 | https://doi.org/10.1038/s41598-021-86229-8 10
Vol:.(1234567890)www.nature.com/scientificreports/
DQA1-DQB1 Sero- IAA GADA IA2A ZnT8RA ZnT8WA ZnT8QA
ID
Mo
f type OR HS p OR HS p OR HS p OR HS p OR HS p OR HS p
1 DCAA-FYDED DQ4 1.36 1.36 1.73E-01 0.59 -2.47 1.34E-02 0.80 -0.88 3.76E-01 0.76 -1.29 1.97E-01 0.81 -0.94 3.49E-01 0.86 -0.64 5.23E-01
2 DCAA-YSARD DQ2.5 0.93 -0.86 3.92E-01 1.56 5.41 6.35E-08 0.59 -6.53 6.55E-11 0.88 -1.69 9.17E-02 0.89 -1.60 1.10E-01 0.82 -2.43 1.53E-02
3 DCAA-YYDRD 1.02 0.06 9.49E-01 1.48 1.11 2.68E-01 1.38 0.70 4.81E-01 1.29 0.76 4.45E-01 1.13 0.38 7.00E-01 1.21 0.57 5.71E-01
4 DKAA-YSARG DQ2.2 0.99 -0.04 9.65E-01 1.96 1.93 5.34E-02 1.42 0.81 4.18E-01 0.99 -0.03 9.74E-01 0.88 -0.40 6.86E-01 1.29 0.82 4.15E-01
5 DQAA-YYARD DQ8.1 1.02 0.44 6.63E-01 0.87 -2.84 4.50E-03 1.52 5.98 2.18E-09 0.94 -1.32 1.85E-01 1.10 1.94 5.21E-02 1.04 0.68 4.95E-01
6 DQDA-YYARD DQ8.1 1.04 0.16 8.70E-01 0.91 -0.42 6.72E-01 5.67 3.46 5.42E-04 1.40 1.44 1.50E-01 1.06 0.28 7.82E-01 0.99 -0.05 9.57E-01
7 DQDA-YYDRD 1.85 2.97 3.02E-03 1.36 1.35 1.75E-01 1.40 1.14 2.54E-01 1.75 2.48 1.30E-02 1.11 0.51 6.11E-01 1.46 1.79 7.32E-02
8 DRAA-YHDGD 1.10 0.30 7.63E-01 0.83 -0.61 5.39E-01 0.73 -0.93 3.50E-01 0.85 -0.56 5.78E-01 0.64 -1.49 1.36E-01 0.94 -0.19 8.47E-01
9 DRAA-YHSGD 1.42 0.67 5.04E-01 1.27 0.44 6.63E-01 0.36 -2.01 4.40E-02 0.28 -2.34 1.95E-02 0.23 -2.49 1.28E-02 0.31 -1.64 1.00E-01
10 DRAA-YHVGD 0.69 -2.37 1.79E-02 0.74 -2.20 2.81E-02 0.91 -0.58 5.64E-01 1.22 1.40 1.61E-01 0.91 -0.71 4.79E-01 0.96 -0.29 7.71E-01
11 DRAA-YHVRD DQ6.4 0.81 -0.88 3.79E-01 0.54 -2.80 5.17E-03 0.60 -2.11 3.47E-02 1.92 2.73 6.25E-03 1.72 2.39 1.68E-02 1.57 2.05 4.07E-02
Table 6. Association analysis of DQ motifs with elevated autoantibody levels among all patients (with five or
more subjects): estimated odds ratio, haplotype score, and p-value, across all motifs with six autoantibodies
(IAA, GADA, IA2A, ZnT8RA, ZnT8WA and ZnT8WA).
Mo
f 1 Mo
f 2 Control Pa
ent Coef SE Z P-value OR AF
Neutral Neutral 17 (2.67) 15 (1.56) 0.00 1.00
Resistant 108 (16.98) 54 (5.61) -0.57 0.39 -1.45 1.47E-01 0.57 -0.07
Risk 59 (9.28) 187 (19.44) 1.28 0.38 3.33 8.80E-04 3.59 0.19
Resistan Resistant 231 (36.32) 16 (1.66) -2.54 0.44 -5.80 6.53E-09 0.08 -0.25
Risk 183 (28.77) 234 (24.32) 0.37 0.37 1.01 3.13E-01 1.45 0.11
Risk Risk 38 (5.97) 456 (47.40) 2.61 0.39 6.65 2.91E-11 13.60 0.43
Table 7. Estimated attributable fractions for all susceptible and resistant DQ motif genotypes: genotype
frequency (%) among control and patient, estimated coef, standard error, Z-score, p-value, estimated odds ratio
and attribuable fraction. Notations and Conventions: As in Supplementary Fig. S1. Additional symbols are:For
the putative homodimerization patch of β49-55 residues are marked with @ at the bottom of the sequence and
highlighted in light green. Homodimerization of HLA-DQ has never been observed in any of the respective
crystal structures. Yet, F(ab’)2 fragment of anti-HLA-DQ antibodies differentially ligate HLA-DQ molecules on
the surface of human monocytes and lead to differential (compared to HLA-DR and –DP) downstream signal
transduction.
Estimated attributable fractions of risk and protection from respectively susceptibility and
resistance motifs. To quantify an overall T1D risk or protection from DQ motifs, we computed attrib-
utable risk and attributable resistance, respectively (methodological details of which are given in “Methods”).
Briefly, we pooled DQ motifs into three groups: resistant, neutral or risk. Each individual had pairs of resistant,
neutral or risk motifs. Using a logistic regression model on genotypes, we estimated regression coefficients cor-
responding to five genotypes, treating homozygous neutral motifs as the reference (Table 7). Motif frequencies
were estimated from the controls (Table 7). In comparison with the reference genotype, in subjects with the
homozygous resistant motif, the attributable resistance fraction was 25%, while its heterozygote with neutral
motif had the resistance fraction of 7%. On the other hand, for subjects with a homozygous risk motif, the attrib-
utable risk fraction was 43%, and its heterozygote with the neutral motif had 19% attributable risk fraction. The
heterozygote of resistant and risk motifs had 11% attributable risk fraction.
Structural properties of nine DQ residues. Of the nine residues, least is known about the putative
structural role of αa1Asp/Gly, the second residue of the mature HLA-DQ alpha chain. It is a residue without
counterpart in HLA-DR alpha c hains21. Of the remaining residues α44 is near pocket 1, while β9, β30, β57,
and β70 are part of pockets 9, 6, 9 and 4 respectively, thus being among the main determinants for the binding
of autoantigenic epitopes to the respective HLA-DQ molecules20,22–24. Further, β70 may also be considered as
a most probable TCR contact residue and β57 as a potential such residue23. Residue β135 is part of the β134-
148 peptide stretch shown to bind to co-receptor CD4 both in HLA-DR- as well as in mouse I-A-expressing
APCs24,25. Along the same lines, α157 is a participant in the formation of the cognate TCR-induced pMHCII
homodimer of h eterodimers26,27, while α196 is within the membrane of the APC, contributes to signal transmis-
sion to such a cell, once engagement with cognate TCR is made28.
Discussion
HLA-DQ genes are known to significantly contribute to susceptibility to islet autoimmunity and further to the
progression to clinical onset of T1D, independently or jointly with HLA-DRB1. The major finding through
exploration of the protein sequences of DQA1 and DQB112,13 was that we identified, respectively, three and seven
critical amino acid residues associated with T1D onset14,15. Integrating both sets of critical residues resulted in
Scientific Reports | (2021) 11:8821 | https://doi.org/10.1038/s41598-021-86229-8 11
Vol.:(0123456789)www.nature.com/scientificreports/
four alpha residues (αa1, α44, α157, α196) and five beta residues (β9, β30, β57, β70, β135) forming motifs that
was associated with either susceptibility or resistance to T1D. The importance of both DQα and DQβ chains
in determining T1D susceptibility and resistance is demonstrated not just in the respective motif consisting
of 4 α-chain and 5 β-chain residues but also in all DQαβ combinations revealed by next generation targeted
sequencing11,12. The deep sequencing approach reveals the importance of HLA-DQA-B combinations in T1D both
susceptibility and resistance to considerations of –DQB or –DQA alone. This is evident, for example, in motif
5 (DQA1*02:01-B1*02:02), a T1D mildly resistant allele compared to the rare motif 9 (DQA1*03:02-B1*02:02)
with only six copies among T1D patients, despite their sharing of an identical β-chain.
When interpreting association results of nine identified residues with respect to their binding properties, we
should be mindful of two residue sets: one set includes all monomorphic and conserved residues, and another set
includes those monomorphic residues in their respective clusters of DQ haplotypes. The former set of residues
essentially defines the overall DQ molecule structure, and the latter set defines substructures of DQ heterodimers,
e.g., DQ2.5 or DQ8.1 heterodimers. Hence, they remain structurally and functionally important, even though
they may have limited associations with T1D risk.
Specifically, the newly identified DQB1*02:02, previously scored as DQB1*02:01 with low resolution meth-
ods, was found in a T1D-resistant combination (motif 5, Table 2, DQA1*02:01-B1*02:02) in 78 controls and
41 patients. The same β-chain by contrast, forms a rare haplotype in combination with a different α-chain, i.e.
DQA1*03:02-B1*02:02, found only in six patients but in no controls. Similar striking findings were observed
with DQB1*03:01 and DQB1*03:03. When either of them pairs with DQA1*03:01 they form rare haplotypes
found only in 9 controls (motif 8, Table 2). Yet when the first of them pairs with DQA1*03:03 and the second
with DQA1*03:02 they result in neutral haplotypes, found in 67 controls and 88 patients (motif 11, Table 2).
We also demonstrate that the DQ motifs associated with T1D appeared to be mediated through the frequency
of islet autoantibodies. In particular, subjects with the DQ*DCAA-YSARD motif, corresponding to DQ2.5, more
often had GADA (p = 6.35*10−8) than IA-2A (p = 6.55*10−11). Meanwhile, subjects with DQ*DQAA-YYARD and
DQ*DQDA-YYARD, corresponding to DQ8.1, more often had IA-2A (p = 2.18*10−9 and 5.42*10−4, respectively),
but less often GADA (p = 4.50*10−3). Other motifs had more variable associations with the different autoantibod-
ies. To assess motif associations with the number of autoantibodies at diagnosis, we compared patients with 2,
3 or 4 autoantibodies with patients with 0 or 1 autoantibody, which revealed a single significant association (see
Supplementary Table S4). In this neutral/mildly resistance motif, DQ*DQDA-YYDRD, the association with
T1D was significant only when all four autoantibodies were present. These data suggest that the presence of all
four autoantibodies overcame the resistance mechanism(s) of the DQ7 and DQ9 haplotypes (both β57Asp+)
represented in this m otif29. Hence, it cannot be excluded that other non-HLA genetic factors important to the
pathogenesis contributed to autoantigen spreading and appearance of multiple autoantibodies.
It is important to realize that antigen-specificity in HLA-DQ- and -DR-directed autoimmune response (as
well as resistance to it) is paramount for an organ-specific autoimmune disease, such as T1D. This is reflected by
the observation that 4 of the 9 selected HLA-DQ residues are in anchoring pockets involved directly in antigen
binding (β9, β30, β57, β70), another one (αa1) is near pocket 1, and two of the first four residues (β57, β70) in
probable cognate TCR engagement and a ctivation23,30,31. The remaining polymorphic residues (except αa1 about
which there is hardly any information), are involved in other accessory functions of the HLA-DQ heterodimer:
α135 in CD4 co-receptor binding, as part of the β134-148 s tretch32,33, α157 in the formation of the putative
homodimer of heterodimers that presumably facilitates CD4 b inding34,35 and consequent cognate TCR activation
and HLA-DQ signal transduction in the specific T cell and APC respectively23. Last, α196 is within the single
membrane spanning domain of the respective chain and is involved in consequent signal transduction after the
crucial step of pMHCII recognition by TCR, as just described23,36. The structural depictions of a susceptible, a
resistant and a neutral HLA-DQ heterodimer happen to have bound peptide fragments from the same antigenic
stretch of the insulin B-chain peptide 5–2321,22,37,38. Within the insulin peptide B5-23, the InsB11-23 epitope binds
to DQ8 and is recognized by cognate CD4+ Th1 cells37,38 and the InsB5-15 epitope that binds in an identical
register to the T1D-resistant heterodimer containing DQB1*06:02, as well as the neutral DQB1*06:0422. While
not all epitopes have been compared in one-to-one comparisons between a resistant and a neutral/susceptible
allele, it has already been shown that DQB1*06:02 can out-compete DQ8 for the epitope InsB5-23 by forming
the DQB1*06:02—InsB6-14 complex, with the peptide shown only as the core n onamer22. The same is probably
the case for the neutral allele DQB1*06:04, which binds the same preproinsulin epitopes as DQB1*06:02, albeit
at slightly higher IC50 values, i.e. with lower a ffinity22. It will naturally be of interest to determine how newly-
identified risk and resistant alleles in the Swedish population interact with T1D autoantigenic e pitopes12,13.
Two recent studies have added significant knowledge to the area of HLA-DR-DQ-restricted proinsulin and
GAD65 epitopes26,27. The first study deals with proinsulin-specific epitopes and their cognate CD4 + T cell clones
found in healthy children homozygous for either HLA-DR3-DQ2, DR4-DQ8 or being DR3-DQ2/DR4-DQ8
heterozygotes. It is based on the observation that IAA represents the first appearing autoantibody in about 50%
of children with these high-risk HLA-DR-DQ haplotypes who later on developed additional islet autoantibodies
followed later by clinical onset of T1D39,40. Remarkably, the epitopes were identified using PBMCs from these
healthy children and relevant antigen-presenting cells supplemented with various proinsulin antigenic peptides.
IL-2 combined with IL-7 was used to stimulate both C D4+ Teffectors as well as C D4+ T regulatory cells (Tregs).
The second study deals with the effects of GAD65-alum treated newly-diagnosed T1D patients by stimulating
frozen and thawed PBMCs in culture with whole GAD65 and antigen-specific bifunctional Th1/Th2 cell lines
generated subsequently27. It is noteworthy that the T cell lines generated from heterozygous HLA-DR3-DQ2/
DR4-DQ8 individuals were greatly restricted in the number of recognized epitopes, distinctly fewer than the
sum of those recognized by T cell lines restricted to either HLA-DR3-DQ2 or HLA-DR4-DQ827. The specific
HLA class II restricting element(s) of the respective CD4 + T cell lines and clones were not determined. Inter-
estingly, a recent study showed that GAD65- and IGRP (islet glucose-reactive protein)-specific CD4+ T effector
Scientific Reports | (2021) 11:8821 | https://doi.org/10.1038/s41598-021-86229-8 12
Vol:.(1234567890)You can also read


