Natural hazard risk assessment for Matamata Piako District
←
→
Page content transcription
If your browser does not render page correctly, please read the page content below
Waikato Regional Council Technical Report 2014/01

Natural hazard risk
assessment for Matamata
Piako District

www.waikatoregion.govt.nz
ISSN 2230-4355 (Print)
ISSN 2230-4363 (Online)
Prepared by: Megan Dredge

For:
Waikato Regional Council
Private Bag 3038
Waikato Mail Centre
HAMILTON 3240

November 2014

Document #: 2374632
Peer reviewed by:
Rick Liefting                 Date:     05 November 2014

Approved for release by:
Adam Munro                    Date:     05 November 2014

Disclaimer
This technical report has been prepared for the use of Waikato Regional Council as a reference
document and as such does not constitute Council’s policy.

Council requests that if excerpts or inferences are drawn from this document for further use by
individuals or organisations, due care should be taken to ensure that the appropriate context
has been preserved, and is accurately reflected and referenced in any subsequent spoken or
written communication.

While Waikato Regional Council has exercised all reasonable skill and care in controlling the
contents of this report, Council accepts no liability in contract, tort or otherwise, for any loss,
damage, injury or expense (whether direct, indirect or consequential) arising out of the provision
of this information or its use by you or any other party.

Doc # 2374632
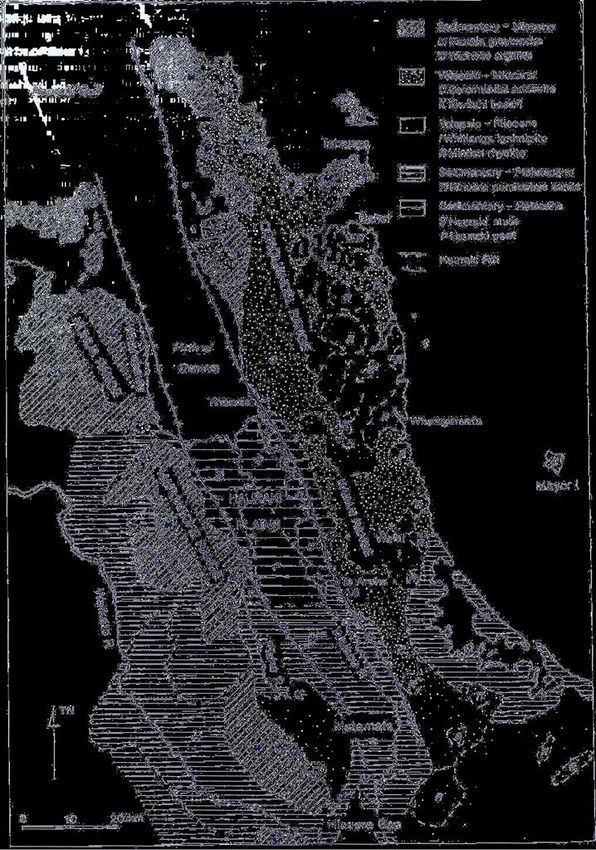
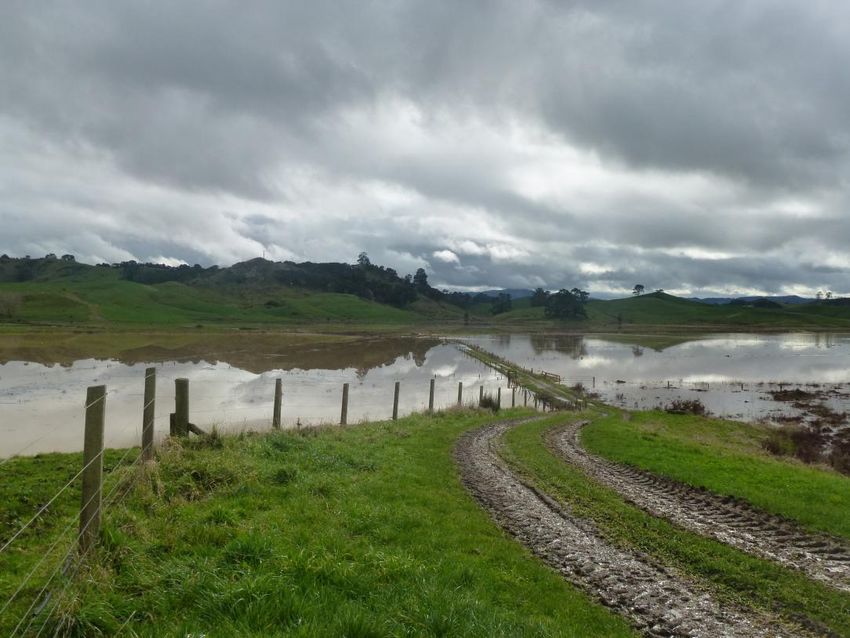
Table of Contents
List of Figures                                                                 iii
List of Tables                                                                  iii
Executive Summary                                                               iv
1         Introduction                                                           1
    1.1     Purpose                                                              1
    1.2     Background                                                           1
    1.3     Statutory and legal framework                                        2
    1.4     National drivers for hazard management                               2
    1.4.1   Review of the Resource Management Act                                2
    1.5     Key hazard planning considerations for Matamata-Piako District       3
2         Profile of Matamata-Piako District                                     4
    2.1     General description                                                  4
    2.2     Physical setting                                                     6
    2.2.1   Geology                                                              6
    2.2.2   Climate                                                              8
3         Natural hazards in the Matamata-Piako district                        10
    3.1     Introduction                                                        10
    3.1.1   Current and previous research                                       10
    3.1.2   Natural hazard indicators                                           11
    3.2     Earthquake hazards                                                  11
    3.2.1   Liquefaction                                                        13
    3.3     Drought                                                             16
    3.3.1   2013 Drought                                                        17
    3.4     River flood hazards                                                 18
    3.5     Volcanic hazards                                                    19
    3.6     Debris flows                                                        21
    3.7     Severe Winds                                                        22
    3.8     Land instability                                                    22
    3.9     Climate change                                                      23
4         Risk Assessment                                                       24
    4.1     Introduction                                                        24
    4.2     Description of scenarios                                            25
    4.3     Risk assessment methodology                                         25
    4.4     Analysis and evaluation                                             26
    4.5     Residual risks                                                      28
    4.6     Conclusion                                                          29
5         Summary, discussion and recommendations                               30
    5.1     Summary of natural hazard risks                                     30
    5.2     Discussion                                                          30
    5.3     Recommendations                                                     30
    5.3.1   Further research                                                    31
6         References/Bibliography                                               32
    6.1     Research                                                            32
    6.2     Legislation and national standards                                  32
7         Appendix 1: Statutory and legal framework                             34
    7.1     The Resource Management Act (RMA) 1991                              34
    7.1.1   Introduction                                                        34
    7.1.2   Long-term management strategies                                     34
    7.1.3   Short-term management strategies                                    34

Doc # 2374632                                                                Page i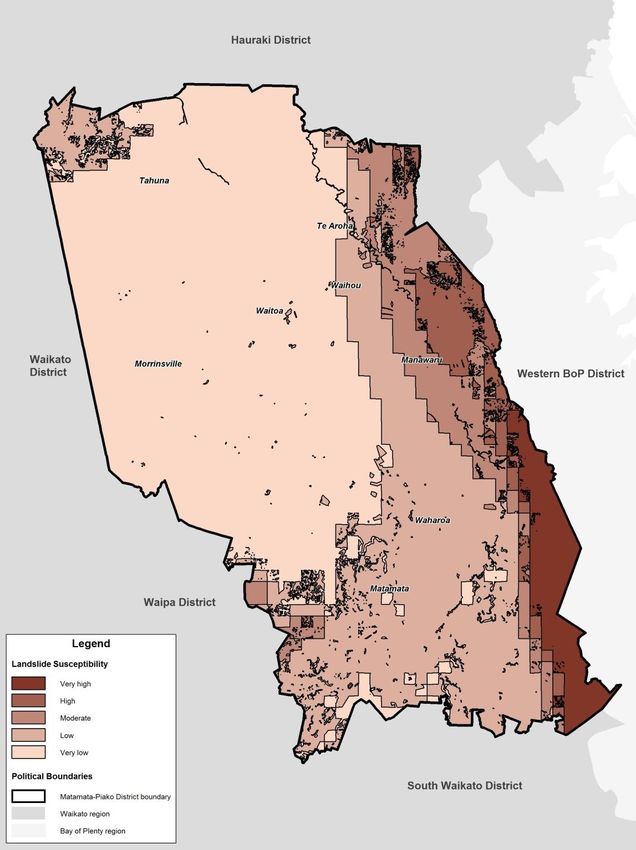
7.2     Resource management policy statements                                            34
     7.2.1   Introduction                                                                     34
     7.2.2   Regional Policy Statement (RPS)                                                  35
     7.2.3   Matamata-Piako District Plan                                                     35
     7.3     Other hazard management statutes                                                 35
     7.3.1   Introduction                                                                     35
     7.3.2   Civil Defence Emergency Management (CDEM) Act 2002                               36
     7.3.3   Soil Conservation and Rivers Control Act 1941                                    36
     7.3.4   Local Government Act 2002                                                        36
     7.3.5   Local Government Official Information and Meetings Act 1987 (LGOIMA)             36
     7.3.6   Building Act 1991                                                                37
     7.3.7   Reserves Act 1977                                                                37
8          Appendix 2: MPDC/WRC RMA Functions                                                 38
9          Appendix 3: RMA Section 330                                                        39
     9.1     Provisions and discussion of Section 330 of the Resource Management Act
                1991                                                                          39
10         Appendix 4: RPS & natural hazards                                                  40
     10.1 Policy One: Consistent Management of Natural Hazards                                40
11         Appendix 5: Other work                                                             41
     11.1 Hydraulic modelling                                                                 41
     11.2 Categorisation of flood risk                                                        41
12         Appendix 6: Key to Table 2 (risk analysis evaluation key)                          42
     12.1    Measure of likelihood                                                            42
     12.2    Manageability and Growth ratings                                                 42
     12.3    Measure of consequence of impact and seriousness                                 43
     12.4    Qualitative risk matrix                                                          43

Page ii                                                                             Doc # 2374632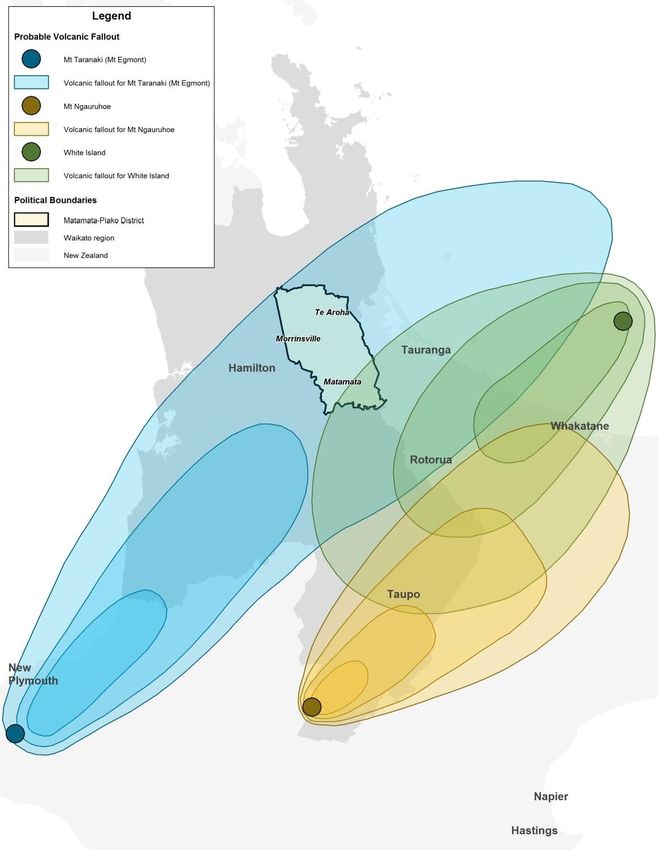
List of Figures
Figure 1: 2012 Population densities by area units of Matamata-Piako District. Most of the
            Matamata-Piako District population is centred on the three distinct urban
            areas with smaller population densities at each end of the district.              4
Figure 2: Matamata-Piako District Wards - Te Aroha, Matamata and Morrinsville                 5
Figure 3: Matamata-Piako District main transport routes                                       6
Figure 4: Geological setting of the Hauraki Plains and Matamata-Piako District (based on
            Healy et al. 1964: Scholefield 1973; Suggate et al. 1978; Thornton 1985).         7
Figure 5: Waikato Median Annual Wind Speed (based on data from the period 1981-
            2010)                                                                             8
Figure 6: Annual rainfall averages of the Waikato Region (based on data from the period
            1981-2010)                                                                        9
Figure 7: Shallow earthquakes in New Zealand over the past 10 years (depth < 40km)
            (GNS Science)                                                                   12
Figure 8: Active faults in the Matamata Piako District (sourced from GNS Science NZ
            Active Faults Database)                                                         13
Figure 9 : 2010 National seismic hazard model for New Zealand showing expected PGA's
            for a 475 and 2,500 year return period earthquake for shallow soils (Saunders
            & Berryman 2012)                                                                14
Figure 10: Liquefation and its effects (Saunders & Berryman 2012)                           14
Figure 11: Earthquake Hazard Zones                                                          15
Figure 12: Soil moisture deficit maps for New Zealand on 1 March 2013.                      17
Figure 13: Flooding susceptibility in the Matamata-Piako District                           19
Figure 14: Matamata-Piako District volcanic fallout range predictions                       21
Figure 15: Image of the 1981 debris flow through Te Aroha                                   22
Figure 16: Matamata Piako District landslide potential                                      23
Figure 17: Internal stopbank flooding creates residual risk                                 28

List of Tables
Table 1: Summary of natural hazard risk assessment                                           iv
Table 2: Research projects for the Waikato region                                           10
Table 3: Relationship between PGA and perceived shaking and damage of an
           earthquake                                                                       15
Table 4: Recent drought in the Waikato Region                                               16
Table 5: Some effects of volcanic ash fall (Adapted from Edbrooke, 2005)                    20
Table 6: Risk analysis and evaluation                                                       27
Table 7: Measure of likelihood - generic table                                              42
Table 8: Manageability table rating                                                         42
Table 9: Measure of consequence of impact and seriousness                                   43
Table 10: Modified qualitative risk analysis matrix                                         43

Doc # 2374632                                                                           Page iii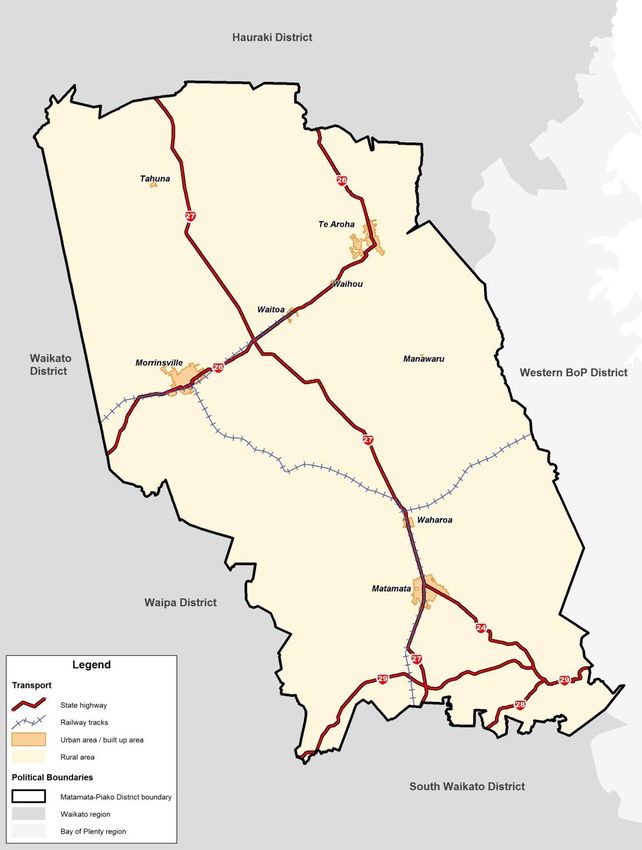
Executive Summary
The purpose of this report is to provide an overview of natural hazards in the
Matamata-Piako District as a basis for guiding and prioritising work activities for the
Matamata-Piako District Council (MPDC) and Waikato Regional Council (WRC) for
2013/14 and beyond. This report also provides a useful insight into the district’s natural
hazards as part of the scheduled review of the Matamata-Piako District Plan.

Both agencies have responsibilities for the management of natural hazards in
accordance to a complex set of statutory responsibilities, but primarily the Resource
Management Act 1991.

The known natural hazards in the Matamata-Piako district are identified, explained and
prioritised by a qualitative risk analysis.

Based on the qualitative risk analysis, earthquakes pose the greatest risk in terms of
potential loss of human life, social disruption, economic cost and infrastructure
damage. Drought is the second highest risk, followed by river and drainage flooding. A
summary of the natural hazard prioritisation for MPDC is shown in . The report also
identifies various factors/considerations that are likely to affect natural hazard planning
such as predicted effects of climate change.

Table 1: Summary of natural hazard risk assessment
      Hazard Scenario                  Total Score                      Priority

Earthquake                                 14.3                            1

Drought                                    12.1                            2

Flooding (River and drainage)              12.0                            3

Severe Wind                                 10                             4

Volcanic Ashfall                           9.8                             5

Debris flow                                9.7                             6
Land instability
                                           8.7                             7

Rural Fire                                 7.6                             8

Page iv                                                                        Doc # 2374632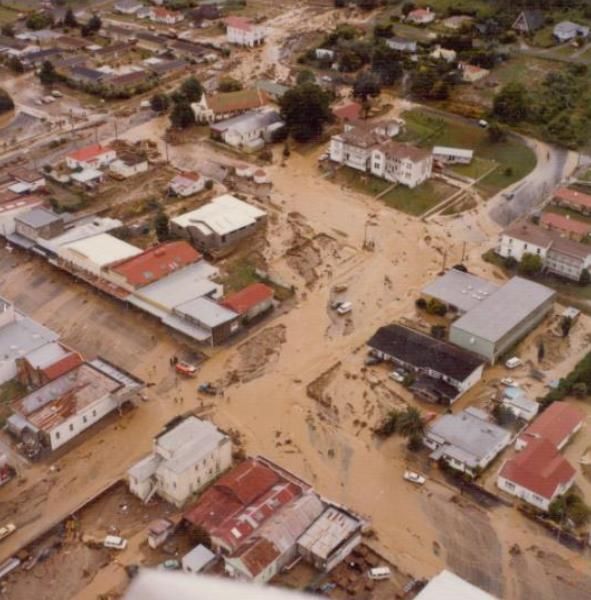
1 Introduction
1.1 Purpose
This report provides an overview of the significant natural hazards currently affecting
and are likely to affect the Matamata-Piako District, including:
An initial assessment of a range of existing and potential natural hazard risks that
affect the Matamata-Piako District and how these may change over time.
An initial qualitative risk assessment which identifies the risk to life and property in
broad terms
An identification of gaps and priorities
A basis for developing effective District Plan provisions regarding natural hazards.
Both MPDC and WRC) have ongoing natural hazards commitments in the District. This
report presents an initial analysis for the key natural hazards and provides guidance to
MPDC and WRC for the prioritisation of natural hazards work programmes within the
Matamata-Piako District.
The key drivers that for the preparation of this assessment are:
The review of the Matamata-Piako District Plan (including the identification of future
District growth priorities).
The need to document/review the suite of natural hazards relevant to the MPDC
area.
Outline existing natural hazard information (and its status) held by WRC, including
maps and other spatial information
To identify any (research) gaps.
Outline and identify options for addressing risk into the future.
Form a basis for guiding and informing strategic policy formulation and
implementation.
Undertake a qualitative (desk top) risk assessment exercise in as a basis for
determining future priorities (short and long term).
1.2 Background
MPDC is currently undertaking a sectional rolling review of the Matamata-Piako District
Plan and it is expected the natural hazards section will be reviewed in the near future.
In accordance with the Waikato Regional Policy Statement and Proposed Waikato
Regional Policy Statement, this plan includes planning provisions that cover the
management of land-use to reduce the actual or potential impact of natural hazards.
The first stage in the provision of natural hazard information, is to prioritise the hazards
that affect the Matamata-Piako District Council, based on current information. The
prioritisation is based on a qualitative natural hazards risk assessment.
Doc # 2374632 Page 1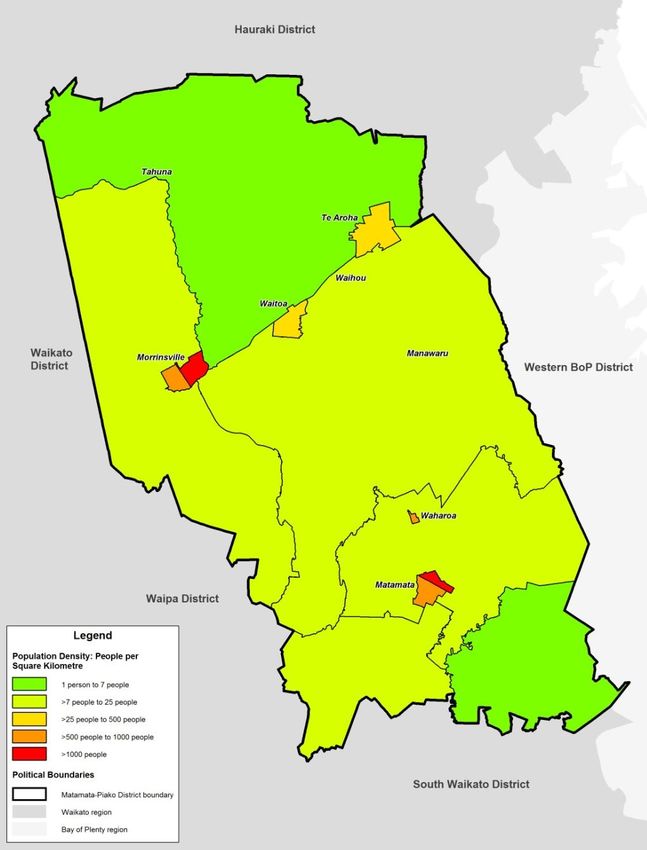
1.3 Statutory and legal framework
The Local Government agencies responsible with managing the natural hazards that
affect the Matamata-Piako District are MPDC and WRC. The responsibility includes the
development of policy and implementing strategies and mechanisms to avoid or
mitigate the effects of hazards on people, property and the environment. Further details
regarding these responsibilities are presented in Appendix 2.
The statutory framework guiding WRC and MPDC is primarily determined by the
Resource Management Act 1991. Other relevant statutes include the Local
Government Act 2002, the Soil Conservation and Rivers Control Act 1941, the Land
Drainage Act 1908, the Building Act 2005, the Public Works Act 1981, the Civil
Defence Emergency Management Act 2002, and the Hauraki Gulf Marine Park Act
2000. Further discussion around the relevant provisions of these statutes is provided in
Appendix 1.
The Ministry of Civil Defence and Emergency Management has a role in hazard
management through its enabling legislation.
1.4 National drivers for hazard management
There are several key drivers which impact the way in which natural hazards are
managed in New Zealand. These include:
The emergency management focus on hazard risk reduction, the treatment of
residual risk and an all hazards approach
The recent review of the Resource Management Act which places more importance
on natural hazards and their associated risk.
Local Government New Zealand through the development of a Natural Hazards
Guidance note.
Increasing community expectations for natural hazard management to be linked
with other community outcomes.
The impact of predicted future climate change on natural hazards, including the
need to adapt existing risk reduction measures (e.g. flood protection schemes).
Increasing development pressure on land that is affected by natural hazards.
The damage that continues to be sustained by numerous New Zealand
communities due to natural hazards.
1.4.1 Review of the Resource Management Act
Since its enactment in 1991, the Resource Management Act (RMA) has undergone
several reviews and amendments to keep up with changing needs and circumstances.
The Minister for the Environment is currently leading a reform of the RMA which is
being carried out in two phases. Phase one introduced the Resource Management
(Simplifying and Streamlining) Amendment Act 2009 which was enacted on 1 October
2009. Phase two contains a package of reforms that touch on a number of resource
management areas that are not only related to the RMA but cover resource
management more broadly.
The second phase is split into two stages, the first is the Resource Management
Reform Bill 2012 and the second is the 2013 reform package.
Page 2 Doc # 2374632Sections 6 and 7 of the RMA set out the principles decision-makers must take into
account when making decisions on resource management issues. These sections
support section 5 which sets out the purpose of the RMA to promote the sustainable
management of New Zealand’s natural and physical resources.
The current sections 6 and 7 will be merged into one list of matters of national
importance to be considered in decision making. The management of the significant
risks of natural hazards is a new matter to be included in sections 6. This includes all
aspects of hazard risk (both likelihood and impact) (Ministry for the Environment,
2013).
This change will give greater weight to natural hazards in decision-making and mean
natural hazards are considered early and up front in resource and land use planning.
Ultimately this means planners will avoid granting resource consents for inappropriate
developments.
We note that the RMA reforms have been currently put on hold by central government.
1.5 Key hazard planning considerations for
Matamata-Piako District
In addition to the statutory framework and national drivers, there are a number of other
considerations that are or will affect the management of natural hazards in the
Matamata-Piako District, including:
Continuing population growth in known natural hazard areas.
The proximity of existing development to land affected by natural hazards.
The growing number of Resource Consent applications covering the development
of marginal land.
The incorporation of predicted future climate change into research, planning and
operations.
Increasing property values, particularly in areas that are affected by one or more
natural hazards.
Translating Central Government risk management guidelines into effective policies
using the Regional and District planning framework.
The increasing demand from Central and Regional Government for land use
planning controls to be incorporated into a risk reduction strategy.
The Increasing awareness of the importance of lifelines infrastructure (e.g. roading,
electricity and potable water).
The existing reliance of some communities on physical works that are unlikely to
provide the unconditional protection that is often sought.
The importance of maintaining public awareness and understanding regarding the
management of natural hazards.
A crucial role for the Council in areas affected by natural hazards is raising public
awareness and ensuring that the public is prepared for emergencies, to reduce the risk
to lives and property.
Doc # 2374632 Page 32 Profile of Matamata-Piako District
2.1 General description
The Matamata-Piako District encompasses a large portion of the Waihou River Valley
and covers an area of 1750km2. It incorporates the major townships of Matamata,
Morrinsville and Te Aroha and has a population of approximately 31,536 (2013 data).
See Figure 1 for population densities (2012 data).
Figure 1: 2012 Population densities by area units of Matamata-Piako District. Most of the
Matamata-Piako District population is centred on the three distinct urban
areas with smaller population densities at each end of the district.
There are three wards which make up the district – Te Aroha, Matamata and
Morrinsville. See Figure 2.
Page 4 Doc # 2374632Figure 2: Matamata-Piako District Wards - Te Aroha, Matamata and Morrinsville The south end of the District is also a major transport corridor which links Hamilton and Tauranga via SH26 over the Kaimai Range. Four other State Highways run through it, including SH27, SH26, SH24 and a small section of SH28, most of which eventually feed onto SH29. SH26 provides a vital link between Coromandel and the surrounding regions. Rail links are also prominent, with lines running over to Tauranga, to the south and west of the district. See Figure 3. Doc # 2374632 Page 5
Figure 3: Matamata-Piako District main transport routes

2.2     Physical setting
2.2.1   Geology
        The Matamata-Piako District encompasses the southern end of the Hauraki Plains and
        much of the Thames Valley. It is bounded in the east by the Kaimai Range with the
        Piako and Waihou rivers running through the district to the Firth of Thames.

        The Kaimai Range has varied geology which influences natural hazard patterns within
        the Matamata-Piako District. On the western side of the range, lava bluffs are common,
        as well as small streams in which cascades and waterfalls are frequent, due to the
        hardness of the underlying bedrock. The entire Range is composed almost entirely of
        Miocene andesites and dacites overlain to the south by younger ignimbrites.

        Figure 4 indicates that the district sits within an active rift valley which over time is
        extending its width as a result of ongoing tectonic processes. This process has given
        rise to about five “sharp” earthquakes in the last 9,000 years which has resulted in the

        Page 6                                                                      Doc # 2374632
subsidence of the western depression by a total of 2.1m. It also details the
geomorphology of the region.
Figure 4: Geological setting of the Hauraki Plains and Matamata-Piako District (based on
Healy et al. 1964: Scholefield 1973; Suggate et al. 1978; Thornton 1985).
Volcanic ash is a parent material in the area but also it may be mixed with materials
derived from the underlying andesitic rock. More recent pumiceous ash from the
Mangaone, Kaharoa, and Taupo eruptions is also present as a fine, white sand
distributed throughout the soil structure. The difference in the parent materials gives
rise to obvious differences in the type of clay and to soil properties.
Depending on the type of minerals present in the soil, clays can be found in large
amounts in the valley which are very responsive to changes in moisture content by
swelling or cracking. In contrast, the ash soils have a high phosphate retention and low
cohesion. This influences the amount of risk to debris flows and landslides in the
district.
Hazards from slips, landslides and erosion are important concerns in the hill country of
the District, particularly on the steep slopes of Mt Te Aroha and along the Kaimai
Range.
Doc # 2374632 Page 72.2.2 Climate
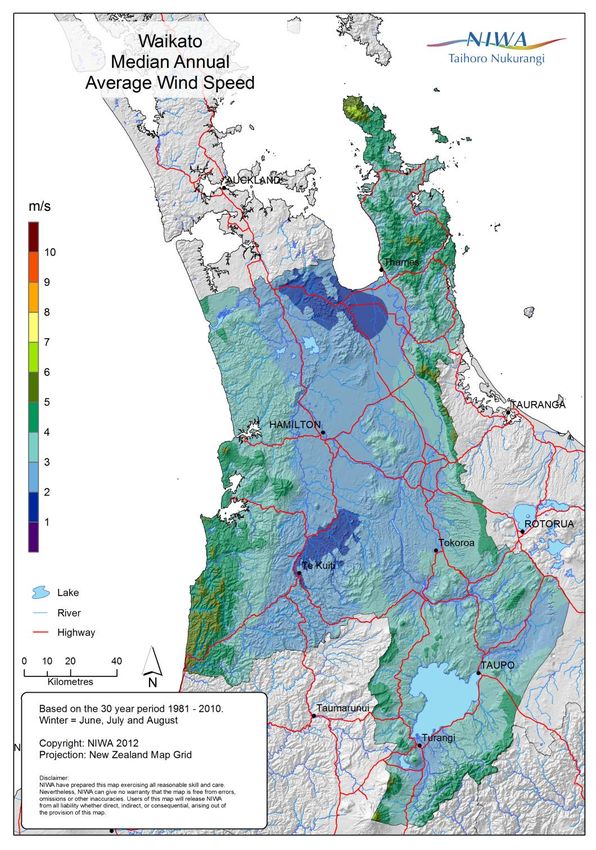
Generally, the Matamata-Piako district has weather patterns typical of the Waikato
Region; warm, humid summers and mild winters, with prevailing west and southwest
winds.
The Waikato region, centred around 38 degrees south, is exposed to prevailing west
and southwest winds from the Tasman Sea. These bring mild, humid conditions.
Sheltered and elevated inland places experience extremes of hot and cold. See Figure
5 for the Waikato Region’s mean annual wind speed.
Figure 5: Waikato Median Annual Wind Speed (based on data from the period 1981-2010)
The Kaimai Range has a large influence on the variable weather patterns of the
Waikato Region, specifically the Matamata – Piako District. The Range separates two
weather districts. To the west, the Waikato Region is largely influenced by the
predominant easterly movement of frontal systems onto New Zealand, while in the Bay
of Plenty Region, to the east, most of the summer rainfall arises from tropical storms
which originate north of New Zealand (Jane & Green, 1984).
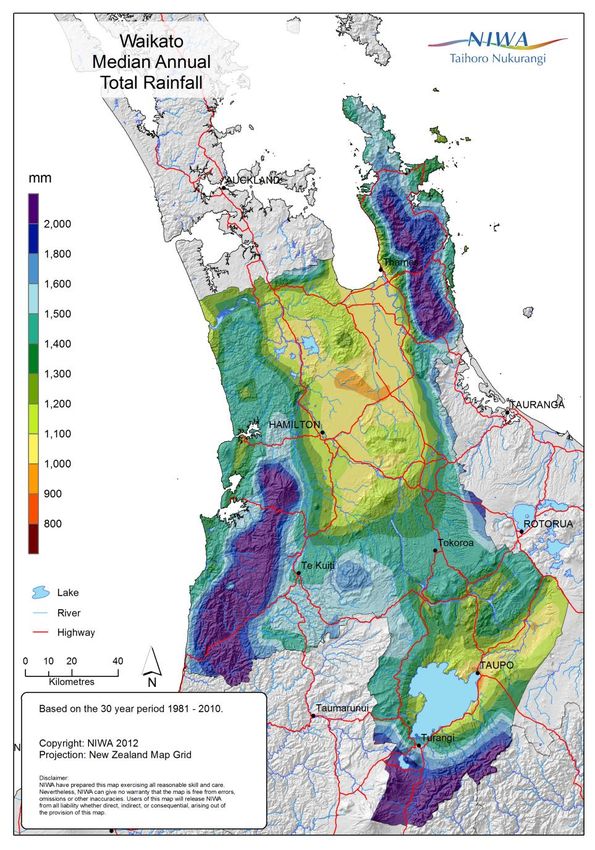
Page 8 Doc # 2374632Rainfall is influenced by the Kaimai ranges as there is a steep gradient in rainfall on the
western face of the range. For example, at the summit of Mt Te Aroha, the annual
rainfall total is 2000 mm, compared to, the town of Te Aroha, two kilometers away at
the base of the mountain has an annual rainfall of only 1500 mm. The rainfall
decreases further to 1100 mm at Morrinsville on the Hauraki Plains 20 km to the west.
The rest of the district is quite sheltered by the Coromandel range and the central North
Island plateau and receives an annual rainfall average of 1200-1600 mm (see Figure
6).
Further information on local wind and rain effects due to the Kaimai Range is contained
in Section 3.
Figure 6: Annual rainfall averages of the Waikato Region (based on data from the period
1981-2010)
Doc # 2374632 Page 93 Natural hazards in the Matamata-Piako
district
3.1 Introduction
The Matamata-Piako district is similar to many areas of New Zealand in that it is
subject to a number of natural hazards such as tectonic (earthquake), volcanic, and
severe weather. Our present knowledge of natural hazards within the district is based
on a number of sources including:
Local knowledge and experience, particularly with river flooding, coastal flooding,
and severe storm events.
Detailed investigations and research of specific hazards including:
River flood engineering, mapping and surveying work.
General hazard studies such as earthquake risks.
The regional hazard risk analysis completed as part of the Civil Defence
Emergency Management Group Plan.
The Matamata-Piako district is particularly at risk from geological and meterological
based natural hazards. An assessment of the probability and the effects of natural
hazard events can be based on knowledge of the history of past occurrences as well
as a comprehensive hazard analysis. The following natural hazards have been
identified as particularly relevant for the Matamata-Piako district:
Earthquake
River flooding
Drought
Volcanic activity
Land slides and erosion
Debris flow
Forest fire
3.1.1 Current and previous research
Several research projects have been identified to improve the understanding of the
Waikato Region, which can be applied to the Matamata-Piako District (Error!
eference source not found.).
Table 2: Research projects for the Waikato region
Research Project Researcher Year Hazard
Earthquake Hazard IGNS 1996 Earthquake
Assessment for the
Waikato Region
Volcanic Hazard IGNS 1997 Volcanic
Assessment for the
Waikato Region
Land Susceptibility University of 1999 Landslides
Mapping and Risk Waikato
Assessment for the
Waikato Region
Page 10 Doc # 23746323.1.2 Natural hazard indicators
MPDC has identified a list of natural hazard indicators to better assess and measure
natural hazard risk, pressures and their response. The natural hazard indicators
provide a useful guide to policymakers for the reduction of human, financial, economic
and infrastructural losses caused by natural hazards.
The natural hazard indicators for MPDC are:
Pressures (increase in risk from natural hazards)
Number of resource or building consents applied for/granted within flood
protection area
Number of buildings within flood protection area
Number of buildings within identified fire buffer
Number of dwellings built on potentially unstable land (i.e. land classed
as having a degree of erosion of 2 or greater and/or slopes of >20
degrees)
Number of resource or building consent applications applied for/granted
for development on potentially unstable land
State (Measurable risks or factors which increase risks)
Number and severity of flood events annually
Area of land subject to flooding
Number and area affected by rural fires annually
Area of vegetated and un-vegetated land classified as having a degree
of erosion of 2 or greater
Area of headwater catchment in vegetation
Number and size of earthquakes recorded annually
Annual damage ($) to public and private property
Response (What MPDC are doing)
Area of land identified on planning maps being subject to flooding
Amount of Council spending on resourcing rural fire fighting emergency
services
Area of land being identified on planning maps as being subject to land
instability
Number of resource and building consents declined in areas identified
as being subject to flooding, fire or instability
Council expenditure on educating community about hazards.
3.2 Earthquake hazards
New Zealand experiences large numbers of small earthquakes, in a well-defined belt
stretching from Fiordland to East Cape and the Bay of Plenty. The pattern is part of the
‘Ring of Fire’, the almost continuous belt of volcanoes and earthquakes rimming the
Pacific Ocean. Shallow earthquakes (less than 40 km deep) are spread in a wide belt
through the country (Figure 7)
Doc # 2374632 Page 11Figure 7: Shallow earthquakes in New Zealand over the past 10 years (depth < 40km)
(GNS Science)
In the Matamata Piako District there are several active fault lines, the most prominent
being the Kerepehi fault line which runs in a southeast – northwest direction through
the Hauraki Plains and into the Forth of Thames. (Figure 8). This fault line is thought to
be responsible for both of the Districts largest recorded earthquakes which measured 6
and 6.9 in magnitude. The latest of these earthquakes occurred on 8 January 1972
near Te Aroha.
The effects of earthquakes include structural damage to buildings and infrastructure
due to shaking and also liquefaction.
Page 12 Doc # 2374632Figure 8: Active faults in the Matamata Piako District (sourced from GNS Science NZ
Active Faults Database)
3.2.1 Liquefaction
Liquefaction occurs when a saturated or partially saturated soil loses strength and
stiffness in response to an applied stress, usually earthquake shaking or other sudden
change in stress condition, causing it to behave like a liquid. For liquefaction to occur, it
is likely that the following three factors are present:
Soil characteristics such as un-consolidated sands and silts, typically of
Holocene Age (Figure 9 : 2010 National seismic hazard model for New Zealand showing expected PGA's for a 475 and 2,500 year return period earthquake for shallow soils (Saunders & Berryman 2012) Figure 10: Liquefation and its effects (Saunders & Berryman 2012) Page 14 Doc # 2374632
Table 3: Relationship between PGA and perceived shaking and damage of an
earthquake
Instrumental    Acceleration         Velocity
                                                 Perceived Shaking    Potential Damage
Intensity       (g)                  (cm/s)
I               < 0.0017             < 0.1       Not felt             None
II-III          0.0017 - 0.014       0.1 - 1.1   Weak                 None
IV              0.014 - 0.039        1.1 - 3.4   Light                None
V               0.039 - 0.092        3.4 - 8.1   Moderate             Very light
VI              0.092 - 0.18         8.1 - 16    Strong               Light
VII             0.18 - 0.34          16 - 31     Very strong          Moderate
VIII            0.34 - 0.65          31 - 60     Severe               Moderate to heavy
IX              0.65 - 1.24          60 - 116    Violent              Heavy
X+              > 1.24               > 116       Extreme              Very heavy

Matamata-Piako District has recent unconsolidated material (one of the three factors
for Liquefaction - broad scale) in 10% of the urban area and 12% of the total area. See
Figure 11 for an overview of the earthquake hazard zones in the Waikato region.

                                 Figure 11: Earthquake Hazard Zones

Summary of material and hazard classes in Figure 11:

Doc # 2374632                                                                      Page 15
The most hazardous materials were formed less than 10,000 years ago. These have
high volcanic ash content, mixed with peat, clay, silt, ash, sand and gravel. They may
include layers that are easily saturated with water and are liquefiable.
Materials that are quite hazardous were formed less than 2.5 million years ago.These
include river and marine terrace deposits, lignite, dune sand, pumice, gravel and
ignimbrite (volcanic rock) flows.
Not very hazardous materials formed between 75 and 2.5 million years ago and include
sandstone, siltstone, mudstone, coal measures, limestone and conglomerate.The least
hazardous materials are Basement rocks formed more than 75 million years ago.
3.3 Drought
Historically, water shortage and drought within the Waikato region has not been as
severe as in other regions of New Zealand, such as Otago, Marlborough, and Hawke's
Bay. However, drought events have impacted communities and the Waikato region's
economy in the past few years, with the most recent declared drought in 2013. Areas
typically most affected by water shortage and drought conditions are the Hauraki
Plains, lower Waikato Basin, Thames-Coromandel, and Pukekohe areas.
A summary of the Waikato Regions recent droughts are summarised in Table 4.
Table 4: Recent drought in the Waikato Region
Year Effects
2007- 2008 This drought event lasted from November
2007 to April 2008, during which the
Waikato experienced its driest January in
a century. A shortage of feed caused by
the drought increased the price of silage
to four times its normal rate. The cost of
the drought was believed to be $1.5 billion
to the Dairy sector alone. The economic
effect of the drought was one of the
factors that threw New Zealand’s
economy into recession by mid 2008.
2009 The Waikato experienced a dry spring, the
effects of which were compounded by the
previous drought of 2007-2008.
2010 Waikato had two dry springs, which
resulted in a double drought. The drought
led to the owners of the Waikato River
hydro scheme, Might River Power,
announcing a 10 per cent drop in hydro
production for the December quarter.
Dairy farmers were estimated to have lost
an average $100,000- $150,000 in income
over the previous three years due to
consecutive drought events.
2013 This drought affected more of New
Zealand than any other drought in the
past 40 years. See Section 3.3.1.
2014 Parts of the Waikato Region, including
North to Central Waikato, Morrinsville
through to Tahuna and south to Te
Awamutu had very low soil moisture
levels, similar to those of 2013.
Page 16 Doc # 2374632NIWA has undertaken some specific research on how the frequency of drought might
change over the coming century. The resulting report (NIWA 2005) developed drought
risk projections for a range of climate change scenarios, corresponding to
approximately the middle 75% of the IPCC (Intergovernmental Panel on Climate
Change 3rd report)global temperature change projection range.
Under both the "low-medium" and the "medium-high" scenarios (which bracketed this
75% range), the drought risk was projected to increase in frequency during the coming
century for all areas that are currently drought prone.
Since drought affects a large area, the Matamata-Piako District would be affected if
drought was declared in the Waikato Region.
3.3.1 2013 Drought
The 2013 drought was a severe event and the impacts on farming and growth may
continue for years. NIWA has confirmed that for parts of Waikato the 2013 drought was
the worst in terms of soil moisture deficit in 40 years or, in some areas, as many as 70
years (as far back as records go). Figure 12: Soil moisture deficit maps for New
Zealand on 1 March 2013. shows a comparison of soil moisture deficits.
These record breaking levels were high enough for the entire North Island to be
declared in drought on March 15 2013. The cost of the drought for New Zealand was
estimated at $2 billion dollars.
Figure 12: Soil moisture deficit maps for New Zealand on 1 March 2013.
Changes in weather patterns can affect the likelihood of drought in our region. Both El
Niño and La Niña phases of the Southern Oscillation weather pattern can cause
droughts around the country, however an El Niño pattern is more likely to cause
droughts in the Waikato region. .However, the 2013 drought was not caused by either
El Niño or La Niña patterns.
NIWA found the 2013 drought was due to slow-moving high pressure systems over the
Tasman Sea and New Zealand during summer. These effectively blocked any other
sorts of weather systems approaching the country (NIWA 2013).
Doc # 2374632 Page 17Matamata-Piako District suffered along with all other districts in the Waikato Region.
Water restrictions were put in place and the town water supplies in Matamata,
Morrinsville and Waharoa were at critical levels during March 2013. Total fire bans
were in force and the farming community were suffering due to drying out crops and
grass for stock feed as well as increased prices for supplementary feed which lead to
pressure on farm cash flows and income.
Climate change is predicted to increase the frequency, severity and length of droughts
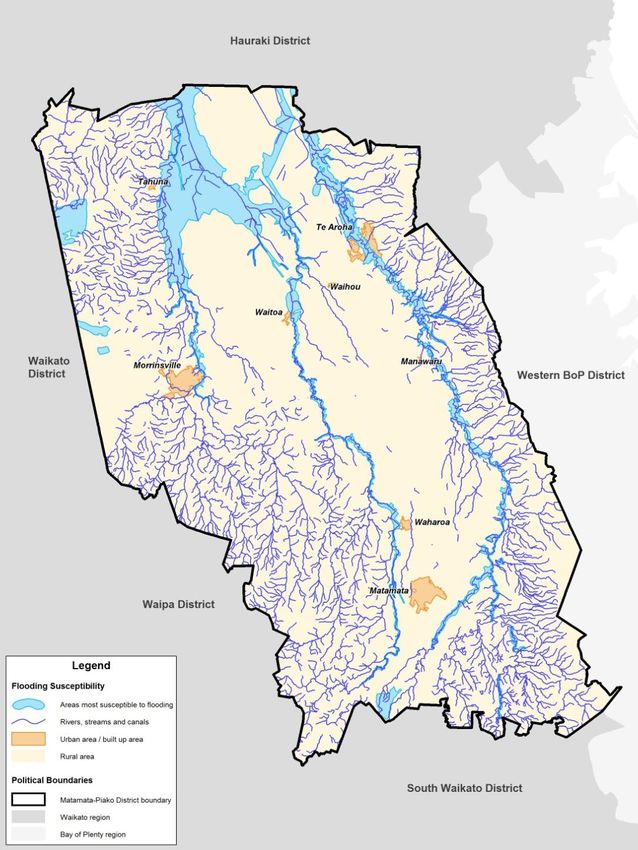
3.4 River flood hazards
Flooding is the most significant and frequent natural hazard that affects the Matamata-
Piako District (Figure 13). The district has two major river systems, the Piako and the
Waihou flowing through populated areas and prime agricultural land.
The Matamata Piako district is particularly vulnerable to flood events due to:
It’s geographic (northern location) making it susceptible to storms of tropical
origin.
The orographic effect of the Kaimai and Coromandel ranges which cause
localised, high intensity rainfall events on a regular basis.
Many catchments that drain the ranges are steep and short, creating flood
events and debris flows that are generally of short duration.
Te Aroha in particular is at risk of flooding due to the location of the town on
alluvial fans of Mt Te Aroha. Additionally the very steep catchments on the
mountain are likely to be unstable and subject to significant natural erosion
(BECA et al 1988).
The most significant hydrological event in recent history for flooding in the
Matamata-Piako District occurred on 17 February 1985. This event inundated
the Te Aroha township with flood waters and debris (BECA et al 1988).
While the construction of remedial options will improve flooding situations, the
design philosophy should be to reduce flooding to a minimal inconvenience
rather than provide protection against all circumstances. Maintenance will be an
important feature for the effective operation of any remedial or protective
structures.
Page 18 Doc # 2374632Figure 13: Flooding susceptibility in the Matamata-Piako District
3.5 Volcanic hazards
The Waikato region faces threat from future activity in the Taupo Volcanic Zone (TVZ),
Mayor Island, White Island, Rotorua volcanic field and the Taranaki volcano field.
Rhyolitic and andesitic volcanic centres in the TVZ have been active during most of the
Quaternary (approximately 1.6 million years ago), depositing large volumes of volcanic
material across the Waikato Region.
The magnitude of eruption could vary between violent to relatively quiet, largely ash
eruptions such asNgauruhoe and Ruapehu. While the amount of ash produced by an
eruption and the extent of fallout is variable and difficult to predict, large areas of
farmland and forest, some urban areas and many rivers are likely to be seriously
affected by ash and mud during a major eruption. Even relatively small thickness of ash
fall can have a significant impact on the environment and human activity.
The Matamata Piako District would possibly have to deal with the effects of ash fall
from a volcanic eruption from the TVZ, Taranaki or White Island volcanoes. See Table
5 for effects of volcanic ash fall.
Doc # 2374632 Page 19Table 5: Some effects of volcanic ash fall (Adapted from Edbrooke, 2005)
Less than 1mm ash thickness
Irritant to lungs and eyes
Possible contamination of water supplies
Minor damage to houses, vehicles and equipment caused by abrasive ash
1-5mm ash thickness
Effects that occur withFigure 14: Matamata-Piako District volcanic fallout range predictions
3.6 Debris flows
Very little is known about the current risk of debris flows across New Zealand. Rapid
development in New Zealand has led to an increasing use of alluvial fans for residential
development. As yet, there’s little appreciation of the hazards posed by infrequent but
devastating debris-flows on these fans.. The 1981 Te Aroha and more recently the
2005 Matata (Bay of Plenty region) debris flow events are examples of events which
have affected the Matamata-Piako District.
Debris-flows pose a hazard that is difficult to identify and manage. During an intense
rainstorm a small creek can generate several-metre-high surges of mixed boulders,
sediment and trees that can leave the channel and travel anywhere on an alluvial fan.
In a typical catchment, this process might occur only once in a century or two,
depending on the occurrence of sufficiently intense rain and the availability of sufficient
sediment.
Doc # 2374632 Page 21Figure 15: Image of the 1981 debris flow through Te Aroha
3.7 Severe Winds
Historically the western side of the Kaimai Range has been particularly prone to high
winds. Extreme winds have caused considerable damage and disruption to the district.
Historic events include those of 1936 and in 1978 when strong winds affected the
region. In 1978, winds of 140 knots were recorded on top of Mt Te Aroha.
There are also other areas within the District that are subject to local wind tunnelling. In
these areas what can appear to be a mild storm event can in fact result in quite
substantial wind damage to property. However, high wind zones can be identified, with
building standards and locations controlled according to the predicted level of risk.
Severe weather is a natural hazard event where further research is recommended.
3.8 Land instability
While only 2% of the district (or 3,282.73 hectares) has an erosion potential of
moderate or severe, the adjacent map "Erosion potential" shows that one of the most
severe of these areas is in the Kaimai Ranges above Te Aroha. Movement in this area
could cause severe effects in Te Aroha which is located on alluvial fans between the
Kaimai Ranges and the Waihou River. These alluvial fan deposits are very unstable
and prone to landslide, slips and erosion (Figure 16).
In 1996, ex-tropical cyclone Fergus hit the Coromandel Peninsula and caused
widespread damage. All major Coromandel roads were closed by slips and flooding
and a State of Emergency was declared for the Thames-Coromandel District, as well
as parts of Hauraki and Matamata-Piako Districts.
Page 22 Doc # 2374632Figure 16: Matamata Piako District landslide potential
3.9 Climate change
Normal climate cycles are being affected by a gradual increase in the levels of
greenhouse gases around the earth’s atmosphere. This could see a rise in sea levels
and changes in climate patterns, increasing the number of storms, rain, coastal
flooding and erosion in the region.
The Intergovernmental Panel on Climate Change (IPCC) has stated that future sea
level rise, in an unmitigated future rise in emission, is expected to be half a meter to a
meter by the end of this century. This rise is largely contributed to by ocean thermal
expansion due to warming, from changes in glaciers, Greenland ice sheet, Antarctic ice
sheet, and land water storage. A rise in this magnitude would threaten the survival of
coastal cities and entire island nations. Even with aggressive emissions reductions, a
rise by 28-61cm is still predicted. Even under this highly optimistic scenario we might
see over half a meter of sea-level rise, with serious impacts on many coastal areas,
including coastal erosion and a greatly increased risk of flooding.
Doc # 2374632 Page 23Human influence has been detected in warming of the atmosphere and the ocean, in
changes in the global water cycle, in reductions in snow and ice, in global mean sea
level rise, and in changes in some climate extremes. It is extremely likely that human
influence has been the dominant cause of the observed warming since the mid-20th
century and that more than half of the observed increase in global average surface
temperature from 1951 to 2010 was caused by the anthropogenic increase in
greenhouse gas concentrations and other anthropogenic factors. Continued emissions
of greenhouse gases will cause further warming and changes in all components of the
climate system. Limiting climate change will require substantial and sustained
reductions of greenhouse gas emissions.
The global mean surface temperature change for the period 2016–2035 relative to
1986–2005 will likely be in the range of 0.3°C to 0.7°C. This assessment is based on
multiple lines of evidence and assumes there will be no major volcanic eruptions or
secular changes in total solar irradiance. Relative to natural internal variability, near-
term increases in seasonal mean and annual mean temperatures are expected to be
larger in the tropics and subtropics than in mid-latitudes. It is virtually certain that there
will be more frequent hot and fewer cold temperature extremes over most land areas
on daily and seasonal timescales as global mean temperatures increase. It is very
likely that heat waves will occur with a higher frequency and duration. Occasional cold
winter extremes will continue to occur.
For the Matamata Piako District and wider Waikato region, rainfall is expected to vary
but higher annual rainfall is more likely in south and west parts of Waikato and lower
annual rainfall is more likely in Coromandel. Heavy rainfall events may become more
frequent in the Waikato.
The potential effects of climate change on the Waikato Region, including the
Matamata-Piako District include:
Changes in weather patterns – differences in rainfall, temperature and
microclimates could affect agriculture and horticulture. The location of some
industries, agriculture, horticulture and tourism may change.
More turbulent weather - extreme weather can increase flooding, erosion,
droughts, severe winds and damage ecosystems.
Sea level rise - higher sea levels will affect coastal communities increasing
coastal flooding and erosion.
Threats to biodiversity - species that are already under threat or at the limit of
their climatic range may not be able to survive.
New diseases and pests may take hold. Tropical pests and tropical diseases
like malaria may become established in areas where they currently do not exist.
An increase in the amount and frequency of rainfall could cause more river flooding in
some areas of the Matamata Piako District, while decreases may cause drought. Land
use, such as cropping and forestry may need to change to suit new weather patterns,
affecting runoff, hillside and valley drainage as well as increasing fire risks due to
vegetation changes.
4 Risk Assessment
4.1 Introduction
Having determined the most common and significant natural hazards in the Matamata-
Piako District, it is necessary to analyse and evaluate the level of risk associated with
each hazard. This will allow a comparison between different hazards in order to guide
prioritisation for the level of work effort. One important precursor to this exercise is
determining what the outcome or goal of the hazard mitigation work should be.
Suggested goals for both MPDC and WRC are:
Page 24 Doc # 2374632 To work towards the resolution of natural hazard issues in the district.
To minimise risks from natural hazards to people and infrastructure in the district.
To determine natural hazard management priorities for the purposes of long term
planning.
Work actions should be determined using the combination of agency goals, current
work commitments and level of risk associated with the hazard.
4.2 Description of scenarios
The assessment of risk can involve a broad range of approaches, including:
Checklists.
Judgements based on experience and records.
Brainstorming.
Flow charts and scenario analysis.
One of the most intuitive ways to describe risk is in the form of scenarios, and this
approach has been adopted for this risk assessment.
Based on the natural hazard commentary provided, a scenario has been developed for
each natural hazard that represents the ‘maximum credible event’. These scenarios are
outlined as follows:
River flood involving the 1 % AEP year flood event, resulting in widespread
inundation, as indicated by the existing flood hazard information.
Land instability following a 1 % AEP rainfall event, resulting in numerous
landslides on land that is identified as being highly or very highly susceptible
Volcanic activity involving a 0.1 % AEP event from the Taupo Volcanic Zone,
resulting in most of the district being covered in ash to a depth of 2 mm
(weather conditions permitting).
4.3 Risk assessment methodology
Risk analysis and evaluation typically involves determining the likelihood of a hazard
event occurring and the consequences of the hazard event. A commonly accepted
standard for risk management in New Zealand is the AS/NZS 4360: Risk Management
Standard. This standard is used as the basis for this report in order to:
Establish the context (Section 2)
Identify risks (Section 3)
Analyse risks (Section 4.4)
Evaluate risks (Section 4.4)
Treat risks.
Doc # 2374632 Page 254.4 Analysis and evaluation
Problematic to any risk analysis is the level of detail and characterisation of the
importance rankings. Table 6 shows a two stage approach to analysing and evaluating
risks. Stage 1 involves the evaluation of risk based on likelihood and consequences of
each scenario. Stage 2 involves a more detailed analysis based on the Risk Profile
Template (detailed in the CDEM Group Plan Review), which allows the evaluation of
risk based on these factors:
1. Seriousness: The measure of the potential impact, based on five areas that may be
impacted (i.e. human, social, economic, infrastructure and geographic).
2. Manageability: The measure of the ability to manage either the hazard or the
potential impacts on the community.
3. Growth rating: The measure of the potential for the risk to grow (e.g. the hazard
may occur more frequently or the community exposure to the hazard may
increase).
The 2 stage approach to risk evaluation is necessary to allow the prioritisation of risks
that receive the same evaluation during Stage 1 (e.g. ‘high’).
Page 26 Doc # 2374632Table 6: Risk analysis and evaluation
Risk Evaluation
Seriousness Manageability Growth
Consequence
Likelihood
Readiness
Reduction
Economic
Response
Hazard Scenario Total Priority
Recovery
Sub-total
Sub-total
Natural
Sub-total
Social
Built
Earthquake 3 3 4 4 3
B 4 4 4 4 3 7.8 3.5 14.3 1
MM MM HL HM MM
Drought 5 5 3 2 3
A 3 3 1 4 3 5.3 3.75 12.1 2
HL HL HH MH MM
Flooding (river and drainage) 3 3 1 3 2
A 3 4 4 3 3 7.5 2.5 12.0 3
MM MM LH MM ML
Severe wind 4 4 3 2 1
A 4 3 3 2 3 5.7 3.25 10 4
LL LL MM LM LL
Volcanic ashfall 4 4 4 4 1
C 2 2 3 3 2 4.8 4 9.8 5
LL LL LL LL LL
Debris flow 3 3 4 4 2
C 5 2 2 2 3 4.2 3.5 9.7 6
HH HH HM HM ML
Land Instability 2 2 5 3 2
A 2 2 2 1 2 3.7 3 8.7 7
LM LM HL HH ML
Rural fire 2 2 2 2 2
C 2 2 1 1 4 3.6 2 7.6 8
MH MH MH LM ML
Note: An outline of the terms and scales used in Table 6 are presented in Appendix 6: Key to Table 2 (risk analysis evaluation key).
Doc # 2374632 Page 27 The hazards listed under “Hazard Scenario” have been identified as being most
relevant to the Matamata-Piako District based on the discussion in Section 3.
These natural hazards are all identified as creating a significant risk to the
Matamata-Piako District, with earthquake and drought being identified as being
particularly significant.
Further analysis of these natural hazards using the Risk Profile model confirms that
earthquake and drought are most significant, followed by flooding, severe wind and
volcanic ashfall.
The priority assigned to earthquake is driven by the seriousness of the hazard,
along with the potential for the risk associated with the hazard to escalate due to
both increased development and increased awareness of the hazard type due to
the 2011 Christchurch Earthquake.
Volcanic ashfall has been assigned the fourth highest priority out of the 8 hazards,
but it is noted that this hazard has received the highest ‘manageability’ rating,
indicating the lack of measures available to prevent the hazard from occurring.
River flooding is assigned a lower priority than earthquake or drought due to a
lower manageability and growth rating. However, it is important to note that this
priority is based on the current environment, and that there is a significant potential
for the risk associated with this hazard to escalate due to inappropriate
development and medium to long term changes in the natural environment (e.g.
sea level rise and the natural dynamics of the coastal environment).
4.5 Residual risks
Residual risk is the term used to define those risks that cannot be defined in more
detail after elimination or inclusion of all conceivable quantified risks have been
addressed. Residual risk can also be described in terms of “the bigger than event”. For
example, if planning and operational measures are only implemented against the 1 %
AEP event scenario, then anything larger (e.g. 0.2 % or 0.1 % AEP events) would be
considered a residual risk.
Figure 17: Internal stopbank flooding creates residual risk
Page 28 Doc # 2374632WRC aims to address the residual risk component through the proposed regional flood
risk management strategy. Residual risk is also a key consideration within the
proposed national and regional flood risk management strategies.
4.6 Conclusion
As a result of the risk assessment and evaluation, it is concluded that earthquake,
drought and flooding are the highest priority natural hazards currently facing the
Matamata-Piako district. The reasoning for this conclusion is presented in Table 6.
Doc # 2374632 Page 295 Summary, discussion and
recommendations
5.1 Summary of natural hazard risks
While drought, river flooding (river and drainage) and volcanic ashfall have been
identified as important natural hazard priorities for the Matamata-Piako District, they do
not carry the same level of risk as earthquakes. Earthquakes carry greater threat in
terms of social disruption, economic cost, infrastructure damage and possibly loss of
human life. It should also be noted that earthquakes have the potential to affect other
natural hazard risks in the district, particularly flooding in terms of damaging existing
flood protection schemes. This is an important consideration for the district in light of
possible future growth and the associated pressure to increase development in known
flood hazard areas.
Further discussion regarding the basis for this prioritisation of natural hazard risks in
the Matamata-Piako District can be found in Sections 3 and 3.9.
5.2 Discussion
The following discussion is relevant to natural hazards in the Matamata-Piako District:
The proposed prioritisation of natural hazards in the Matamata-Piako District is
based on a variety of considerations. It is however important to note that the
relative significance of a natural hazard is generally dependant on the nature of
development on susceptible land. It is therefore important that a range of natural
hazards continue to be considered when planning for future growth, including those
hazards that are currently assessed as being less significant.
The characteristics of most natural hazards are dependent on the natural
environment. Therefore, a natural hazard that is currently relatively insignificant
may become significant following changes in the environment (e.g. climate change
that is currently predicted due to global warming or a change in the coastal
environment accelerating in coastal erosion).
This assessment is at a District Scale and is intended to assist with the
identification of issues that may need to be considered. This may include a trigger
for a more site specific assessment to confirm/discount any specific natural hazard
threats.
5.3 Recommendations
As a result of this qualitative risk assessment, the following recommendations are
proposed for the Matamata Piako District with regard to the management of natural
hazards:
It is recommended that earthquake risk be considered the highest priority
natural hazard affecting the Matamata Piako District. This is because of the
existing level of risk, along with the potential for the risk to escalate due to
future development.
It is also recommended that the approach to the management of earthquake
risks is developed to be consistent with the Regional and National approaches
(e.g. Earthquake Risk Mitigation Plan, Building Act 2004).
Page 30 Doc # 2374632 It is recommended that the Matamata Piako District Plan be adopted as a key
tool to reduce the risk and potential impact of natural hazards, particularly those
identified as having a priority in the Matamata Piako District (e.g. earthquake,
drought, flooding and volcanic ashfall).
The significance of various natural hazards in the Matamata Piako District is
partially dependant on the appropriate development of susceptible land. It is
therefore recommended that the full range of natural hazards continue to be
considered when planning for future growth, even those that have been
identified as relatively insignificant by this assessment.
MPDC and WRC continue to address the natural hazard risks together through
sharing of information and sound policy and strategy formulation and
implementation.
5.3.1 Further research
This report has highlighted the need for further research to be conducted in the interest
of natural hazard risk reduction in the Matamata-Piako District. This research includes
assessment and implications on the following natural hazards:
Liquefaction
Climate change
Severe wind
Doc # 2374632 Page 316 References/Bibliography
6.1 Research
BECA Carter Hollings & Ferner Ltd. 1988. Te Aroha Borough District Scheme review –
Flood hazard assessment and remedial options. Prepared for Te Aroha
Borough Council. Te Aroha, New Zealand.
Edbrooke SW 2005. Geology of the Waikato area : scale 1:250 000. Lower Hutt,
Institute of Geological and Nuclear Sciences Limited. Beanland S, Drummond
G, Huber P, Hull A, Townsend T 1996. Earthquake hazard assessment
Environment Waikato (Regional Council) area. Environment Waikato Technical
Report 1996/17. Hamilton, Waikato Regional Council (Environment Waikato).
GNS Science. Earthquake.
http://info.geonet.org.nz/display/quake/Earthquake [accessed 11 December
2013]
Jane GT, Green TGA 1984. Ecological aspects of climate patterns within the Kaimai
Ranges, North Island, New Zealand. New Zealand Journal of Ecology 7: 183-
197.
Ministry for the Environment 2012. Climate change projections for the Waikato region.
http://www.mfe.govt.nz/issues/climate/about/climate-change-affect-
regions/waikato.html [Accessed 9 January 2014]
Ministry for the Environment 2013. Improving our resource management system: A
discussion document. Wellington, Ministry for the Environment.
NIWA 2013. Water and Atmosphere: September 2013 edition, Wellington, National
Institute of Water and Atmosphere Research.
Saunders WSA, Berryman KR 2012. Just add water: when should liquefaction be
considered in land use planning? GNS Science Miscellaneous Series 47. Lower
Hutt, GNS Science.
Warrick RA, Kenny GJ, Harman JJ 2001. The effects of climate change and variation in
New Zealand: An assessment using the CLIMPACTS System. Hamilton,
University of Waikato, International Global Change Institute.
6.2 Legislation and national standards
Building Act, 2005
Civil Defence Emergency Management Act, 2002
Land Drainage Act, 1908
Local Government Act, 2002
Local Government Official Information and Meetings Act, 1987
Public Works Act, 1981
Reserves Act 1977
Page 32 Doc # 2374632Resource Management Act, 1991 Soil Conservation and Rivers Control Act, 1941 AS/NZS 4360: Risk Management Standard Doc # 2374632 Page 33
7             Appendix 1: Statutory and legal
                      framework
7.1         The Resource Management Act (RMA) 1991
7.1.1       Introduction
            The RMA sets in place a planning framework with respect to hazard management. The
            Act defines the role of central government agencies, such as the Department of
            Conservation, and regional and district councils such as WRC and MPDC respectively.
            The mechanisms to achieve this include a hierarchy of linked interrelated policy
            statements supported by non-statutory documents such as action plans developed to
            address individual (river flooding) or a suite of related hazards (coastal erosion and
            flooding).

            The RMA assigns to regional councils responsibility for the integrated management of
            natural and physical resources within their region. Regional councils are required to
            control the use of land, the taking and use of water, and the planting of plants in water
            bodies for soil conservation, the quality of water, the quantity of water, and the
            avoidance or mitigation of natural hazards. Regional and district functions are specified
            by the Act and are outlined in Appendix 2.

7.1.2       Long-term management strategies
            The RMA provides for the long-term management of hazards through various policy
            mechanisms, some of which are discussed above. These include, in the case of
            coastal hazards, the New Zealand Coastal Policy Statement and regional coastal
            plans, and for other hazards regional policy statements, and district plans. Policy
            implementation is given effect through various methods and can include non-statutory
            mechanisms such as education programmes, advocacy and community consultation
            and engagement; or statutory mechanisms such as the application of rules and
            standards in respect of defined zones. Monitoring strategies provide feedback on the
            effectiveness of the various methods employed to mitigate or avoid the adverse effects
            of hazards.

7.1.3       Short-term management strategies
            Section 330 of the RMA builds on powers presently available to Council pursuant to the
            Public Works Act 1981 (s.234) and the Local Government Act 1974 (s.708A(3)). The
            section permits activities in an emergency situation that might otherwise contravene the
            Act. The section empowers employees and agents of councils to enter upon land and
            take action in an emergency situation. Section 331 of the Act requires that the
            appropriate consent authority must be advised when emergency works have been
            undertaken. Resource consents must be sought where adverse effects of the activity
            continue. The provisions and a discussion of section 330 is outlined in Appendix 3.

7.2         Resource management policy statements
7.2.1       Introduction
            The RMA requires that a hierarchy of policy documents is prepared by central, regional
            and local government bodies with respect to resource management issues generally
            including the management of natural hazards. The documents are interrelated (to
            achieve integrated management) and the Act requires that subordinate regional and

            Page 34                                                                     Doc # 2374632
You can also read