Seismic vulnerability and risk assessment of Kolkata City, India
←
→
Page content transcription
If your browser does not render page correctly, please read the page content below
Nat. Hazards Earth Syst. Sci., 15, 1103–1121, 2015
www.nat-hazards-earth-syst-sci.net/15/1103/2015/
doi:10.5194/nhess-15-1103-2015
© Author(s) 2015. CC Attribution 3.0 License.

Seismic vulnerability and risk assessment of Kolkata City, India
S. K. Nath, M. D. Adhikari, N. Devaraj, and S. K. Maiti
Department of Geology and Geophysics, Indian Institute of Technology Kharagpur, 721302, West Bengal, India

Correspondence to: S. K. Nath (nath@gg.iitkgp.ernet.in)

Received: 10 December 2013 – Published in Nat. Hazards Earth Syst. Sci. Discuss.: 30 April 2014
Revised: 2 December 2014 – Accepted: 4 May 2015 – Published: 2 June 2015

Abstract. The city of Kolkata is one of the most urbanized          last 100 years accounted for more than 1.9 million deaths.
and densely populated regions in the world and a major in-          An estimated average of 17 000 persons were killed ev-
dustrial and commercial hub of the eastern and northeastern         ery year. Seismic vulnerability in India is well evidenced
region of India. In order to classify the seismic risk zones        by numerous past earthquake-related calamities viz. 1993
of Kolkata we used seismic hazard exposures on the vulner-          Killary earthquake of Mw = 6.2, 1997 Jabalpur earthquake
ability components, namely land use/land cover, population          of Mw = 5.8, 1999 Chamoli earthquake of Mw = 6.8, 2001
density, building typology, age and height. We microzoned           Bhuj earthquake of Mw = 7.7, 2005 Kashmir earthquake of
seismic hazard of the city by integrating seismological, ge-        Mw = 7.6 and 2011 Sikkim earthquake of Mw = 6.9. The
ological and geotechnical themes in GIS, which in turn are          2001 Gujarat earthquake inflicted a total economic loss of
integrated with the vulnerability components in a logic-tree        about USD 4600 million approximately. The memory of the
framework for the estimation of both the socioeconomic and          tsunami-genic 2004 Sumatra earthquake of Mw = 9.1 that
structural risk of the city. In both the risk maps, three broad     wiped out more than 227 000 lives is still very fresh. Accord-
zones have been demarcated as “severe”, “high” and “mod-            ing to the Vulnerability Atlas of India published by the Build-
erate”. There had also been a risk-free zone in the city that is    ing Materials and Technology Promotion Council, more than
termed as “low”. The damage distribution in the city due to         59 % of the total land cover of the country is susceptible to
the 1934 Bihar–Nepal earthquake of Mw = 8.1 matches sat-            seismic hazard (BMTPC, 1997). Additionally, unplanned ur-
isfactorily well with the demarcated risk regime. The design        banization is expanding rapidly across the country to accom-
horizontal seismic coefficients for the city have been worked       modate the burgeoning population. The fatalities in the urban
out for all the fundamental periods that indicate suitability for   agglomerations due to future great Himalayan earthquakes
“A”, “B” and “C” type of structures. The cumulative damage          have been predicted to be around 150 000 and 200 000 (e.g.,
probabilities in terms of “none”, “slight”, “moderate”, “ex-        Wyss, 2005; Bilham et al., 2001). Dunbar et al. (2003) put
tensive” and “complete” have also been assessed for the pre-        the maximum expected earthquake loss in the country to be
dominantly four model building types viz. RM2L, RM2M,               about USD 350–650 million for the next 50 years at 10 %
URML and URMM for each seismic structural risk zone in              probability of exceedance.
the city. Both the seismic hazard and risk maps are expected           The Kolkata metropolitan city is one of the most densely
to play vital roles in the earthquake-inflicted disaster mitiga-    populated regions in the world and as a major business and
tion and management of the city of Kolkata.                         industrial hub of east and northeast India it supports vital
                                                                    industrial and transportation infrastructures. The metropoli-
                                                                    tan city is placed at the margin of seismic zones III and IV
                                                                    as per the seismic zoning map of India (BIS, 2002). Sitting
1   Introduction                                                    on a sedimentary basin of 7.5 km thickness above the crys-
                                                                    talline basement it is highly vulnerable to earthquake disas-
Earthquakes are a major menace to mankind, killing thou-            ters. The city was affected by near and far sources like the
sands of people every year in different parts of the globe.         Bihar–Nepal seismic zone in the Central Seismic Gap, As-
According to an estimate from National Geophysical Data             sam Seismic Gap, Shillong Plateau, Andaman-Nicobar seis-
Center (http://www.ngdc.noaa.gov), earthquakes during the

Published by Copernicus Publications on behalf of the European Geosciences Union.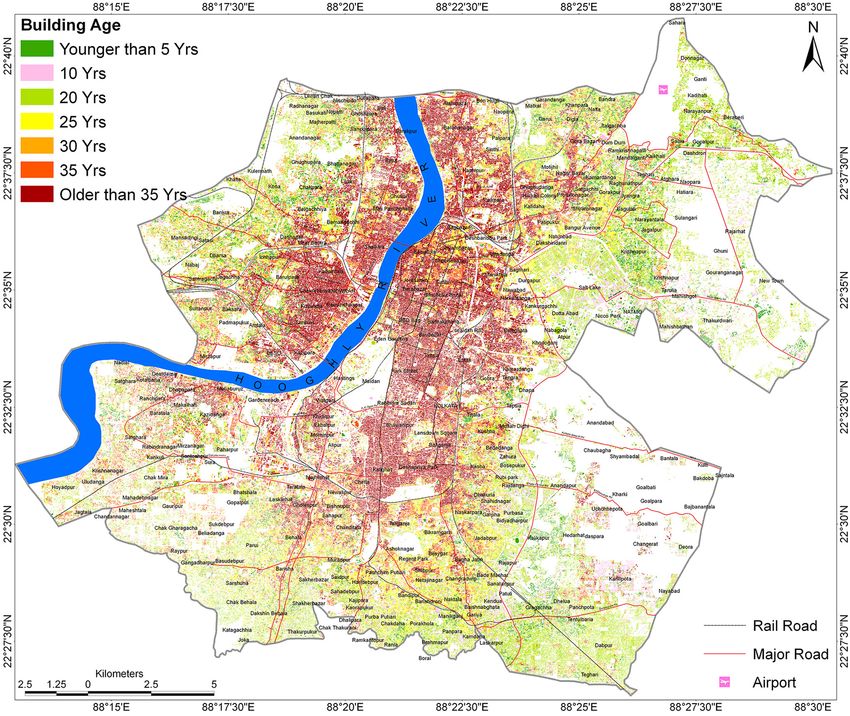
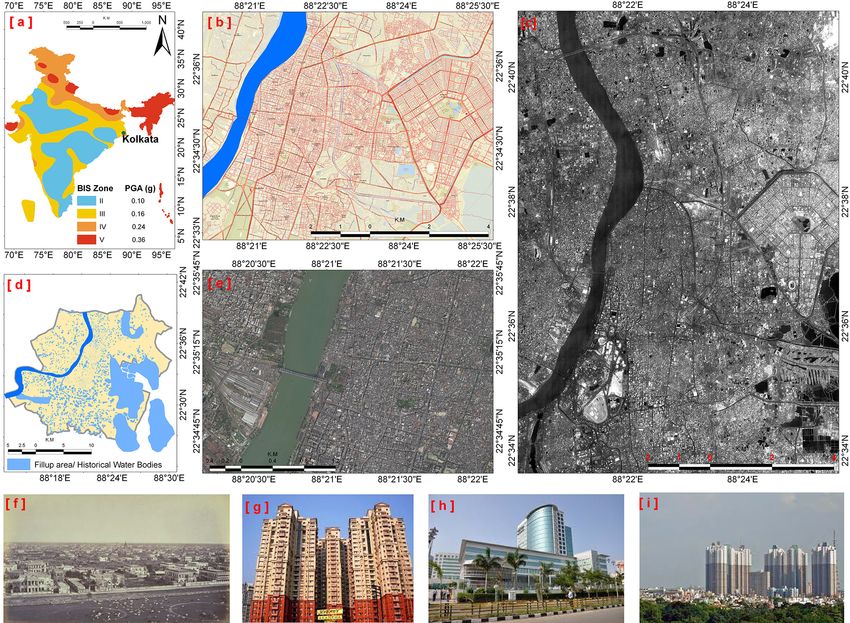
1104                                            S. K. Nath et al.: Seismic vulnerability and risk assessment of Kolkata City

mic province, Bengal Basin and the NE Himalayan extent            tential of prevalent building typologies viz. RM2L, RM2M,
(Nath et al., 2014). It is, therefore, apparent that earthquake   URML and URMM in the city of Kolkata. The open-source
catastrophes may happen anytime in the near future unless         software package SELENA (Molina et al., 2010) has been
preventive measures are urgently taken towards disaster mit-      used for the assessment of discrete damage probability con-
igation and management. Thus the vulnerability analysis of        sidering different sets of building vulnerability curves in
the city of Kolkata as undertaken in the present study in-        terms of its capacity and the associated fragility.
volves multi-criteria risk evaluation through thematic inte-         The spatial distribution of different vulnerability and risk
gration of contributing vulnerability components viz. demog-      entities is generated on a GIS platform and subsequently in-
raphy, land use/land cover (LULC), building typology, build-      tegrated through analytical hierarchal process (AHP) (Saaty,
ing age and building height.                                      1980). The ultimate goal of both the seismic hazard and seis-
   The number of fatalities due to an earthquake is associ-       mic risk analysis is to develop the elements that can be used
ated with the vulnerability of local buildings, population den-   towards urban seismic safety. Thus, the study of seismic haz-
sity and the intensity of ground shaking. Vulnerability expo-     ard and microzonation of the cities and urban centers enable
sure refers to all man-made facilities, namely the residen-       us to characterize potential seismic vulnerability/risk, which
tial, commercial and industrial buildings, schools, hospitals,    needs to be taken into account while designing new settle-
roads, bridges, pipelines, power plants and communication         ment and lifeline facilities or retrofitting the existing ones.
network, where an eventual seismic risk is predicted when         The risk appraisals, aimed at promoting reasonable hazard
exposed to seismic hazard. The seismic hazard is generally        mitigation regulations, are generally based on vulnerability
assumed to be stable over a long geological time while the        aspects such as socioeconomic aspects of land use and de-
typical vulnerability (and, therefore, the risk) to the hazard    mographic distribution and the structural aspects of building
changes (McGuire, 2004). The risk is assessed as a con-           typology.
volution function of the hazard and the vulnerability, i.e.,
risk = hazard · vulnerability. For the safety and sustainabil-
ity of urban regions, it is, therefore, imperative to imple-      2   The city of Kolkata
ment long-range urban planning and risk assessment mech-
anisms that rely heavily on accurate and multidisciplinary        The Kolkata metropolis, the second largest urban agglom-
urban modeling. Therefore, the decisions to mitigate seis-        eration in India, bounded by latitudes of 22◦ 270 –22◦ 400 N
mic risk require a logical but robust approach as given in        and longitudes of 88◦ 180 –88◦ 280 E, has developed primarily
HAZUS (1999) and RADIUS (2000) for evaluating the ef-             along the eastern bank of the River Hooghly about 150 km
fects of future earthquakes on both people and infrastruc-        north of the Bay of Bengal, right over the Ganges delta. The
ture. In the present investigation we propose an alternative      population of Kolkata was 1.5 million in 1901, 11 million
approach based on information extracted from satellite im-        in 1991 and a phenomenal 14 million in 2011 according to
agery, Google Earth and rapid visual screening for a broader      the census report. Due to enormous population pressure it
estimation of socioeconomic and structural vulnerability of       has encroached into the back swamp and marshy land to the
the city of Kolkata and the seismic risk thereof. The proto-      east, filling up extensive areas, especially in the Salt Lake
col consists firstly of seismic hazard microzonation involving    and Rajarhat regions, in an unplanned manner. More than
the division of a region into subregions considering differ-      80 % of the city has built-up areas with high-rise residential
ent hazard themes: (i) peak ground acceleration (PGA) at the      buildings, congested business districts, hospitals and schools,
surface, (ii) liquefaction potential index (LPI), (iii) NEHRP     etc. (Nandy, 2007), some of which are very old and in di-
soil site class (SC), (iv) sediment class (SEC), (v) geomor-      lapidated condition with unplanned construction adhering
phology (GM) and (vi) ground water table integrated on a          to non-seismic safety standards. Demography in some parts
hierarchical framework with the assignment of appropriate         of the city exhibits population density above 100 000 km−2 .
weights to each theme and associated ranks to the feature in      Figure 1 depicts the study region, which is urban Kolkata
each theme. Each hazard theme and the probabilistic seismic       with typical urban attributions.
hazard assessment at both the rock level and surface consis-         Kolkata is situated in the Bengal Basin, a huge pericra-
tency have been described in details in Nath et al. (2014).       tonic Tertiary basin with fluviomarine sediments of enor-
Secondly, the development of socioeconomic and structural         mous thickness (Dasgupta et al., 2000). The Bengal Basin
seismic vulnerability exposures population density, building      can be divided into three structural units: the westernmost
typology, building height, land use/land cover, building age,     shelf or platform, the central hinge or shelf/slope break and
etc. using remote sensing, and GIS (Geographical Informa-         deep basinal part in the east and southeast that presently
tion System) comprises an integral component which is used        open in the Bay of Bengal (Alam et al., 2003; Das and
to develop socioeconomic and structural seismic risk themes       Chattopadhyay, 2010). Kolkata is located over the western
as vector layers in GIS through integration of seismic hazard     part of the hinge zone across which sediment thickness and
with socioeconomic and structural vulnerability elements.         facies significantly varies from shelf area in the west to
An attempt thereupon is made to characterize the damage po-       the deep basinal part in the east. The most prominent tec-

Nat. Hazards Earth Syst. Sci., 15, 1103–1121, 2015                       www.nat-hazards-earth-syst-sci.net/15/1103/2015/
S. K. Nath et al.: Seismic vulnerability and risk assessment of Kolkata City                                                            1105

Figure 1. Urban Kolkata, the study region of the present investigation: (a) seismic zonation of India (BIS, 2002); (b) road network of
the central part of the city; (c) the dense urban settlement of central Kolkata and Salt Lake regionas depicted in Cartosat-1 DEM (2011);
(d) fill-up area/historical water bodies captured from Landsat MSS (1973) and the available historical maps (Rumsey, 1800, 1958, http:
//www.davidrumsey.com); (e) GEO-eye (http://www.esri.com/data/basemaps) image of central Kolkata; and (f–i) representative old structure,
skyscraper, steel structure, multi-storied structures of the city (see electronic supplement for a higher resolution version of this diagram).

tonic feature in the Bengal Basin is the NE–SW trending                     The city has been rocked time and again by both near-
Eocene Hinge Zone (EHZ), also known as the Calcutta–                     and far-field earthquakes of moderate to large magni-
Mymensingh Hinge Zone. The EHZ is 25 km wide, ex-                        tudes. Among the far-source earthquakes felt in Kolkata are
tending to a depth of about 4.5 km below Kolkata. The                    the 1897 Shillong earthquake of Mw = 8.1, 1918 Sriman-
hinge zone and the deep basin are overlain by thick allu-                gal earthquake of Mw = 7.6, 1930 Dhubri earthquake of
vium to a maximum depth of about 7.5 km. The tectonic                    Mw = 7.1, 1934 Bihar–Nepal earthquake of Mw = 8.1, 1950
grains of the Main Boundary Thrust, Main Central Thrust,                 Assam earthquake of Mw = 8.7 and 2011 Sikkim earthquake
Main Frontal Thrust, Dhubri Fault, Dauki Fault, Oldham                   of Mw = 6.9.The Bihar–Nepal earthquake of Mw = 8.1 in-
Fault, Garhmoyna–Khandaghosh Fault, Jangipur–Gaibandha                   duced Modified Mercalli (MM) intensity of the order of VI–
Fault, Pingla Fault, Debagram–Bogra Fault, Rajmahal Fault,               VII in Kolkata (GSI, 1939) and caused considerable dam-
Malda–Kishanganj Fault, Sainthia–Bahmani Fault, Purulia                  age to life and property. The two near-source earthquakes re-
Shear Zone, Tista Lineament and Purulia Lineament largely                ported in Kolkata are the 1906 Kolkata earthquake with MM
influence the seismicity of the region. Besides its nearby               intensity V–VI (Middlemiss, 1908) and the 1964 Sagar Is-
sources, Kolkata is affected by far sources like Bihar–Nepal             land earthquake of Mw = 5.4 with damage intensity of MM
seismic zone in the Central Seismic Gap, Assam Seismic                   VI–VII surrounding the city (Nath et al., 2010). However,
Gap, Shillong Plateau, Andaman–Nicobar seismic province                  the maximum intensity reported in Kolkata is MM VII, gen-
and the NE Himalayan extent (Nath et al., 2014).                         erated from both the near-source earthquake of 1964 and the

www.nat-hazards-earth-syst-sci.net/15/1103/2015/                                 Nat. Hazards Earth Syst. Sci., 15, 1103–1121, 2015
1106                                            S. K. Nath et al.: Seismic vulnerability and risk assessment of Kolkata City

distant earthquake of 1934, making the city highly vulnerable
to seismic threat (Nath et al., 2014).

3   Vulnerability exposures and thematic data layer
    preparation

Unplanned urbanization defying building codes is continu-
ously increasing the earthquake vulnerability of Kolkata, ne-
cessitating systematic assessment of seismic vulnerability by
identifying those factors contributing to seismic risk in terms
of socioeconomic and structural aspects. To understand the
vulnerability of the built-up environment and infrastructure,
a spatial/non-spatial database of building typology, building
height, building age, land use/ and cover, population density
and lifeline utilities has been created. These earthquake risk
elements have been studied for different vulnerability levels
in the seismic hazard microzonation perspective. Vulnerabil-      Figure 2. Seismic vulnerability assessment protocol.
ity index of various factors is calculated by defining an ordi-
nal scale; overall vulnerability index maps of the study region
have been prepared representing both the socioeconomic and        while kappa is close to 0, indicating “poor” agreement (Lan-
structural entities. Figure 2 presents a framework for seismic    dis and Koch, 1977). The “Margfit” procedure has also been
vulnerability and risk assessment of the city of Kolkata.         used on each error matrix through the application of a FOR-
   The most common way of representing the confidence             TRAN code “Margfit” available in Congalton (1991). The
level in the assessment of remote sensing data is by com-         underlying methodology utilizes an iterative proportional fit-
puting an error matrix (Congalton, 1991). We derive error         ting to conform to the sum of each row and column in the
matrices for both the structural and socioeconomic vulner-        error matrix to a predetermined value. A normalized accu-
ability exposures for comparisons. It is based on the widely      racy is calculated by summing the values on the major di-
used accuracy assessment technique of statistical correlations    agonal and dividing it by the sum of the total values in the
between two map data sets – one categorized from the rapid        normalized error matrix (Congalton and Green, 1999). As a
visual screening (RVS) which we term as the “reference”           result, both the producer’s and user’s accuracies have been
and the other derived exclusively from remote sensing data        incorporated in the normalized cell value, which is based on
which is termed as “classified” (Story and Congalton, 1986;       a balanced effect of the two accuracy measures (Congalton
Jensen, 1996). The correlation indicators used in the present     and Green, 1999). In the present study, the structural and
analysis include “overall accuracy”, i.e., the percentage of      socioeconomic vulnerability exposures derived from satel-
matched data between the “reference” and the “classified”         lite imagery in case of building typology and land use/land
maps; “user’s accuracy”, i.e., the percentage of matched data     cover and that generated from Google Earth 3-D aspect for
in the “classified” map; “producer’s accuracy”, i.e., the per-    building height are used as “classified” data, while those de-
centage of matched data in the “reference” map; and the           rived through rapid visual screening from 1200 survey loca-
kappa value defining a measure of the differences between         tions being considered as “reference” data have been used
the “reference” and the chance agreement between both the         for the accuracy assessment of all the themes. For rapid vi-
maps (Jensen, 1996; Congalton and Mead, 1983). The kappa          sual screening a hand held GPS (Global Positioning System)
value is expressed as (Bishop et al., 1975)                       is used for coordinate generation at each of the 1200 loca-
         r             r
                                                                  tions and the survey is conducted on the vulnerability types
                                                                  as has been depicted in Fig. 3 for sample RVS of building
         P             P
     N         Xii −         (Xi+ X+i )
k=
         i=1           i=1
                                          ,                (1)    heights at four locations in the city.
                 r                                                   The key issue for studying the earthquake vulnerability
         N2 −
                 P
                       (Xi+ X+i )
                 i=1                                              and seismic risk of urban areas is the availability of maps
                                                                  and statistical information that concern the infrastructure of
where N is the total number of sites in the matrix, r is the      the urban centers (Sarris et al., 2010). For best possible as-
number of rows in the matrix, Xii is the number in row i          sessment of the vulnerability exposures and hence risk of an
and column i, Xi+ is the total for row i and X+i is the total     earthquake-prone district, it is necessary to gather maximum
for column i. The kappa statistics > 0.80 suggests “strong”       possible information as proposed in the HAZUS risk assess-
agreement, a value within a range of 0.60–0.80 suggests           ment model that require detailed inputs on structural con-
“good” agreement and the chance of agreement is remote            figuration in terms of design, shape, height and number of

Nat. Hazards Earth Syst. Sci., 15, 1103–1121, 2015                        www.nat-hazards-earth-syst-sci.net/15/1103/2015/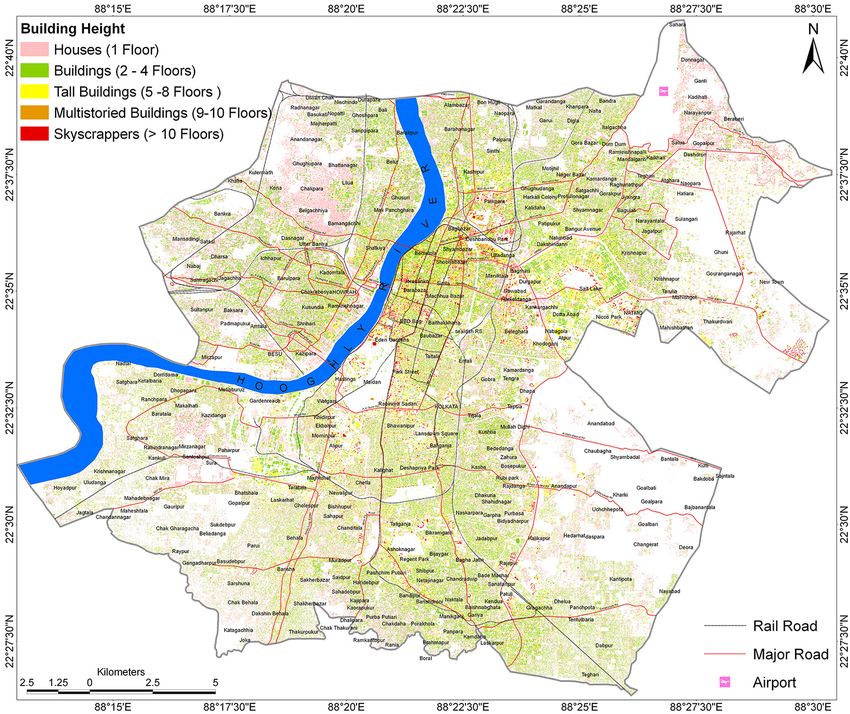
S. K. Nath et al.: Seismic vulnerability and risk assessment of Kolkata City                                                       1107

Figure 3. Rapid visual screening (RVS) survey (at about 1200 sites) for field and Google Earth comparisons of existing building height in
urban Kolkata for potential seismic vulnerability assessment.

stories, building proximity, lateral strength, stiffness, ductil-      3.1   Demography
ity, foundation, material, construction practice, etc. (Sarris et
al., 2010). The study is focused on building-specific analysis         Population vulnerability exposure can easily be estimated
from building inventory of a group of buildings with similar           from census data, which provide an average number of per-
characteristics and classifications. However,in the present in-        sons per parcel/ward and also its relation to building types.
vestigation we proposed an alternative approach based on the           The population of urban Kolkata increased from 1.5 million
information extracted from satellite imagery, Google Earth             in 1901 to 14 million in 2011 as illustrated in Table 1.
and rapid visual screening for a broader estimation of socioe-         Amongst the total population, the following groups are most
conomic and structural vulnerability of the city of Kolkata            vulnerable to seismic shaking: the female population, age-
and its seismic risk.                                                  wise population below 7 and above 65, day and nighttime
                                                                       population, and illiterate and unemployed population. This is
                                                                       well exemplified by the questionnaire for the Indian census
                                                                       (Census India, 2011). From Fig. 4 it is observed that the pop-

www.nat-hazards-earth-syst-sci.net/15/1103/2015/                              Nat. Hazards Earth Syst. Sci., 15, 1103–1121, 2015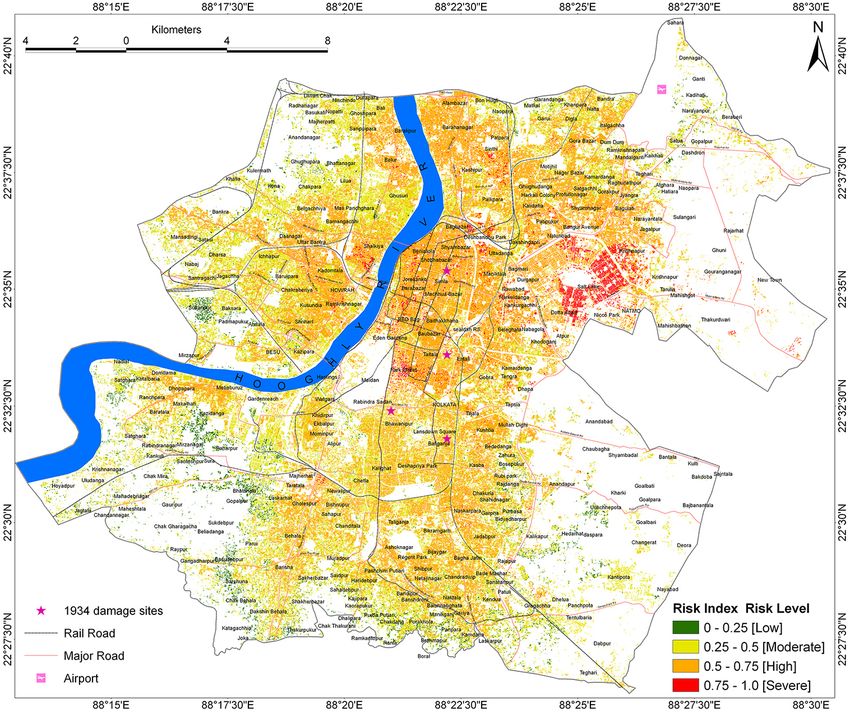
1108 S. K. Nath et al.: Seismic vulnerability and risk assessment of Kolkata City
Table 1. Population growth of urban Kolkata during 1901–2011
(Census India, 2011; http://censusindia.gov.in).
Years Population Population Population
growth growth rate
(%)
1901 1 510 008 – –
1911 1 745 198 235 190 15.58
1921 1 884 584 139 386 7.99
1931 2 138 563 253 979 13.48
1941 3 621 413 1 482 850 69.34
1951 4 669 559 1 048 146 28.94
1961 5 983 669 1 314 110 28.14
1971 7 420 300 1 436 631 24.01
1981 9 194 018 1 773 718 23.90
1991 11 021 918 1 827 900 19.88
2001 13 205 697 2 183 779 19.81
2011 14 112 536 906 839 7.6
Figure 4. Population density distribution of Kolkata (after data from
Census India, 2011).
ulation density is very high in the Barabazar, Taltala, Kali-
daha, Beniatola, Khidirpur, Metiaburuz and Shyambazar re-
gions.
3.2 Land use/land cover
LULC provides information about the predominant urban
land cover and socioeconomic attributes that can be ex-
tracted by carrying out an object-oriented LULC classifi-
cation on National Atlas and Thematic Mapping Organiza-
tion (NATMO) nomenclature. LULC classes are mostly de-
fined by the alignment of buildings, streets, agricultural land,
vegetation, plantation, water body, open spaces, etc. In the
present study LISS-IV and PAN 2010 (NRSC Data Center,
ISRO) data have been classified based on the maximum like-
lihood method. The LULC map of Kolkata shown in Fig. 5
depicts nine major LULC units viz. residential commercial
and industrial area, river/pond/water body/canal, plantation,
open space, vegetation, swampy land, dry fallow land, culti-
vated land and arable land. The accuracy statistics between
the RVS-derived “reference” and the LISS-IV-derived “clas- Figure 5. Land use/land cover map of Kolkata generated using LISS
sified” maps presented in Table 2 establish the confidence IV and PAN 2010 imagery.
level of this thematic classification.
3.3 Building typology used for its finer spatial resolution and better enhancement
of urban attributes. In the present study, we have performed
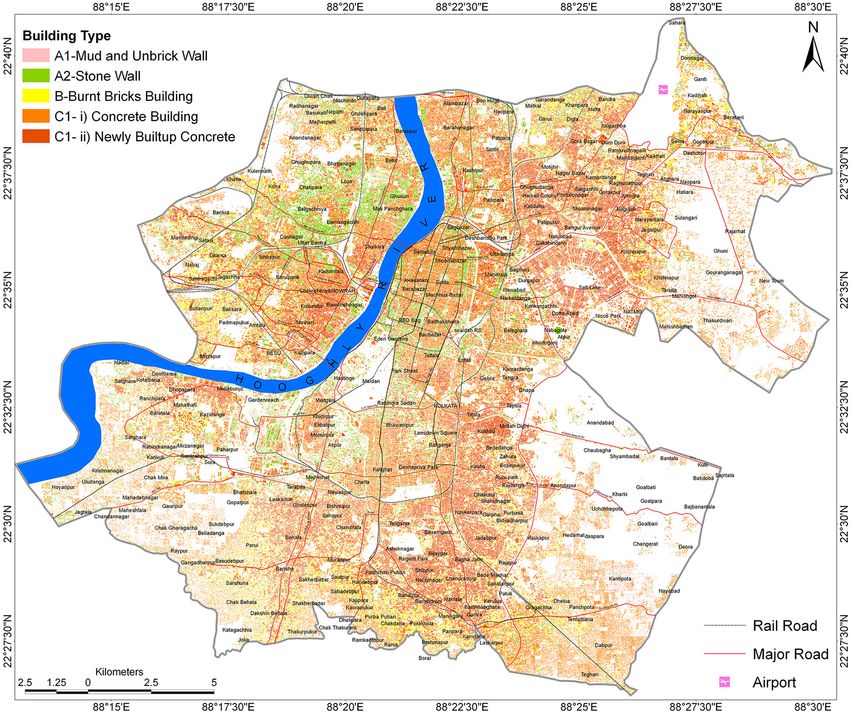
The type of materials used in construction is one of the most principal component analysis, textural analysis and the nor-
important attributes in evaluating vulnerability to seismic malized differences building index (NDBI) for the identifi-
hazard. Through visual interpretation techniques using image cation of building materials (Geneletti and Gortea, 2003; Lu
elements such as tone, texture, shape, size, shadow, pattern, and Weng, 2005; Zhang et al., 2002; Zha et al., 2003). The
association and location, the building footprint map can be building materials have been categorized into five classes
prepared with the help of poor spectral and spatial resolution (A1 is mud and non-brick wall, A2 is stone wall, B is burnt
imageries. Landsat TM imagery has been used in this study brick building/building of the large block and prefabricated
because of its finer spectral resolution compared to other type/building in natural hewn stone, C1-i is concrete building
commonly used images such as SPOT and multi-spectral and C1-ii is newly built-up concrete building) according to
scanner (MSS). However, LISS-IV imagery has also been BMTPC (1997); among them the use of reinforced concrete
Nat. Hazards Earth Syst. Sci., 15, 1103–1121, 2015 www.nat-hazards-earth-syst-sci.net/15/1103/2015/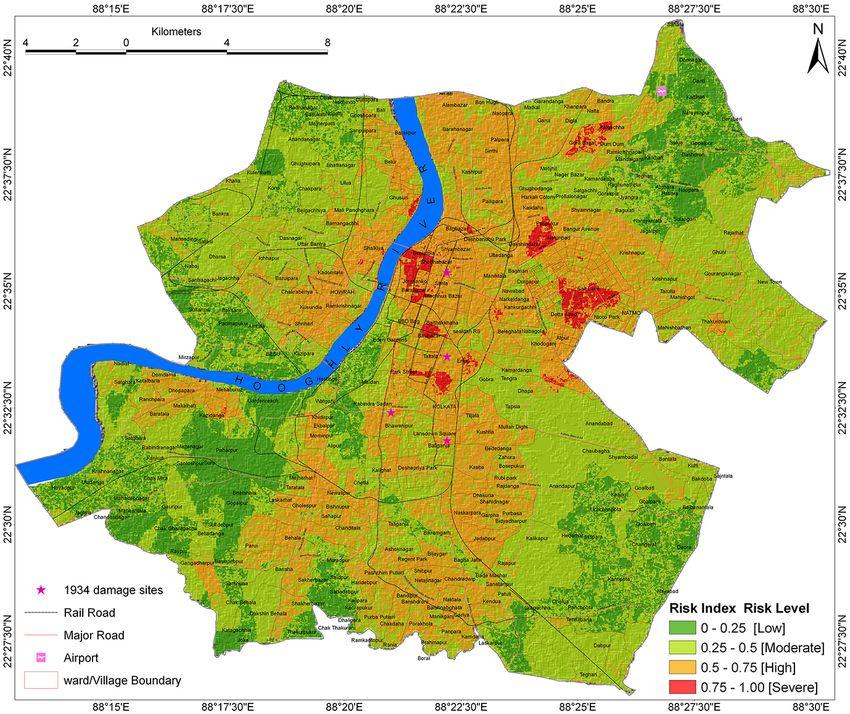
S. K. Nath et al.: Seismic vulnerability and risk assessment of Kolkata City                                                                                                    1109

Table 2. Error matrix derived for land use/land cover mapping in Kolkata.

                                                                                     GPS-based ground truth (reference data)                                  User’s accuracy
                                                                                                                                                                    (%)
          Satellite image (LISS-IV) based

                                                                             RCIA    RPWC       PL     OS     VG      SL       DFL      AL     CL     Total
                                                                     RCIA     452      0         0      5      0       0         0      10      0      467        96.78
                                            LULC (classified data)

                                                                     RPWC       0     43         0      0      0      15         0       0      0       58        74.13
                                                                     PL         0      0        37      0     11       0         0       2      5       55        67.27
                                                                     OS        12      0         0     32      0       3        11       3      1       62        51.61
                                                                     VG         0      0        17      0     89       2         5       7      3      123        72.35
                                                                     SL         0      7         0      0      3      98        11       5      3      127        77.16
                                                                     DFL        0      0         0      5      0       0        37       9      3       54        68.51
                                                                     AL        17      0         0      3      5       7        13      71     18      134        52.98
                                                                     CL         0      0         2      1      9       3         5      11     85      116        73.27
                                                                     Total    581     50        56     46     117     128       82      118    118
          Producer’s
          accuracy (%)                                                       93.97    86.00    66.1    78.0   76.0    76.6     45.1     65.7   72.0
          Overall accuracy (%)                                                                                                 78.92
          Normalized accuracy (%)                                                                                              70.00
          Kappa value                                                                                                          0.733
          Kappa variance                                                                                                       0.0002
        ∗ RCIA is residential commercial and industrial area; RPWC is river/pond/water-body/canal; PL is plantation; OS is open space; VG is vegetation; SL is
        swampy land; DFL is dry fallow land; AL is arable land; CL is cultivated land.

blocks dominates the area, as depicted in Fig. 6. The vulner-
ability curves for the observed damage due to 1934 Bihar–
Nepal earthquake of Mw = 8.1 (GSI, 1939) for reinforced
cement concrete (RCC), steel, masonry and non-engineered
structures in Kolkata and adjoining regions have been con-
structed following Sinha and Adarsh (1999) and presented
in Fig. 7. The accuracy statistics between the RVS-derived
“reference” and the LISS-IV 2010 and Landsat-TM-2010-
derived “classified” maps have been presented in Table 3.

3.4   Building age

The urban population of Kolkata has grown tremendously in
the last 4 decades. This fast rate of increase in urban popula-
tion is mainly due to large-scale migration of people from
rural and smaller towns to bigger cities in search of bet-
ter employment opportunities and lifestyle. Remote sensing
imagery is ideally used for monitoring and detecting urban
land cover changes that occur frequently in urban and peri-                                                          Figure 6. Building typology distribution map of Kolkata derived
urban areas as a consequence of incessant urbanization (Zha                                                          using LISS IV 2010 and Landsat TM 2010 imagery.
et al., 2003). Land covers in urban areas tend to change more
drastically over a short period of time than elsewhere be-
cause of rapid economic development and urban sprawl. In
the present study, the built-up areas were extracted from the                                                        Change detection analyses describe the differences between
Landsat MSS (1975, 1980), TM (1985, 1990, 2005, 2010)                                                                the images of the same scene at different periods of time. The
and ETM (2000) classified images of seven different peri-                                                            building age/urban growth of Kolkata as depicted in Fig. 8
ods in order to monitor the dynamic changes of urban sprawl                                                          has been estimated using change detection technique by us-
(Small, 2002; Zhang et al., 2002). For this purpose, we used                                                         ing ERDAS IMAGINE 8.5 software package. For map vali-
NDBI for classification of built-up areas (Zha et al., 2003).                                                        dation purposes we selected a sample block in the

www.nat-hazards-earth-syst-sci.net/15/1103/2015/                                                                             Nat. Hazards Earth Syst. Sci., 15, 1103–1121, 2015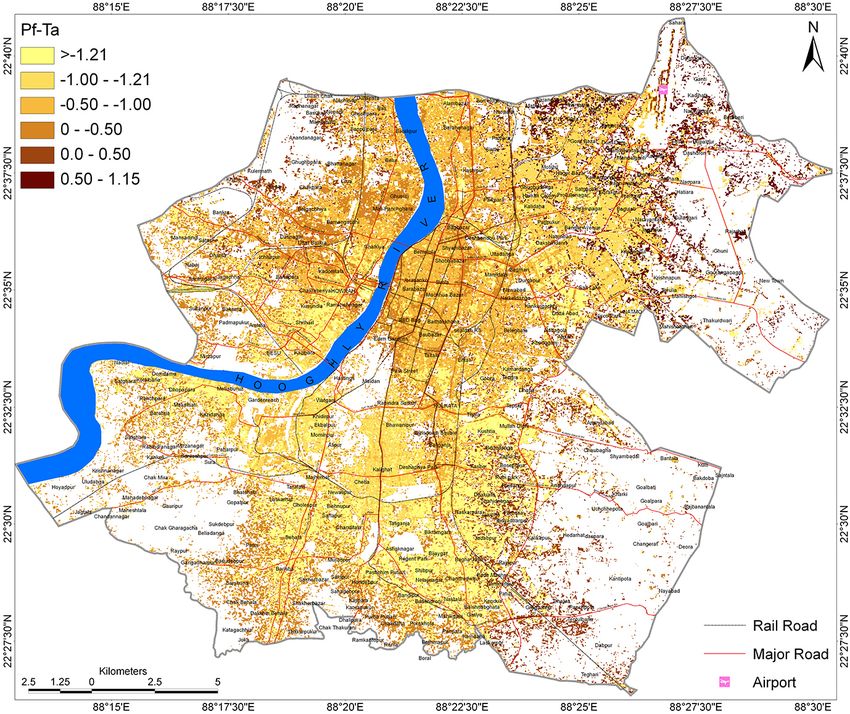
1110                                                                                                           S. K. Nath et al.: Seismic vulnerability and risk assessment of Kolkata City

Figure 7. Vulnerability curves for observed damage inflicted by the                                                               Figure 8. Building age classification map of Kolkata using multi-
1934 Bihar–Nepal earthquake of Mw = 8.1 (GSI, 1939) on various                                                                    temporal Landsat MSS (1975, 1980), TM (1985, 1990, 2005, 2010)
building typology in Kolkata and adjoining regions, based on Sinha                                                                and ETM (2000) data for the period of 1975–2010 wherein the older
and Adarsh (1999).                                                                                                                buildings (> 35 years) have been adopted from “Atlas of the City of
                                                                                                                                  Calcutta and its Environs” (Kundu and Aag, 1996).

Table 3. Error matrix derived for building typology in Kolkata.

                                              Rapid visual screening based building typology                            User’s
                                                                                                                                  (> 35 years) have been adopted from “Atlas of the city of
                                                              (reference data)                                         accuracy   Calcutta and its Environs” (Kundu and Aag, 1996). How-
                                                                                                                         (%)      ever, older buildings are likely to be vulnerable to severe
  Satellite image based

                                                                          A1    A2      B     C1-i     C1-ii   Total              damages and even subjected to total collapse under strong
                          building typology

                                              (classified data)

                                                                  A1      105   29      19     11        7     171       61.4
                                                                  A2       27   128     25     15       11     206       62.1     seismic excitations. There are many aged, ill-conditioned,
                                                                  B       11    19     93      13        6     142       65.5     closely spaced structures in Kolkata which also seem to be
                                                                  C1-i     12   17      26    243       37     335       72.5
                                                                  C1-ii    5     9     13      42      271     340       79.7
                                                                                                                                  highly vulnerable due to seismic threat.
                                                                  Total   160   202    176    324      332
  Producer’s                                                                                                                      3.5   Site-structure quasi-resonance and possibility of
  accuracy (%)                                                                  65.6   63.3   52.8     75.0    81.6                     damage
  Overall accuracy (%)                                                                                70.4
  Normalized accuracy (%)                                                                             68.1                        The response of a building to seismic shaking at its base de-
  Kappa value                                                                                         0.61                        pends on the design quality of construction. The most impor-
  Kappa variance                                                                                     0.00028                      tant factor is the height of the building. The type of shaking
 ∗ A1 is mud and unburnt brick wall; A2 is stone wall; B is burnt brick wall; C1-i is concrete wall; C1-ii is                     and the frequency of shaking depend on the structure as well
 newly built-up concrete building.
                                                                                                                                  as the site of its construction. The fundamental frequency of
                                                                                                                                  structures may range from about 2 Hz for a low-rise structure
                                                                                                                                  up to about four stories and between 0.5 and 1 Hz for tall
   Newtown financial and infrastructural hub of Kolkata                                                                           buildings/skyscrapers from 10 to 20 stories (Kramer, 1996).
where Landsat TM and Google Earth imageries of 2005 and                                                                           The tall buildings tend to amplify the longer period motions
2010 have been considered as “classified” and “reference”                                                                         compared to small buildings. Each structure has a resonance
data sets for both the categories for the assessment of urban                                                                     frequency that is the characteristic of the building. Therefore,
growth and its corresponding error statistics. Figure 9 depicts                                                                   in developing the design strategy for a building, it is desirable
the urban expansion during the period 2005–2010 based on                                                                          to estimate the fundamental periods both of the building and
both Landsat TM and Google Earth Imageries. The associ-                                                                           the site on which it is to be constructed so that a comparison
ated error matrix is given in Table 4. It has been observed                                                                       can be made to understand the possibility of quasi-resonance
that the optimal lifetime of structures in Kolkata is between                                                                     phenomenon. In the present study, Google Earth and about
40 and 50 years. The urban expansion has been divided into                                                                        1200 ground-truth ground control points have been used for
seven clusters: younger than 5, 10, 20, 25, 30, 35 and older                                                                      visual identification of building height using a 3-D aspect and
than 35 years, as depicted in Fig. 8. The older buildings                                                                         its validation. In Fig. 10 the building height map of Kolkata is

Nat. Hazards Earth Syst. Sci., 15, 1103–1121, 2015                                                                                        www.nat-hazards-earth-syst-sci.net/15/1103/2015/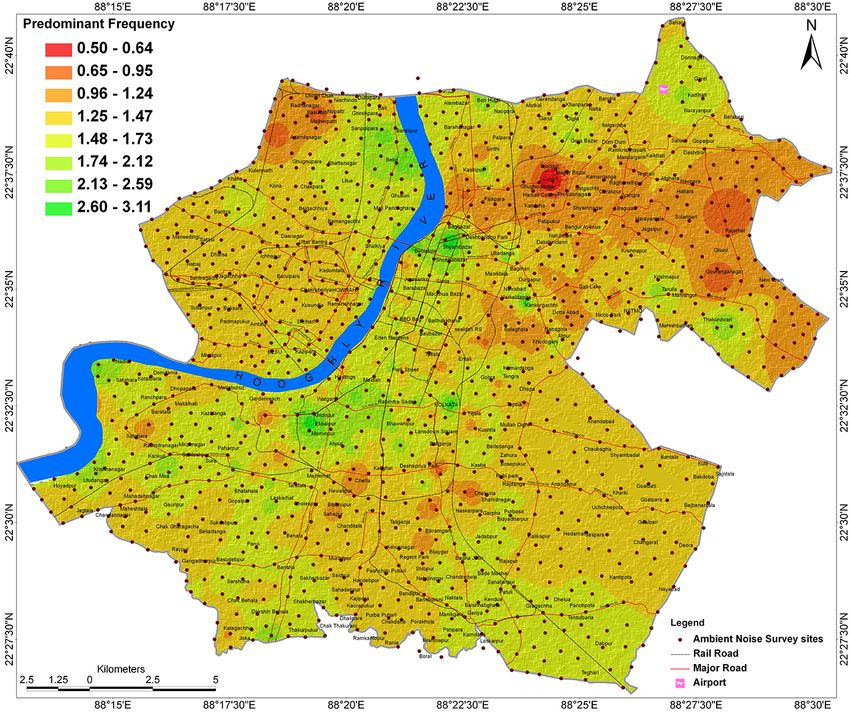
S. K. Nath et al.: Seismic vulnerability and risk assessment of Kolkata City                                                      1111

Figure 9. Urban expansion during the period 2005–2010 based on both Landsat TM and Google Earth imageries.

Table 4. Error matrix derived for building growth/age during 2005–2010 in Newtown, Kolkata.

                                 Urban expansion based on Google Earth imageries                          User’s accuracy
                                                 (reference data)                                               (%)
               Urban growth using                          High expansion       Low expansion     Total
               multi-temporal            High expansion         678                   69           747         90.7
               Landsat TM data           Low expansion           93                  281           374         75.1
               (classified data)         Total                  771                  350
               Producer’s accuracy (%)                            87.9               80.3
               Overall accuracy (%)                                                      85.5
               Normalized accuracy (%)                                                   84.4
               Kappa value                                                               0.67
               Kappa variance                                                           0.00056

presented. The accuracy statistics between the RVS-derived
“reference” and the Google-Earth-derived “classified” maps
have been presented in Table 5. The building heights have                Ta = 0.075 h0.75 for RCC frame building
been categorized into five classes: houses with 1 floor, build-            = 0.085 h0.75 for steel frame building                   (2)
ings with 2–4 floors, tall buildings with 5–8 floors, mul-
                                                                             0.09 h
tistoried buildings with 9–10 floors and skyscrapers with                  = √          all other buildings,
> 10 floors. Therefore, the approximate fundamental natu-                       d
ral period of vibration (Ta ), in seconds, has been estimated            where Ta is the fundamental period of vibration in seconds,
using the empirical relation (BIS, 2002):                                h is the height of the building in meters and d is the base di-
                                                                         mension of building at plinth level in meters, along the con-
                                                                         sidered direction of the lateral force.

www.nat-hazards-earth-syst-sci.net/15/1103/2015/                                Nat. Hazards Earth Syst. Sci., 15, 1103–1121, 2015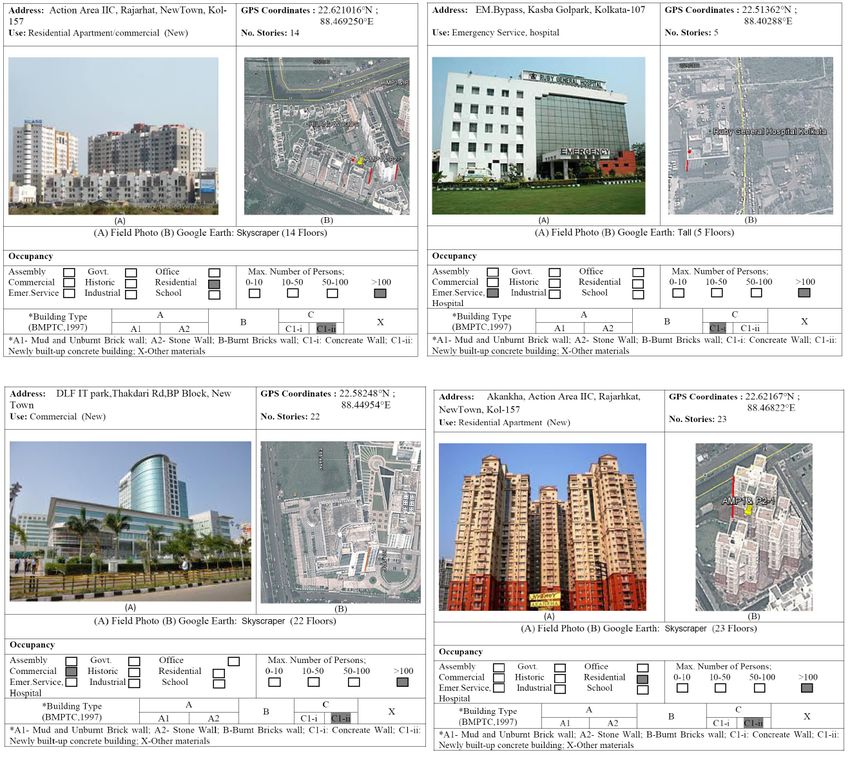
1112 S. K. Nath et al.: Seismic vulnerability and risk assessment of Kolkata City
Table 5. Error matrix derived for building height in Kolkata.
Rapid visual screening based building height User’s
(reference data) accuracy
(%)
Houses Buildings Tall Multistoried Skyscrapers Total
building height (classified data)
Google Earth 3-D aspect based
(1 floor) (2–4 floors) (5–8 floors) (9–10 floors) (> 10 floors)
Houses
(1 Floor) 247 49 0 0 0 296 83.4
Buildings
(2–4 floors) 55 298 27 0 0 380 78.4
Tall buildings
(5–8 floors) 0 29 195 19 0 243 80.2
Multistoried buildings
(9–10 floors) 0 0 10 128 24 162 79.0
Skyscrapers
(> 10 floors) 0 0 0 18 97 115 84.3
Total 302 376 232 165 121
Producer’s accuracy (%) 81.8 79.3 84.1 77.6 80.2
Overall accuracy (%) 80.6
Normalized accuracy (%) 80.5
Kappa value 0.74
Kappa variance 0.00022
The site fundamental period has been estimated from mi-
crotremor horizontal-to-vertical (H /V ) power spectral ratio
(HVSR) (Nakamura, 1989) based on the following equation:
sP P
PNS (ω) + PEW (ω)
H /Vspectral ratio = P , (3)
PV (ω)
where PNS (ω), PEW (ω) and PV (ω) are the power spec-
tra of NS, EW and the vertical components, respectively,
summation being taken over the data blocks. The H /V re-
sponse curves obtained from the microtremor survey re-
flect the geology and soil properties of the test site. Lermo
and Chávez-García (1993) examined the relevance of HVSR
for weak and strong motion earthquake records and found
good agreement among the soil resonance frequencies. Us-
ing 1-D models of shear wave velocity, they validated the
applicability of HVSR. In the present study, ambient noise
data acquired using SYSCOM MR2000 during the exten-
sive field survey of 2012–2013 at 1200 locations in the city
have been processed using View2002 and GEOPSY software
(www.geopsy.org). The predominant frequency distribution
map shown in Fig. 11 is prepared on GIS platform exhibiting
a variation between 0.5 and 3.1 Hz. The proximity of pre-
Figure 10. Building height distribution map of Kolkata using dominant frequency of the soil column and the natural fre-
Google Earth 2012 imagery.
quency of lifeline facilities indicates higher vulnerability of
the built-up environment owing to resonance effects (Nath
and Thingbaijam, 2009). Usually care is taken that the nat-
ural period of vibration of any structure should not coin-
cide with the predominant period of earthquake excitations
Nat. Hazards Earth Syst. Sci., 15, 1103–1121, 2015 www.nat-hazards-earth-syst-sci.net/15/1103/2015/S. K. Nath et al.: Seismic vulnerability and risk assessment of Kolkata City 1113
Figure 11. Spatial distribution of predominant frequency in Kolkata Figure 12. The difference between the natural period of vibration of
as obtained from an ambient noise survey during the extensive field structures and the fundamental period of respective sites, indicating
survey of 2012–2013 at 1200 locations and processing of those by damage possibilities of existing structures/logistics.
Nakamura ratio.
in order to avoid resonance that may occur, causing damage mapping through vector layer generation and its spatial anal-
to even strongest structures which may eventually collapse ysis.
(BIS, 2002). Figure 12 presents the difference between the The major geomorphological units present in Kolkata
structure’s natural period of vibration and the fundamental are deltaic plain, inter-distributary marsh, paleo-channels,
period of the respective site on which the structure stands, in- younger levee adjacent to the River Hoogly and older levee
dicating damage possibilities of existing structures/logistics on both the sides of the Adi Ganga (Roy et al., 2012) as de-
due to the impact of an earthquake – the larger the difference, picted in Fig. 13a. Site classification of Kolkata performed
the lesser the possibility of damage or destruction is. using in-depth geophysical and geotechnical investigations
from 350 borehole data based on NEHRP, USGS and FEMA
nomenclature places the city in D1 (Vs30 : 180–240 m s−1 ), D2
(Vs30 : 240–300 m s−1 ), D3 (Vs30 : 300–360 m s−1 ) and E (Vs30 :
4 Seismic hazard microzonation of Kolkata < 180 m s−1 ) classes, as shown in Fig. 13b. Based on the pro-
portions of sand, silt and clay-sized particles obtained from
Seismic hazard can be estimated by analyzing past earth- 350 boreholes in Kolkata, the bottom sediments have been
quake activity in the region, evidence of stress-bearing ca- classified according to Shepard’s diagram (O’Malley, 2007)
pacity of structures within the fault area and how seismic and exhibit highly liquefiable sediments viz. sand, sand-silt
waves travel through the crust and the overlying soils be- clay, sandy clay, silty sand and silty clay up to about ∼ 5 m
neath the sites (Panahi et al., 2014). It is noted that at the as shown in Fig. 13c. The probabilistic seismic hazard as-
time of an earthquake, in addition to PGA, the incidence of sessment at surface-consistent level performed by propagat-
soil liquefaction and slope failure are the secondary phenom- ing the bedrock ground motion with 10 % probability of ex-
ena which can increase seismic vulnerability and hence dam- ceedance in 50 years through a 1-D sediment column using
age. Multi-criteria assessment of seismic hazard leading to an equivalent linear analysis of an otherwise nonlinear sys-
seismic microzonation is the key factor to understanding the tem predicts a peak ground acceleration variation from 0.176
overall seismic risk of a region (Anbazhagan et al., 2010). to 0.253 g in the city, as depicted in Fig. 13d. Groundwa-
The hazard mapping is achieved through the multi-criteria- ter table depth is among the major contributors affecting the
based decision support system formulated by Saaty (1980) as stability of the soil column. The water table depths obtained
AHP. The hazard themes pertaining to the study region ma- from 350 boreholes calibrated with post-monsoon piezome-
terialized as thematic layers on the GIS platform are (i) PGA ter survey in the city have been used to generate a water table
with 10 % probability of exceedance in 50 years at surface, depth variation map of the city, shown in Fig. 13e, depicting
(ii) LPI, (iii) NEHRP SC, (iv) SEC, (v) GM and (vi) ground- water table fluctuations between 0.1 and 7.7 m depth. There
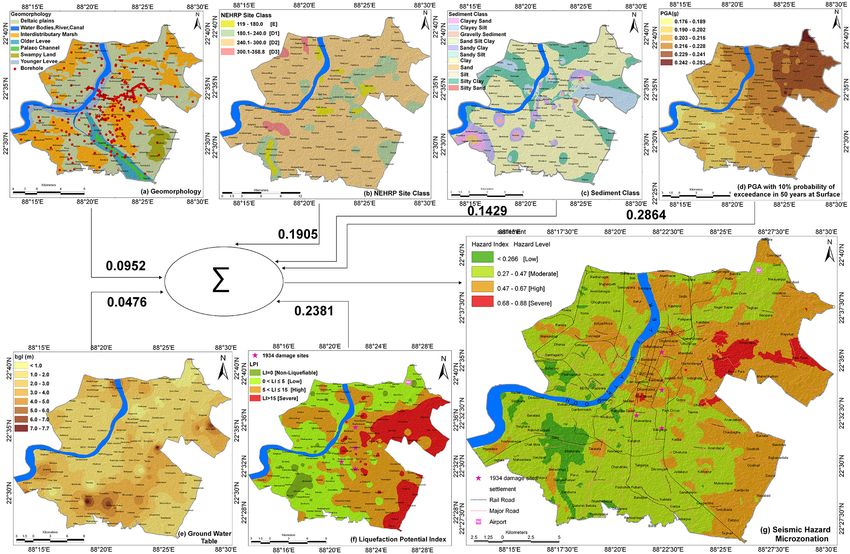
water table (GW) fluctuation as shown in Fig. 13a–f. In the had been evidence of wide-spread liquefaction in Kolkata
present study, ArcGIS 9.3 is used for the purpose of thematic triggered by the 1934 Bihar–Nepal earthquake of Mw = 8.1
www.nat-hazards-earth-syst-sci.net/15/1103/2015/ Nat. Hazards Earth Syst. Sci., 15, 1103–1121, 20151114 S. K. Nath et al.: Seismic vulnerability and risk assessment of Kolkata City
Figure 13. Seismic hazard microzonation protocol for Kolkata showing the weights assigned to each theme, i.e., (a) geomorphology,
(b) NEHRP site class, (c) sediment class, (d) spatial distribution of PGA in Kolkata with 10 % probability of exceedance in 50 years at
surface, (e) groundwater table and (f) liquefaction potential index (LPI) distribution, which are integrated using an aggregation method
from the GIS platform; (g) seismic hazard microzonation map of Kolkata (see electronic supplement for a higher resolution version of this
diagram).
(GSI, 1939). Therefore, soil liquefaction in terms of factor (SHM) map as
of safety against liquefaction is considered one of the major
contributors of induced seismic hazard potential in Kolkata SHM = [PGAw PGAr + LPIw LPIr + SCw SCr
X
and is, therefore, also used in the present microzonation pro- +SECw SECr + GMw GMr + GWw GWr ] / w, (4)
tocol. The standard methodology given by Youd et al. (2001),
where w represents the normalized weight of a theme and r
Idriss and Boulanger (2006) and Iwasaki et al. (1982) that
is the normalized rank of a feature in the theme. Thereafter,
uses a corrected SPT-N value has been employed for the es-
a 3 × 3 “majority filter” has been applied to the SHM as a
timation of liquefaction susceptibility in the city consider-
post-classification filter to reduce the high frequency varia-
ing surface PGA distribution with 10 % probability of ex-
tion. SHM is a dimensionless quantity that helps to index the
ceedance in 50 years. LPI values have been classified accord-
probability of seismic hazard and hence the microzonation
ing to Iwasaki et al. (1982) as non-liquefiable (LPI = 0), low
of a region on a qualitative scheme such as “low”, “moder-
(0 < LPI < 5), high (5 < LPI < 15) and severe (LPI > 15), as
ate”, “high” and “severe”. The probabilistic seismic hazard
shown in Fig. 13f. Each theme has been described in detail
microzonation map of Kolkata is shown in Fig. 13g. Four
in Nath et al. (2014).
broad divisions have been identified with a hazard index (HI)
The corresponding weights and the ranks of each thematic
of 0.68 < HI ≤ 0.88, indicating severe hazard condition in
layer and the feature ranks thereof are assigned values ac-
the Salt Lake area; 0.47 < HI ≤ 0.68, indicating a high haz-
cordingly to the apparent contribution of the layers to the
ard condition mostly in Rajarhat and New Town areas of the
overall seismic hazard (Nath, 2004). All the geo-referenced
expanding city; 0.27 < HI ≤ 0.47, indicating moderate haz-
thematic layers are integrated step by step using the aggrega-
ard condition in most parts of south and west Kolkata; and
tion method in GIS to generate seismic hazard microzonation
HI < 0.27 ,representing a low hazard condition. The dam-
Nat. Hazards Earth Syst. Sci., 15, 1103–1121, 2015 www.nat-hazards-earth-syst-sci.net/15/1103/2015/S. K. Nath et al.: Seismic vulnerability and risk assessment of Kolkata City 1115
age distribution due to the 1934 Bihar–Nepal earthquake of broad divisions of SERI have been identified with the follow-
Mw = 8.1 is reported to have induced an MM intensity VI– ing risk indexes: 0.75 < SERI ≤ 1.0, indicating severe risk
VII in Kolkata (GSI, 1939), mostly identified in the moderate condition in Salt Lake and patches of central Kolkata area;
to high hazard zone (marked by an asterisk). 0.50 < SERI ≤ 0.75, indicating high seismic risk in most of
the central and northern Kolkata; 0.25 < SERI ≤ 0.50, indi-
cating moderate risk in the most part of southern, northeast-
5 Multi-criteria seismic risk assessment ern and western Kolkata; and SERI < 0.25, presenting a com-
pletely risk-free regime.
Ishita and Khandaker (2010) performed seismic vulnerabil- The structural risk elements, namely building typology
ity assessment using AHP and GIS, wherein various themes (BT), building height (BH) and building age/growth (BA),
such as building floors, building types, building age, resi- have been integrated with the SHM depending on their con-
dent population, population density, land use/land cover were tribution towards seismic vulnerability. The structural risk in-
used to evaluate seismic vulnerability. The steps usually fol- dex (SRI) due to the structural risk exposures over the SHM
lowed in the vulnerability assessment are as follows. High- are estimated as
risk areas are identified by convolving seismic hazard mi- X
crozonation with vulnerability exposures in the GIS environ- SRI = [SHMw SHMr + BTw BTr + BHw BHr + BAw BAr ] / w. (7)
ment using AHP (Reveshty and Gharakhlou, 2009; Aghata- The ranks and weights for structural vulnerability expo-
her et al., 2008; Qunlin et al., 2013; Sarris et al., 2010). The sures over seismic hazard microzonation are illustrated
AHP method avails to investigate the consistency of judg- in Table 7. To determine the most and least structurally
ments to determine the significance of relative weight of fac- vulnerable areas, the SRI scores are mapped as < 0.25
tors (Reveshty and Gharakhlou, 2009). To determine the de- (low vulnerability) to ∼ 1 (high vulnerability) as shown in
gree of consistency in judgments, a consistency ratio is also Fig. 15. Four broad divisions have been identified with SRI:
measured from the AHP matrix. In the present investigation, 0.75 < SRI ≤ 1.0, indicating severe risk condition in Salt
AHP is used for the estimation of weights of various factors Lake area; 0.50 < SRI ≤ 0.75, indicating high risk mostly
of vulnerability exposures for the computation of risk index in central Kolkata; 0.25 < SRI ≤ 0.50, indicating moderate
in an attempt to generate a multi-criteria risk evolution proto- risk in the most part of west Kolkata; and SRI < 0.25, pre-
col in both the socioeconomic and structural perspectives. A senting a completely risk-free regime. From the depiction of
combination of spatial/non-spatial exposures against earth- Fig. 15, it is easier to identify the most vulnerable buildings
quakes, the degree of vulnerability of each building element and, therefore, the suggestion for their preventive measures.
in terms of its typology, height and age and the socioeco- In Kolkata, most of the structural vulnerability indexes range
nomic exposures has been measured. The associated features from 0.25 to 0.75 indicating moderate to high vulnerability
are ranked or scored within each theme. The initial integral level. Detailed analyses and ground truthing reveal that most
ranking, Xj , is normalized to ensure that no layer exerts an of the buildings in the city are 1–4 storied and the resonance
influence beyond its determined weight using the following frequency of the soil column is between 1.0 and 2.0 Hz. It
relation (Nath, 2004): is observed that an index > 0.5 is of higher vulnerability in
Rj − Rmin terms of both height and severity of structural damage, be-
Xj = , (5) ing constructed on swamps and artificially non-engineered
Rmax − Rmin
fills. In central Kolkata most of the buildings exhibit high
where Rj is the row score and Rmax and Rmin are the maxi- structural vulnerability because of age (80 % > 35 years) and
mum and minimum scores of a particular layer. unplanned construction. The damage distribution due to the
The socioeconomic risk elements, i.e., population density Great 1934 Bihar–Nepal earthquake of Mw = 8.1 is identi-
(PD) and LULC, are integrated with the seismic hazard mi- fied in the severe to high-risk zones (marked by an asterisk).
crozonation theme to demarcate the most vulnerable zones The detailed seismic vulnerability attributions are presented
in the view of socioeconomic activities of the region. The in Table 8.
socioeconomic risk index (SERI) is calculated as In the present study, we have also calculated the design
horizontal seismic coefficient (Ah ) for the existing structures
X
SERI = [SHMw SHMr + PDw PDr + LULCw LULCr ] / w. (6) by the following expression (BIS, 2002):
Ah = ZF I Sa /2Rg, (8)
The ranks and weights for socioeconomic vulnerability ex-
posures over seismic hazard microzonation are illustrated in where ZF is the zone factor (taken from Nath et al., 2014),
Table 6. The concept of social vulnerability helps to iden- I is the importance factor, depending upon the functional
tify those characteristics and experiences of individuals and use of the structures, R is the response reduction factor, de-
communities that enable them to respond and to recover from pending on the perceived seismic damage performance of the
earthquake hazards (Cutter et al., 2003). The socioeconomic structure, and Sa /g is the average response acceleration co-
seismic risk map of Kolkata is depicted in Fig. 14. Four efficient for rock or soil sites (Nath et al., 2014). BIS (2002)
www.nat-hazards-earth-syst-sci.net/15/1103/2015/ Nat. Hazards Earth Syst. Sci., 15, 1103–1121, 20151116 S. K. Nath et al.: Seismic vulnerability and risk assessment of Kolkata City
Table 6. Normalized weights and ranks assigned to respective themes and the features of socioeconomic risk attributes for thematic integra-
tion on GIS.
Themes Weight Attributes Rating Normalized rating
Seismic hazard microzonation 0.50 Low 1 0.0000
(SHM) Moderate 2 0.3333
High 3 0.6666
Severe 4 1.0000
Population density 0.33 < 1000 1 0.0000
(km2 ) 1001–5000 2 0.1111
5001–10 000 3 0.2222
10 001–15 000 4 0.3333
15 001–25 000 5 0.4444
25 001–50 000 6 0.5556
50 001–75 000 7 0.6667
75 001–100 000 8 0.7778
100 001–150 000 9 0.8889
> 150 000 10 1.0000
Land use/land cover 0.17 Water body, pond, river, canal 1 0.0000
Open space 2 0.1250
Swampy land 3 0.2500
Dry fallow land 4 0.3750
Vegetation 5 0.5000
Plantation 6 0.6250
Arable land 7 0.7500
Cultivated land 8 0.8750
Residential, commercial and industrial area 9 1.0000
Figure 14. Probabilistic seismic socioeconomic risk map of Kolkata. Four broad divisions have been identified with risk index (SERI) defined
as 0.75 < SERI ≤ 1.0 ,indicating “severe” risk condition in Salt Lake area and a patch at central Kolkata; 0.50 < SERI ≤ 0.75, indicating
“high” risk in central and north Kolkata; 0.25 < SERI ≤ 0.50, indicating “moderate” risk in the most part of southeast, northeast and west
Kolkata; and SERI < 0.25, presenting a completely risk-free regime. The damage distribution due to the 1934 Bihar–Nepal earthquake of
Mw = 8.1 (GSI, 1939) is identified in the high-risk zone (marked by an asterisk).
Nat. Hazards Earth Syst. Sci., 15, 1103–1121, 2015 www.nat-hazards-earth-syst-sci.net/15/1103/2015/S. K. Nath et al.: Seismic vulnerability and risk assessment of Kolkata City 1117
Table 7. Normalized weights and ranks assigned to respective themes and the features of structural risk attributes for thematic integration on
GIS.
Themes Weight Attributes Rating Normalized rating
Seismic hazard microzonation 0.40 Low 1 0.0000
(SHM) Moderate 2 0.3333
High 3 0.6666
Severe 4 1.0000
Building typology 0.30 A1-mud and unburnt brick wall 1 0.0000
A2-stone wall 2 0.2500
B-burnt bricks building 3 0.5000
C1-i: concrete building 4 0.7500
C1-ii: newly build concrete building 5 1.0000
Building height 0.20 Houses (1 floor) 1 0.0000
Buildings (2–4 floors) 2 0.2500
Tall buildings (5–8 floors) 3 0.5000
Multistoried buildings (9–10 floors) 4 0.7500
Skyscrapers (> 10 floors) 5 1.0000
Building age 0.10 < 5 years 1 0.0000
10 years 2 0.1667
20 years 3 0.3333
25 years 4 0.5000
30 years 5 0.6667
35 years 6 0.8333
> 35 years 7 1.0000
Figure 15. Probabilistic seismic structural risk map of Kolkata. Four broad divisions have been identified with risk index (SRI) defined as
0.75 < SRI ≤ 1.0, indicating “severe” risk condition in Salt Lake area; 0.50 < SRI ≤ 0.75, indicating “high” risk mostly in central Kolkata;
0.25 < SRI ≤ 0.50, depicting “moderate” risk in the most part of west Kolkata; and SRI < 0.25, presenting a completely risk-free regime.
The damage distribution due to the 1934 Bihar–Nepal earthquake of Mw = 8.1 (GSI, 1939) is identified in the highrisk zone (marked by an
asterisk). The detailed structural attributions are presented in Table 8.
www.nat-hazards-earth-syst-sci.net/15/1103/2015/ Nat. Hazards Earth Syst. Sci., 15, 1103–1121, 20151118 S. K. Nath et al.: Seismic vulnerability and risk assessment of Kolkata City
Table 8. Structural risk level with corresponding vulnerability exposures at selective locations in Kolkata.
Sl. Lat Long LM SRI Pf LPI IMM BH BA BT
(◦ N) (◦ E)
1 22.4940 88.311 Behala High 1.4 3.3 VII Houses (1 floor) 10 years B: burnt bricks building
2 22.5125 88.388 Rajdanga Moderate 1.5 12.1 VII Houses (1 floor) 25 years C1-i: concrete building
3 22.5971 88.367 Shyambazar High 2.4 13.5 VII Buildings (2–4 floors) 35 years C1-i: concrete building
4 22.6346 88.424 Dum Dum High 1.4 4.7 VII Buildings (2–4 floors) 35 years C1-i: concrete building
5 22.6468 88.344 Bali Moderate 1.5 4.9 VII Buildings (2–4 floors) < 5 years B: burnt bricks building
6 22.6190 88.305 Kona Moderate 1.4 9.4 VII Buildings (2–4 floors) 30 years C1-i: concrete building
7 22.5037 88.252 Maheshtala Low 1.4 3.6 VII Houses (1 floor) 35 years C1-i: concrete building
8 22.5269 88.327 Alipur High 1.7 10.1 VII Tall buildings (5–8 floors) 10 years C1-i: concrete building
9 22.5470 88.287 Metiaburuz High 1.4 4.6 VII Tall buildings (5–8 floors) 25 years C1-i: concrete building
10 22.4556 88.422 Dabpur Moderate 1.7 27.5 VII Buildings (2–4 floors) 25 years B – Burnt bricks building
11 22.4938 88.379 Jadavpur High 1.5 13.5 VII Tall buildings (5–8 floors) 35 years C1-i: concrete building
12 22.5182 88.342 Kalighat Moderate 1.4 4.2 VII Buildings (2–4 floors) > 35 years A2: stone wall
13 22.4906 88.451 Deara Low 1.4 21.2 VII Buildings (2–4 floors) < 5 years B – Burnt bricks building
14 22.5092 88.379 Dhakuria High 0.9 14.3 VII Tall buildings (5–8 floors) 10 years C1-ii: newly built-up concrete B
15 22.4604 88.317 Thakurpukur Low 1.5 3.8 VII Houses (1 floor) 20 years C1-i: concrete building
16 22.5817 88.328 Howrah High 1.3 14.0 VII Houses (1 floor) > 35 years C1-i: concrete building
17 22.5151 88.457 Bakdoba Moderate 1.4 12.7 VII Houses (1 floor) 30 years B: burnt bricks building
18 22.6142 88.382 Paikpara High 1.2 12.1 VII Buildings (2–4 floors) > 35 years C1-i: concrete building
19 22.5527 88.354 Park Street Severe 1.4 24.4 VII Multistoried buildings (9–10 floors) 20 years C1-i: concrete building
20 22.5830 88.416 Salt Lake Severe 1.2 28.1 VII Tall buildings (5–8 floors) 10 years C1-ii: newly built-up concrete B
21 22.5854 88.480 New Town Moderate 1.2 26.5 VII Buildings (2–4 floors) < 5 years C1-ii: newly built-up concrete B
22 22.6030 88.468 Rajarhat Moderate 0.9 34.3 VII Buildings (2–4 floors) < 5 years C1-ii: newly built-up concrete B
LM is major land marks; SRI is structural risk index; Pf is predominant frequency; LPI is liquefaction potential index; IMM is predicted MM Intensity; BH is building height; BA is building age (years); BT is building
type as per BMTPC.
tures only. However “C” structures may also be built in the
northeastern part of the city.
The probability of damage in each seismic risk zone is
calculated in relation to the given ground motion parameters
to evaluate the building performance for a particular seismic
event. Based on the RVS technique and the capacity curves
given in NIBS (2002), we have selected four model type
buildings viz. RM2L, RM2M, URML and URMM in the city.
In the present context, “RM2L”, “RM2M” types represent
“C” type structure while URML and URMM represent “B”
type structure. We calculated the demand spectrum curve of
spectral acceleration, the peak building response and the cu-
mulative damage probabilities of all the four model building
types. The demand spectrum curve of spectral acceleration
is a function of spectral displacement, which for the periods
0.3 and 1.0 s has been used for the characterization of the
ground motion demand. The spectral displacement has been
determined by using the following equation (FEMA, 2001):
Figure 16. Spatial distribution of horizontal seismic coefficient
(Ah ) to be used for Kolkata for structures with 1.0 s predominant SD = 9.8 · SA · T 2 , (9)
period.
where SA is the amplified spectral acceleration in g (Nath et
al., 2014), T is the time period (seconds) and SD is the spec-
tral displacement (inches). The capacity curve represents the
characteristics of a structure, which is a plot of lateral re-
specified the values of I and R for all kinds of buildings. The sistance of a building as a function of the characteristic lat-
sample seismic coefficient (Ah ) distribution to be used for eral displacement (Molina et al., 2010). The capacity curve is
Kolkata for all kinds of structures with the predominant pe- characterized by three control points: design capacity, yield
riod of 1.0 s is depicted in Fig. 16. Depending upon the value capacity and ultimate capacity. The capacity curve parame-
of seismic coefficient (Ah ) the category of building has been ters for four model building types have been adopted from
defined by BIS (2002) as given in Table 9. From Fig. 16 it is NIBS (2002). The peak building response is estimated from
evident that the city may be suitable for “A” and “B” struc- the interaction of the building capacity curve and the demand
Nat. Hazards Earth Syst. Sci., 15, 1103–1121, 2015 www.nat-hazards-earth-syst-sci.net/15/1103/2015/S. K. Nath et al.: Seismic vulnerability and risk assessment of Kolkata City 1119
Table 9. Classification of building categories based on Ah (BIS, 2002).
Range of Ah Building Description
category
< 0.05 A Building in field stone, rural structures, unburnt brick houses, clay houses
0.05–0.06 B Ordinary brick buildings, buildings of large block and prefabricated type,
half timbered structures, buildings in natural hewn stone
0.06–0.08 C Reinforced buildings, well-built wooden structures
0.08–0.12 D
Other type not covered in A, B, C
> 0.12 E
Table 10. Peak building response estimated for four significant model building types (FEMA, 2001).
Model Peak building response
building (inches)
RM2L RM2M URML URMM
Type Reinforced masonry Reinforced masonry Unreinforced masonry Unreinforced masonry
bearing wall with bearing wall with bearing wall, bearing wall,
precast concrete precast concrete low rise medium rise
diaphragms, low rise diaphragms, medium (1–2 stories) (3+ stories)
(1–3 stories) rise (4–7 stories)
SD (inch) 0.71 0.727 0.639 0.735
curve at the specified building location. The peak building Table 11. Estimated cumulative damage probabilities of four model
response at the point of interaction of the capacity curve and building types defined in Table 10.
the demand curve is used with fragility curve for the esti-
mation of damage state probability (Molina et al., 2010). Ta- Model Cumulative probabilities
ble 10 lists the calculated peak building response values for type
all the four model building types defined above. The cumu- None Slight Moderate Extensive Complete
lative damage probabilities have been calculated as (NIBS, RM2L 0.1402 0.3103 0.4123 0.0942 0.0429
2002) RM2M 0.0547 0.2668 0.4472 0.1647 0.0666
URML 0.1831 0.3339 0.3334 0.1092 0.0403
URMM 0.0264 0.2125 0.3827 0.2675 0.1108
1 Sd
p[ds |Sd ] = 8 ln , (10)
βd s S d,ds
6 Conclusions
where p[ds |Sd ] is the probability of being in or exceeding Seismic vulnerability and risk have emerged as important is-
a damage state, ds ; Sd is the given spectral displacement sues in high-risk urban centers across the globe and are con-
(inches); S ds is the median value of Sd at which the building sidered integral parts of earthquake-inflicted disaster mitiga-
reaches the threshold of the damage state ds ; βds is the log- tion and management. The seismic risk framework adopted
normal standard deviation of spectral displacement of dam- here is a multidimensional protocol based on the integrated
age state, ds ; and 8 is the standard normal cumulative dis- seismic hazard and vulnerability exposures, viz. popula-
tribution function. Table 11 enlists the cumulative damage tion density, land use/land cover, building typology, build-
probabilities of all four model building types in terms of ing height and building age, judiciously integrated in the
none, slight, moderate, extensive and complete hazard. The GIS to identify those structural and socioeconomic condi-
discrete damage probability indicates that the UM2L and tions which are responsible for turning an earthquake disas-
URML building typologies will suffer the lowest damage, ter into a catastrophe. Thus the knowledge of the risk in the
while the RM2M and URMM building typologies will expe- city based on the existing built-up urban environment will
rience the most destruction during a strong earthquake in the immensely benefit the disaster mitigation and management
city and its adjoining region. endeavors put in place for the city of Kolkata.
www.nat-hazards-earth-syst-sci.net/15/1103/2015/ Nat. Hazards Earth Syst. Sci., 15, 1103–1121, 2015You can also read