Unraveling the hydrological budget of isolated and seasonally contrasted subtropical lakes - HESS
←
→
Page content transcription
If your browser does not render page correctly, please read the page content below
Hydrol. Earth Syst. Sci., 23, 1705–1724, 2019
https://doi.org/10.5194/hess-23-1705-2019
© Author(s) 2019. This work is distributed under
the Creative Commons Attribution 4.0 License.

Unraveling the hydrological budget of isolated and seasonally
contrasted subtropical lakes
Chloé Poulin1,a , Bruno Hamelin1 , Christine Vallet-Coulomb1 , Guinbe Amngar3 , Bichara Loukman3 ,
Jean-François Cretaux4 , Jean-Claude Doumnang3 , Abdallah Mahamat Nour1,3 , Guillemette Menot1,2 ,
Florence Sylvestre1 , and Pierre Deschamps1
1 Aix-Marseille Université, CNRS, IRD, Collège de France, CEREGE, Europole de l’Arbois,
13545 Aix-en-Provence, France
2 Univ. Lyon, Ens de Lyon, Université Lyon 1, CNRS, UMR 5276 LGL-TPE, 69342 Lyon, France
3 Département de Géologie, Faculté des sciences Exactes et Appliquées,

Université de N’Djamena, N’Djamena, Chad
4 Legos, UMR5566, 14 Avenue Edouard Belin, 31400 Toulouse, France
a now at: Aquaya Institute, P.O. Box 21862, Nairobi, Kenya

Correspondence: Chloé Poulin (poulin-chloe@hotmail.fr)

Received: 22 February 2018 – Discussion started: 5 April 2018
Revised: 6 October 2018 – Accepted: 21 January 2019 – Published: 26 March 2019

Abstract. Complete understanding of the hydrological func-        0.6 ± 0.3 and 0.4 ± 0.2, respectively. In the case of the en-
tioning of large-scale intertropical watersheds such as the       dorheic Lake Fitri, the estimated output flux corresponds to
Lake Chad basin is becoming a high priority in the context of     the infiltration of surface water toward the surface aquifer
climate change in the near future and increasing demographic      that regulates the chemistry of the lake. These results con-
pressure. This requires integrated studies of all surface water   stitute a first-order assessment of the water budget of these
and groundwater bodies and of their quite-complex intercon-       lakes, in regions where direct hydrological and meteorologi-
nections. We present here a simple method for estimating the      cal observations are very scarce or altogether lacking.
annual mean water balance of sub-Sahelian lakes subject to           Finally, we discuss the implications of our data on the
high seasonal contrast and located in isolated regions with no    hydro-climatic budget at the scale of the catchment basins.
road access during the rainy season, a situation which pre-       We observe that the local evaporation lines (LELs) obtained
cludes continuous monitoring of in situ hydrological data.        on both lake and aquifer systems are slightly offset from the
   Our study focuses for the first time on two lakes, Iro and     average rainfall isotopic composition monitored by IAEA at
Fitri, located in the eastern basin of Lake Chad. We also test    N’Djamena (Chad), and we show that this difference may re-
the approach on Lake Ihotry in Madagascar, used as a bench-       flect the impact of vegetation transpiration on the basin water
mark site that has previously been extensively studied by our     budget. Based on the discussion of the mass balance budget
group.                                                            we conclude that, while being broadly consistent with the
   We combine the δ 18 O and δ 2 H data that we measured dur-     idea that transpiration is on the same order of magnitude as
ing the dry season with altimetry data from the SARAL satel-      evaporation in those basins, we cannot derive a more precise
lite mission in order to model the seasonal variation of lake     estimate of the partition between these two fluxes, owing to
volume and isotopic composition. The annual water budget is       the large uncertainties of the different end-members in the
then estimated from mass balance equations using the Craig–       budget equations.
Gordon model for evaporation. We first show that the closed-
system behavior of Lake Ihotry (i.e., precipitation equal to
evaporation) is well simulated by the model. For lakes Iro
and Fitri, we calculate evaporation to influx ratios (E/I ) of

Published by Copernicus Publications on behalf of the European Geosciences Union.
1706         C. Poulin et al.: Unraveling the hydrological budget of isolated and seasonally contrasted subtropical lakes

1   Introduction                                                    of critical data for the high-water period, which impedes the
                                                                    inference of seasonal ranges of variation and thus of annual
In the Sahel, the combined effects of population growth, land       average values, meaning that standard hydrological and hy-
degradation and changes in rainfall patterns have already re-       drogeological approaches remain highly unconstrained.
sulted in the significant deterioration of soil and water re-          In addition, long-term hydrological monitoring of the wa-
sources (UNEP and ICRAF, 2006). Following the severe                tersheds is often lacking (Sivapalan et al., 2003; Wohl et al.,
droughts that ravaged the region in the 1970s and 1980s,            2012). Remote sensing techniques have been developed to
an increase in rainfall patterns has been observed in cen-          compensate for this lack of data in order to determine lake
tral and western Africa since the 1990s (Nicholson, 2005;           storage capacities (Liebe et al., 2005; Rodrigues et al., 2012),
Lebel and Ali, 2009; Ali and Lebel, 2009; Nicholson, 2013).         or to calculate a hydrological budget with regular water
There is no consensus to date on precipitation trends over          height measurements (Gal et al., 2016). Alternative methods,
the Sahel strip for the 21st century (Druyan, 2011; Chris-          such as the Thornthwaite–Mather procedure (Collick et al.,
tensen et al., 2013; Biasutti et al., 2018), leading to large       2009; Steenhuis and Van der Molen, 1986), are also efficient
uncertainties in the evolution of surface water bodies such         for estimating water budgets in remote areas, but require pre-
as the iconic Lake Chad. In sub-Sahelian areas, surface wa-         cise precipitation data, which remain unavailable in many ar-
ter bodies such as ephemeral ponds or perennial lakes form          eas. For instance, in the two cases studied here, only one me-
crucial reservoirs for agriculture and human activities, which      teorological station is present in each of the two huge catch-
renders the understanding of their hydrological functioning         ments (195 000 km2 for Iro Lake, and 96 000 km2 for Lake
essential to socio-economic previsions. These reservoirs are        Fitri).
fed during the rainy season by surface runoff. Many stud-              In this context, geochemical and isotopic data can pro-
ies have shown a global increase in surface runoff over the         vide us with independent quantitative constraints to deter-
last decades despite a general precipitation decline (Descroix      mine the dynamic and water balance of each lake. In par-
et al., 2009; Gardelle et al., 2010). This paradoxical runoff re-   ticular, the isotopic composition of water, expressed as δ 18 O
sponse highlights the role of land clearance and soil crusting      and δ 2 H, has been extensively used to identify the sources of
in controlling hydrological regimes in the Sahelian and Su-         groundwater recharge, to quantify mixing processes (Fried-
danian regions (Leblanc et al., 2008). Surface water bodies         man et al., 1964; Dinçer, 1968; Gat and Gonfiantini, 1981;
are thus vulnerable to climate variability but are also highly      Krabbenhoft et al., 1990; Gat, 1996; Delalande et al., 2005;
impacted by changes in land use and land cover.                     Gat and Airey, 2006; Sacks et al., 2014) and to estimate wa-
   In this study, we investigate for the first time lakes Iro and   ter budgets (Gibson et al., 2002; Mayr et al., 2007; Vallet-
Fitri, two perennial lakes in the Sudanian and Sahelian re-         Coulomb et al., 2008; Delalande et al., 2008; Gibson et al.,
gions of the Lake Chad basin. Besides their importance for          2017). In the case of intertropical lakes, however, the very
local sedentary and nomadic populations, the study of their         large variations of isotopic composition induced by the sea-
hydrological functioning may provide pertinent small-scale          sonal cycle represent a very serious hurdle for mass balance
analogs of Lake Chad itself and help test the respective influ-     calculations. Recently, Cui et al. (2018) reviewed a num-
ence of the different forcing parameters and processes, thus        ber of case studies where detailed hydrographic and isotopic
constituting potential sentinel systems for future evolutions.      monitoring had been obtained on different lakes under vari-
Indeed, understanding the hydrology of Lake Chad and the            ous climates in order to identify the most representative pe-
origin of its strong surface variability has been the focus of      riod for sampling during the seasonal cycle in each case, in
a large number of studies (Fontes et al., 1970; Carmouze,           the hope of obtaining a representative long-term perspective
1969; Olivry et al., 1996; Bouchez et al., 2016; Bader et al.,      on lake water balance. This study confirms that each lake has
2011), but predicting its future behavior in response to cli-       a specific response depending on its climate and hydrologic
mate change remains a challenge owing to the complexities           context, which is unpredictable without extensive monitor-
of its hydrography and to the extremely diverse characteris-        ing.
tics of the various compartments of its catchment (Lemoalle            The objectives of our study are twofold. First, we propose
et al., 2012).                                                      combining point isotopic data with altimetry imagery in or-
   The study of intertropical lakes raises specific difficulties    der to provide quantitative constraints at the lake scale on the
related to their intrinsic characteristics, such as extremely       hydrological budget (i.e., evaporation to influx ratio) of Iro
high evaporation rates, huge seasonal variations of fluxes that     Lake and Lake Fitri, with a proper assessment of uncertain-
lead to large fluctuations of lake level and surface, and sea-      ties. We show that it is possible to take into account seasonal
sonal changes in hydrologic configuration that result from          variability, beginning with limited dry season measurements,
ephemeral ponds and humid zones which flood during the              and we discuss the related error propagation which has sel-
wet season. Moreover, an even more compelling problem               dom been considered in similar previous studies. We first ex-
stems from the logistical impossibility of reaching the field       plain our approach and test it on the well-documented case of
sites during the wet season, when the trails are inaccessible       Lake Ihotry in Madagascar, which has previously been exten-
for several months. As a consequence, there is a general lack       sively studied by our group (Vallet-Coulomb et al., 2006a, b;

Hydrol. Earth Syst. Sci., 23, 1705–1724, 2019                                     www.hydrol-earth-syst-sci.net/23/1705/2019/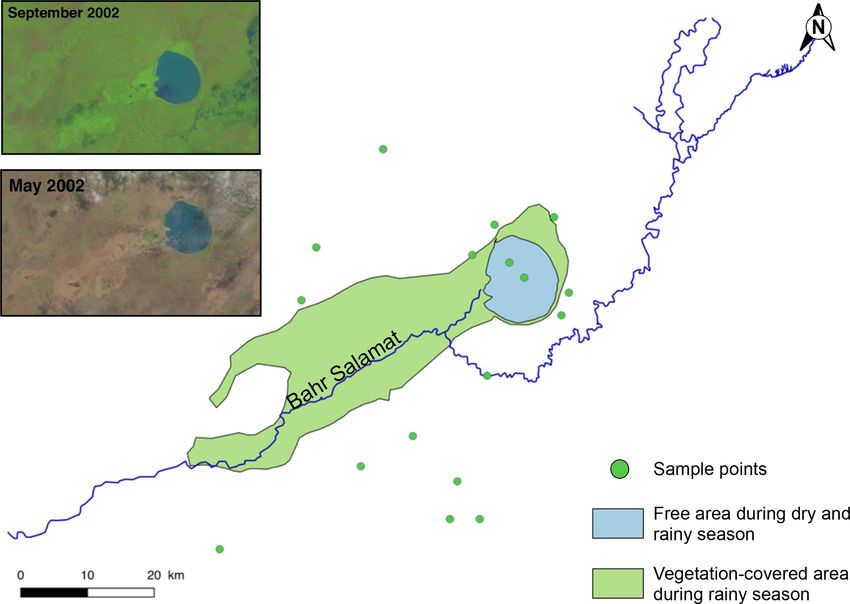
C. Poulin et al.: Unraveling the hydrological budget of isolated and seasonally contrasted subtropical lakes                  1707

Vallet-Coulomb et al., 2008). After validation on this bench-       stream of Lake Fitri in the Batha catchment, between 1955
mark site, we apply the same method to the original data that       and 1993 (SIEREM data, Boyer et al., 2006). These rivers
we obtained from the Chadian lakes Iro and Fitri in order to        (also locally called “Bahrs”) flow over the Quaternary de-
establish a first-order local hydrologic budget of these water      posits of the Chad basin. A small number of granitic in-
bodies.                                                             selbergs outcrop around the two lakes, along with laterite
    Secondly, we discuss the possibility of using these data        surfaces especially at Iro Lake. The superficial aquifers are
to investigate the hydro-climatic budget at the larger scale of     imbedded in sand–clay sedimentary deposits. In the area of
the entire watersheds of these lakes and, in particular, the par-   Iro Lake, the phreatic aquifer in connection with the surface
titioning between transpiration and evaporation at the basin        network is uniformly shallow (5–30 m) (Schneider, 2004).
scale, as has recently been described by several authors (Gib-      Lake Fitri is at the eastern fringe of the Quaternary aquifer
son et al., 2008; Jasechko et al., 2013).                           of the Lake Chad basin (Leblanc et al., 2007). This sedi-
                                                                    mentary aquifer is characterized by major piezometric de-
                                                                    pressions with amplitudes of more than 60 m, such as the
2     Study area                                                    Chari-Baguirmi depression that is located west of Lake Fitri
                                                                    (Abderamane et al., 2013). Around the lake, the water table
2.1    Lakes Iro and Fitri, Chad                                    is at 10–15 m depth at Ati toward the north and at a depth of
                                                                    50 m 20 km westward from the lake.
Lakes Iro (10.1◦ N; 19.4◦ E) and Fitri (12.8◦ N; 17.5◦ E) be-          The two lakes are surrounded mainly by hydromorphic or
long to two different sub-catchments in the central part of         halomorphic vertisols (soil map ORSTOM, 1968). Hydro-
the Lake Chad basin (Fig. 1). Although today it is very shal-       morphic soils are constantly flooded during the rainy season
low, Iro Lake likely originated as a meteoric impact (Garvin,       (Gillet, 1969), which allows the growth of flood recession
1986). It is close to the outlet of the Bahr Salamat watershed      crops (in particular, sorghum, locally called “berbere”). Veg-
(195 000 km2 ), a sub-catchment of the Chari–Logone rivers          etation forms acacia-dominated savannah (Acacia seyal and
(90 % of the Lake Chad water supply). Bahr Salamat draws            Acacia sieberiana) and Combretum sudan savannah (Com-
its source in Darfur (western Sudan) and feeds Iro Lake dur-        bretum glutinosum and Terminalia avicennioides) around Iro
ing the rainy season through a seasonal defluent (Fig. 2; Bil-      Lake (Gillet, 1969), as well as a steppe with Acacia senegal
lon et al., 1974). Lake Fitri (Fig. 3) can be considered a          and Acacia tortilis at Lake Fitri.
miniature analog of Lake Chad. It is the endorheic termi-              The regions of Guéra (Iro Lake) and Batha (Lake Fitri)
nal lake of the Batha catchment (96 000 km2 ), which lies en-       each hosts half a million people (RGPH, 2009). These lakes
tirely in the Sahel zone. Albeit a permanent lake during most       form important economic poles in their respective regions
of the 20th century, it dried out in 1901 and again in 1973         with various activities: agriculture, fishing, livestock farming
(Lemoalle, 1987). These two lakes are thus located under two        and more recently gold mining in the south of Lake Fitri.
different climates: Sahelo-Sudanian for Iro and Sahelian for        These multiple activities can be sources of conflict when their
Fitri. Both are characterized by a rainy season from June to        distribution areas overlap and may also increase pressure on
September, followed by a dry season, with an annual rain-           resources.
fall of 765 mm yr−1 at the Am Timan station upstream of Iro
Lake and 360 mm yr−1 at Ati station upstream of Lake Fitri          2.2   Lake Ihotry, SW Madagascar
(annual averages between 1960 and 2014, data from the Di-
rection of Water Resources and Meteorology: DREM, Chad).            Lake Ihotry is located in SW Madagascar. It is a small lake
Precipitations are brought by the African Monsoon, and char-        (between 68 and 115 km2 ) located in an endorheic kars-
acterized by a large inter-annual as well as inter-decadal vari-    tified limestone watershed covering 3000 km2 (Grillot and
ability: during the 1950s and 1960s the area received heavy         Arthaud, 1990). The climate is semi-arid and is characterized
precipitation, while in the 1970s and 1980s it endured se-          by a strong contrast between dry and rainy seasons. Precip-
vere repeated droughts. The mean annual temperatures are            itations occur between December and March and are about
27 and 28 ◦ C for lakes Iro and Fitri, respectively, and their      800 mm yr−1 . Climatic conditions are thus quite similar to
relative mean annual humidity is 50 % and 40 % (data from           those observed around the Chadian lakes. Half the input to
Am Timan station, relating to the period between 1966 and           Lake Ihotry comes from the Befandriana River and associ-
1976 for Iro Lake; and from Ati station between 1960 and            ated hyporheic fluxes, and the other 50 % enters as direct
2004 for Lake Fitri, Boyer et al., 2006). Piche evaporimeter        rainfall (Vallet-Coulomb et al., 2008). Water balance analysis
data were recorded between 1961 and 1988 at the Birao sta-          shows that Lake Ihotry is a closed-system lake, with evapora-
tion (same latitude as Iro but further east) in Central African     tion representing 99 % of the output (Vallet-Coulomb et al.,
Republic, giving a 1.8 m yr−1 evaporative flux (DREM).              2006b). By contrast with lakes Chad, Iro and Fitri, Lake
   Fluvial flow rates were measured on the Bahr Azoum, up-          Ihotry is a saline lake with a conductivity ranging between
stream of Iro Lake in the Bahr Salamat catchment (ORSTOM            7000 and 23 000 µS cm−1 .
data from 1953 to 1966, then DREM until 1973) and up-

www.hydrol-earth-syst-sci.net/23/1705/2019/                                      Hydrol. Earth Syst. Sci., 23, 1705–1724, 2019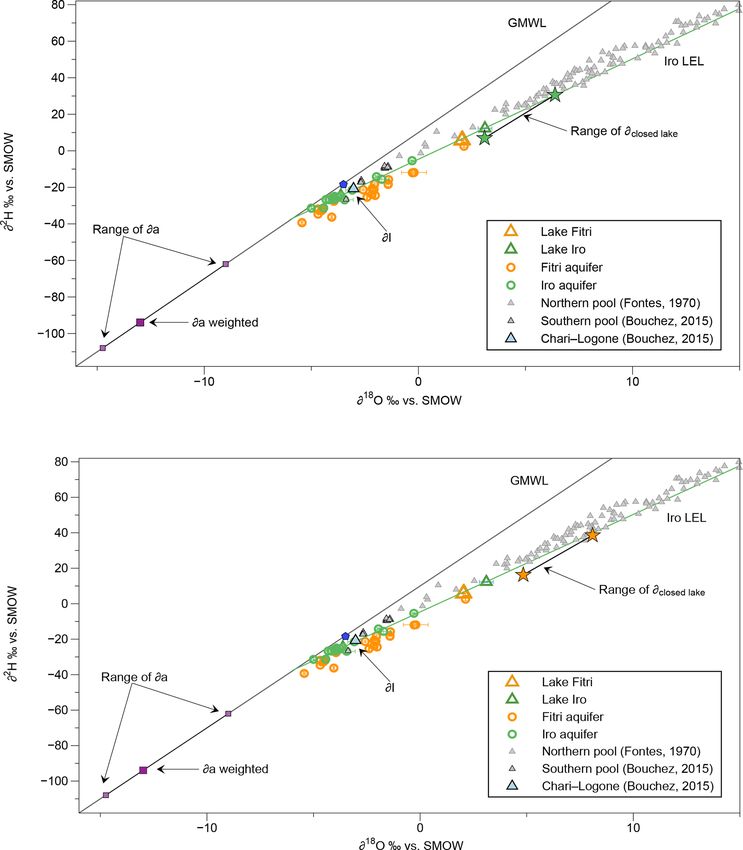
1708 C. Poulin et al.: Unraveling the hydrological budget of isolated and seasonally contrasted subtropical lakes
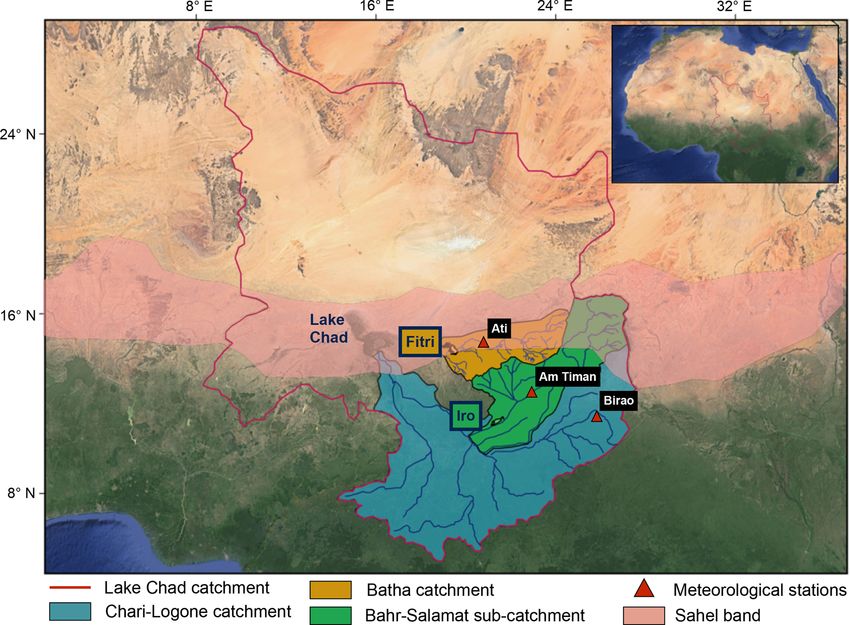
Figure 1. Lake Chad basin (red line) is crossed by the Sahel strip (pink), which delineates the arid northern part and the humid southern part.
It is constituted by two main catchments: the Chari–Logone rivers feeding Lake Chad (blue) and the Batha River feeding Lake Fitri (orange).
The Bahr Salamat river (green) is a sub-catchment of the Chari–Logone rivers and feeds Iro Lake. Data from three meteorological stations
(red triangles) have been used for this study.
The hydrologic cycle and isotopic data of this lake have with CO2 (10 h at 291 K) and H2 (2 h at 291 K with a plat-
been regularly monitored and analyzed through several sea- inum catalyst), for δ 18 O and δ 2 H, respectively, in an auto-
sonal cycles, leading to a well-constrained hydrological and mated HDO Thermo Finnigan equilibrating unit. The iso-
isotopic model (Vallet-Coulomb et al., 2006a, b; Vallet- topic ratios are reported in per mil (‰) versus VSMOW, nor-
Coulomb et al., 2008), which thus constitutes a valuable malized to the VSMOW2–VSLAP2 scale using three labo-
benchmark for our approach. ratory standards, following the IAEA reference sheet IAEA
(2009). Each analysis has been duplicated, or further re-
peated when necessary, and the total uncertainty is less than
3 Data collection ±0.15 ‰ (1σ ) and ±1 ‰ (1σ ) for δ 18 O and δ 2 H, respec-
tively.
Samples were collected for geochemical analyses during two
In order to survey the lake surface variations, we used
field campaigns, on Lake Fitri at the end of February 2015
Landsat 7 and Landsat 8 monthly satellite images (NASA
and on Iro Lake in April 2015. At each sampling point
Landsat program, 1999 and 2013). Water level changes can
(Figs. 2 and 3), physicochemical parameters were measured,
be measured using satellite altimetry. This technique was de-
and surface waters and groundwaters were collected for sta-
signed to study water level changes over the oceans, but can
ble isotopes, major ions and other isotopic analyses. Only
also be used over lakes and rivers. Since 1992 a large number
stable isotope analyses are presented and discussed here. A
of altimetry missions have been launched. The nadir altime-
total of 33 groundwater samples were collected (14 for Iro
ter emits pulses toward the nadir and the distance between
Lake and 19 for Lake Fitri) and 4 surface water samples (2
the altimeter and the Earth’s surface can then be measured by
for each lake). The Bahr Salamat was also sampled upstream
calculating the time it takes to receive the echo as it rebounds
of the defluent that feeds Iro Lake, and one sample from the
from the reflecting surface. When the precise orbit of the
Chari River was taken upstream of the confluent of the Bahr
satellite is known, this calculation can then be used to deter-
Salamat. The Batha River was dry at this period.
mine the water height of lakes or rivers (Crétaux et al., 2016)
Stable isotope measurements were performed at CEREGE
in studies of continental hydrology. Altimetry data from the
using cavity ring-down laser spectrometry (PICARRO
AltiKa altimeter on board the SARAL satellite were used to
L1102-i) for low-salinity samples (< 1000 µS cm−1 ). The
track the lake level variations between 2013 and 2015.
high-salinity samples (> 1000 µS cm−1 ) were analyzed on a
dual-inlet Delta Plus mass spectrometer, after equilibration
Hydrol. Earth Syst. Sci., 23, 1705–1724, 2019 www.hydrol-earth-syst-sci.net/23/1705/2019/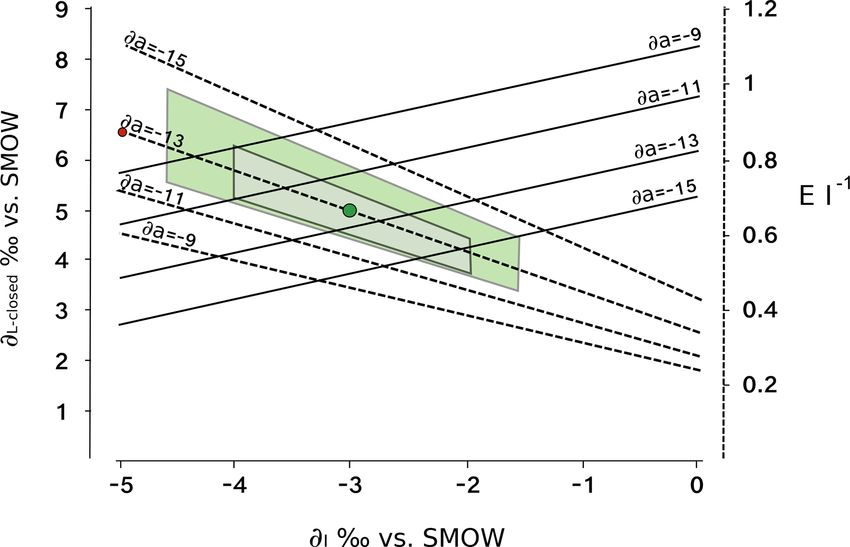
C. Poulin et al.: Unraveling the hydrological budget of isolated and seasonally contrasted subtropical lakes 1709
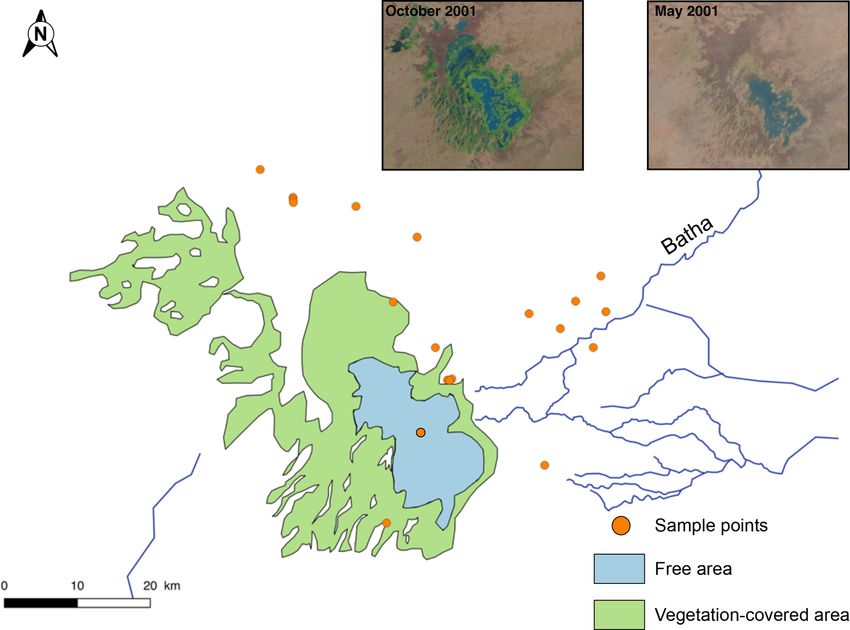
Figure 2. Landsat 7 pictures of Iro Lake during the wet season (September) and at the end of the dry season (May). The states of the lake are
represented in blue for open water and in green for vegetation covering the flood plain during the rainy season. Only a portion of the Bahr
Salamat river feeds the lake. Green dots represent the sampled water during April 2015.
4 Methods kinetic fractionation processes. It is traditionally calculated
using the Craig–Gordon model (Craig and Gordon, 1965):
4.1 Hydrologic budget at the lake scale
δL −∗
α − hδa − K
In this section, we recall the basic principle of the determina- δE = , (4)
1 − h + K
tion of the ratio E/I between evaporation (E) and influx (I )
and explain our handling of the isotopic budget equations. where δE is expressed as a function of equilibrium (α, ∗)
The water mass balance and the isotopic mass balance of a and kinetic (K ) fractionation factors, the relative humidity
homogeneous lake at steady state is given by (h) and the isotopic composition of the atmospheric vapor
(δa). The values and the calculation of these different factors
I = Q + E, (1) have been discussed extensively by several authors and are
I δI = QδQ + EδE , (2) listed in the Appendix. The seasonal variations of h are ob-
tained from regional weather stations. The value of δa can
where I is the flux of water flowing in, either as precipitation, be measured in the field either with a cryogenic trap device
surface runoff or groundwater. E is the evaporation flux, and (Fontes et al., 1970; Krabbenhoft et al., 1990; Salamalikis
Q is the outflow. δI and δQ are the amount-weighted aver- et al., 2015) or more recently by laser spectrometry (Tremoy
age isotopic compositions of inflow and outflow, which can et al., 2012). Since these measurements remain relatively
both be measured directly, at least as far as surface inflow rare, an alternative is to assume as a first approximation that
is concerned. Physical outflow does not cause any isotopic δa is in isotopic equilibrium with the precipitation, and then
fractionation: the outflow has thus the same isotopic signa- to discuss the sensitivity of the results with respect to this
ture as the lake (δQ = δL). δE is the isotopic composition of assumption:
the evaporation flux leaving the lake.
δP − ∗
By combining Eqs. (1) and (2), the evaporation to inflow δa = , (5)
ratio (E/I ) can be expressed as α
δa ≈ δP − ∗ . (6)
E δI − δL
= . (3) Calculated from steady-state values, or from average val-
I δE − δL
ues integrated over the annual cycle, the E/I ratio allows us
The evaporation flux leaving the lake is depleted in heavy to discriminate between lakes behaving as closed systems,
isotopes relative to the lake and depends to a large degree on i.e., where evaporation is the only water output (E/I = 1),
www.hydrol-earth-syst-sci.net/23/1705/2019/ Hydrol. Earth Syst. Sci., 23, 1705–1724, 2019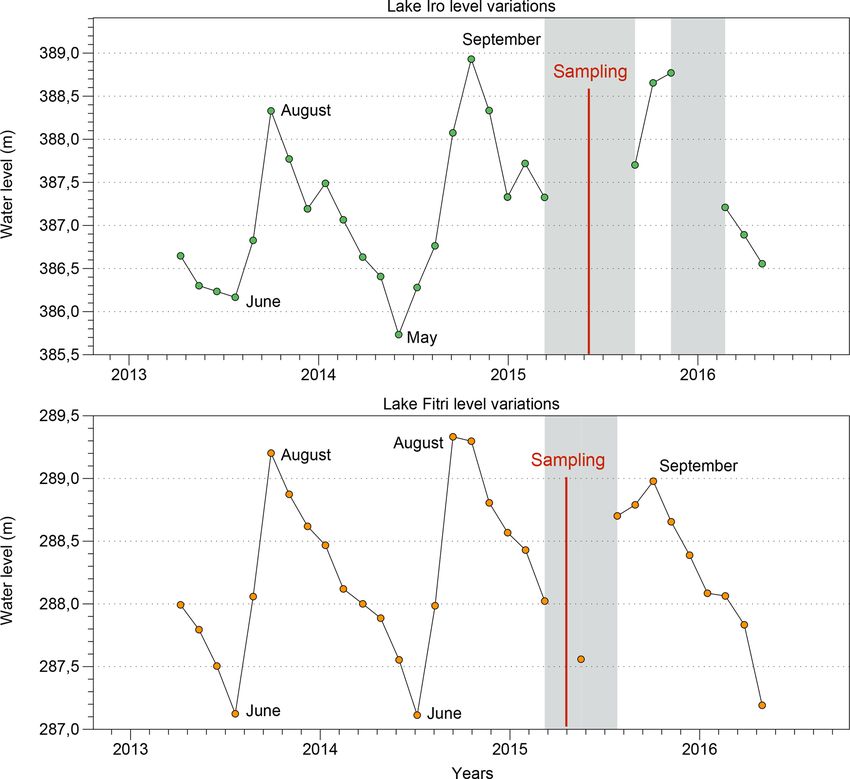
1710          C. Poulin et al.: Unraveling the hydrological budget of isolated and seasonally contrasted subtropical lakes

Figure 3. Landsat 7 pictures of Lake Fitri during the wet season (October) and at the end of the dry season (May). The states of the lake
are represented in blue for open water during both wet and dry seasons and in green for vegetation covering the largest area during the rainy
season. The Batha River is the main tributary, and orange dots represent the sampled water during January 2015.

and open-system lakes from which water can exit as sur-                     The isotopic composition measured during the dry season,
face or underground flow (E/I < 1). Cases where E/I > 1                  δL−dry , can then be compared to this δL−closed value. For a
would thus indicate lakes that are not in steady state and are           lake where δL−dry < δL−closed , we can deduce that the mean
progressively drying out.                                                annual value of δL , which is always lower than δL−dry , is thus
   This approach has been used extensively in previous stud-             also lower than δL−closed . This means that the lake is “open”,
ies (Zuber, 1983; Gibson et al., 1993, 2002; Mayr et al.,                with a significant outflow, and the application of Eq. (3) leads
2007; Yi et al., 2008; Brock et al., 2009), especially for inter-        to a maximum value of E/I .
comparisons between lake hydrological budgets at a regional                 In a second step, a more precise E/I value can be ob-
scale, assuming that the seasonal variations of lake level and           tained, based on seasonal lake volume variations estimated
composition can be neglected by comparison with the re-                  from satellite data. For this purpose, a model value of the
gional gradients (Gibson et al., 2002). On the other hand,               isotopic composition of the lake at the end of the wet sea-
in regions with high seasonal contrast in lake level between             son (δL−wet ) must be obtained. The simplest case is that of a
wet and dry seasons, it is essential to have access to annual            closed-system lake, when the flux of evaporation can be ne-
integrated values in order to solve Eq. (3). Therefore, regular          glected compared to the inflow during periods of wet season
monitoring of lake level and isotopic composition, as well               lake level increase. In this case,
as of inflow and outflow measurements, is required. How-
ever, for lakes that cannot be monitored for logistical rea-             δL−wet = yδI + (1 − y)δL−dry ,                                  (8)
sons, such as the two Chadian lakes investigated here, we                           Vwet −Vdry
                                                                         with y =     Vwet .
show below that a first-order estimate of the water balance
can be assessed from dry season isotopic data alone, with the
                                                                           Vwet is the maximum volume of the lake at high stand, and
addition of lake level satellite data.
                                                                         Vdry is the low-stand volume at the end of the dry season. In
   Indeed, for any given lake for which the regional values of
                                                                         cases where the outflow is not negligible during the wet sea-
δa, h and δI are known, we can calculate the isotopic compo-
                                                                         son, and considering constant inflow and outflow (Qin and
sition characteristic of the closed-system situation (δL−closed )
                                                                         Qout , respectively) during the wet season, the equation be-
by combining Eq. (4) with the steady-state condition δE = δI :
                                                                         comes
δL−closed = (δI (1 − h + K ) + hδa + K )α +  ∗ .             (7)                      δL−dry − δI
                                                                         δL−wet = δI +                1
                                                                                                        ,                          (9)
                                                                                         (1 + V1V
                                                                                                dry
                                                                                                    ) γ

Hydrol. Earth Syst. Sci., 23, 1705–1724, 2019                                           www.hydrol-earth-syst-sci.net/23/1705/2019/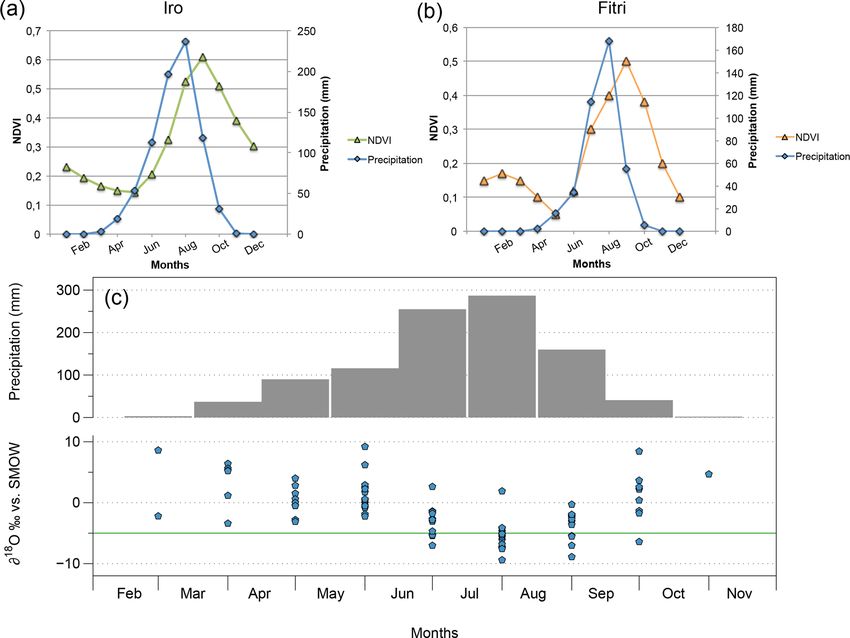
C. Poulin et al.: Unraveling the hydrological budget of isolated and seasonally contrasted subtropical lakes                1711

with γ = 1 − QQout
                in
                   .                                               more acidic around Iro Lake (5 < pH < 7) than around Lake
  More complex situations with time-variable fluxes and            Fitri (6.5 < pH < 8.5).
non-negligible evaporation during infilling would require us-         The lakes’ stable isotopes compositions are (+3.11 ‰,
ing a complete finite-difference model based on a priori as-       +12.3 ‰) for δ 18 O and δ 2 H at Iro Lake in April and
sumptions on the respective proportions of the different flows     (+2.04 ‰, +5.8 ‰) at Lake Fitri in February. In the δ 2 H
over time:                                                         versus δ 18 O diagram (Fig. 4), these compositions plot far to
                                                                   the right of the global meteoric water line (GMWL), with
(δL V )t+1t = (δL V )t + δI Qin − EδE − Qout (δL )t ,      (10)    deuterium-excess (d-excess) values of −12 ‰ and −10 ‰,
                                                                   respectively, typical of evaporated lake waters (see Jasechko
where all the terms may vary with time, and should be ad-
                                                                   et al., 2013, for a global compilation).
justed to fit the observed value of δL , and when the time vari-
                                                                      As is traditionally observed in the semi-arid zone (Gaye
ation of the volume (V ) obtained from satellite observations
                                                                   and Edmunds, 1996; Weyhenmeyer et al., 2000; Lamon-
is known.
                                                                   tagne et al., 2005; Gonçalvès et al., 2015) the groundwater
4.2    Hydrological budget at the catchment scale                  data around the two lakes form two local evaporation lines
                                                                   (LELs), with a slope lower than the GMWL and the most de-
In parallel to the characterization of a lake’s hydrologi-         pleted values plotting on or close to it (Fig. 4). A noticeable
cal regime, it is also important to evaluate possible hydro-       feature is that, while the two lines are very close, they are
climatic inferences at the scale of the entire catchment, es-      nevertheless significantly distinct from one another, with a
pecially with respect to the influence of evaporation and          similar range of variation (between −5 ‰ and 0 ‰ for δ 18 O
transpiration on the water balance. Gibson et al. (2008) and       at Iro Lake and between −5 ‰ and +2 ‰ at Lake Fitri) and
Jasechko et al. (2013) proposed an attribution method based        similar slopes (5.5 ± 0.3 and 5.2 ± 0.3), but with a distinctly
on solving the three end-member equations between transpi-         lower intercept (Fig. 4). Although the two alignments are
ration (T ), evaporation (E) and outflow (Q), using the prop-      well defined, it is noteworthy that the data from Lake Fitri
erty that, though transpiration does not fractionate water iso-    show more scatter than do those from Iro Lake, especially
topes, evaporation does induce strong fractionation. The so-       in the most depleted values (MSWD = 6.0 and 33, respec-
lution of this equation for a steady-state catchment without       tively). Finally, it must be pointed out that the lakes’ compo-
additional inflow from upstream is                                 sitions both plot on Iro Lake LEL, suggesting a direct con-
                                                                   nection and continuity between surface water (lake and river)
       P (δP − δE ) − Q(δL − δE )                                  and aquifer at Iro Lake, but implying a more complex situa-
T =                               .                        (11)
                δT − δE                                            tion at Lake Fitri.
                                                                      The local meteoric water line (LMWL) closest to our study
P is the average precipitation over the catchment, and δE
                                                                   sites is given by the rain samples collected at the IAEA sta-
is the isotopic composition of the evaporation flux, obtained
                                                                   tion of N’Djamena between 1962 and 2015. The data are
again with the Craig–Gordon model and the lake isotopic
                                                                   more or less continuous between 1963 and 2015, with a total
composition. Jasechko et al. (2013) assumed that δL can be
                                                                   of 78 months being recorded. The slope of the alignment is
considered to be representative of all the surface water over
                                                                   6.3 ± 0.2 with a large range of variation between −10 ‰ and
the catchment. The value of δT was calculated as the average
                                                                   +10 ‰ for δ 18 O. Such a low slope is generally considered
rainfall composition over the seasonal cycle, weighted by the
                                                                   to be a signature of a strong evaporation of rain droplets dur-
NDVI index (normalized difference vegetation index) (Cur-
                                                                   ing their atmospheric cycle (Dansgaard, 1964; Gat, 1996).
ran and Steven, 1983; Defries and Townshend, 1994), used as
                                                                   Interestingly, the precipitation-weighted average (−3.53 ‰,
a proxy of transpiration intensity. The results obtained from
                                                                   −18.4 ‰; d-excess = 6.5 ‰) calculated over this period is
this approach as they pertain to lakes Iro and Fitri are dis-
                                                                   significantly more enriched than the values found at the inter-
cussed below.
                                                                   section of the local meteoric water line and the two LELs of
                                                                   lakes Iro (−5.83 ‰; −36.6 ‰; d-excess = 3.9 ‰) and Fitri
5     Results                                                      (−7.21 ‰; −47.7 ‰; d-excess = −2.6 ‰) (Fig. 4).
                                                                      Figure 4 also compares our results with the data published
Lakes Iro and Fitri, along with Lake Chad itself, share the        on Lake Chad’s northern pool (Fontes et al., 1970) and south-
common characteristic of all being fresh-water lakes in spite      ern pool (Bouchez et al., 2016). All these data lie above the
of the very high evaporation rate in the Sahel region, with        LEL of Iro Lake, with data from the northern pool being very
dry season conductivity values of 170 and 140 µS cm−1 , re-        enriched (between −0.8 ‰ and +15 ‰ for δ 18 O and between
spectively, and a similar pH of 8. By contrast, groundwa-          −2.8 ‰ and +77 ‰ for δ 2 H). By comparison, the south-
ters around the two lakes are, in general, more saline, al-        ern pool is more depleted (between −3.3 ‰ and −1.5 ‰ for
though greatly variable, with conductivity ranging randomly        δ 18 O and between −26 ‰ and −10 ‰ for δ 2 H). The isotopic
between 65 and 1012 µS cm−1 at Iro Lake and between 705            composition of the Chari–Logone rivers (−2.55 ‰ for δ 18 O
and 14 000 µS cm−1 at Lake Fitri. Measured pH values are           and −15.4 ‰ for δ 2 H), measured in November 2011 and be-

www.hydrol-earth-syst-sci.net/23/1705/2019/                                     Hydrol. Earth Syst. Sci., 23, 1705–1724, 2019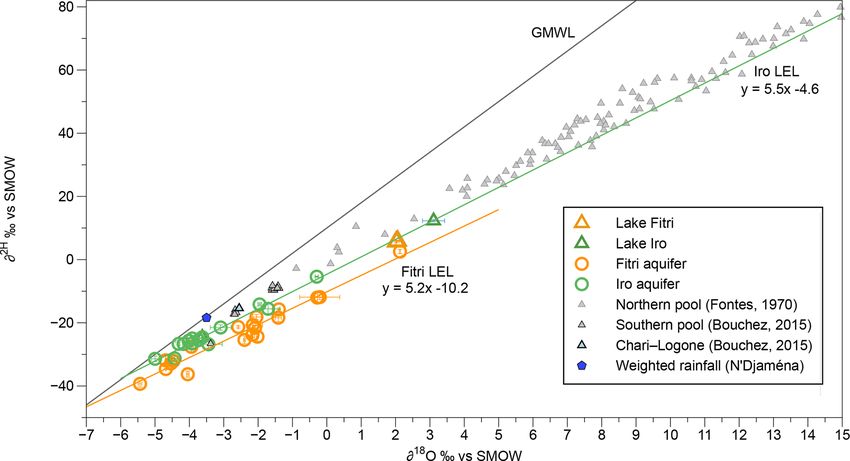
1712          C. Poulin et al.: Unraveling the hydrological budget of isolated and seasonally contrasted subtropical lakes

Figure 4. Relation between δ 18 O and δ 2 H (‰ vs. SMOW, Standard Mean Ocean Water) for surface water and groundwater samples from
Iro Lake and Lake Fitri. Iro Lake’s groundwater (green) forms a local evaporation line (LEL) on which the data from Iro Lake and Lake Fitri
are plotted (triangles). Lake Fitri’s groundwater forms another LEL below that of Iro Lake. In grey, Lake Chad data (Fontes et al., 1970) trace
their own LEL (y = 5.2x + 1), which can be seen above the two previous lines. The weighted rainfall (from N’Djamena IAEA station) is in
blue and the associated local meteoric water line (LMWL) equation is y = 6.3x + 5.

tween January 2013 and August 2014 (Bouchez et al., 2016;                 ond campaign (February 2016) (2.5 m maximum depth in the
Mahamat Nour et al., 2017), traces the same trend as Lake                 western part of the lake), the related change in volume is of
Chad LEL.                                                                 a factor of 4 for the year 2016.
   Altimetry data show amplitudes between 2 and 3 m for the
lake level variations at Iro Lake in the years 2013 and 2014
(year 2015 is incomplete). The measured maximum occurs                    6     Discussion
in August and September and the minimum in May and June
for these 2 years. For the same period, an amplitude of 2 m               6.1     Water balance of the lakes
was found for Lake Fitri, with a maximum in September and
a minimum in June (Fig. 5). Since the water depth measured                The results obtained from Eqs. (1) to (9) on the three lakes
during the field campaign at Iro Lake in April 2015 was 2 m               Ihotry, Iro and Fitri are listed in Table 1 and discussed below.
and was uniform across the transect, these satellite observa-             The propagation of uncertainties is discussed specifically in
tions show that the increase in water depth during the wet                Sect. 6.1.3, after presentation of the raw data.
season was in excess of a factor of 2. By contrast, the free
water surface (≈ 100 km2 ), clearly visible on Landsat 7 and              6.1.1    Lake Ihotry, SW Madagascar
Landsat 8 images (Fig. 2), shows only minor changes during
the year. This suggests that the extra 2 m of water added to              The calculation of δL−closed (Eq. 7) gives +0.44 ‰ and
the lake in summer is in fact spread over a large area adja-              −6.1 ‰ values for δ 18 O and δ 2 H (Fig. 6). The mean val-
cent to the lake itself that is covered by vegetation tolerant to         ues of δL−dry measured during the 3-year study are +5.44 ‰
seasonal flooding. The slightly lighter color observed on the             and +26.7 ‰ for δ 18 O and δ 2 H, which are thus significantly
satellite images around the lake (Fig. 2) is likely diagnostic            higher than δL−closed (Fig. 6). The values of δL−wet calcu-
of this surface, which we can therefore estimate on the or-               lated by Eq. (8) (closed-system lake) are δ 18 O = −2.20 ‰
der of 600 km2 (i.e., about 6 times larger than the dry season            and δ 2 H = −19.7 ‰, which are very close to the average iso-
lake surface). The related change in volume is by a factor                topic composition observed in March for Lake Ihotry (Vallet-
of 6, determined by inverse-distance-weighted interpolation               Coulomb et al., 2006b). We are thus in the situation where
and assuming a linear decrease in the depth toward the edges.             δL−wet < δL−closed < δL−dry , which is compatible with the di-
   Similarly, Lake Fitri also undergoes large seasonal vari-              agnostic of a closed-system lake.
ations of its surface: more than 1000 km2 wide during its                    In the case of Lake Ihotry, for which we have a regular
high level, it can shrink to less than 200 km2 at its low level           monitoring of the water flows and isotopic composition over
(Fig. 3). Based on the bathymetry measured during the sec-                3 years at a monthly timescale, we can push the analysis
                                                                          further by calculating a precise mean value of δL weighted

Hydrol. Earth Syst. Sci., 23, 1705–1724, 2019                                            www.hydrol-earth-syst-sci.net/23/1705/2019/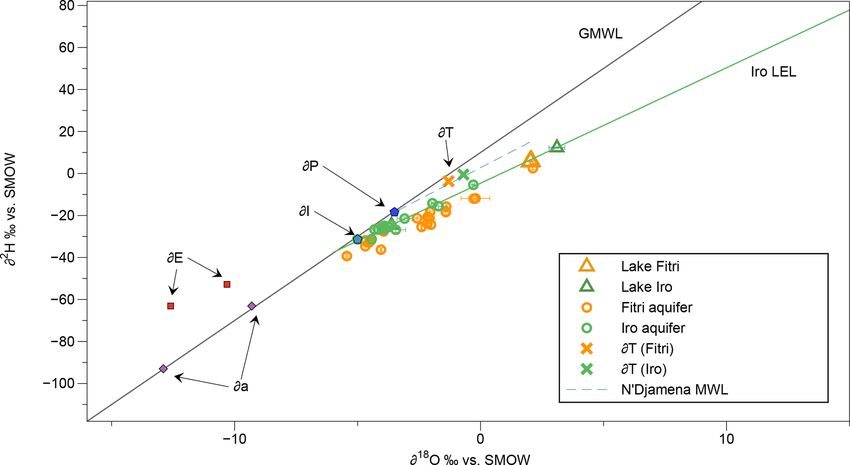
C. Poulin et al.: Unraveling the hydrological budget of isolated and seasonally contrasted subtropical lakes                             1713

Figure 5. Lake level variations from altimetry data (SARAL satellite) for Iro Lake (in green) and Lake Fitri (in orange). Data cover the period
from 2013 to the beginning of 2016. The grey zones represent a lack of data, and the red line indicates the period of sampling. Variations
in lake level show a maximum of 3.5 m for Iro and of 2.5 m for Fitri during 2014. The maximum level is observed around August and
September, and the minimum is in May–June for both lakes.

Table 1. Uncertainties in δL−closed and E/I , for the three lakes studied, propagated from 1σ standard deviations for δa and δI .

                                             h%               δa ‰              δI ‰     δL−closed ‰           E/I
                                    δ 18 O            −12.99 ± 1.7         −3 ± 1.48      4.74 ± 1.65    0.65 ± 0.3
                                              0.5
                                    δ2 H              −93.9 ± 14.7         −20 ± 7.8      18.7 ± 11.8    0.73 ± 0.4
                           Iro
                                    δ 18 O            −12.99 ± 1.7                −5      3.72 ± 0.88    0.86 ± 0.1
                                              0.5
                                    δ2 H              −93.9 ± 14.7               −31       12.8 ± 7.3    0.97 ± 0.3
                                    δ 18 O            −12.99 ± 1.7         −3 ± 1.48      6.46 ± 1.62    0.41 ± 0.2
                                              0.4
                                    δ2 H              −93.9 ± 14.7         −20 ± 7.8      27.4 ± 11.2    0.41 ± 0.2
                           Fitri
                                    δ 18 O            −12.99 ± 1.7                −5      5.24 ± 0.70    0.57 ± 0.1
                                              0.4
                                    δ2 H              −93.9 ± 14.7               −31       20.2 ± 6.0    0.62 ± 0.1
                                    δ 18 O           −13.14 ± 1.86     −5.45 ± 1.87      0.44 ± 1.88     1.12 ± 0.7
                           Ihotry            0.78
                                    δ2 H              −93.9 ± 12.9     −27.5 ± 12.7      −6.1 ± 13.9     1.12 ± 0.7

www.hydrol-earth-syst-sci.net/23/1705/2019/                                             Hydrol. Earth Syst. Sci., 23, 1705–1724, 2019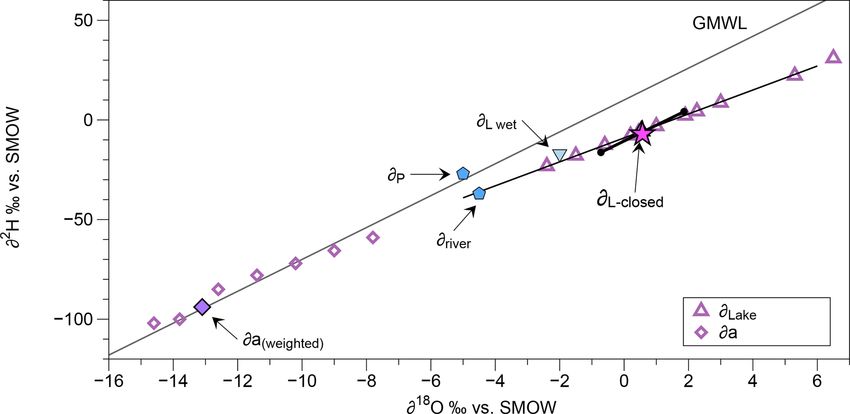
1714          C. Poulin et al.: Unraveling the hydrological budget of isolated and seasonally contrasted subtropical lakes

Figure 6. Representation of δL−closed for Lake Ihotry. Purple triangles represent Lake Ihotry isotopic composition over a year, and the purple
diamonds are the atmospheric isotopic composition (δa) over a year (the solid one represents the δa-weighted average). δP is the rainfall
isotopic composition above Lake Ihotry and δriver is the isotopic composition of the Befandriana River which feeds Lake Ihotry. The pink
star represents the δL−closed , calculated according to Eq. (6). The blue triangle is the δL−wet , calculated using Eq. (9). The black line around
δL−closed represents the associated uncertainties.

by the output flows. The values we obtain for δL (δ 18 O =                 provides an average value of the isotopic composition of the
+0.58 ‰ and δ 2 H = −5.5 ‰ ) are very close to δL−closed ,                 lake, from which a ratio E/I = 0.4 is calculated for Iro Lake.
which confirms both the closed lake conclusion and the reli-                  These results can be confronted with the scarce hydro-
ability of the method.                                                     logical information available on the studied systems. For Iro
                                                                           Lake, based on the 1.8 m yr−1 mean evaporation recorded at
                                                                           the Birao station (SIEREM), and assuming an average sur-
6.1.2   Iro and Fitri                                                      face of the lake of 350 km2 (halfway between the dry and wet
                                                                           season surfaces), we can estimate that the mean flux of vapor
The same approach is then applied to lakes Iro and Fitri.                  escaping the lake (E) is on the order of 5.108 m3 yr−1 . The
The results are shown in Fig. 7. Depending on the differ-                  inflow (I ) is then between 17 and 31 m3 s−1 (after subtraction
ent assumptions that we can use for the values of the pa-                  of the minor contribution of direct rainfall on the lake sur-
rameters δI and δa (Table 1), δL−closed can vary between                   face), and the outflow (Q) is between 6 and 11 m3 s−1 . These
+3 ‰ and +6 ‰ for δ 18 O, and between +11 ‰ and +30 ‰                      figures are thus coherent with the average flow of 30 m3 s−1
for δ 2 H for Iro Lake. For Lake Fitri, the values range be-               measured on the Bahr Azoum at the Am Timan station be-
tween +5‰ and +7 ‰ for δ 18 O and between +18 ‰ and                        tween 1953 and 1975.
+34 ‰ for δ 2 H. These values are in both cases definitely                    For Lake Fitri, using the evaporation of about 2 m yr−1 ,
higher than those measured on the lakes: we are in the case                similar to that calculated on the southern pool of Lake Chad
where δL−dry < δL−closed , which is characteristic of open lake            under the same climatic condition (Bouchez et al. 2016), we
systems. The resulting maximum E/I value for Iro Lake is                   obtain a flux on the order of 16.108 m3 yr−1 and an inflow be-
E/I = 0.65, calculated with either δ 18 O or δ 2 H. For Lake               tween 43 and 110 m3 s−1 . The maximum flow rate recorded
Fitri, we find E/I = 0.41. However, since the sample was                   at the Ati station between 1956 and 1993 was 66 m3 s−1 ,
collected in the middle rather than at the end of the dry sea-             corresponding to the maximum rainfall of 571 mm yr−1 over
son, δL−dry is most probably higher than our measured value,               this watershed in 1962 (DREM). It must be noted that the
and the corresponding E/I result can only be taken as a                    river dried out completely during the drought episodes of the
lower estimate.                                                            1980s. Furthermore, the flows recorded at Ati are not fully
   This maximum E/I value can then be combined with the                    representative of the total flux feeding the lake, since a mul-
1V /Vdry value estimated from the satellite data, to calcu-                titude of barely quantifiable streams reach the lake down-
late the range of δL−wet values based on Eq. (9) (δL−wet =                 stream of the gauging station, contributing to the larger cal-
−0.77 ‰; −9.8 ‰ for δ 18 O and δ 2 H), keeping in mind that                culated flows. The calculated outflow Q is between 14 and
this is a first-order approximation, based on the simplifying              36 m3 s−1 . Since the lake is endorheic, this flux must be feed-
assumption of constant flux and negligible evaporation dur-                ing the surrounding Quaternary aquifer. This infiltration al-
ing the rainy season. Finally, the arithmetic mean between                 lows for its chemical regulation (i.e., maintenance of low
δL−dry and δL−wet (0.19 ‰ for δ 18 O and −4.2 ‰ for δ 2 H)                 salinity), as it is the case for Lake Chad (Carmouze, 1969;

Hydrol. Earth Syst. Sci., 23, 1705–1724, 2019                                              www.hydrol-earth-syst-sci.net/23/1705/2019/
C. Poulin et al.: Unraveling the hydrological budget of isolated and seasonally contrasted subtropical lakes 1715
Figure 7. Representation of δL−closed variations for Iro Lake and Lake Fitri (green and orange stars, respectively). They are slightly below
Iro Lake’s local evaporation line (LEL), in green, formed by Iro Lake’s groundwater (green circles). Iro Lake and Lake Fitri (green and
orange triangles) plot on this LEL, but Lake Fitri’s groundwater (orange circles) plots just below. Purple dots represent the atmospheric
isotopic composition (δa). δI is the isotopic composition entering the system for Iro Lake surface water and groundwater and for Lake Fitri
surface water only. We took ±1σ for δa and δI to represent the range of variations of δL−closed .
Bouchez et al., 2016). However, as we pointed out above, the Eq. (4) (h, δI and δa), below we discuss separately the in-
isotopic composition of the lake water does not plot exactly fluence of each of them on the results. An illustration of this
on the LEL defined by the groundwater samples (Fig. 4), sug- discussion is given in Fig. 8, where δL−closed and E/I are
gesting that the surface water is in some way disconnected plotted against δI for various values of δa and h (grey poly-
from the aquifers in this case. This question is briefly re- gon).
ferred to below when considering the basin-scale budget, but
requires a more extended study including radioactive tracers. h: relative humidity
6.1.3 Evaluation of uncertainties The relative humidity is relatively constant at Lake Ihotry
(75 %–81 %, Vallet-Coulomb et al., 2006b), but shows a
In order to evaluate the sensitivity of our conclusions to the large range of seasonal variation at lakes Iro and Fitri
choice of values of the three principal parameters used in (25 %–77 % and 16 %–75 %, respectively). Average values
www.hydrol-earth-syst-sci.net/23/1705/2019/ Hydrol. Earth Syst. Sci., 23, 1705–1724, 20191716 C. Poulin et al.: Unraveling the hydrological budget of isolated and seasonally contrasted subtropical lakes
between precipitation and atmospheric vapor are close to the
seasonal minimum value. For Lake Ihotry, we used the av-
erage of the model δa values, weighted by the evaporative
fluxes (Vallet-Coulomb et al., 2006b) (−13.14 ± 1.86 ‰ and
−93.9±12.9 ‰ in δ 18 O and δ 2 H), and for lakes Iro and Fitri,
the average of the data from (Tremoy et al., 2012), again
weighted by the regional evaporative fluxes (−12.99±1.7 ‰
and −93.9±14.0 ‰). The use of the data of Niamey for these
two lakes was previously used on Lake Chad by Bouchez
et al. (2016) and is justified by the strong correlation between
the δ 18 O measurements in Niamey and the LMDZ-iso model
outputs for the Sahel strip (Tremoy et al., 2012). The result-
ing range of uncertainty is illustrated in Fig. 8 in the case of
Iro Lake and listed in Table 1 for lakes Ihotry and Fitri.
Figure 8. Final δ 18 O uncertainties in δL−closed and E/I calculated
by taking ±1σ for δa and δI . The green dot represents the E/I δI : isotopic composition of influx
and δL−closed average value, and the green polygon is the associ-
ated uncertainty. δa is the mean annual value (Jasechko et al., 2013) The assumption of δI ≈ δP is questionable for large catch-
weighted by evaporation flux (DREM data) and δI is the Chari–
ments where the isotopic composition of the rivers may be
Logone rivers’ mean annual value weighted by flow rate (Bouchez
more or less marked by evaporation. In the case of lakes Iro
et al., 2016). The red point represents the δL−closed and E/I val-
ues for δI taken at the intersection between Iro Lake’s LEL and the and Fitri, in the absence of isotopic data for their main river
GMWL. The grey polygon represents the E/I uncertainties by tak- inflows, we chose the most depleted groundwater value, close
ing h ± 5 %. to the intersection between the GMWL and the LEL, as our
first-guess estimate for δI . This constitutes a minimum value
and thus gives a maximum result for E/I (Table 1). However,
weighted by the regional evaporation fluxes can be calcu- recent studies of the Chari–Logone rivers have shown that the
lated from SIEREM data (Boyer et al., 2006), as well as weighted annual average composition of the river is distinctly
their standard deviation (h = 52 ± 2.5 %, 1σ , for Iro Lake enriched by ca. 2 ‰ compared with the intercept between the
and h = 37 ± 3.4 %, 1σ , for Lake Fitri over 10 years), and LEL and the local meteoric water line (Mahamat Nour et al.,
the corresponding uncertainty is reported as dotted lines in 2017). Assuming a similar shift for the Bahr Salamat and
Fig. 8. Batha rivers, and again estimating the uncertainty from the
averages weighted by the river fluxes, we obtain lower E/I
δa: isotopic composition of the atmospheric moisture values of 0.65±0.3 for Iro Lake and 0.41±0.2 for Lake Fitri
(Fig. 8, Table 1). These values constitute our preferred esti-
The isotopic composition of the atmospheric moisture is the mate, until further characterization of these rivers.
least constrained parameter because of the scarcity of mea-
surements, leading to a poor understanding of its variations. 6.2 Water balance at the catchment scale
Tremoy et al. (2012) published the only continuous time se-
ries available in the Sahel strip, carried out by laser spectrom- We underlined the existence of three different LELs, close to
etry in Niamey (Niger). The results show a large variation but distinct from each other for the three watersheds of lakes
during the seasonal cycle (−15 ‰ < δ 18 OV < −9.5 ‰) with Chad, Iro and Fitri, which thus constitute independent enti-
two minima periods: one from August to September during ties (Fig. 4). The parallel slopes of those lines in δ 2 H versus
the rainy season and the other in January during the cold- δ 18 O are readily explained by a similar set of values of the
est month. The maximum occurs in May, at the end of the different parameters of the Craig and Gordon model at the
dry season. These variations are interpreted in terms of re- watershed scale. On the other hand, interpreting the different
gional climatology, as a function of seasonal displacement intercepts for the three evaporation lines is more speculative.
of continental air masses, and of the increase in convective The first assumption we make is to assign a specific rain-
activity during summer. In addition to these synoptic effects, fall isotopic composition to each catchment, corresponding
atmospheric vapor may also contain a significant fraction of to the intercept of the LEL with the GMWL. This implies
local recycling from lake evaporation (Gat et al., 1994). For that small climatic differences exist between the catchments
Lake Ihotry, Vallet-Coulomb et al. (2008) showed that the and that they remain stable over the catchment on timescales
lake isotopic balance implies that the isotopic composition of comparable to the water residence time. Such differences
the atmospheric vapor varied between −13.8 ‰ and −7.8 ‰ could be attributed to different orographic effects among the
for δ 18 O during the annual cycle. For Lake Ihotry and Ni- catchments and/or to a north–south gradient (Terzer et al.,
amey, the values of δa calculated by assuming equilibrium 2013). This interpretation can also be seen as coherent with
Hydrol. Earth Syst. Sci., 23, 1705–1724, 2019 www.hydrol-earth-syst-sci.net/23/1705/2019/C. Poulin et al.: Unraveling the hydrological budget of isolated and seasonally contrasted subtropical lakes 1717
Figure 9. (a) and (b) represent the monthly average precipitation (blue) over a year at the Am Timan and Ati station for Iro Lake and Lake
Fitri, respectively. Green and orange symbols represent the NDVI (normalized difference vegetation index) evolution over a year. For both
catchments, a 1-month delay between the maximum precipitation and the maximum NDVI is observed. (c) The grey bars represent the
monthly average precipitation. The blue dots represent the precipitation isotopic signature evolution (δ 18 O) month by month and the green
line is δI (taken at the intersection between GMWL and LEL). The maximum of precipitation corresponds to a depleted isotopic signature
(Dansgaard effect).
the difference noted between (i) the weighted average rainfall system (δI ) is different from δP , as observed for lakes Iro
isotopic composition at N’Djamena between 1962 and 2015 and Fitri. In particular, this may explain the apparent discon-
(−3.5 ‰ for δ 18 O) and (ii) the evaporation lines of lakes Iro nection between the lake and the aquifer at Fitri, if the aquifer
and Fitri. is preferentially recharged by the heavier summer rains and
However, an alternative hypothesis can be to ascribe the thus imprinted by their more depleted signature. In principle,
difference to a different partition between transpiration and the T /P ratio can be calculated from this difference by using
evaporation in the different catchments, following the ap- the mass balance budget:
proach outlined by Jasechko et al. (2013). Indeed, in all cases
where the rainfall composition varies during the season and T δ T + I δI = P δ P . (12)
the vegetation growth cycle is out of phase with precipitation,
different values are obtained between δT and δP . This is in- This gives T /P = 0.37 for the watershed of Iro Lake and
deed the case for the N’Djamena IAEA station data set, as il- 0.43 for Lake Fitri. However, this result is clearly strongly
lustrated in Fig. 9. We observe a large variation from −10 ‰ model dependent, based on the type of assumption adopted
to +10 ‰ for the δ 18 O of the rain, between the beginning and to estimate δT , directly related to the assessment of water
the end of the rainy season, with the heavy rainfall between depth removal by the vegetation and thus to the residence
July and August being the most depleted due to the “amount time within the soil before respiration (Dawson, 1996).
effect” (Dansgaard, 1964). The NDVI lags behind rainfall by Alternatively, the approach adopted by Jasechko et al.
about a month, and δT and δP are thus significantly different (2013) was to solve Eq. (11) using values measured at the
(−1 ‰ versus ≈ −3 ‰ in δ 18 O). catchment outlet for Q and at local weather stations for P .
The consequence of this difference between δT and δP is The results of this calculation are presented in Table 2 for
that the composition of the water entering the lake–aquifer the three lakes studied here and illustrated in Fig. 10. For the
catchment of Iro Lake, we took the measured flow rate of the
www.hydrol-earth-syst-sci.net/23/1705/2019/ Hydrol. Earth Syst. Sci., 23, 1705–1724, 20191718 C. Poulin et al.: Unraveling the hydrological budget of isolated and seasonally contrasted subtropical lakes
Table 2. Values used for the calculation of transpiration according to Eq. (11) for the three lakes studied. Other data from Lake Chad come
from (Bouchez et al., 2016), and data from Lake Ihotry are from Vallet-Coulomb et al. (2008).
δL δP δT δa δE T ◦C ha % S km2 I mm yr−1 T mm yr−1 T%
Lake Chad δ 18 O 8.2 ± 3.6 −3.2 ± 1 −1.8 ± 1.9 −9.3 ± 3 −3.4 27 36 976 300 739 111 14
(Jasechko, δ2 H 45 ± 19 −17 ± 9 −8 ± 14 −69 ± 39 −13.5 – – – – −464 −61
2013)
Lake Chad δ 18 O −2.6 −3.5 −1.8 ± 1.9 −12.99 −18.5 27 40 760 000 739 981 89
(other data) δ2 H −16 −18.4 −8 ± 14 −93.9 −85.3 – – – – 891 81
δ 18 O +3.11 −5 −0.7 −9 −10 27 50 195 000 765 390 52
Iro
δ2 H +12.3 −31 −0.5 −69 −57 – – – – 332 44
δ 18 O +2.04 – −1.3 −13 −10 – 40 96 000 360 203 56
Fitri
δ2 H +5.8 – −1.3 −94 −53 – – – – 153 42
δ 18 O 0.58 −5.45 −3.8 −13.14 −5.18 27 80 3000 842 68 8
Ihotry
δ2 H −5.5 −27.5 −20 −93.9 −25.6 – – – – 357 42
Figure 10. Representation of δT values. Green and orange circles represent, respectively, groundwater of Iro Lake and of Lake Fitri, while
triangles indicate lake water. δI is the water entering the system for Iro Lake surface water and groundwater and for Lake Fitri surface water
only. δP is the weighted annual rainfall at N’Djamena and δT is the transpiration isotopic composition calculated according to Jasechko
et al. (2013). δa represents the minimum and the maximum values of atmospheric isotopic composition and δE indicates the minimum and
the maximum values of evaporated isotopic composition, calculated according to the Craig–Gordon model.
Bahr Salamat river as a representative value of Q and a flow and runoff will be the same between the lake itself and the
rate equal to zero for the endorheic catchments of lakes Fitri soil and stream water of the watershed. We can illustrate the
and Ihotry. The results suggest that transpiration (T ) repre- strong sensitivity of the calculated T /P ratio upon the δL
sents half of the water balance of the catchment in every sce- value: for example, in the case of Iro Lake, if the mean iso-
nario (0.42 < T /P < 0.56). topic composition of the aquifer – rather than that of the lake
However, a closer examination of the weight of the differ- – is taken as a representative value, the T /P ratio increases
ent terms in Eq. (11) stresses the limitations of this method, from 0.42 to 0.77. By comparison, the δT value is a much
as already highlighted by several authors (Schlaepfer et al., less stringent parameter in this case.
2014; Coenders-Gerrits et al., 2014). First, using the lake iso- This problem of representativeness is even more clearly il-
topic composition as a representative value for the entire sur- lustrated in the case of Lake Fitri. We have shown above that
face water of the whole catchment is highly speculative: in- the value of δL, and thus of δE, corresponds to E/I = 0.41.
deed, it is very unlikely that the balance between evaporation Therefore, associating this value of δL with a Q value of
Hydrol. Earth Syst. Sci., 23, 1705–1724, 2019 www.hydrol-earth-syst-sci.net/23/1705/2019/You can also read


