The development of the Atmospheric Measurements by Ultra-Light Spectrometer (AMULSE) greenhouse gas profiling system and application for satellite ...
←
→
Page content transcription
If your browser does not render page correctly, please read the page content below
Atmos. Meas. Tech., 13, 3099–3118, 2020
https://doi.org/10.5194/amt-13-3099-2020
© Author(s) 2020. This work is distributed under
the Creative Commons Attribution 4.0 License.

The development of the Atmospheric Measurements by Ultra-Light
Spectrometer (AMULSE) greenhouse gas profiling system and
application for satellite retrieval validation
Lilian Joly1 , Olivier Coopmann2 , Vincent Guidard2 , Thomas Decarpenterie1 , Nicolas Dumelié1 , Julien Cousin1 ,
Jérémie Burgalat1 , Nicolas Chauvin1 , Grégory Albora1 , Rabih Maamary1 , Zineb Miftah El Khair1 , Diane Tzanos2 ,
Joël Barrié2 , Éric Moulin2 , Patrick Aressy2 , and Anne Belleudy2
1 GSMA,   UMR CNRS 7331, U.F.R. Sciences Exactes et Naturelles, Université de Reims, Reims, France
2 CNRM,   Université de Toulouse, Météo-France, CNRS, Toulouse, France

Correspondence: Lilian Joly (lilian.joly@univ-reims.fr) and Olivier Coopmann (olivier.coopmann@umr-cnrm.fr)

Received: 3 September 2019 – Discussion started: 25 September 2019
Revised: 4 April 2020 – Accepted: 22 April 2020 – Published: 12 June 2020

Abstract. We report in this paper the development of an em-      files from the assimilation of infrared satellite observations.
bedded ultralight spectrometer ( < 3 kg) based on tuneable       The results show that the simulations of infrared satellite ob-
diode laser absorption spectroscopy (with a sampling rate of     servations from IASI (Infrared Atmospheric Sounding Inter-
24 Hz) in the mid-infrared spectral region. This instrument is   ferometer) and CrIS (Cross-track Infrared Sounder) instru-
dedicated to in situ measurements of the vertical profile con-   ments performed in operational mode for numerical weather
centrations of three main greenhouse gases – carbon dioxide      prediction (NWP) by the radiative transfer model (RTM) RT-
(CO2 ), methane (CH4 ) and water vapour (H2 O) – via stan-       TOV (Radiative Transfer for the TIROS Operational Ver-
dard weather and tethered balloons. The plug and play in-        tical Sounder) are of good quality. We also show that the
strument is compact, robust, cost-effective, and autonomous.     MOCAGE (Modèle de Chimie Atmosphérique de Grande
The instrument also has low power consumption and is non-        Echelle) and CAMS (Copernicus Atmospheric Monitoring
intrusive.                                                       Service) CTMs modelled ozone profiles fairly accurately and
   It was first calibrated during an in situ experiment on an    that the CAMS CTM represents the methane in the tropo-
ICOS (Integrated Carbon Observation System) site for sev-        sphere well compared to MOCAGE. Finally, the measured
eral days, then used in two experiments with several balloon     in situ ozone profiles allowed us to show the good quality of
flights of up to 30 km altitude in the Reims region of France    the retrieved ozone profiles by assimilating ozone-sensitive
in 2017–2018 in collaboration with Météo-France CNRM             infrared spectral radiances from the IASI and CrIS.
(Centre National de Recherches Météorologiques).
   This paper shows the valuable interest of the data mea-
sured by the AMULSE (Atmospheric Measurements by
Ultra-Light Spectrometer) instrument during the APOGEE
(Atmospheric Profiles of Greenhouse Gases) measurement
experiment, specifically for the vertical profiles of CO2 and
CH4 , measurements of which remain very sparse. We have
carried out several experiments showing that the measured
profiles have several applications: the validation of simula-
tions of infrared satellite observations, evaluating the qual-
ity of chemical profiles from chemistry transport models
(CTMs) and evaluating the quality of retrieved chemical pro-

Published by Copernicus Publications on behalf of the European Geosciences Union.
3100             L. Joly et al.: Evolution of AMULSE and application with APOGEE experiment for satellite validation

1   Introduction                                                    a radiative transfer model (RTM) during data assimilation,
                                                                    as in many other NWP centres. In order to assimilate the
The climate of the Earth is currently undergoing rapid              satellite sounder observations, the actual observations have
change. During the last few decades, evidence has accumu-           to be compared to the simulation from the model state with a
lated that this climate change is directly related to human ac-     RTM. Simulating infrared satellite observations from a RTM
tivities (IPCC, 2013; IPCC, 2019; Blunden and Arndt, 2019).         requires a priori knowledge of the state of the atmosphere and
The abrupt acceleration of technological progress and the ex-       its chemical composition. The RTTOV uses chemical refer-
plosion of industrial and agricultural activities, as well as the   ence profiles that are constant in time and in space. This ap-
multiplication of the means of transport, have created a pro-       proximation may lead to possible errors in the simulations.
found change in our environment, gradually modifying the            The high quality of simulations is essential since the informa-
chemical composition on the atmosphere at a global level.           tion extracted from these models is then used in data assimi-
In particular, the minority chemical compounds of the atmo-         lation systems for weather forecasting, which is why there is
sphere have a fundamental impact on the regulation of the           a need to assess the quality of chemical profiles with in situ
radiative balance of the planet. Indeed, certain gases have the     measurements.
property of absorbing a part of the terrestrial infrared radia-        In addition to the NWP models, chemistry transport mod-
tion. These gases called greenhouse gases (GHGs) are natu-          els (CTMs) are available. Indeed, air pollution is a pub-
rally present in the atmosphere (water vapour (H2 O), carbon        lic health issue especially in big cities and is responsible
dioxide (CO2 ), methane (CH4 ), nitrogen oxide (NOx ), etc.).       for 790 000 deaths per year just in Europe (Lelieveld et al.,
The energy that they collect is then returned in all directions,    2019). One of the main pollutants in the troposphere is ozone
at the same time not only towards space but also towards the        which increases the death rate during pollution episodes.
surface and the various layers of the atmosphere. It is the nat-    At large scales, the effect of global change continues to be
ural greenhouse effect which makes it possible to have aver-        important due to the increase in GHGs whose main con-
age surface temperatures of approximately 15 ◦ C instead of         tributors are carbon dioxide and methane. A CTM such as
the −18 ◦ C that would be the case with terrestrial radiation       MOCAGE (Modèle de Chimie Atmosphérique de Grande
if the atmosphere were transparent. Any modification of the         Echelle) at Météo-France and C-IFS (Atmospheric Chem-
atmospheric concentration of a GHG induces a modification           istry in the Integrated Forecasting System) of CAMS (Coper-
of the climatic equilibrium. Thus, the atmosphere is certainly      nicus Atmospheric Monitoring Service) at the ECMWF (Eu-
the medium most rapidly affected by the disturbances of the         ropean Centre for Medium-Range Weather Forecasts) al-
equilibrium of the environment, whether natural, as during          lows for the production of high-quality forecast of chem-
major climate cycles, or linked to human activities. The main       istry fields in the stratosphere and upper troposphere but
greenhouse gases related to human activities are CO2 , CH4          forecast quality is weaker in the UTLS (upper troposphere–
and N2 O.                                                           lower stratosphere). However, satellite sounding in the at-
   Satellite observations have brought information of thermo-       mospheric boundary layer is more difficult, especially for
dynamic structure and atmospheric composition using hy-             infrared sensors because of cloud and aerosols that inter-
perspectral infrared sounders such as the IASI (Infrared At-        fere with the signal; land surface emissivity and tempera-
mospheric Sounding Interferometer), CrIS (Cross-track In-           ture uncertainties also are part of the problem. The data as-
frared Sounder) or AIRS (Atmospheric Infrared Sounder). It          similation of satellite observations sensitive to atmospheric
is important to assess the quality of the atmospheric infor-        composition allows for an accurate chemical description of
mation provided by these instruments. Thus, several works           the atmosphere, especially in the UTLS, to be obtained.
have been carried out in order to validate the atmospheric          Presently, C-IFS assimilates Level 2 products from several
profile retrievals (temperature, humidity, trace gases, etc.)       satellite instruments. To assess the quality of the CTM fore-
from infrared satellite observations. Examples include those        casts of chemical fields, we need to have accurate measure-
for IASI (Hilton et al., 2012), CrIS (Nalli et al., 2017a, b)       ments of these compounds in the atmospheric column. De-
or AIRS (Susskind et al., 2003; Chahine et al., 2005) or            spite many chemistry measurements at ground stations, in-
the work of Liang et al. (2017) that evaluated XCO2 satel-          formation on chemistry is not widely available at high al-
lite retrievals obtained from the Greenhouse Gases Observ-          titudes. To overcome this lack of data, many projects have
ing Satellite (GOSAT) and Orbiting Carbon Observatory-2             been started such as the APOGEE (Atmospheric Profiles of
(OCO-2) instruments by comparison with total carbon diox-           Greenhouse Gases) experiment. The APOGEE experiment is
ide column observations measured by the international Total         derived from a collaboration between the GSMA (Groupe de
Carbon Column Observing Network (TCCON).                            Spectrométrie Moléculaire et Atmosphérique) at Reims Uni-
   These observations are crucial to the study of, understand-      versity in France, LSCE (Laboratoire des Sciences du Cli-
ing of and follow-up work on atmospheric compounds to               mat et de l’Environnement) in France and CNRM (Centre
monitor greenhouse gases. Météo-France operational numer-           National de Recherches Météorologiques) at Météo-France.
ical weather prediction (NWP) systems use RTTOV (Radia-             The objective of the APOGEE experiment is to realize mea-
tive Transfer for the TIROS Operational Vertical Sounder) as        surements of pressure, temperature, humidity and the main

Atmos. Meas. Tech., 13, 3099–3118, 2020                                              https://doi.org/10.5194/amt-13-3099-2020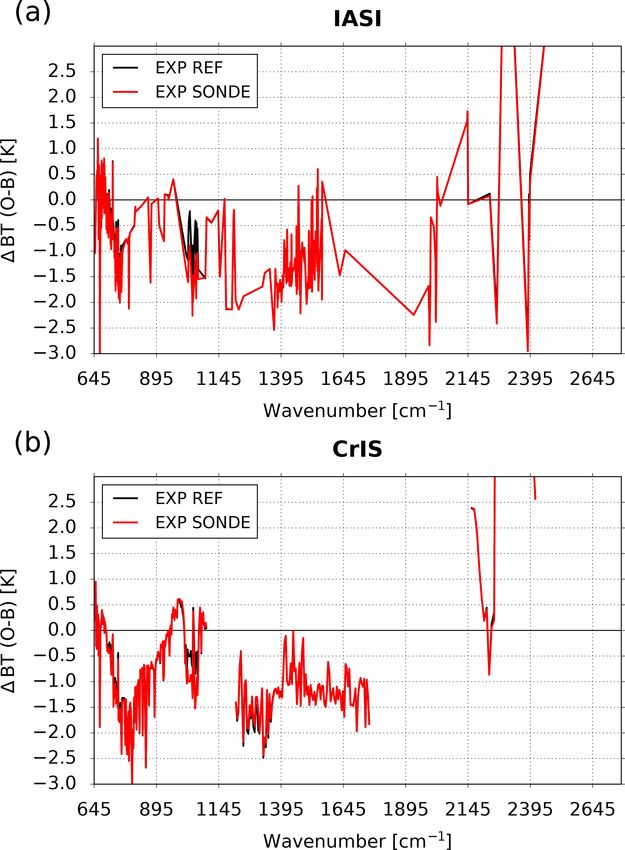
L. Joly et al.: Evolution of AMULSE and application with APOGEE experiment for satellite validation                          3101

atmospheric chemical vertical profiles (CO2 , CH4 , O3 and        2.2   GHG atmospheric observations
H2 O) at heights of up to 30 km including the atmospheric
boundary layer. Ozone profile is measured using Vaisala in        The goal of atmospheric observations of GHGs is to follow
situ soundings with electrochemical cells. CO2 , CH4 and          the evolution of these gases. According to the IPCC (Inter-
H2 O are measured using the AMULSE (Atmospheric Mea-              governmental Panel on Climate Change), this is necessary
surement Ultralight Spectrometer) instrument developed by         to be able to determine both the long-term trend related to
the GSMA.                                                         global emissions, a seasonal cycle linked to vegetation ac-
   In Sect. 2, we will identify some ways to measure the          tivity or the availability of OH, and a synoptic variability
chemical composition of the atmosphere. Then in Sect. 3, we       linked to the transport of air masses over periods of time
will describe the different characteristics of the AMULSE         from a few hours to a few days. Typically, in 1 year, the
instrument as well as make comparisons with another instru-       air of the Northern Hemisphere is mixed with that of the
ment. Finally, we will use the data from the APOGEE mea-          Southern Hemisphere and vice versa. At mid-latitudes in the
surement experiment on one study case to evaluate the sen-        Northern Hemisphere, emissions are transported around the
sitivity of infrared observation simulations to CO2 , CH4 and     Earth in a few days by a zonal circulation of air masses that
O3 information and we will use the in situ profiles to evaluate   is much more efficient than mixing at latitudes. By nature,
a priori profiles from the CTMs and retrieval profiles by 1D      in situ measurements, therefore, require continuous and di-
assimilation experiments.                                         versified observation means on a global scale: ground mea-
                                                                  surements (Integrated Carbon Observation System (ICOS),
                                                                  World Meteorological Organization (WMO), etc.), airborne
                                                                  measurements (Cammas et al., 2008; Filges et al., 2015;
2     Atmospheric composition measurements
                                                                  Nédélec et al., 2015; Petzold et al., 2015), satellite observa-
                                                                  tions (Crevoisier et al., 2013; Thompson et al., 2012; Wecht
2.1    Molecules of interest
                                                                  et al., 2014) and vertical measurements using balloons (Ghy-
                                                                  sels et al., 2016). Tethered balloons measurements can be
CO2 and CH4 are long-lived gases. Atmospheric residence
                                                                  used at up to 800 m altitude, and they are cheap and allowed
time is a few decades for CH4 , whose reactivity makes it
                                                                  in France. They do not require a lot of preparation and lo-
an important player in atmospheric chemistry (Voulgarakis
                                                                  gistics, and they offer controlled travelling speed as well as
et al., 2013), and a few hundred to thousands of years for
                                                                  fixed-point measurements along with good payload options.
CO2 which is inert in the atmosphere from a chemical point
                                                                  On the other hand, a weather balloon offers high-altitude
of view (Archer and Brovkin, 2008; Eby et al., 2009). The
                                                                  measurements (up to 30 km) but fixed-point measurements
increase in these gases in the atmosphere is conditioned by
                                                                  cannot be realized. In our previous papers (Joly et al., 2016;
anthropogenic emissions of them which add up to an ac-
                                                                  Khair et al., 2017) we discussed the advantages and disad-
tive natural cycle. The CO2 cycle is the carbon cycle as this
                                                                  vantages of the different ground and airborne measurement
gas dominates the atmospheric composition of carbon com-
                                                                  techniques as well as the need for observations on the verti-
pounds in terms of mass (nearly 215 times higher than that of
                                                                  cal plane along the atmospheric column in order to complete
methane). However, the effectiveness of CH4 in absorbing in-
                                                                  spatial measurements. To complement the current observa-
frared radiation is much greater than that of carbon dioxide.
                                                                  tional system, stratospheric balloons are unique scientific re-
Since the beginning of the industrial era in 1750 till Octo-
                                                                  search tools for accessing the stratosphere, an area inaccessi-
ber 2016, the mixing ratio of atmospheric CO2 has increased
                                                                  ble to airborne measurement methods. The information pro-
from around 280 to 401 ppm, an increase of more than 40 %.
                                                                  vided by the satellites is an integrated average over all or
The increases in the CO2 and CH4 levels along with the un-
                                                                  part of the atmospheric column with the exception of a few
certainty in H2 O levels at high altitudes upset the radiative
                                                                  measurements taken at the limb which provide information
balance of the planet. Therefore, having information and data
                                                                  with a low vertical resolution. The balloons’ ability to access
about the vertical distribution of these three GHGs is very
                                                                  the profiles makes them an ideal tool to explore the distri-
useful for improving our knowledge of the future of our cli-
                                                                  bution of many atmospheric parameters between the surface
mate. Hence, we should improve the knowledge and estima-
                                                                  and 40 km of altitude in a strategic zone where the masses
tion of the regional anthropogenic GHG natural sinks and
                                                                  of air mix a large number of particles and chemical com-
emission sources for better quantification by
                                                                  pounds emitted from the Earth. We report in this paper the
                                                                  development of a lightweight instrument called AMULSE
    1. enhancing the atmospheric chemistry–transport models
                                                                  (for Atmospheric Measurements by Ultra-Light Spectrome-
       that are used to link the sources and the sinks to the
                                                                  ter) that fulfils the requirements for weather balloon flights to
       atmospheric concentrations and
                                                                  increase atmospheric GHG measurements. This instrument
                                                                  was first tested at ground level during an intercomparison
    2. increasing atmospheric observations and measure-           with the Picarro instrument of the LSCE laboratory in Paris,
       ments.                                                     member of the ICOS network. It was then deployed for in

https://doi.org/10.5194/amt-13-3099-2020                                            Atmos. Meas. Tech., 13, 3099–3118, 2020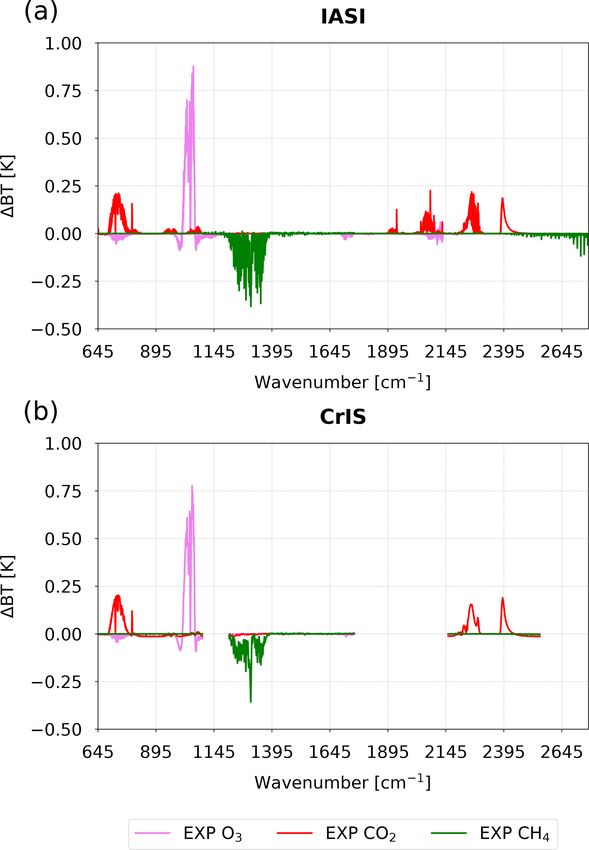
3102               L. Joly et al.: Evolution of AMULSE and application with APOGEE experiment for satellite validation

situ measurements on tethered balloons and on a weather             Table 1. Evolution between 2015 (with two single-gas versions for
balloon up to the stratosphere at about a 30 km altitude for        CO2 and CH4 ) and 2018 of AMULSE sensitivities with respect to
CO2 and CH4 while we simultaneously measured the H2 O               years and measurable molecular species. It highlights an increas-
up to a 10 km altitude in order to calculate the mixing ratios      ing improvement in the performance of the instrument. It shows the
in the dry air column. High-precision measurements and a            standard deviation over a 1 s integration period.
vertical resolution of 5–7 m for in situ concentration profiles
is achieved by using the diode laser spectroscopic technique                             2015        2017       2018
(Durry and Megie, 1999a; Joly et al., 2007, 2016) combined                       CH4     97 ppb      14 ppb     2.7 ppb
with a weather balloon and tethered balloons. The developed                      CO2     1.4 ppm     2.6 ppm    0.5 ppm
optical sensor is then based on mid-infrared absorption spec-                    H2 O                50 ppm     18 ppm
troscopy which provides a compact, cost-effective, fully au-
tonomous, low-power-consuming and non-intrusive probe to
measure the targeted gases in the atmosphere using an open-         (4992.94 cm−1 ) molecules simultaneously in the same scan-
path multipass cell.                                                ning window. The second laser is an interband cascade laser
                                                                    (ICL) DFB diode emitting at 3.24 µm detailed by El Khair
                                                                    et al. (2017) used to target the CH4 molecules (R(6) transi-
3     AMULSE
                                                                    tion at 3085.86 cm−1 ). The lasers’ driving current is ramped
In recent years, the AMULSE instrument has evolved in               at 24 Hz (42 ms), ensuring a good spatial resolution (1–20 m)
order to offer a single-gas CO2 version in 2014, a single-          depending on the ascent and descent flight speed. After col-
gas CH4 version in 2015, a dual-gases version in 2016               limation, the laser beams then pass into a homemade open-
(CO2 −CH4 ) and a tri-gas version (CO2 −CH4 −H2 O) in               path Herriott multipass cell achieving an optical path length
2017, still weighing less than 3 kg. We are also working to         of 16 m on the CO2 −−H2 O channel and 18 m on the CH4
improve the accuracy and robustness of the instrument.              channel. The mirrors are heated in order to avoid the conden-
                                                                    sation on their surfaces using 2 W heaters.
3.1    Principle                                                       At the output of the cell, both laser beams are focalized
                                                                    onto the two photodetectors (purchased from Teledyne Jud-
The high selectivity and sensitivity in the gases detection re-     son Technologies, Montgomeryville, PA, USA). The cen-
alized using the diode laser absorption spectroscopy is con-        tral processing unit (National Instruments real-time module)
sidered as the most advantageous technique for measuring            records all data (spectra, pressure, temperature and humid-
atmospheric gas concentrations (Durry and Megie, 1999b).            ity (PTU) and GPS from the on-board meteorological in situ
It is based on semiconductor diode lasers because they of-          sounding). The spectrometer weighs less than 3 kg in a flight-
fer a continuous-mode emission, are tuneable and have a rel-        ready condition, and power supplies ensure about 6 h of oper-
atively low noise amplitude. The diodes used in this work           ation. When operated under weather balloons, the spectrom-
emit in the near-infrared spectral region (NIR) where most          eter is equipped with a satellite communication system based
atmospheric pollutant molecules feature suitable absorption         on an iridium element. The iridium module sends various
lines. Direct absorption spectroscopy is the simplest applica-      data such as meteorological parameters and GPS localization
tion of this technique, and it is well adapted to in situ mea-      as well as monitoring parameters of the instrument during the
surements. It requires that the tuneable laser beam with an         flights. Under a tethered balloon, a Wi-Fi module replaces the
intensity of I0 passes through the gas sample on a distance L       iridium, allowing us to send to a ground station the recorded
and is then measured using a detector. When the frequency           spectra in order to achieve nearly real-time data processing
of the emitted light is close to a molecular transition ν0 of the   and hence determine the position and the concentration of
gaseous sample, the light is then absorbed and the transmit-        the plume.
ted intensity I (ν) decreases. The concentration of the absorb-
ing species in the gas mixture is then calculated according to      3.3   AMULSE compared to Picarro (2015–2018)
Beer’s law.
                                                                    Each time AMULSE evolved, we made different compar-
3.2    Technical description                                        isons with measurements from an ICOS site in order to char-
                                                                    acterize the impact of instrumental modifications. The table
The architecture of AMULSE is similar to that used in our           shows the improvement in sensitivity between 2015 and 2018
previous papers (Joly et al., 2016; El Khair et al., 2017).         (Table 1). This improvement comes from the optimization of
This new version is equipped with two lasers (purchased             the optical cell, electronics and spectroscopy.
from nanoplus GmbH, Gerbrunn, Germany). The first one                  In order to better understand the values in this table, we
is a GaSb-based distributed feedback (DFB) semiconductor            will describe the last comparison measurement experiment
diode emitting at 2.004 µm. A simple change on its scanning         that was achieved in February 2018. It took place at the LSCE
ramp allows us to target the CO2 (4992.51 cm−1 ) and H2 O           on their ICOS site where a Picarro instrument (model G1301;

Atmos. Meas. Tech., 13, 3099–3118, 2020                                               https://doi.org/10.5194/amt-13-3099-2020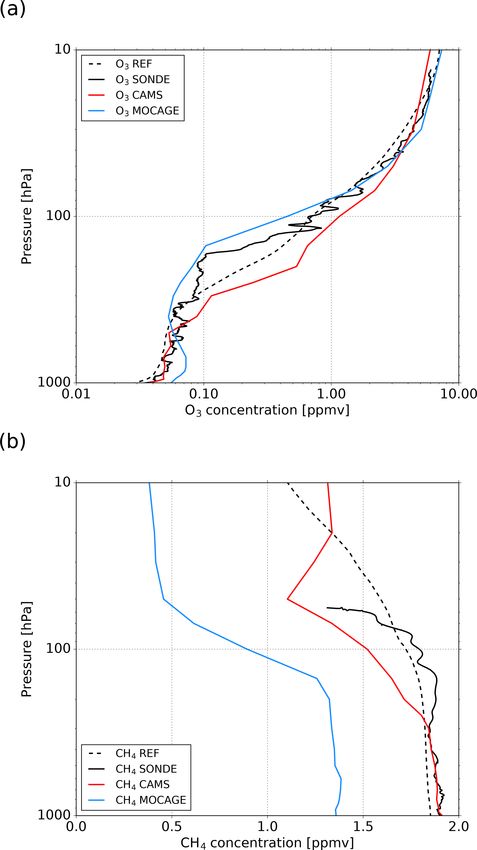
L. Joly et al.: Evolution of AMULSE and application with APOGEE experiment for satellite validation                         3103

Figure 1. Intercomparison between AMULSE’s concentration (in black) and Picarro’s concentration calibrated with WMO gases (in red)
over 9 h for CO2 , CH4 and H2 O. Grey areas correspond to the zoomed-in views. Time is in UTC.

Picarro, Inc.; Santa Clara, CA, USA) is installed. All Pi-         4     Atmospheric applications
carro concentrations are calibrated (every 6 h) with a WMO
(World Meteorological Organization) standard gas. The anal-        Once the validation of the instrument was realized with the
yser pulled air continuously at a few centimetres from the         help of the Picarro instrument, several atmospheric measure-
AMULSE for just over 3 continuous days. Figure 1 shows             ment experiments were carried out.
the intercomparison between the two instruments with the
Picarro data plotted in green and the AMULSE data in blue.         4.1    Tethered balloon application (2017)
Insets (a), (b) and (c) in Fig. 1 correspond to a zoom-in fo-
                                                                   Tethered balloons offer great opportunities to characterize
cus on 10 min. The results show a good correlation between
                                                                   the temporal atmospheric evolution of the three measured
the two instruments for the three measured species. The aver-
                                                                   species up to an 800 m altitude. In such applications we can
age absolute difference between the two instruments is equal
                                                                   control the motion speed of the balloon, have a bigger pay-
to 0.01 ppm with a standard deviation of 0.5 ppm (0.2 %) for
                                                                   load (which depends on the type of the balloon used) and
the CO2 channel, 0.1 ppb with a standard deviation of 2.7 ppb
                                                                   we can even acquire data from a fixed stationary point. A
(0.2 %) for the CH4 channel and 2 ppm with a standard devi-
                                                                   tethered balloon is a carrier that allows measurements to be
ation of 18 ppm (0.05 %) for the H2 O channel.
                                                                   made at heights between fixed-tower and under-aircraft mea-
                                                                   surements. The costs of a tethered balloon are much lower
                                                                   than the installations mentioned above.
                                                                      An experiment was conducted to monitor the evolution
                                                                   of the atmospheric boundary layer early in the morning at

https://doi.org/10.5194/amt-13-3099-2020                                             Atmos. Meas. Tech., 13, 3099–3118, 2020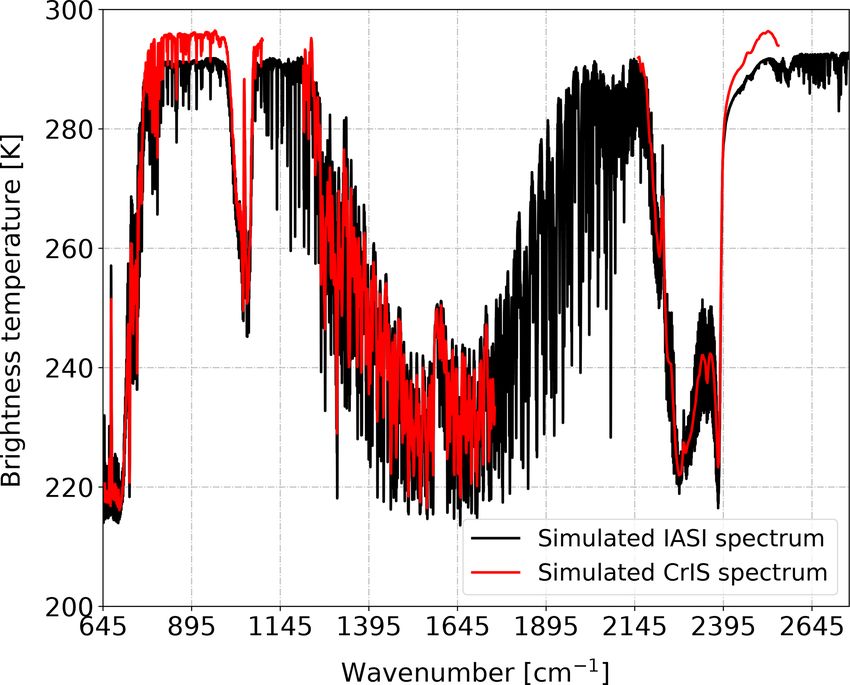
3104              L. Joly et al.: Evolution of AMULSE and application with APOGEE experiment for satellite validation

Figure 2. Atmospheric boundary layer evolution. Here is an example of the results of the AMULSE measurements under a tethered balloon;
it allows us to measure simultaneously, as a function of time and altitude, the concentration of CO2 (a), CH4 (b), H2 O (c) and temperature (d).

sunrise. We carried out 21 ascents and descents (up to 50 m               CNRM–Météo France meteorological models. In addition,
above sea level). The time of an ascent is about 6 min, which             the combination of all these measures offers an opportu-
results in a vertical resolution of between 20 and 50 cm.                 nity to analyse physicochemical processes that have not yet
   These results were first interpolated over all the heights             been studied in the stratosphere and the interface between the
so that we visualized the spatio-temporal evolution of the                troposphere and the stratosphere, commonly known as the
boundary layer that morning (Fig. 2). The evolution of con-               UTLS (upper troposphere–lower stratosphere). To achieve
centrations and temperature is consistent with what has pre-              these objectives, we carried out measurements from the site
viously been observed by Reid and Steyn (1997). AMULSE                    of our laboratory using meteorological balloons for the mea-
simultaneously records the concentration of CO2 (a), CH4                  surements of CO2 , CH4 , H2 O, O3 , P , T and relative humid-
(b), H2 O (c) and temperature (d).                                        ity in co-location with Metop-A, Metop-B and Suomi NPP.
   This illustrates the interest of this instrument on board a               To measure all these parameters, the instruments used
tethered balloon, as it allows the study of CO2 , CH4 and H2 O            were as follows:
in the boundary layer.
                                                                             – Vaisala RS92-SGP in situ soundings (pressure, temper-
4.2     APOGEE experiment (2017–2018)                                          ature, relative humidity and GPS location measurement
                                                                               every second with a real-time transmission);
4.2.1    Objectives

One of the goals of AMULSE is to carry out weather bal-                      – electrochemical concentration cell (ECC) ozonesondes
loon measurements in co-location with the IASI satellite in                    from Science Pump Corporation, models 5A and 6A,
orbit around the Earth, developed jointly by CNES (Cen-                        with Vaisala RS-92 interfacing (ozone concentration
tre national d’études spatiales) and EUMETSAT (European                        measurement every second with a real-time transmis-
Organisation for the Exploitation of Meteorological Satel-                     sion);
lites). The measurements made by the AMULSE instrument
will provide comparative data that can be used to validate                   – the AMULSE instrument presented above.

Atmos. Meas. Tech., 13, 3099–3118, 2020                                                      https://doi.org/10.5194/amt-13-3099-2020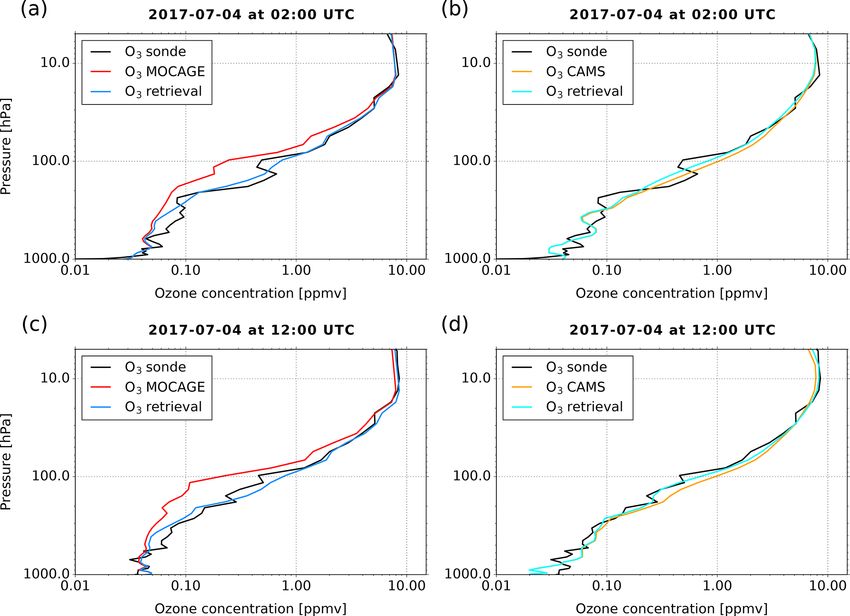
L. Joly et al.: Evolution of AMULSE and application with APOGEE experiment for satellite validation                                       3105

Figure 3. A schematic diagram of the flight chain during (a) ascent and (b) descent. Transmission and reception of the information during the
flight is performed using both satellite and radio communications. A Vaisala RS92 in situ sounding system is connected, which measures and
transmits instantaneous P , T , relative humidity and GPS data to a ground mobile station to inject those data in the trajectory model and hence
ensure the tracking and recovery of the instrument. Note that the trigger release system can be controlled by either a homemade smartphone
application or a web application using an iridium satellite communication system. These applications can also track the AMULSE position
as the AMULSE instrument transmits its GPS position, pressure and temperature data every 5 min ensuring a redundant retrieval system.

4.2.2   Description of the flight chain                                   numerical weather prediction models: the mesoscale model
                                                                          AROME (Applications de la Recherche à l’Opérationnel à
The flight chain is composed of a carrier balloon, a parachute            Méso-Echelle; Seity et al., 2011; Brousseau et al., 2016)
and the payload (AMULSE and in situ sounding; Fig. 3a).                   and the global model ARPEGE (Action de Recherche Petite
The balloon is inflated using a tare to ensure good repeatabil-           Echelle Grande Echelle; Courtier and Geleyn, 1988; Déqué
ity of ascent speed. A wire is connected to both the parachute            et al., 1994). Hypotheses are made about both the ascending
and the AMULSE release system; the carrier balloon is                     and the descending speed of the system and the release of the
hooked up to the wire using a sliding ring. The balloon is                carrier balloon in order to run a first simulation. A measured
released when the wire is cut, and it can be triggered either             vertical profile of horizontal winds by the recent sounding
at a specific atmospheric pressure (fixed before the launch)              can also be used. The trajectories of the balloon are updated
or via a satellite communication system based on an iridium               in real time by the rawinsonde RS92-measured wind. As the
modem embedded onto the AMULSE electronic board or at                     trajectories are adjusted in real time and the AMULSE re-
a specific timeout fixed in advance. When the carrier bal-                lease system can be remotely triggered, the landing area can
loon is released, the wire slides out of the ring and the in-             be optimized in order to maximize the safety of landings.
strumentation descends with the parachute at a speed lower
than 5 m s−1 (Fig. 3b). A meteorological in situ sounding                 4.2.3    Performed flights
with a GPS probe fixed on the instrumentation and con-
nected to a ground station allows the determination of the                The measurement experiment was held in France in the
landing site which helps recovery of the instrumentation.                 Champagne-Ardenne region. The launching site was lo-
Flight simulation software is used to estimate the trajectories           cated at the Campus Moulin de la Housse, in Reims
and the landing point of the probe. This estimation is based              (49◦ 140 29.60800 N, 4◦ 40 4.70900 E). The flights took place over
on the wind forecasts from both Météo-France operational                  the period from November 2017 to April 2018 (Table 2) and

https://doi.org/10.5194/amt-13-3099-2020                                                      Atmos. Meas. Tech., 13, 3099–3118, 2020
3106             L. Joly et al.: Evolution of AMULSE and application with APOGEE experiment for satellite validation

Table 2. List of flights between November 2017 and April 2018.   5.1     Sensitivity of infrared satellite sensors to CO2 , CH4
                                                                         and O3 information
       Flight   Date                     Max altitude (m)
       1        07/11/2017 13:48 UTC          19 121             5.1.1    IASI and CrIS sensors
       2        08/11/2017 11:50 UTC          25 460
       3        15/11/2017 12:02 UTC          31 156             IASI is flying on board three European polar-orbiting satel-
       4        15/11/2017 12:09 UTC          31 388             lites, Metop-A, Metop-B and Metop-C launched in 2006,
       5        15/11/2017 12:06 UTC          31 110
                                                                 2012 and 2018, respectively. The IASI spectrum covers the
       6        13/04/2018 12:06 UTC          29 490
                                                                 range between 645 and 2760 cm−1 , with a spectral sam-
       7        17/04/2018 10:15 UTC          25 000
       8        17/04/2018 20:12 UTC          19 660             pling of 0.25 cm−1 and spectral resolution of 0.5 cm−1 af-
                                                                 ter apodization. CrIS is part of the payload of the US polar-
                                                                 orbiting satellites Suomi NPP and NOAA-20 launched in
                                                                 2011 and 2017, respectively. Only the so-called CrIS nor-
were carried out either by day or at night. Several launches     mal spectral resolution data are used in this study, leaving
could be carried out at the same time (Fig. 4).                  the CrIS spectrum divided into three parts: between 650 and
   Figure 5 shows examples of vertical concentration profiles    1095 cm−1 with a spectral resolution of 0.625 cm−1 , between
of CO2 , CH4 and H2 O obtained from the flights, and we          1210 and 1750−1 (1.25 cm−1 spectral resolution), and be-
added temperature for the identification of the tropopause.      tween 2155 and 2550 cm−1 (2.5 cm−1 spectral resolution).
The concentration of CO2 on the ground can vary greatly,
depending on the time of measurement, because the bound-
ary layer is enriched with CO2 when flying close to night-       5.1.2    Radiative transfer model
time (plant respiration; see Schmidt et al., 2014). Concern-
ing CH4 , we see that there is a slight difference but the de-   During the assimilation process within the NWP analysis
crease always occurs at the tropopause level. Its decrease is    step, a compromise is found between a priori knowledge
due to its oxidation with the OH radical. For water measure-     of the atmospheric state (a short-range forecast, in gen-
ments, we are currently using the iMet-1 in situ sounding.       eral) and various observations, including radiosoundings, air-
The measurements are consistent below a 10 km altitude, but      craft measurements, ground stations, and space-borne pas-
above this altitude we consider that the measurements are        sive sounders both in the microwave and in the infrared.
biased. For this reason, one of the goals for the year 2020      When assimilating satellite radiances, e.g. infrared radiances,
is to make water vapour measurements by laser diode spec-        a radiative transfer model is needed in several ways. Firstly,
trometry more accurate in the stratosphere. It should also be    the observations have to be compared to the prior atmo-
taken into account that we generally see an increase in wa-      spheric state: simulations of radiances are made using the
ter vapour concentration above 10 km; this is due to the de-     temperature and humidity profiles and surface parameters
gassing of water from the instrument and the balloon during      from that state. The differences between observations and
the ascent. For this reason, water measurements in the strato-   simulations are called innovations or first-guess departures.
sphere are only possible during descents.                        Then, the information contained in the first-guess departures
                                                                 is used to modify the atmospheric state so that the analysed
                                                                 atmospheric state is a compromise between all sources of
5   Use of data from the APOGEE measurement                      information. To achieve this inverse problem, the RTM has
    experiment                                                   to either have tangent linear and adjoint codes or compute
                                                                 the Jacobians (the Jacobians of IASI channels are described
The data produced during the APOGEE measurement ex-
                                                                 in Sect. 5.1.3). At Météo-France, the RTM used in the op-
periment have different applications. Initially, they were
                                                                 erational assimilation software is the fast radiative transfer
used as satellite validation data for the IASI and CrIS in-
                                                                 model RTTOV (Saunders et al., 2018) developed and main-
frared sounders. They were then used to evaluate the qual-
                                                                 tained by the NWP SAF (Satellite Application Facility) of
ity of vertical ozone and methane profiles extracted from the
                                                                 EUMETSAT (European Organisation for the Exploitation of
MOCAGE and CAMS chemistry transport models. Finally,
                                                                 Meteorological Satellites).
they were used as verification data to compare the ozone
                                                                    For infrared sensor simulation, RTTOV requires not only
profiles returned in one-dimensional variational assimilation
                                                                 temperature and humidity profiles but also a knowledge of
experiments (1D-Var) with the a priori ozone profiles from
                                                                 the atmospheric composition. As few NWP models have in-
MOCAGE and CAMS.
                                                                 line atmospheric composition yet or are coupled to a CTM,
                                                                 RTTOV also provides the users with average chemical pro-
                                                                 files that are invariant in time and space, hereafter referenced
                                                                 to as REF profiles. These REF profiles are plotted in Fig. 7
                                                                 for O3 (a), CO2 (b) and CH4 (c). In this study, we use RT-

Atmos. Meas. Tech., 13, 3099–3118, 2020                                            https://doi.org/10.5194/amt-13-3099-2020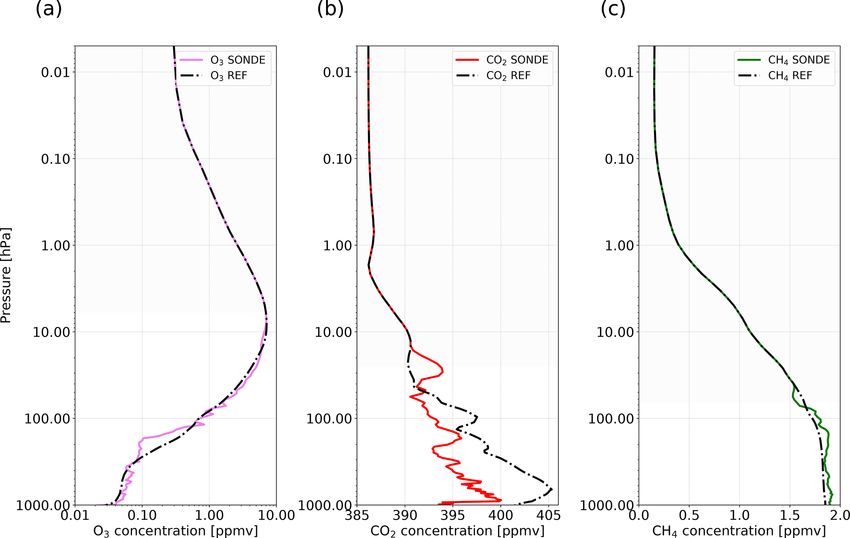
L. Joly et al.: Evolution of AMULSE and application with APOGEE experiment for satellite validation 3107
Figure 4. Launching site (a) in the day and (b) at night, ready for multiple launches.
Figure 5. Balloon measurement: CO2 , CH4 , H2 O and temperature vertical concentration profiles between November 2017 and April 2018.
TOV version 12, with coefficients for IASI and CrIS on 101 parameters, RTTOV offers the possibility of calculating the
fixed-pressure levels. Jacobians which represent the sensitivity of the brightness
temperature to the variation in a thermodynamic or chemical
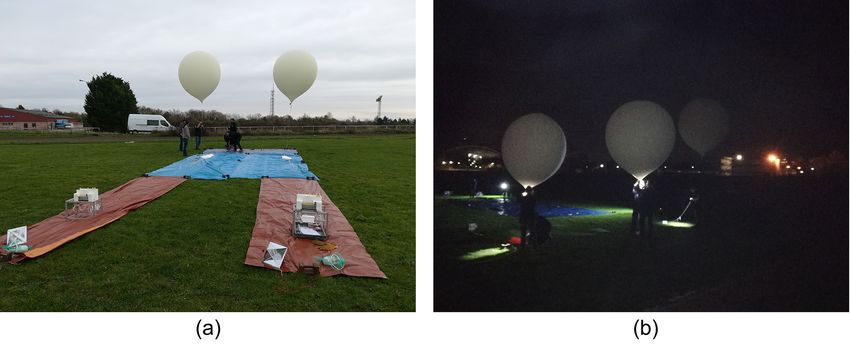
5.1.3 Theoretical sensitivity of IASI and CrIS spectra parameter. Thus we have represented in Fig. 6 the Jacobians
to GHG in temperature (a), humidity (b), skin temperature (c), ozone
(d), carbon dioxide (e) and methane (f) for the 8461 IASI
Infrared satellite observations measured by IASI and CrIS channels using the reference chemical profiles for our case
instruments are sensitive to not only atmospheric tempera- study according to the 101 RTM levels. It should be noted
ture and humidity and skin temperature but also atmospheric that temperature Jacobians are sensitive over a large part of
chemistry. To identify the channels sensitive to the different the spectrum but at different altitudes. Indeed, channels from
https://doi.org/10.5194/amt-13-3099-2020 Atmos. Meas. Tech., 13, 3099–3118, 2020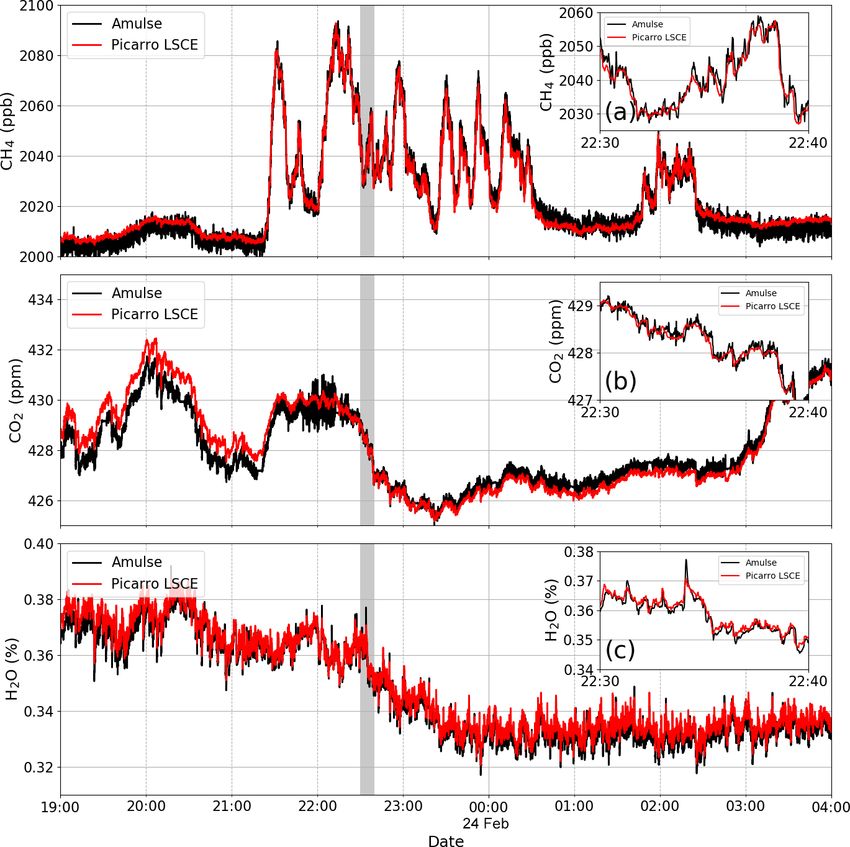
3108             L. Joly et al.: Evolution of AMULSE and application with APOGEE experiment for satellite validation

650 to 770 cm−1 describe a temperature sensitivity from the       red with respect to the wavenumber using as RTTOV input
top of the stratosphere to the surface. There is also high sen-   the reference profiles of O3 , CO2 and CH4 for the in situ
sitivity near the surface to window channels from 790 to 980      sounding from 17 April 2018 at 10:00 UTC. There is a good
and 1080 to 1150 cm−1 . There is a sensitivity over the en-       agreement between the simulated IASI and CrIS spectrum
tire atmosphere for channels from 1000 to 1070 cm−1 . Then,       except for the window channels. The difference seen between
temperature Jacobians are sensitive in the troposphere from       the simulated IASI and CrIS window channels is due to the
1210 to 1650 cm−1 . Humidity Jacobians are surface sensi-         temporal and spatial differences between the selected pixels,
tive for channels from 650 to 770 and 1080 to 1150 cm−1           which implies a different skin temperature used in RTTOV.
and in the troposphere from 650 to 1150 cm−1 . Jacobians          However, the skin temperature has an obvious impact on the
of skin temperature have essentially high values for window       simulation of infrared observations sensitive to the surface,
channels from 790 to 980 and 1080 to 1150 cm−1 . Ozone            hence these differences.
Jacobians are slightly sensitive from 650 to 770 cm−1 and
have a sensitivity over the entire atmosphere from 1000 to        5.1.5   Impacts on simulations
1070 cm−1 . We note that carbon dioxide Jacobians have high
values over the entire atmospheric column for channels from       We evaluated the impact on the simulations of IASI and
650 to 770 cm−1 . Finally, methane Jacobians have high sen-       CrIS observations of using chemical information from in
sitivities for channels from 1210 to 1650 cm−1 .                  situ measurements as input to RTTOV in replacement of
                                                                  the constant profiles. Figure 9 shows the difference between
5.1.4   Preprocessing of APOGEE measurements                      simulated brightness temperature (BTS ) with O3 in purple
                                                                  (CO2 in red and CH4 in green) in situ measurement profiles
We selected the sounding from 17 April 2018 at 10:00 UTC          (XM ) and simulated brightness temperature with O3 (CO2
for which ozone, carbon dioxide and methane are measured.         and CH4 ) reference profiles (X R ) for in situ sounding from
The profiles are plotted in Fig. 7. The ozone profile is avail-   17 April 2018 at 10:00 UTC for all channels contained in
able up to 6 hPa, the carbon dioxide up to 25 hPa and the         the IASI (a) and CrIS (b) spectrum, where EXP means ex-
methane up to 65 hPa. There are few differences between the       periment (for example, EXPO3 means experiment for ozone
reference and in situ profiles for ozone and methane, except      case, etc.), such that
around the tropopause., unlike for carbon dioxide, where the
difference can be as much as 10 ppmv in the lower tropo-          EXPO3 = BTS [O3 M + CO2 R + CH4 R ]
sphere.                                                                    − BTS [O3 R + CO2 R + CH4 R ],
   In order to assess the impact of using the in situ chemical
information instead of the reference profiles, we have inter-     EXPCO2 = BTS [O3 R + CO2 M + CH4 R ]
polated the in situ profiles on the 101 fixed-pressure levels               − BTS [O3 R + CO2 R + CH4 R ],
by making layer averages cantered on these levels. Moreover,
                                                                  EXPCH4 = BTS [O3 R + CO2 R + CH4 M ]
the measured profiles do not reach the highest fixed-pressure
level. Thus a polynomial function was used to link the in situ              − BTS [O3 R + CO2 R + CH4 R ].
profiles to the reference profiles from the levels where the
data are missing.                                                    The differences in BT affect ozone-sensitive channels lo-
   Then, modelled atmospheric profiles of temperature, hu-        cated from 710 to 760, 980 to 1150 and 2060 to 2135 cm−1
midity, surface temperature, surface humidity, surface pres-      (for IASI). Then, the differences in BT affect a larger part
sure, and zonal and meridian wind come from the global            of the spectrum especially the CO2 -sensitive channels with
model ARPEGE forecasts (every 3 h), which have been ex-           spectral intervals from 645 to 820, 930 to 980, 1030 to 1085,
tracted for the same period and location as for the in situ       1900 to 1940 (for IASI), 2010 to 2120 (for IASI) and 2200
sounding. The coefficient file used during the simulation pro-    to 2440 cm−1 . Finally, the differences in BT affect CH4 -
cess in RTTOV being on 101 fixed-pressure levels, the ther-       sensitive channels located from 1200 to 1380 cm−1 and less
modynamic profiles of ARPEGE were interpolated on these           so from 2650 to 2760 cm−1 .
same levels.                                                         The maximum difference values of BT for CO2 -sensitive
   In this study we simulated satellite observations from two     channels are around 0.2 K and for CH4 -sensitive channels
types of infrared instruments: IASI and CrIS. In order to         around −0.4 K for both instruments. The maximum differ-
evaluate the quality of our simulations, we sought to spa-        ence values of BT for ozone-sensitive channels are around
tially and temporally co-locate the IASI (Metop-B) and CrIS       0.9 K for IASI and 0.75 K for CrIS. The differences in 1BT
(Suomi NPP) pixels as close as possible to the in situ sound-     values between the two instruments can be explained by the
ings. To avoid problems related to clouds, we carried out the     difference in spectral resolution.
17 April 2018 release at 10:00 UTC in clear-sky conditions.          Even if the reference profile is close to the in situ profile, as
Thus, Fig. 8 represents the brightness temperature spectrum       for example for ozone, this does not necessarily imply small
of the IASI observations simulations in black and CrIS in         differences between the simulations.

Atmos. Meas. Tech., 13, 3099–3118, 2020                                             https://doi.org/10.5194/amt-13-3099-2020
L. Joly et al.: Evolution of AMULSE and application with APOGEE experiment for satellite validation 3109
Figure 6. Jacobians of temperature (a), humidity (b), skin temperature (c), ozone (d), carbon dioxide (e) and methane (f) for 8461 IASI
channels w.r.t. 101 RTM levels.
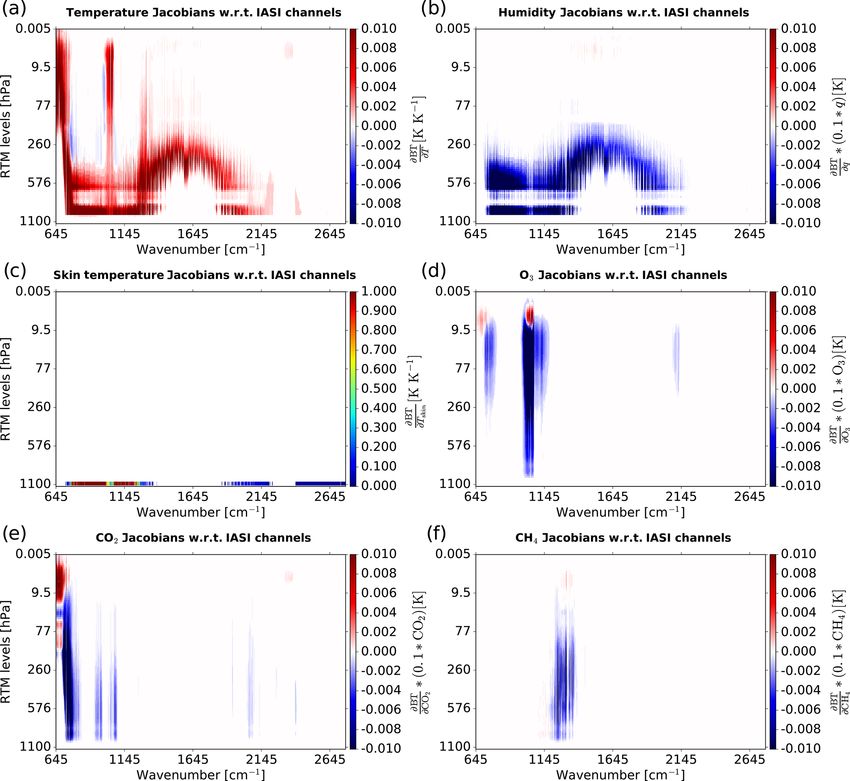
However, the spatial and temporal variability in atmo- For this case study the differences (O–B) using reference
spheric composition is very important, especially for ozone. chemical (REF) profiles and simulations using in situ chemi-
In addition, differences in BT are too large in CO2 to have cal (SONDE) profiles are small over all IASI (a) and CrIS (b)
a direct impact on the quality of temperature forecasts, since spectra. However, there are significant differences for ozone-
we use channels sensitive to this species to retrieve tempera- sensitive channels with O–B values closer to zero when using
ture profiles. the reference ozone. This could be explained by a smaller ac-
Finally, in order to assess the quality of our simulations curacy of ozone measurement with ozonesondes than with
of infrared satellite observations for IASI and CrIS instru- the AMULSE instrument. Another possibility is the exis-
ments using the reference profiles provided by RTTOV, we tence of other biases (e.g. depending on the scan position)
calculated the difference between real and simulated obser- which are compensated for by bias in the opposite sign in the
vations (O–B) using chemical information from reference case of REF profiles. The same experiments were performed
profiles (black line) and from in situ profiles (red line) with on other in situ sounding data with generally the same re-
respect to IASI-monitored (Fig. 10a) and CrIS-monitored sults (not shown here). For the case of 7 April 2018, it can be
(Fig. 10b) channels for in situ sounding from 17 April 2018 seen in Fig. 9 that our static reference profiles of carbon diox-
at 10:00 UTC. IASI and CrIS have 314 and 330 monitored ide and methane lead to realistic simulations, in line with in
channels, respectively. situ profiles. However, it is more difficult to accurately sim-
ulate ozone-sensitive channels. Indeed, ozone differs from
https://doi.org/10.5194/amt-13-3099-2020 Atmos. Meas. Tech., 13, 3099–3118, 20203110 L. Joly et al.: Evolution of AMULSE and application with APOGEE experiment for satellite validation
Figure 7. Representation of reference profiles (dash-dotted black lines) of O3 (a), CO2 (b) and CH4 (c) and profiles measured by in situ
sounding and convoluted with reference profiles of O3 in violet (a), CO2 in red (b) and CH4 in green (c).
5.2 Comparison between a priori, retrieval and in situ
chemical profiles
In situ chemical profiles can directly be used as verification
data for modelled profiles or retrievals from satellite sen-
sors. In this section, two possible usages are illustrated with
APOGEE data.
5.2.1 Forecasts of atmospheric composition
One possible use of these in situ profiles of CO2 , CH4 and O3
is as comparison data to the a priori chemical profiles from
chemistry transport models (CTMs). As part of our study, we
compared our measured data against the profiles extracted
from the CTMs MOCAGE and C-IFS. These two models dif-
Figure 8. Brightness temperature spectrum of simulated IASI (in fer in that the global version of the MOCAGE model does not
black) and CrIS (in blue) observations w.r.t. wavenumbers using assimilate any observation in operation, while C-IFS assimi-
O3 , CO2 and CH4 reference profiles for in situ sounding from lates Level 2 products from several instruments such as MLS,
17 April 2018 at 10:00 UTC. OMI, SBUV/2, GOME-2A and GOME-2B, IASI, MOPITT,
OMPS, and PMAp (Basart et al., 2018). C-IFS provides anal-
yses and 5 d forecasts of atmospheric composition at regional
CO2 and CH4 because it has a very high spatial and temporal and global scales in near real time. MOCAGE is an off-line
variability. Hopefully in the future, chemical measurements global three-dimensional chemistry transport model (Guth
of this type will be carried out on a more regular basis across et al., 2016). It provides the time evolution of the chemical air
the globe allowing for more robust assessments. composition from the surface to the stratosphere. MOCAGE
is used for operational daily forecasts and also for research
studies. Thus, we extracted the profiles a priori from CH4 and
O3 from the CTM MOCAGE and C-IFS for our case study of
the in situ sounding from 17 April 2018 at 10:00 UTC. These
Atmos. Meas. Tech., 13, 3099–3118, 2020 https://doi.org/10.5194/amt-13-3099-2020L. Joly et al.: Evolution of AMULSE and application with APOGEE experiment for satellite validation 3111
Figure 10. Difference between real and simulated observations
(O–B) using chemical information from reference profiles (black
Figure 9. Difference between simulated brightness temperature line) and from in situ profiles (red line) with respect to IASI-
(BT) with O3 in purple (CO2 in red and CH4 in green) in situ pro- monitored (a) and CrIS-monitored (b) channels for in situ sounding
files from SONDE and AMULSE and simulated brightness temper- from 17 April 2018 at 10:00 UTC.
ature with O3 (CO2 and CH4 ) reference profiles for in situ sounding
from 17 April 2018 at 10:00 UTC for all channels contained in the
IASI (a) and CrIS (b) spectrum.
in the lower troposphere between 1000 and 500 hPa. Finally,
the ozone profile from CAMS is in very good agreement with
profiles could therefore be compared to the in situ and refer- the profile measured in the lower troposphere between 1000
ence profiles available in RTTOV. We have shown in Fig. 11 and 450 hPa and in the lower stratosphere between 45 and
the ozone (a) and methane (b) in situ profiles in black lines 15 hPa. However, the CAMS ozone profile overestimates the
compared to O3 and CH4 a priori profiles from CAMS in red values compared to the profile measured over a large part
lines and MOCAGE in blue lines and compared to O3 and of the atmosphere between 500 and 50 hPa. Overall, the dif-
CH4 reference profiles in dotted lines. ferent ozone profiles are more or less close to the measured
In Fig. 11a we notice that the reference ozone profile is in profile. The CTMs are able to simulate the shape of ozone
relatively good agreement with the in situ profile except in profiles relatively well with good values for MOCAGE in
the upper troposphere between 300 and 150 hPa. The ozone the stratosphere and for CAMS in the lower troposphere. The
values of the reference profile are slightly higher than those reference profile seems to be a good compromise on this par-
of the in situ profile in the lower troposphere between 1000 ticular case.
and 350 hPa and in the lower stratosphere between 60 and Methane simulation is a much more difficult task in the
20 hPa. Then, we observe that the a priori profile of ozone field of CTMs. Indeed, there are major scientific questions
from MOCAGE is very close to the profile measured over the about the increase in atmospheric methane concentration and
entire lower stratosphere. The MOCAGE ozone profile fol- its hypothetical sources (Archibald et al., 2020; Houwel-
lows the profile measured in the upper troposphere between ing et al., 2017; Naik et al., 2013). That is why assimila-
500 and 80 hPa, with lower values. The MOCAGE ozone tion into CTMs for this species is very useful. We notice
values are overestimated compared to the profile measured again in Fig. 11b that the reference methane profile is rather
https://doi.org/10.5194/amt-13-3099-2020 Atmos. Meas. Tech., 13, 3099–3118, 20203112 L. Joly et al.: Evolution of AMULSE and application with APOGEE experiment for satellite validation
good with the profile measured between 1000 and 70 hPa.
Indeed, above 70 hPa, there is a faster decrease in the mea-
sured concentration than in the values of the reference pro-
file. This decrease is simulated by the profile from MOCAGE
but with a large underestimation over the entire profile of
about 0.5 ppmv. This difference can be explained by a miss-
ing source in the model and/or too many OH molecules that
are the main methane sink. Assimilation can solve this prob-
lem, so there is a very good agreement between the CAMS
methane profile and the measured profile in the lower tro-
posphere between 1000 and 300 hPa. Then the values of the
CAMS profile are underestimated compared to the measured
profile between 300 and 45 hPa.
Such in situ chemical profiles can be very useful in assess-
ing the quality of simulations of atmospheric composition
from CTMs, especially if they can be made on a regular ba-
sis within a network. For our case study, we note the general
pattern and concentration of ozone are relatively well sim-
ulated by MOCAGE and CAMS, while methane is largely
underestimated in MOCAGE and very well represented in
the troposphere by CAMS.
5.2.2 Ozone retrieval from 1D assimilation
Profiles of various atmospheric compounds can be retrieved
from satellite data. Among them, hyperspectral infrared
sounders like AIRS, CrIS and IASI have the ability to be used
both in NWP models and for atmospheric composition pur-
poses, which could be used in combining meteorological and
chemistry transport models to achieve a so-called coupled
assimilation. A precursor method is to add some chemical
variable to the control variable of NWP models. This is the
case, for example, for ozone in the IFS model of ECMWF,
which assimilates 16 IASI ozone-sensitive channels in op- Figure 11. Ozone (a) and methane (b) in situ profiles in black lines
compared to O3 and CH4 a priori profiles from CAMS in red lines
erational near real time, providing ozone analysis (Han and
and MOCAGE in blue lines and compared to O3 and CH4 reference
McNally, 2010). Such an approach can also be used at the profiles in dotted lines for in situ sounding from 17 April 2018 at
pixel level to retrieve profiles or with cloud-cleared spectra 10:00 UTC.
as performed by the AIRS and NUCAPS systems (Susskind
et al., 2003; Smith and Barnet, 2019). Indeed, Coopmann
et al. (2018) show that the assimilation of 15 ozone-sensitive gorithm (Smith, 2016) is based on the optimal estimation
IASI channels makes it possible to simultaneously improve method (OEM; Rodgers, 2009). This method makes it possi-
temperature, humidity and ozone retrievals. In both cases, ble in a simplified way to get closer to what is carried out op-
it is also important to assess the quality of ozone analyses erationally in large NWP centres using variational assimila-
using independent comparative data. For ozone, this can be tion methods. There are other methods of retrieval such as the
carried out in almost any region around the world since there piecewise linear regression used at EUMETSAT (EUMET-
are several stations that perform in situ soundings measuring SAT, 2014) or the NOAA Unique CrIS/ATMS Processing
ozone (Nalli et al., 2017b). However, if methane or carbon System (NUCAPS) for the infrared physical retrieval based
dioxide analyses are to be retrieved, in situ vertical profiles on a regularized iterated least-squares minimization (Gam-
of these compounds are much sparser. This is why the data bacorta et al., 2012; Nalli et al., 2013).
measured by the AMULSE instrument can be valuable when The measured in situ ozone profiles could be used as com-
these compounds are reproduced by meteorological models. parative data to evaluate the quality of our retrievals. In
As part of the APOGEE measurement experiment, we car- this study we conducted these experiments using observa-
ried out several assimilation experiments in a simplified one- tions from IASI and CrIS, focusing on the simultaneous re-
dimensional framework (1D-Var) where we retrieved ozone. trieval of temperature, humidity and ozone, taking the ozone
The NWP SAF (Satellite Application Facility) 1D-Var al- background and a priori profile from MOCAGE or CAMS.
Atmos. Meas. Tech., 13, 3099–3118, 2020 https://doi.org/10.5194/amt-13-3099-2020L. Joly et al.: Evolution of AMULSE and application with APOGEE experiment for satellite validation 3113 Figure 12. Ozone in situ profile in black compared to O3 a priori profile from MOCAGE in red and O3 retrieval profile from CrIS in blue for in situ sounding from 4 July 2017 at 02:00 UTC (a) and 4 July 2017 at 12:00 UTC (c). Ozone in situ profile in black compared to O3 a priori profile from CAMS in orange and O3 retrieval profile from CrIS in cyan for in situ sounding from 4 July 2017 at 02:00 UTC (b) and 4 July 2017 at 12:00 UTC (d). Similar work on the validation of ozone restitution from Figure 12 represents the ozone in situ profile in black com- IASI is presented in Dufour et al. (2012) and from CrIS pared to the O3 a priori profile from MOCAGE in red and O3 in Nalli et al. (2017b). Soundings of 1 June at 10:00 UTC, retrieval profile from CrIS in blue for in situ sounding from 4 July at 02:00 UTC, 4 July at 09:00 UTC and 4 July 2017 at 4 July at 02:00 UTC (a) and 4 July 2017 at 12:00 UTC (c) and 12:00 UTC are selected for that case study. The methodology the ozone in situ profile in black compared to the O3 a priori and techniques used in this study are the same as those used profile from CAMS in orange and O3 retrieval profile from in Coopmann et al. (2018). To retrieve ozone using observa- CrIS in cyan for in situ sounding from 4 July at 02:00 UTC tions from IASI, we assimilated 123 channels used in opera- (b) and 4 July 2017 at 12:00 UTC (d). In Fig. 12a, we notice tions at Météo-France plus 15 ozone-sensitive channels, us- that overall the MOCAGE a priori profile underestimates the ing a full observation error covariance matrix diagnosed from ozone concentration compared to the measured profile except the method described by Desroziers et al. (2005). Based on in the lower troposphere and above 25 hPa. In this case, the CrIS observations, we assimilated 68 channels used in op- ozone retrieval profile is very close to the measured profile. erations at Météo-France and 14 ozone-sensitive channels, In Fig. 12b, the CAMS a priori profile is generally closer using a diagonal observation error covariance matrix whose to the measured profile than the MOCAGE a priori profile. values are derived from the operational settings at Météo- However, there is some overestimation of CAMS ozone con- France. IASI and CrIS observations were collocated with in centration between 300–200 and 150–50 hPa. We note that situ soundings. The ozone background errors available in the with this a priori profile, the ozone retrieval profile is less background error covariance matrix were calculated using modified than previously. In the same way as with the previ- ozonesondes based on the method described in the work of ous in situ sounding, we notice in Fig. 12c that the MOCAGE Coopmann et al. (2018). Finally, the thermodynamic a pri- a priori profile underestimates the ozone concentration com- ori profiles and surface parameters were extracted from the pared to the measured profile except in the lower tropo- global model ARPEGE and were extracted at the same coor- sphere. The ozone retrieval profile is again of very good qual- dinates and time as the in situ soundings, as were the ozone ity. Finally, we note in Fig. 12d that the CAMS a priori profile a priori profiles from MOCAGE and CAMS. underestimates the concentration of ozone in the lower tropo- https://doi.org/10.5194/amt-13-3099-2020 Atmos. Meas. Tech., 13, 3099–3118, 2020
You can also read