Haze in Singapore - source attribution of biomass burning PM10 from Southeast Asia
←
→
Page content transcription
If your browser does not render page correctly, please read the page content below
Atmos. Chem. Phys., 19, 5363–5385, 2019
https://doi.org/10.5194/acp-19-5363-2019
© Author(s) 2019. This work is distributed under
the Creative Commons Attribution 4.0 License.

Haze in Singapore – source attribution of biomass burning
PM10 from Southeast Asia
Ayoe Buus Hansen1 , Claire Suzanne Witham1 , Wei Ming Chong2 , Emma Kendall1 , Boon Ning Chew2 ,
Christopher Gan2 , Matthew Craig Hort1 , and Shao-Yi Lee2
1 Met   Office, Exeter, UK
2 Meteorological   Service Singapore, Singapore

Correspondence: A. B. Hansen (ayoe.hansen@metoffice.gov.uk)

Received: 23 March 2018 – Discussion started: 16 April 2018
Revised: 5 March 2019 – Accepted: 3 April 2019 – Published: 18 April 2019

Abstract. This paper presents a study of haze in Singapore        monitoring stations across Singapore, on a seasonal as well
caused by biomass burning in Southeast Asia over the 6-year       as on an inter-annual timescale. This study shows that even
period from 2010 to 2015, using the Numerical Atmospheric-        across small scales, such as in Singapore, variation in local
dispersion Modelling Environment (NAME), which is a La-           meteorology can impact concentrations of particulate matter
grangian dispersion model. The major contributing source re-      significantly, and it emphasises the importance of the scale
gions to the haze are identified using forwards and backwards     of modelling both spatially and temporally.
model simulations of particulate matter.
   The coincidence of relatively strong southeast monsoonal
winds with increased biomass burning activities in the Mar-
                                                                  1   Introduction
itime Continent create the main Singapore haze season from
August to October (ASO), which brings particulate matter          Haze caused by biomass burning is a significant issue
from varying source regions to Singapore. Five regions are        throughout Southeast Asia. Biomass burning occurs natu-
identified as the dominating sources of pollution during re-      rally across the world but is being accelerated by human ac-
cent haze seasons: Riau, Peninsular Malaysia, South Suma-         tivities and interests. Clearing forest for plantations by burn-
tra, and Central and West Kalimantan. In contrast, off-season     ing is a quick and easy way to open up and fertilise the
haze episodes in Singapore are characterised by unusual           soil; however, it is also a process that is difficult to con-
weather conditions, ideal for biomass burning, and contri-        trol. The emissions from these fires can have massive and
butions dominated by a single source region (different for        detrimental impacts far from where the original fires were
each event). The two most recent off-season haze events           lit. Biomass burning is a global phenomenon. It is an an-
in mid-2013 and early 2014 have different source regions,         cient practice as well as a natural process which modifies the
which differ from the major contributing source regions for       Earth’s surface (Pereira et al., 2016). The haze from biomass
the haze season. These results challenge the current popu-        burning impacts human health (Crippa et al., 2016; Sigsgaard
lar assumption that haze in Singapore is dominated by emis-       et al., 2015; Youssouf et al., 2014; Reddington et al., 2015),
sions/burning from only Indonesia. For example, it is shown       crops, climate, biodiversity, tourism, and agricultural produc-
that Peninsular Malaysia is a large source for the Maritime       tion (Jones, 2006), and also aviation and marine navigation
Continent off-season biomass burning impact on Singapore.         through visibility degradation (Crippa et al., 2016; Lee et al.,
   The results demonstrate that haze in Singapore varies          2016b). Over recent decades the impacts of biomass burning
across year, season, and location and is influenced by local      have been felt in increasing degree in Southeast Asia and in
and regional weather, climate, and regional burning. Differ-      Singapore (Oozeer et al., 2016).
ences in haze concentrations and variation in the relative con-
tributions from the various source regions are seen between

Published by Copernicus Publications on behalf of the European Geosciences Union.
5364                                                                                     A. B. Hansen et al.: Haze in Singapore

    Though haze occurs in Singapore (Hertwig et al., 2015;           Reid et al., 2012). The ENSO conditions have varied signif-
Lee et al., 2016b; Nichol, 1997, 1998; Sulong et al., 2017),         icantly during the 6-year period of our study (2010–2015).
it is not caused by activities within Singapore. Rather it is        During 2010, the conditions transitioned from a moderate El
a transboundary problem caused by biomass burning across             Niño to a moderate La Niña lasting through 2011. From 2012
the wider region (see Fig. 1 for a map of the region), which         to 2014 the ENSO conditions were neutral transitioning to
typically occurs during distinct burning seasons (Hertwig            very strong El Niño conditions in 2015, which lasted into
et al., 2015; Reid et al., 2013). Scientific studies such as Kim     2016 (NOAA, 2017).
et al. (2015), as well as the popular press, often attribute peat-      The combination of variation in ENSO (Fing, 2012) and
land destruction and related haze in the region to Indonesia         anthropogenic land-use changes (Field et al., 2009; Shi and
(Reid et al., 2013). However, the haze cannot be attributed to       Yamaguchi, 2014) leads to considerable inter-annual vari-
only one region or country alone. To mitigate this, the As-          ation in biomass burning and related emissions of particu-
sociation of Southeast Asian Nations (ASEAN) haze agree-             late matter (PM) in Southeast Asia. Biomass burning in the
ment has been formed between the Southeast Asian nations             region can be divided into seasons that relate to the mon-
to reduce haze and mitigate the related impacts using a scien-       soon periods: February, March, and April (FMA) are domi-
tific approach (Nazeer and Furuoka, 2017; Lee et al., 2016a).        nated by burning in Mainland Southeast Asia; during May,
Through the ASEAN, science-based mitigation has been at-             June, and July (MJJ) burning starts in northern Sumatra and
tempted, but many lives are still lost every year due to haze        traverses southward; and August, September, and October
caused by biomass burning (Lee et al., 2018). The Met Office         (ASO) are characterised by burning in Kalimantan and, in
(MO) and the Meteorological Service Singapore (MSS) have             general, there is little burning in November, December, and
previously established a haze forecast system to predict haze        January (NDJ) (Campbell et al., 2013; Chew et al., 2013;
in Singapore (Hertwig et al., 2015). This study advances the         Reid et al., 2012, 2013). From annual weather reports by
previous work to improve our understanding of haze and the           MSS (NEA, 2015, 2017), unusual weather events from 2010
underlying causes by analysing and attributing haze events           to 2015 and related haze events are linked. In 2010 a pro-
of the recent past to their sources. The work focuses on Sin-        longed Madden–Julian Oscillation (MJO) dry phase caused
gapore due to the availability of air quality observations with      a dry October, creating ideal conditions for biomass burning
high spatial and temporal resolution for recent years.               in the region and related haze in Singapore. Year 2011 began
    The weather and climate in Singapore and hence the trans-        as an ENSO neutral year transitioning to La Niña, with dry
port of smoke from biomass burning are dominated by mon-             conditions in early September and prevailing low-level winds
soon periods and influenced by the variations of the El Niño–        bringing PM10 to Singapore from biomass burning in cen-
Southern Oscillation (ENSO), which modifies temperatures             tral and southern Sumatra. During the southwest monsoon
in the central equatorial pacific (Ashok et al., 2007; Yeh et al.,   of 2012, an MJO dry phase created dry and ideal haze con-
2009; Reid et al., 2012; Yuan and Yang, 2012). Meteorologi-          ditions in September. In June 2013 a typhoon (Gaveau et al.,
cally, the year in Singapore is split into four seasons, with two    2014) coincided with major atmospheric emissions from peat
monsoon seasons separated by two inter-monsoon seasons.              fires in Southeast Asia (Oozeer et al., 2016). In 2014 Singa-
The northeast monsoon season is generally from December              pore experienced haze during another intense MJO dry phase
to early March and dominated by northeasterly winds. The             and drought, described by Mcbride et al. (2015). Year 2015
first inter-monsoon period follows from late March through           was the joint warmest year (with 1997 and 1998) and sec-
May, and then the southwest monsoon is from June through             ond driest year on record. ASO 2015 saw the worst haze
September, with air in Singapore generally arriving from a           in recent history in Singapore (Huijnen et al., 2016; Crippa
southeastern direction. The second inter-monsoon period is           et al., 2016; Koplitz et al., 2016), caused by southwest-
October and November (Fing, 2012). Between years, there              erly/southeasterly winds and fires in southern and central
is large variability in the onset of the monsoon over Main-          Sumatra and southern Kalimantan. Fire carbon emissions
land Southeast Asia (Zhang et al., 2002). Generally, the             over maritime Southeast Asia in 2015 were the largest since
inter-monsoon periods are characterised by light and variable        1997 (Huijnen et al., 2016).
winds, influenced by land and sea breezes with afternoon and            Haze concentrations in Singapore vary throughout the 6-
early evening thunderstorms (Reid et al., 2012). The later           year period from 2010 to 2015. Even though biomass burn-
inter-monsoon period is often wetter than the earlier inter-         ing contributes to (low) PM10 concentrations in Singapore
monsoon period (Chang et al., 2005; Reid et al., 2012). The          throughout large parts of the year, some peaks in the PM10
weaker winds during the inter-monsoon periods lead to air            observations can be explained by haze almost exclusively.
arriving in Singapore originating from the countries immedi-         In the 6-year period, haze occurs almost annually during the
ately west of and surrounding Singapore (Fig. A1).                   season of ASO, known as the haze season (see Fig. 4). Haze
    Previous studies have shown the importance of ENSO in            events occurring during other periods of the year are referred
relation to reduction in convection and precipitation over the       to as off-season or atypical haze. In 2013 and 2014 two
Martime Continent (MC) and corresponding increase in haze            unique atypical haze events occurred in June and in FMA,
in Southeast Asia (Ashfold et al., 2017; Inness et al., 2015;        respectively (Hertwig et al., 2015; Gaveau et al., 2014; Duc

Atmos. Chem. Phys., 19, 5363–5385, 2019                                               www.atmos-chem-phys.net/19/5363/2019/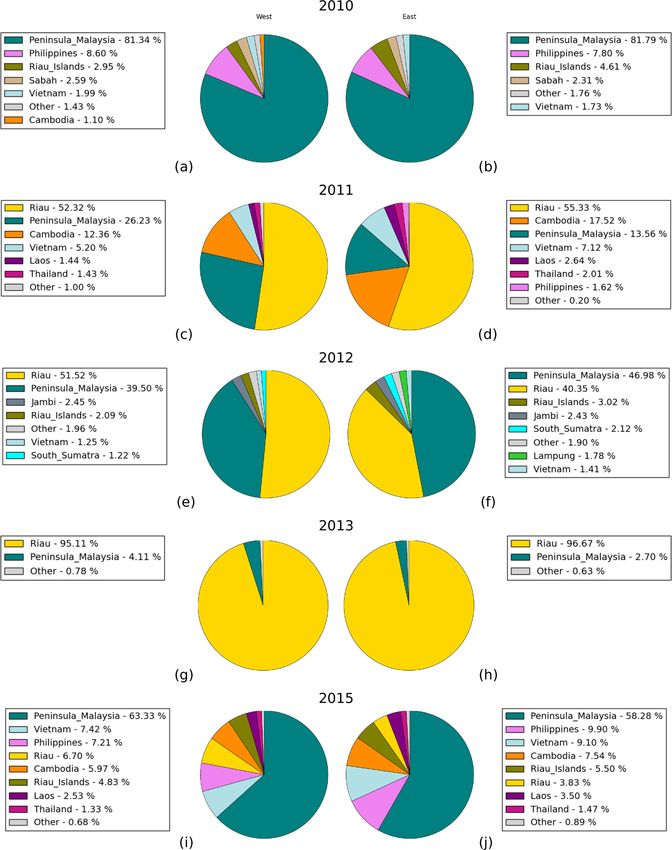
A. B. Hansen et al.: Haze in Singapore                                                                                     5365

et al., 2016). These events caused extremely high PM10 con-        in Southeast Asia (Fig. 1). Using the Met Office’s numer-
centrations in Singapore.                                          ical weather prediction (NWP) model to drive the Numer-
   Several previous studies have looked at attributing air pol-    ical Atmospheric-dispersion Modelling Environment, a La-
lution for different regions. Source attribution can be per-       grangian particle trajectory model, we are able to attribute
formed both through modelling and by looking at observa-           the haze arriving in Singapore to its source region and study
tions of air pollution in detail. For example, Heimann et al.      the difference between major contributing source regions at a
(2015) carried out a source attribution study of air pollution     western and an eastern monitoring station in Singapore. The
in the United Kingdom (UK) using observations to distin-           model output is evaluated against PM10 observations from
guish between local and regional emissions, whereas Red-           the two monitoring stations. The paper is composed as fol-
ington et al. (2016) estimated the sources of annual emis-         lows: Sect. 2 describes the methods used in the study; Sect. 3
sions of particulate matter from the UK and the European           presents the results and evaluation, along with a more de-
Union (EU) by using the Numerical Atmospheric-dispersion           tailed study of four recent haze events. The results and re-
Modelling Environment (NAME) model to look at thresh-              lated implications are discussed in Sect. 4.
old exceedances and episodes. Attribution studies have been
performed using Eulerian models such as the Goddard Earth
Observing System atmospheric chemistry model (GEOS-                2     Methods
Chem), the Community Multiscale Air Quality Modeling
System (CMAQ), and the Weather Research and Forecast-              This section describes the model used, the setup and input
ing Model–Sulfur Transport and dEposition Model (WRF-              used for the simulations, and the methods used to evaluate
STEM) to study both Asia and the Arctic (Ikeda et al., 2017;       the results.
Kim et al., 2015; Sobhani et al., 2018; Yang et al., 2017; Mat-
                                                                   2.1    The Numerical Atmospheric-dispersion Modelling
sui et al., 2013) sometimes in combination with flight cam-
                                                                          Environment
paigns (Wang et al., 2011) to better constrain the emissions.
Lagrangian models have also been used in combination with          We use a Lagrangian model because of its ability to track
observations by Winiger et al. (2017). Combinations of Eu-         emissions and provide detailed information on source re-
lerian and Lagrangian models (Kulkarni et al., 2015) and Eu-       gions at any given location in the modelling domain. The
lerian models and observations (Lee et al., 2018) have been        Numerical Atmospheric-dispersion Modelling Environment
used to assess whether low-visibility days were caused by          (NAME) III v6.5 (Jones et al., 2007) is a Lagrangian particle
fossil fuel combustion, biomass burning, or a combination of       trajectory model, designed to forecast dispersion and depo-
the two. In Southeast Asia, Reddington et al. (2014) used          sition of particles and gases on all ranges. NAME uses the
an Eulerian model to study haze and estimated emissions            topography from the relevant meteorological input and does
through a bottom-up approach. Source attribution for stud-         not resolve buildings or terrain on scales smaller than the
ies of biomass-burning-related degradation of air quality and      NWP. Emissions in the model are released as particles that
visibility in Southeast Asia has also been applied by Lee et al.   contain information on one or more species. During the sim-
(2017), who used the WRF model to study the sensitivity            ulation these particles are exposed to various chemical and
of the results to different met data and emission inventories.     physical processes. NAME includes a comprehensive chem-
Engling et al. (2014) also used observations and a chemical        istry scheme, but this is not used in this study, as we are
mass balance receptor model to compare the chemical com-           interested only in primary PM. The only aerosol processes
position of total suspended particulate matter on haze and         considered here are dispersion and wet and dry deposition of
non-haze days during a haze event in 2006.                         primary PM10 . In NAME the dry deposition is parametrised
   The aim of this study is to investigate the spatial variation   using the resistance-based deposition velocity and wet depo-
of haze across Singapore through source attribution. This          sition is based on the depletion equation (Webster and Thom-
includes the variation in concentration and the contribut-         son, 2014). The advection is based on the winds obtained
ing source regions at different sites across Singapore. This       from the meteorology provided, and a random component
has been achieved by linking meteorology, biomass burn-            is added to represent the effects of atmospheric turbulence.
ing emissions, and forwards and backwards dispersion mod-          NAME is driven by meteorological data, in this case the Met
elling to study how the origin of haze has varied across Sin-      Office’s operational weather prediction model (Davies et al.,
gapore during 2010–2015. Fire radiative power and injection        2005), described below.
height from the Copernicus Atmosphere Monitoring Service
(CAMS) Global Fire Assimilation System (GFAS, Kaiser               2.2    The Unified Model
et al., 2012) and higher-resolution land-use data from the
Centre for Remote Imaging, Sensing and Processing at the           The Unified Model (UM) is the Met Office’s operational
National University of Singapore have been used to calcu-          numerical weather forecast model. The UM is a global
late particulate matter with diameter of 10 µm or less (PM10 )     model based on the non-hydrostatic fully compressible deep-
emissions from biomass burning in 29 defined source regions        atmosphere equations of motion solved using a semi-implicit

www.atmos-chem-phys.net/19/5363/2019/                                              Atmos. Chem. Phys., 19, 5363–5385, 2019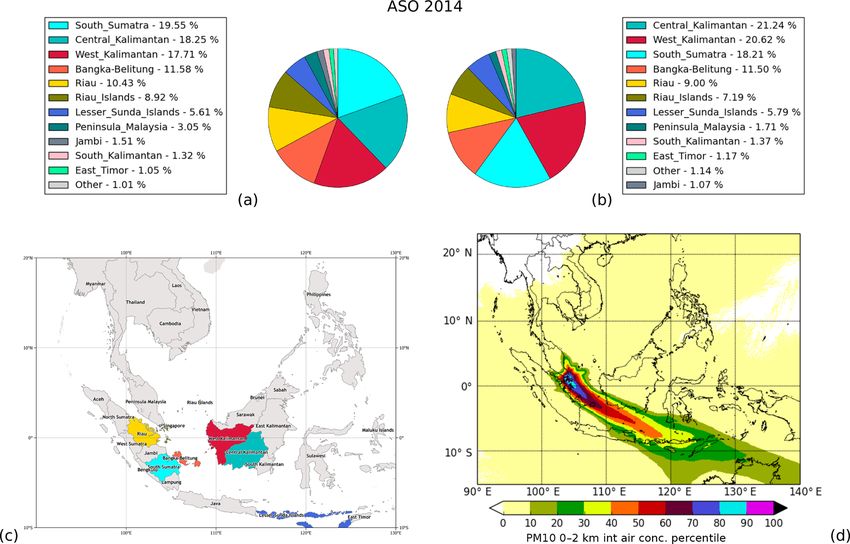
5366                                                                                   A. B. Hansen et al.: Haze in Singapore

semi-Lagrangian approach on a regular longitude–latitude           run was conducted using meteorological input from the UM
grid (Walters et al., 2017). Archived analysis meteorology         global model within a domain of 15.0◦ S–23.0◦ N and 90.0–
from the global version of the UM was used to drive NAME.          140.0◦ E (Fig. 2). PM10 was emitted as a tracer from a re-
As the UM is an operational model, the dynamical core and          ceptor site in central Singapore, and model particles were re-
spatial resolution have changed throughout the period, from        leased over the first 24 h with an emission rate of 1 g s−1 .
∼ 40 km over ∼ 25 km to ∼ 17 km resolution. However, for           The resulting concentration values in the 0–2 km layer were
the majority of the study the resolution is constant at 25 km.     output on a 0.1◦ × 0.1◦ resolution grid and integrated back-
These upgrades are described in Walters et al. (2011, 2017),       wards in time for 10 d with a timestep of 10 min. A higher
and the relevant changes for dispersion modelling are sum-         integrated concentration indicates that more air has passed
marised in Table 1. These changes are not expected to have         through a grid cell en route to the receptor site, compared to
a significant impact on the results; e.g. no significant differ-   a grid cell with a lower concentration. By summing the re-
ences in the deposition are seen across the change from in-        sults from multiple runs, air history data can be produced for
stantaneous precipitation and cloud to 3 h mean data in 2013.      different seasons and years, as well as the total for the whole
   Global UM model meteorological data for 2013 have been          period. For each analysis period, the multiple corresponding
evaluated using meteorological observations available at four      10 d air concentrations were summed for each grid cell and
sites across Singapore. The UM data are interpolated in            for the total domain. A percentile value was then calculated
NAME to obtain wind speed and direction, temperature, and          to ascertain the proportion of air influenced by a particular
relative humidity data for each location and an hourly time        grid cell vis-à-vis other areas.
resolution. The results show that modelled wind speeds are            Comparison between the inland site and a coastal receptor
higher on average than those observed during 2013, partic-         site showed insignificant variation, meaning that the central
ularly during the monsoon seasons. Wind speeds are one of          receptor site can be considered representative for the whole
the most important factors affecting pollutant levels, partic-     island when averaged over time. The results of the air history
ularly close to strong sources. Although haze in Singapore         simulations helped inform the decision of domain size for the
is predominantly caused by long-range transport of biomass         forward haze simulations.
smoke, the higher wind speeds in the model may contribute
to reducing modelled pollutant levels below those observed.        2.4     NAME forward model simulations
There are some differences in wind direction between the
model and observations, but the prevailing wind directions         For the attribution, forward NAME runs were conducted us-
are captured well throughout the year.                             ing the haze forecast setup designed by Hertwig et al. (2015)
   Observed ambient temperatures are slightly higher and           and extending it to year-long haze simulations. Individual
more variable on average than the model, although there is         forward simulations were performed for each of the years
good agreement between the model and observations. Rain-           from 2010 to 2015 for PM10 for a domain covering 14◦ S–
fall does not appear well represented with higher hourly           23◦ N and 90–131◦ E using the GFAS PM10 biomass burning
means and more frequent low-intensity events when com-             emissions described in Sect. 2.4.1. Each run was initialised
pared to the observations, which show less frequent high-          on 1 January and the simulation ran until 31 December of the
intensity rainfall associated with the convective activity that    same year. A maximum of 200 million model particles were
dominates rainfall within the tropics. Modelled total monthly      emitted during the simulation, and any particles leaving the
rainfall is higher than observed during 2013, which may            domain were lost. The simulations used no boundary condi-
decrease modelled PM levels through wet deposition and             tions and so there was no inflow of particles from the domain
contribute to the often negative bias observed in PM10 (see        edges. From these simulations, modelled time series for the
Sect. 3). As discussed in Redington et al. (2016) and Hertwig      two monitoring sites described in Sect. 2.4.2 were produced.
et al. (2015), the uncertainties from the meteorological data
feed into the dispersion simulation.                               2.4.1    Emissions and source regions

2.3    Air history maps                                            The PM10 emissions used in this study were calculated from
                                                                   the Global Fire Assimilation System (Kaiser et al., 2012)
Air history maps provide a visual indication of where air at       v1.2 daily gridded fire radiative power (FRP) and injection
a given location has originated from. This helps to determine      height (IH) products, integrated with high-resolution land-
the regions that influence the composition of the air arriving     use data and emission factors in an approach aimed at com-
at this location. To construct air history maps for Singapore,     bining the benefits of the MSS and GFAS v1.2 source ap-
backward (inverse) runs were conducted with NAME, in ad-           proaches described in Hertwig et al. (2015). Additionally,
dition to the forward simulations with the GFAS biomass            the land cover map used has been updated to the 2015 ver-
burning emissions (Sect. 2.4). Figure 2 illustrates the air his-   sion by Miettinen et al. (2016b), which now covers the entire
tory map for Singapore for the years 2010 to 2015. For each        Southeast Asia region, as compared to the earlier 2010 ver-
day in the 6-year period from 2010 to 2015, a 10 d back-           sion (Miettinen et al., 2016a). The horizontal dimensions of

Atmos. Chem. Phys., 19, 5363–5385, 2019                                             www.atmos-chem-phys.net/19/5363/2019/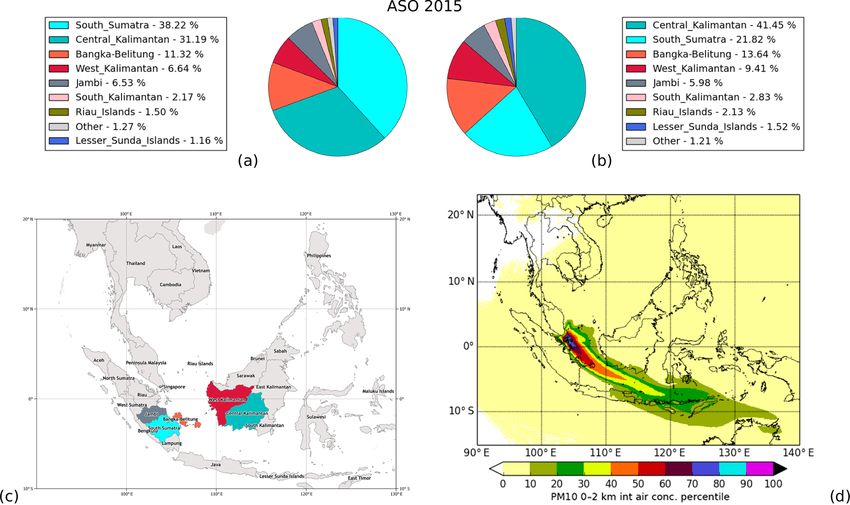
A. B. Hansen et al.: Haze in Singapore                                                                                            5367

Table 1. Summary of the changes in the global UM data over the period of this study relevant to dispersion modelling.

           Start date         Approx. horizontal     Relevant change
                              resolution
           1 January 2010     40 km
           20 January 2010    25 km                  Horizontal resolution increase
           30 April 2013      25 km                  Change from use of instantaneous precipitation and cloud to 3 h mean data
           15 July 2014       17 km                  Horizontal resolution increase

the emissions were dx = dy = 0.1◦ , and the material was re-              The following analysis is based on hourly PM10 observa-
leased at varying heights based on the GFAS injection height           tions and modelled time series at the two selected monitoring
information. Using the Lagrangian nature of the model, all             stations. Annual and seasonal pie charts showing the percent-
emissions are tagged with source information to allow for              age contribution from each source region at each monitoring
assessment of contributing source regions and relative con-            station have been produced to capture the spatial variation of
tributions. The choice of the GFAS data set as the basis for           biomass burning across the island, e.g. Figs. 5c–8c. During
the source calculation was based on the need for daily emis-           the period considered, several haze events occurred in Singa-
sions, as in the operational setup of Hertwig et al. (2015),           pore. To evaluate the model results, four performance metrics
and the good agreement of this with observations and con-              have been calculated. These evaluate the model performance
sistency with the Global Fire Emission Database (GFED)                 at the two monitoring stations, for each year and selected
data set documented previously, e.g. Kaiser et al. (2012) and          seasons in each of the six years with available observations.
Rémy et al. (2017).                                                    The metrics considered are the Pearson correlation coeffi-
   For this study, 29 source regions have been defined to dis-         cient (R), i.e. the correlation between the model and observa-
tinguish where the PM10 from biomass burning originated                tions used to get an indication of the match between patterns
from (see Fig. 1). The Lagrangian nature of the model en-              in the modelled and observed time series; the modified nor-
ables us to attribute the PM10 concentrations at specific loca-        malised mean bias (MNMB) which assesses the bias of the
tions in Singapore to the individual source regions.                   forecast and can have values between −2 and +2 (Seigneur
                                                                       et al., 2000); the fractional gross error (FGE) which gives the
2.4.2   Observations and performance metrics                           overall error of the model prediction and is limited between
                                                                       0 and +2 (Ordóñez et al., 2010; Savage et al., 2013); and fi-
Some 20 air quality observation sites are located across               nally a factor of 2 (FAC2), which gives an indication of the
Singapore. Of these, one eastern and one western station               fraction of the model results that fall within a factor of 2 of
have been chosen to explore transboundary PM10 concen-                 the observations (Hertwig et al., 2015). Because the emis-
trations across the main island of Singapore. In this analy-           sions used are at a daily resolution compared to the hourly
sis, the western station, Nanyang Technological University             observations of PM10 , a gap or mismatch in the timing of
(NTU; 1.34505◦ N, 103.6836◦ E), is located relatively close            peak concentrations between modelled results and observa-
to the industrial western part of Singapore. The eastern sta-          tion time series is possible. Biases between modelled time
tion, Temasek Polytechnic (TP; 1.34506◦ N, 103.9304◦ E),               series and the observations are expected as some fires will be
is placed next to TP but is also near open fields and a wa-            missed due to the fact that they are too small for the satellites
ter reservoir. The location of the two sites in Singapore can          to register, and the extent and/or duration of the other fires
be seen in the insert of Fig. 1. The National Environment              are over- or underestimated due to cloud cover (Kaiser et al.,
Agency of Singapore measures hourly PM10 at these and                  2012; Reid et al., 2013; Campbell et al., 2016).
other sites using beta attenuation monitoring. In this tech-
nique air is drawn through a size-selective inlet down a verti-
cally mounted heated sample tube to reduce particle bound              3   Results
water and to decrease the relative humidity of the sample
stream to prevent condensation on the filter tape. The PM10            This section presents the results based on the modelling setup
is drawn onto a glass fibre filter tape placed between a de-           described in Sect. 2 above. Air history maps show where the
tector and a 14 C beta source. The beta beam passes upwards            air arriving in Singapore has travelled through, and looking
through the filter tape and the PM10 layer. The intensity of           at the emissions provides information on when and where the
the beta beam is attenuated with the increasing mass load on           largest emissions in the region occur. Using hourly PM10 ob-
the tape resulting in a reduced beta intensity measured by the         servations we evaluate our model output before using the re-
detector. From a continuously integrated count rate the mass           sults to address the research questions posed in Sect. 1. Four
of the PM10 on the filter tape is calculated.                          events are studied in more detail in the final subsections of
                                                                       this section; these are outlined in Table 2.

www.atmos-chem-phys.net/19/5363/2019/                                                    Atmos. Chem. Phys., 19, 5363–5385, 2019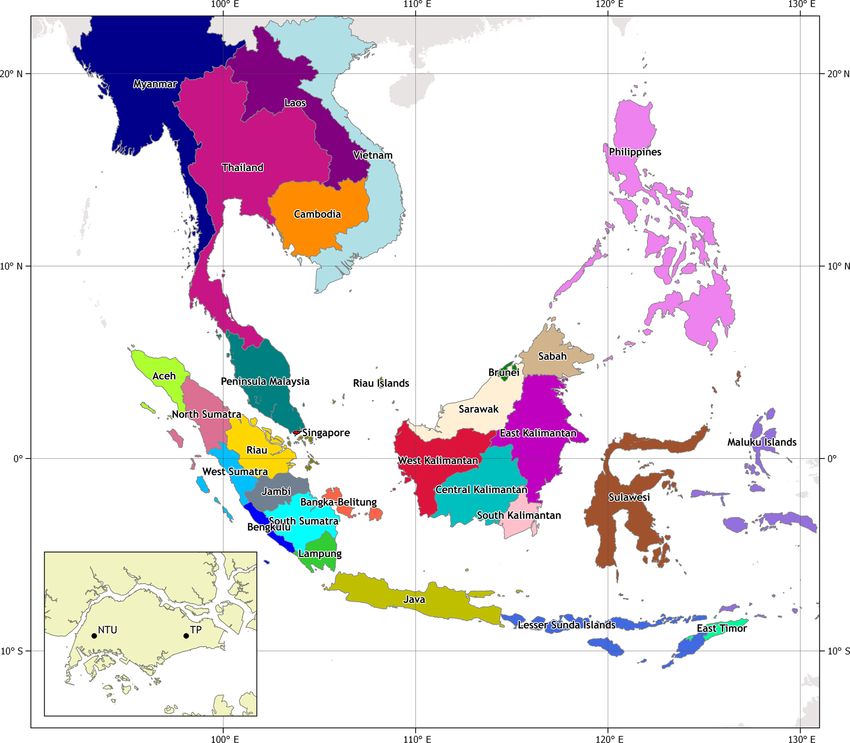
5368                                                                                           A. B. Hansen et al.: Haze in Singapore

Figure 1. Locations and colour codes used for each of the 29 biomass burning source region within the domain from 10◦ S to 0◦ N and from
90 to 130◦ E considered in this study. Singapore is located south of Peninsular Malaysia and east of Riau. The insert in the bottom left-hand
corner shows the relative location of the two monitoring stations in Singapore.

Table 2. Overview of the four haze events studied in detail below.       years represented by the figure, significant variation occurs
FMA: February, March, April; MJJ: May, June, July; ASO: August,          during the individual years (Fig. A2). In 2010 winds were
September, October.                                                      quite weak and the air arriving in Singapore mainly came
                                                                         from a northeasterly direction and did not show the expected
             Year      2013     2014     2014    2015                    fork from the two monsoon seasons (Fig. A2a). This means
             Season     MJJ     FMA      ASO     ASO                     that the air impacting Singapore that year mainly traversed
             Section     3.1      3.1      3.2     3.2                   through countries and regions very near to or east of Sin-
             Figure        5        6        7       8                   gapore, e.g. the Philippines, Peninsular Malaysia, Riau, and
                                                                         Riau Islands. The air history map for 2011 (Fig. A2b) shows
                                                                         a clear bifurcation, with air arriving from the northeast and
  The air history map in Fig. 2 shows that most air arriv-               southeast, as expected from the two monsoon seasons. The
ing in Singapore has travelled from either northeastern or               air arriving in Singapore is therefore likely to have originated
southeastern directions, illustrating the two monsoon sea-               from Vietnam, Cambodia, all areas of Kalimantan, Java, and
sons experienced in Singapore (see Fig. A1 for air history               the island of Sumatra including Riau. During 2012 the north-
maps summed over the period for each of the individual sea-              easterly wind component was significantly weaker than aver-
sons). The northeastern component of the bifurcation in the              age. Also, a small northwesterly component is visible in the
wind pattern is representative of the northeast monsoon in               air history map (Fig. A2c). This means that air was mainly
FMA (Fig. A1a), and the southeastern fork shows the south-               coming from the expected directions given the monsoons in
east monsoon period during ASO (Fig. A1c). During the six                the region with a small additional northwesterly component,

Atmos. Chem. Phys., 19, 5363–5385, 2019                                                    www.atmos-chem-phys.net/19/5363/2019/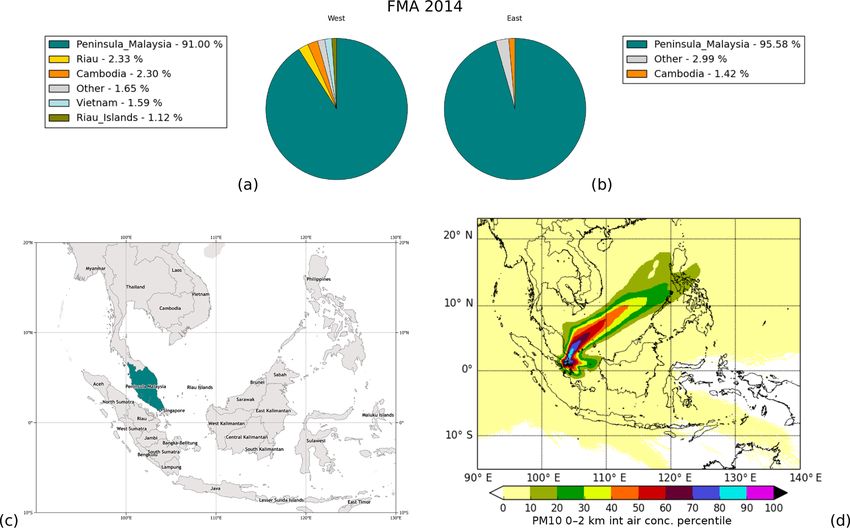
A. B. Hansen et al.: Haze in Singapore                                                                                              5369

                                                                         October 2015; and ∼ 1.1 × 10⁶ T , March 2014) emissions.
                                                                         Years 2010 and 2011 saw the lowest annual emissions (∼
                                                                         2×10⁶ T ), though 2010 saw the third highest emissions when
                                                                         looking at individual months (∼ 8.5 × 10⁵ T , March). Years
                                                                         2012 and 2013 saw fairly similar emissions (∼ 2.5 × 10⁶ T ),
                                                                         which supports the fact that emissions are lower during La
                                                                         Niña and ENSO neutral conditions.
                                                                             Over the six years, the highest emissions were generally
                                                                         seen during El Niño years and the drought of 2014. This
                                                                         makes sense as the majority of the fires are expected to be
                                                                         anthropogenic, and dry weather provides ideal conditions for
                                                                         initiating and maintaining burning (Reid et al., 2012, 2013;
                                                                         Oozeer et al., 2016). Lee et al. (2016b) looked at fire seasons
                                                                         and saw that there is anti-correlation between the seasonal
                                                                         variation of fire emissions and that of rainfall, which is likely
                                                                         to be because underground peatland burning may not be im-
                                                                         mediately extinguished by precipitation. This also supports
                                                                         other papers, e.g. Reddington et al. (2014), who looked at
Figure 2. Air history map for 2010–2015, showing where air arriv-        fire/smoke seasons during the period 2004–2009 and found
ing in Singapore during this period originated from. Each shading
                                                                         burning peaked from June to October and February to March,
shows the relative contribution of air to the central receptor site in
                                                                         with the most burning during September–October.
Singapore in percent integrated over the atmospheric column from
0 to 2 km.                                                                   Observations of PM10 in Singapore from 2010 to 2015
                                                                         show an overall background concentration during months of
                                                                         little or no burning of between 23 and 29 µg m−3 at the two
                                                                         monitoring stations. These values fit well with those deter-
so most air arriving in Singapore travelled through Peninsu-             mined in other studies for Singapore. For example, Hertwig
lar Malaysia or the island of Sumatra including Riau. Dur-               et al. (2015) estimated background concentrations for PM10
ing 2013, the same general pattern as 2012 is seen but with              to be around 30 µg m−3 , based on the 2013 haze episode. In
stronger northeasterly and westerly components and a some-               general, both background and peak concentrations vary be-
what weaker southeasterly component when the air history                 tween NTU and TP. Following the approach of Kim et al.
maps show a very small region of influence for the MJJ                   (2015) we assume a constant background of 25 µg m−3 for
season of 2013. The majority of air arriving in Singapore                the PM10 observations at both sites and subtract this value
had travelled only over Peninsular Malaysia or Riau. During              from the observation time series.
other seasons of this year the air in Singapore arrived from                 Subtracting a constant background from the observations
as far away as Vietnam and the Philippines (Fig. A2d). Year              does not give the exact contribution of PM10 from biomass
2014 was characterised by strong northeasterly and south-                burning alone because it does not remove all contributions
easterly components, both of which were stronger than those              from all other sources. However, it does give an indication
for 2013, and a stronger southeasterly component compared                of the periods with increased PM10 concentrations due to
to 2012 (Fig. A2e). The air history map for 2015 (Fig. A2f)              biomass burning. This is not an attempt to perform an at-
shows a strong northeasterly component and the strongest                 tribution of the observed PM10 concentrations in Singapore,
southeasterly component of all six years; these winds brought            as the observations, even with the subtracted background
air from Peninsular Malaysia, Riau and Riau Islands, Suma-               concentration, still include contributions from sources other
tra, Kalimantan, Sulawesi, Java, and the Lesser Sunda Islands            than biomass burning. However, the observations minus the
to Singapore.                                                            constant background compared to the modelled time series
   Analysis of the annual biomass burning PM10 emissions                 provides an indication of the performance of the model and
(Fig. 3) shows that there is a bimodal pattern in the sea-               through that the quality of the input used for the modelling.
sons/months with significant burning and also in the domi-               Using the modelled time series and the related source region
nant source regions. This finding is similar to that of Red-             information we are able to attribute the PM10 contribution
dington et al. (2014), though we see differences in the con-             in Singapore originating from biomass burning in Southeast
tributing source regions and temporal distribution. The most             Asia to the respective source regions.
significant difference between the six years is in the mag-                  Because we are intentionally leaving out sources of PM10
nitude of burning – note the different scales of the verti-              other than biomass burning and there is uncertainty in the
cal axis in Fig. 3. Overall, 2015 and 2014 were the years                biomass burning emissions, we cannot expect perfect scores
with the highest and second highest annual (∼ 6.7 × 10⁶ T                from the valuation metrics presented in Tables 3 and 4. In the
and ∼ 4.2 × 10⁶ T , respectively) and monthly (∼ 2.7 × 10⁶ T ,           present study a significant haze event has been defined as any

www.atmos-chem-phys.net/19/5363/2019/                                                     Atmos. Chem. Phys., 19, 5363–5385, 2019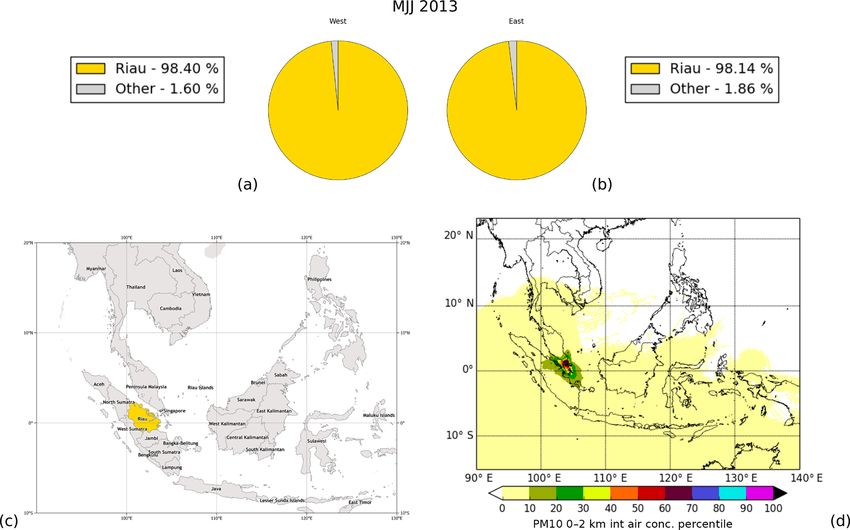
5370                                                                                        A. B. Hansen et al.: Haze in Singapore

Figure 3. Regional PM10 biomass burning emissions, calculated based on GFAS fire radiative power and injection height and emission
factors described in Sect. 2, for each of the six years from 2010 to 2015, summed over each month. Colours for each source region for all
years are listed below the plots. Note the different scales on the y axis (units: tonnes emitted per month).

period lasting more than 1 week with modelled hourly PM10              ries and the observations is very high (0.79 and 0.80 at NTU
concentrations from biomass burning reaching 50 µg m−3 or              and TP, respectively; see Table 3), whereas the correlations
above at least at one of the two monitoring stations. Concen-          for 2010, 2011, and 2012 are very low, which is likely to
trations below 10 µg m−3 are considered negligible in terms            be due to the low biomass burning PM10 emissions and few
of haze events.                                                        haze events. In general it can be seen from the MNMB that
   For years like 2013, which was dominated by one extreme             the model under-predicts, even when taking a constant back-
haze event, the correlation between the modelled time se-              ground value of 25 µg m−3 into account. This makes sense as

Atmos. Chem. Phys., 19, 5363–5385, 2019                                                  www.atmos-chem-phys.net/19/5363/2019/
A. B. Hansen et al.: Haze in Singapore                                                                                        5371

the background in reality cannot be assumed to be constant.         3.1   Atypical haze
We know that we are not capturing all fires, which will lead
to a negative bias, and there are further uncertainties in emis-    During the six years, the most notable atypical haze events
sions, as well as the NWP and dispersion models. It should          occurred in June 2013 and in February, March, and April
be expected that not all model results fall within a factor of 2    2014. Though 2013 was generally a year with weak winds
of the observations, and it is not surprising that the fractional   and average burning, the month of June was very unique,
gross error is around 40 %. It is worth noticing that the FAC2      both in terms of meteorology and burning (Fig. 5). The June
for all years is high (between 0.76 and 0.87), and in general       2013 haze event was caused by a typhoon coinciding with in-
the FAC2 values for the individual events are also very good.       tense burning in Riau (Fig. 3). The air history map for MJJ in
When comparing the scores to other studies such as Chang            Fig. 5 shows that, during this weather event, there was a small
and Hanna (2004) (R = 0.91–0.95, FAC2 = 0.24–0.89) and              source region with air arriving in Singapore from Peninsular
Rea et al. (2016) (R = −0.33–0.92), it is important to keep         Malaysia, Riau Islands, and Sumatra including Riau. This is
in mind that even though the scores presented in Tables 3 and       the only year of this 6-year period with significant burning
4 are relatively lower (specifically R) our statistics are calcu-   in June, though in general the annual emissions are neither
lated for a 3-month period and other studies are for shorter        especially high nor low. In June about 98 % of the modelled
periods focused only on air quality and haze days. Also, for        PM10 emissions reaching the two monitoring stations in Sin-
the results presented here the FAC2 values are mostly bet-          gapore were from Riau. Although the peak concentrations
ter than those of Chang and Hanna (2004) and Rea et al.             observed at NTU were lower than those of the modelled time
(2016). In the results below, the estimated background value        series, overall the concentrations are fairly similar during the
of 25 µg m−3 has been subtracted from all observations. The         event.
time series and pie charts are based on results from the for-          In early 2014, a drought coincided with air arriving in Sin-
ward NAME simulations.                                              gapore from a northeasterly direction and intense burning in
   Looking at PM10 concentrations at the two monitoring             the whole region giving the second highest emissions of the
sites based on the forward simulations (Fig. 4), five years         6-year period. This resulted in unexpected haze in Singapore
(all but 2013) have haze during ASO and three years (2011,          in FMA (Fig. 6). The months with the largest emissions were
2013, and 2014) have some haze in FMA. Year 2013 is the             March and February, which were dominated by emissions
only year with significant haze in June, although the years         from Riau, Laos, Myanmar, Thailand, Cambodia, Peninsular
from 2012 to 2015 all experience some additional PM10               Malaysia, and West Kalimantan (Fig. 3d). In general the re-
from biomass burning in June. When comparing concen-                gion of influence for 2014 covered an area reaching far to the
trations between the two stations it can be seen that the           northeast and slightly southeast of Singapore and was much
concentrations are higher at the western monitoring station         larger than for MJJ 2013 (Fig. 5). During FMA the winds
(NTU) most of the time. Exceptions to this occurred dur-            brought air from Peninsular Malaysia, Riau, Riau Islands,
ing March 2011 and 2014. Of the haze events that occurred           and the Philippines to Singapore. In spite of the larger emis-
from 2010 through 2015, some were insignificant (e.g. dur-          sions from Riau, Laos, Myanmar, Thailand, and Cambodia,
ing FMA 2010, 2012, 2013, and 2015, and MJJ 2012 and                the mainly northerly wind direction resulted in the haze in
2014), i.e. lasting less than a week and with biomass burn-         Singapore being caused mainly by emissions from Peninsula
ing PM10 concentrations below 50 µg m−3 . Some were sig-            Malaysia. The event lasted for about 3 months total and was
nificant but showed very little variation between monitor-          dominated by emissions from Peninsular Malaysia, which
ing stations (ASO 2010, MJJ 2013, FMA 2011 and 2014)                contributed over 90 % of the haze at both monitoring stations,
(Sect. 3.1). The remaining four events (ASO 2011, 2012,             with smaller contributions from Riau, Cambodia, Vietnam,
2014, and 2015) (Sect. 3.2) were significant events with vari-      and Riau Islands.
ation in the main contributing source regions at the two mon-          Common for these two atypical haze events is little vari-
itoring stations. Common for all four events is that they oc-       ation in the source regions across the monitoring stations,
curred during the haze season in ASO during the southeast           most likely due to the atypical and different meteorological
monsoon, when the winds are the strongest for the region            conditions and the clear dominance of one source region.
and the air history maps show the largest region of influence
for air arriving in Singapore.                                      3.2   ASO – southeast monsoon season haze
   Not all peaks in the observations coincide with biomass
burning due to real PM levels also containing anthropogenic         As mentioned previously, the southeast monsoon season oc-
and other biogenic species. However, most peaks in the mod-         curs during ASO and coincides with almost annual haze
elled time series coincide with peaks in observations indicat-      episodes. The two most recent episodes with highest con-
ing that the highest PM10 concentrations are due to biomass         centrations were in 2014 and 2015. In addition to the haze
burning.                                                            event in FMA 2014 discussed above, another haze event oc-
                                                                    curred in 2014 during ASO (Fig. 7). This season saw the
                                                                    largest southeasterly region of influence for air arriving in

www.atmos-chem-phys.net/19/5363/2019/                                                Atmos. Chem. Phys., 19, 5363–5385, 2019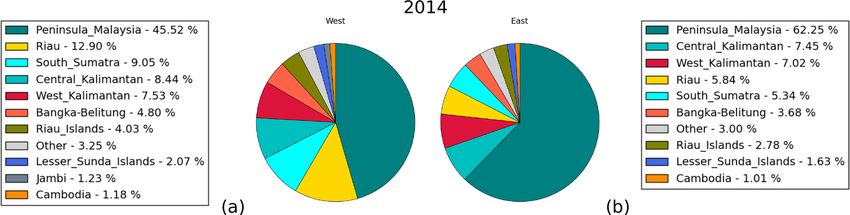
5372                                                                                                  A. B. Hansen et al.: Haze in Singapore

Table 3. Statistics for PM10 , for both the western (NTU) and eastern (TP) monitoring stations and all years. The background concentration
of 25 µg m−3 is subtracted from the observations for all stations for all years. The metrics considered are the Pearson correlation coefficient
(R), the modified normalised mean bias (MNMB), the fractional gross error (FGE), and a factor of 2 (FAC2).

                                2010             2011                2012              2013            2014                 2015
                              NTU      TP   NTU         TP     NTU          TP      NTU       TP    NTU        TP       NTU         TP
                R             0.12   0.12    0.08    0.13      0.17     0.18        0.79    0.80    0.27      0.35      0.44       0.43
                MNMB          0.14   0.17    0.10    0.11      0.09     0.05        0.04    0.12   −0.09      0.07     −0.19       0.01
                FGE           0.39   0.45    0.37    0.35      0.39     0.37        0.37    0.38    0.36      0.36      0.44       0.43
                FAC2          0.83   0.76    0.85    0.86      0.83     0.85        0.84    0.83    0.86      0.87      0.78       0.79

Table 4. Statistics for PM10 , for both the western (NTU) and eastern (TP) monitoring stations, for selected 3-month haze seasons. The
background concentration of 25 µg m−3 is subtracted from the observations for all stations for all seasons. The metrics considered are the
Pearson correlation coefficient (R), the modified normalised mean bias (MNMB), the fractional gross error (FGE), and a factor of 2 (FAC2).

                  2010               2011               2012                2013               2014                  2014                 2015
                  ASO                ASO                ASO                 MJJ                FMA                   ASO                  ASO
              NTU        TP     NTU         TP      NTU        TP       NTU          TP     NTU        TP      NTU          TP      NTU          TP
   R           0.15   0.14      0.08     0.15     0.14        0.14      0.81        0.83    0.30     0.42      0.29      0.40       0.35      0.32
   MNMB        0.12   0.13     −0.07    −0.01    −0.24       −0.22     −0.14        0.03   −0.13    −0.07     −0.31     −0.06      −0.65     −0.47
   FGE         0.41   0.49      0.38     0.34     0.40        0.38      0.40        0.43    0.29     0.30      0.35      0.36       0.71      0.61
   FAC2        0.80   0.72      0.86     0.87     0.83        0.84      0.82        0.78    0.93     0.93      0.76      0.86       0.49      0.60

Singapore during the 6-year period, with air and PM10 from                       stations (NTU, TP) were South Sumatra (38.22 %, 21.82 %),
biomass burning pollution arriving in Singapore from Penin-                      Central Kalimantan (31.19 %, 41.45 %), Bangka–Belitung
sular Malaysia, Riau, Riau Islands, Kalimantan, Java, and                        (11.32 %, 13.64 %), West Kalimantan (6.64 %, 9.41 %), and
the Lesser Sunda Islands during a period of average biomass                      Jambi (6.53 %, 5.98 %).
burning emissions. During the 2 months of September and                             Common for both ASO 2014 and ASO 2015 are the rela-
October the major contributing source regions to PM10 con-                       tively large regions influencing PM10 concentrations in Sin-
centrations in Singapore were Central Kalimantan, South                          gapore and the variation in major contributing source regions
Sumatra, and West Kalimantan (Fig. 3e). ASO is the ex-                           at the two monitoring stations. This is also the case for other
pected haze season; however, this is also one of the seasons                     years with burning and related haze during this season (e.g.
with the highest number of significant contributing source                       2011 and 2012).
regions: South Sumatra, Central Kalimantan, West Kaliman-                           In addition to the four events discussed in detail above,
tan, Bangka–Belitung, Riau, Riau Islands, and the Lesser                         events also occurred during the expected haze seasons in
Sunda Islands (up to 2000 km from Singapore). In spite of                        ASO 2010, 2011, and 2012, as well as during FMA 2011.
the large annual variation (Fig. A3) in the major contributing                   The ASO event in 2010 was, except for significantly lower
source regions between the two monitoring stations, the dif-                     magnitude, fairly similar to the MJJ event of 2013, with an
ference between the relative contributions at the two stations                   unusually small source region for the season and at least
for ASO 2014 is insignificant.                                                   90 % of PM10 concentrations arriving at both monitoring sta-
   The results for ASO 2015 (Fig. 8) show a large, though                        tions in Singapore originating from Riau. The other two ASO
seasonally “normal”, region of influence, which coincided                        events, in 2011 and 2012, were fairly similar to the events of
with extreme emissions. In ASO the southeasterly mon-                            2014 and 2015 with contributions from the expected south-
soon winds brought air from Peninsular Malaysia, Riau Is-                        east monsoon region, a high number of contributing source
lands, Sumatra including Riau, Kalimantan, Sulawesi, Java,                       regions at the two monitoring stations, and variations in ma-
and the Lesser Sunda Islands. During this season the largest                     jor contributing source region between the two stations. The
contributing regions were Central Kalimantan, South Suma-                        remaining event of the period was during FMA 2011, with
tra, and West Kalimantan. The event lasted approximately                         Riau, Peninsular Malaysia, and Cambodia as major con-
2.5 months in ASO 2015, during which the biggest variation                       tributing source regions. Of the seasons with the most signif-
between the two monitoring stations was seen both for 2015                       icant haze events (e.g. MJJ 2013, FMA 2014, ASO 2014, and
and for any season with significant burning. The most sig-                       ASO 2015) in Singapore, the air history maps show that the
nificant source regions at the western and eastern monitoring                    region of influence for Singapore generally covers the largest

Atmos. Chem. Phys., 19, 5363–5385, 2019                                                            www.atmos-chem-phys.net/19/5363/2019/
A. B. Hansen et al.: Haze in Singapore 5373
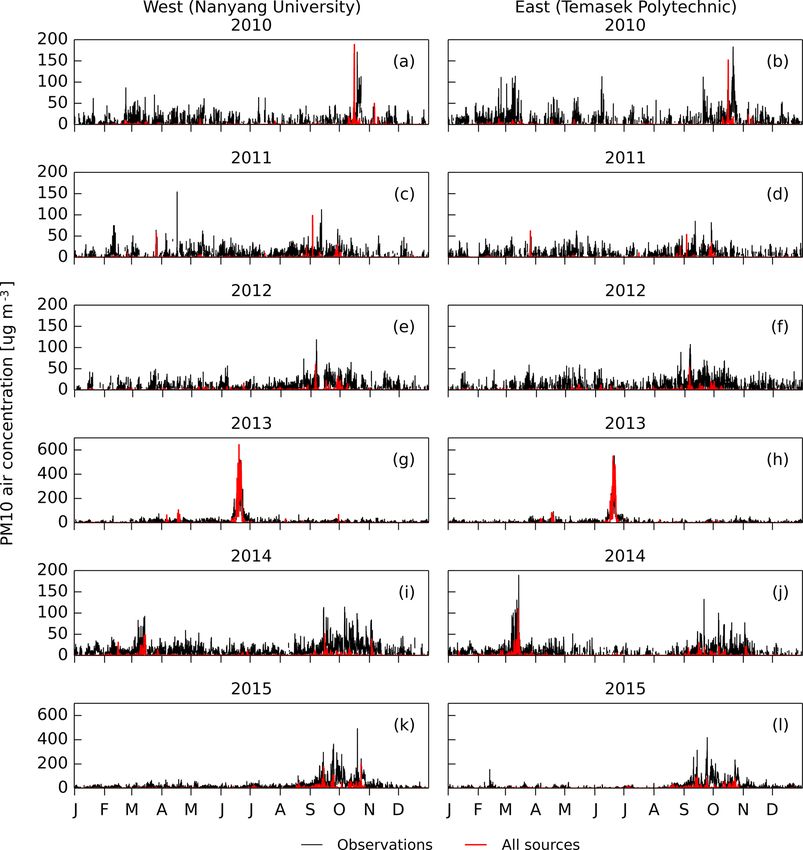
Figure 4. Modelled PM10 time series (red line) with observations (black line) at each of the two monitoring stations west (NTU, left) and
east (TP, right) for the six years with observations available, 2010 (top row) to 2015 (bottom row). A constant background concentration of
25 µg m−3 has been subtracted from the observations and any resulting negative values have been removed.
area during ASO when air is coming from southeasterly di- nam, and on occasion Peninsular Malaysia, whereas autumn
rections. Of the four years (2011, 2012, 2014, 2015) with burning is seen in Central Kalimantan, Jambi, South Suma-
haze events during ASO, 2014 saw the largest region of in- tra, West Kalimantan, and to a lesser extent Aceh and East
fluence. Of the two years with events during FMA (2011 and Kalimantan. Emissions from Riau vary significantly through-
2014) the winds were generally from a northeasterly direc- out the years and individual months, though there are emis-
tion and 2014 was, again, the year influenced by the largest sions from Riau in most months during most years, which is
source region. For seasons with southeasterly winds, but not consistent with the emissions shown in Fig. 3.
during ASO, e.g. 2012 MJJ, the region of influence is rela-
tively small compared to that of ASO. Our results, presented
in Fig. 3, confirm the findings of other studies such as Lee 4 Conclusions
et al. (2016b), who determined the source region for Sin-
gapore to be mainly Sumatra and Borneo (i.e. Kalimantan, In this study we have used the atmospheric dispersion
Sarawak, Sabah, and Brunei). Shi and Yamaguchi (2014) model, NAME, to attribute PM10 concentrations in Singa-
also saw that the biggest emitters include South Sumatra pore caused by biomass burning to their source region. In
and South Kalimantan, showing that spring emissions mainly order to gain a deeper understanding of the causes of haze
originate from Cambodia, Laos, Myanmar, Thailand, Viet- in Singapore we have compared air history maps, showing
where air arriving in Singapore originates from, with mod-
www.atmos-chem-phys.net/19/5363/2019/ Atmos. Chem. Phys., 19, 5363–5385, 20195374 A. B. Hansen et al.: Haze in Singapore Figure 5. This figure shows results for PM10 for MJJ 2013: pie charts for the western (NTU) (a) and eastern (TP) (b) monitoring stations showing major contributing source regions, (c) the regional map highlighting only the major contributing source region, and (d) the air history map showing where the air arriving in Singapore originated from in MJJ 2013. The “Other” category in the pie charts is from sources which individually contribute less than 1 %. elled and observed PM10 concentrations at two monitoring which can be extremely high both spatially and temporally stations located at a western and an eastern location, respec- (Kelly et al., 2018). tively. For those two monitoring stations we have also com- For the four haze events focused on here, there is vari- pared the difference between relative contributions from all ability in the correlation between the modelled and observed of the source regions. time series, with the best correlations seen for haze events The yearly and seasonal variations in emissions of PM10 where the emission sources are close to Singapore. As dis- from biomass burning from the region are not always corre- cussed by Hertwig et al. (2015), uncertainty in these results lated with PM10 concentrations in Singapore. Yet the mod- originates from the emissions and the meteorology. For the elled results confirm that the highest PM10 concentrations former, the uncertainties result from the fact that the emis- in Singapore coincide with haze caused by biomass burn- sions used here are based on one daily snapshot of FRP and ing. The results show that haze in Singapore is impacted by IH, and though some attempts are made to resolve issues with (1) burning emissions under human influence (e.g. Fig. 3); missing fire emissions caused by the lack of transparency of (2) the weather through the monsoon and related winds clouds the data will naturally be incomplete. At the same (Fig. A2); and (3) climate, especially the variations in ENSO, time, hourly emissions are calculated based on this one daily which is also in line with the findings by Reid et al. (2012, snapshot adding a temporal resolution that the data do not 2013). In previous similar studies it has been assumed that provide, which also means that peak concentrations will not the same emission inventory can be used for different years always be captured in the model simulations. The meteo- (Kulkarni et al., 2015; Sobhani et al., 2018), and some attri- rology provides another significant source of uncertainty, as bution studies even used the same meteorology when study- is usually the case in atmospheric modelling. When consid- ing different years (Kim et al., 2015). Our findings demon- ering the resolution of the analysis meteorology used here strate that this is not sensible for biomass burning due to the and the size of Singapore, it is clear that there will be unre- inter-annual variability of both meteorology and emissions, solved features in both topography and in the meteorology Atmos. Chem. Phys., 19, 5363–5385, 2019 www.atmos-chem-phys.net/19/5363/2019/
A. B. Hansen et al.: Haze in Singapore                                                                                                   5375

Figure 6. This figure shows results for PM10 for FMA 2014: pie charts for the western (NTU) (a) and eastern (TP) (b) monitoring stations
showing major contributing source regions, (c) the regional map highlighting only the major contributing source region, and (d) the air history
map showing where the air arriving in Singapore originated from in FMA 2014. The “Other” category in the pie charts is from sources which
individually contribute less than 1 %.

and hence in the dispersion modelling. However, the differ-                  Emissions from many regions contribute to the concentra-
ences we see between the two sites show that we are starting              tions of PM10 in Singapore. The biggest contributors for the
to capture this scale. Uncertainties in the NWP data such as              period 2010–2015 are Riau, Peninsular Malaysia, and South
elevated wind speeds and too-frequent and too-low-intensity               Sumatra, with smaller yet significant contributions from
precipitation will disperse the pollutants further and wash out           Jambi, Cambodia, Bangka–Belitung, Riau Islands, Central
more than should be, resulting in lower modelled concentra-               Kalimantan, and the Philippines. As Riau and Peninsular
tions. These uncertainties naturally have a larger impact over            Malaysia are the nearest neighbours to Singapore and given
longer travel distances, which is reflected in our statistics. It         the local wind pattern this could be expected. Looking at
should also be kept in mind that the observations are mea-                emissions during ASO for the four years with the most vari-
suring all PM10 and we are only modelling primary PM10                    ation across the island (2011, 2012, 2014, and 2015), the
emissions from biomass burning. Other sources of PM10 in-                 largest emissions were seen from Central Kalimantan, South
clude sea salt, dust, secondary organic aerosol, emissions                Sumatra, Jambi, and also West Kalimantan. For events dur-
from industry, local and transboundary road traffic, and do-              ing FMA, Cambodia, East Kalimantan, Myanmar, Thailand,
mestic heating, not all of which are constant throughout the              and Vietnam showed larger emissions.
year. Some of the varying difference between observed and                    We investigated the spatial variation of haze across Sin-
modelled time series is likely to be due to these many other              gapore and found that variation in major contributing source
sources of PM10 in Singapore. However, in spite of these un-              regions across Singapore is dependent on distance to source
certainties our results show that we are able to model dis-               regions: generally a shorter distance to the source region
persion of particulate matter from biomass burning in South-              will mean less variation in the major contributing source re-
east Asia and the resulting haze in Singapore with reasonable             gion(s). We also studied the seasonal variation by looking
confidence.                                                               at four recent events occurring during different seasons and
                                                                          saw that air arriving from a larger geographical area often

www.atmos-chem-phys.net/19/5363/2019/                                                       Atmos. Chem. Phys., 19, 5363–5385, 2019
5376 A. B. Hansen et al.: Haze in Singapore Figure 7. This figure shows results for PM10 for ASO 2014: pie charts for the western (NTU) (a) and eastern (TP) (b) monitoring stations showing major contributing source regions, (c) the regional map highlighting only the major contributing source regions, and (d) the air history map showing where the air arriving in Singapore originated from in ASO 2014. The “Other” category in the pie charts is from sources which individually contribute less than 1 %. brings more variation in major contributing source regions. using higher spatial resolution. This work is a first step to- PM10 concentrations at the two monitoring stations vary sig- wards high-resolution air quality forecasting for Singapore. nificantly in time, both in the observed and modelled time Whilst a chemical transport model would be expected to fully series; from the modelled data it is possible to attribute the capture anthropogenic and secondary particulate contribu- major contributing source regions. These show that for the tions, the inability of this study to capture the magnitude of two haze events not occurring during the ASO haze season, the biomass burning concentrations shows that there is a big- the sources are dominated by the same source region at both ger issue with emissions and potentially also modelled mete- sites, though a different site for the two events. For the two orology. Prior to investing in a full chemical transport model ASO haze events the major contributing source regions at it is important to understand these individual components in the two monitoring sites are mainly the same, but their rela- the simulation. This work contributes towards a better under- tive contribution differ significantly. These variations are also standing of the biomass burning and air quality in the region correlated with the distance to the source regions and the sea- and shows that biomass burning emissions from many dif- son of the haze events. ferent source regions across Southeast Asia can reach Sin- The NAME model is able to provide insight into variations gapore. Accurately capturing these is essential for future air in major contributing source regions at a relatively smaller quality modelling. scale than has been done in previous studies due to its track- In conclusion, we saw that haze events occur during sea- ing capabilities and the Lagrangian nature of the model. Al- sons with both small and large regions of influence, how- though the results struggle to capture the magnitude of the ever, most often during ASO, coinciding with a larger re- haze from burning farther from Singapore, due to errors and gion of influence and often when higher emissions/increased uncertainties in the GFAS data and the meteorological input, burning occurs, resulting in variation in relative contribu- they show the potential for gaining a better understanding by tions from major contributing source regions across Singa- Atmos. Chem. Phys., 19, 5363–5385, 2019 www.atmos-chem-phys.net/19/5363/2019/
You can also read