Spatial variability in heavy metal concentration in urban pavement joints - a case study - SOIL
←
→
Page content transcription
If your browser does not render page correctly, please read the page content below
SOIL, 7, 15–31, 2021

                                                                                                      SOIL
https://doi.org/10.5194/soil-7-15-2021
© Author(s) 2021. This work is distributed under
the Creative Commons Attribution 4.0 License.

        Spatial variability in heavy metal concentration in urban
                     pavement joints – a case study
                               Collin J. Weber, Alexander Santowski, and Peter Chifflard
                    Department of Geography, Philipps University Marburg, 35037 Marburg, Germany
                          Correspondence: Collin J. Weber (collin.weber@geo.uni-marburg.de)

                                   Received: 23 June 2020 – Discussion started: 7 August 2020
                     Revised: 24 November 2020 – Accepted: 30 November 2020 – Published: 15 January 2021

      Abstract. Heavy metals are known to be among one of the major environmental pollutants, especially in urban
      areas, and, as generally known, can pose environmental risks and direct risks to humans. This study deals with
      the spatial distribution of heavy metals in different pavement joints in the inner city area of Marburg (Hesse,
      Germany). Pavement joints, defined as the joint between paving stones and filled with different materials, have
      so far hardly been considered as anthropogenic materials and potential pollution sources in urban areas. Never-
      theless, they have an important role as possible sites of infiltration for surface run-off accumulation areas and
      are therefore a key feature of urban water regimes. In order to investigate the spatial variability in heavy metals
      in pavement joints, a geospatial sampling approach was carried out on six inner city sampling sites, followed
      by heavy metal analyses via inductively coupled plasma–mass spectrometry (ICP–MS) and additional pH and
      organic matter analyses. A first risk assessment of heavy metal pollution from pavement joints was performed.
         Pavement joints examined consist mainly of basaltic gravel, sands, organic material and anthropogenic arte-
      facts (e.g. glass and plastics), with an average joint size of 0.89 cm and a vertical depth of 2–10 cm. In general,
      the pavement joint material shows high organic matter loads (average 11.0 % by mass) and neutral to alkaline pH
      values. Besides high Al and Fe content, the heavy metals Cr, Ni, Cd and Pb are mainly responsible for the con-
      tamination of pavement joints. The identified spatial pattern of maximum heavy metal loads in pavement joints
      could not be attributed solely to traffic emissions, as commonly reported for urban areas. Higher concentrations
      were detected at run-off accumulation areas (e.g. drainage gutters) and at the lowest sampling points with high
      drainage accumulation tendencies. Additional Spearman correlation analyses show a clear positive correlation
      between the run-off accumulation value and calculated exposure factor (ExF; Spearman correlation coefficients
      (rSP) – 0.80; p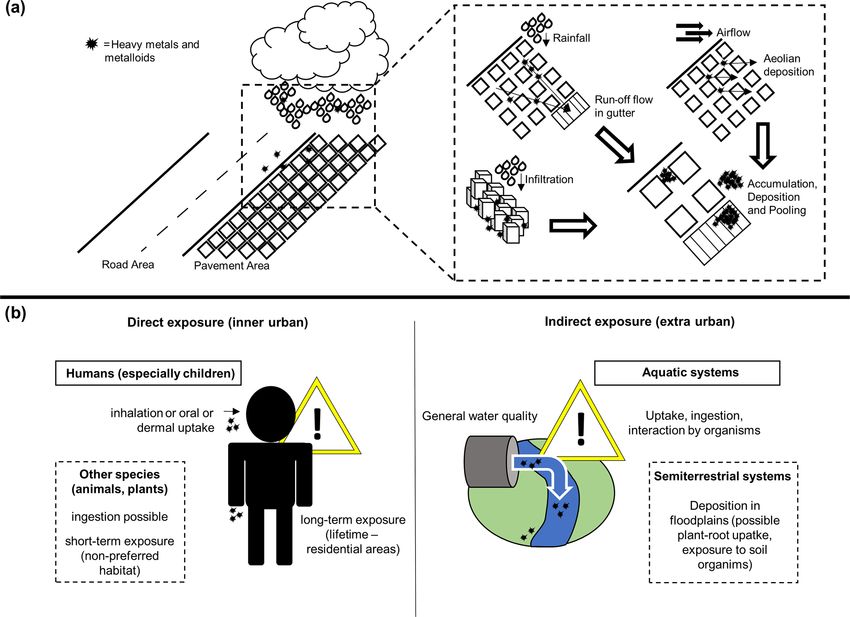
16                               C. J. Weber et al.: Spatial variability in heavy metal concentration in urban pavement joints

1    Introduction                                                  Burghardt (1995), pavement joint material could be defined
                                                                   as a part of the today’s Technosol reference soil group or as
The study of heavy metals as environmental pollutants, and         part of urban soils in general (Burghardt, 1995; Burghardt
their effect on different ecosystems and organisms, forms          et al., 2015; Schad, 2018; IUSS Working Group, 2015). In
a major research field in environmental science (Alloway,          contrast to this, the pavement joint material and its anthro-
2013; Blume et al., 2011, 2016; Craul, 1999). In contrast to       pogenic origin differs from soil in its common definition
other pollutants (e.g. organic pollutants), heavy metals are       in the most cases (e.g. soil functions or soil development;
far more widespread as they are natural components of the          Blume et al., 2016). Regardless of this question of defini-
Earth’s crust (Alloway, 2013). Anthropogenic activity, espe-       tion, pavement joints are a common feature in urban areas,
cially mining, industrial processes, traffic and transport, has    like the paving on pavements, parking lots and access roads,
led to a global increase in heavy metal concentrations in dif-     and are used as a design element in public places. Compared
ferent environmental media like water, air and soil (Cai et al.,   to full sealing, they offer the advantage in that infiltration
2015; Hakanson, 1980; Kowalska et al., 2018; Strode et al.,        is ensured, which plays an important role in the manage-
2009). Along with several emerging threats to the environ-         ment of urban run-off (especially storm water run-off; Sorme
ment, the occurrence and behaviour of heavy metal contam-          and Lagerkvist, 2002; Sansalone et al., 1998; Dierkes et al.,
ination in soils poses significant challenges for soil ecosys-     2005). In this context, they could also be seen as the only an-
tems. Next to the extreme consequences of heavily contami-         thropogenic material which assumes important functions in
nated soils (e.g. dead soil in former mining areas or industrial   extremely sealed inner urban areas, like the interaction with
sites), the presence of heavy metals poses a risk for environ-     the atmosphere or as substrate for lower plants (Munzi et al.,
mental security, food production, soil organisms and human         2014; Seaward, 1979; Wang et al., 2020). Beside these im-
health (Gałuszka et al., 2014; Strode et al., 2009). It is in      portant functions of pavement joints, pollution of joints mate-
this context, and the long-term research on heavy metals in        rial could pose several risks for the environment and humans.
soils, that many of today’s management practices have be-          On the one hand, direct exposure to humans (e.g. playing
come established. Taking Germany as an example, various            children) or indirect exposure (e.g. urban dust) are thinkable.
regulations and laws deal with the topic of heavy metals and       On the other hand, the potential transport of heavy metals
provide recommendations or legislated limits regarding con-        from pavement joints to urban environments through run-off
centrations for soils (e.g. federal soil protection ordinance;     could affect water ecosystems or even agricultural land (e.g.
Bundesregierung, 1998; Blume et al., 2011).                        deposition in floodplains during floods) far outside the urban
   In addition to the natural occurrence of heavy metals in        centres. For these reasons, a pollution assessment of pave-
soils, urban areas and their soils are particularly exposed to     ment joints becomes very important.
anthropogenic heavy metal sources. Emissions from indus-              If one considers the pollution of urban soils or pavement
trial or home incinerators, traffic, garbage and construction      joint material, however, then urban water management must
materials could all be seen as the major sources of heavy met-     also be included because, with surface and subsurface run-
als in urban areas (Gunawardena et al., 2015; Craul, 1999;         off, sealed or partially sealed surfaces and urban soils be-
Manta et al., 2002; Sansalone et al., 1998; Defo et al., 2017;     come a source of pollutants and may pollute urban waters.
Lu and Bai, 2010; Mahanta and Bhattacharyya, 2011). Al-            Therefore, a number of studies have focused on the water
though it is possible to distinguish between point sources         quality of surface run-off from urban areas that have been
(e.g. industrial exhaust fumes) and diffuse sources (e.g. brake    sealed or partially sealed (Drake and Bradford, 2013; Drake
abrasion and corrosion), urban areas are often very densely        et al., 2014). Sorme and Lagerkvist (2002) examined waste
built up and heavily exploited, resulting in extensive con-        water, and Sansalone et al. (1998) researched urban roadway
tamination throughout the area (Manta et al., 2002). There-        storm water, with a focus on heavy metals. With a focus on
fore, it is not surprising that the contamination status has be-   urban water and effluent flow, Gilbert and Clausen (2006)
come an important key feature of urban soils (Lehmann and          studied drainage from different road surfaces, and Wessolek
Stahr, 2007). In contrast to the extensive research of heavy       et al. (2009) examined drainage and pollution in sealed ar-
metal contamination in soils generally, the number of studies      eas (Gilbert and Clausen, 2006; Wessolek et al., 2009). In
specifically investigating urban soils is still small (Burghardt   summary, their findings show that surface run-off generally
et al., 2015; Schad, 2018).                                        has high concentrations of heavy metals, hydrocarbons and
   Pavement joints, defined as the joint space between two         further trace elements. However, the studies so far focused
or several pavement pieces and often filled by gravel, sand        on parking areas or roads, and few studies mention the pave-
and organic material, fulfil important functions in urban en-      ment joints of sealed or partially sealed surfaces as an urban
vironments. Basically, the question arises whether this ma-        interface, which can act as a source or sink of heavy metals
terial could be named urban soil, urban soil material or if it     (Dierkes et al., 1999, 2004, 2005). Furthermore, the pollu-
must be seen as an anthropogenic material without soil prop-       tion retention capability of pavement joints has mostly been
erties. In terms of the World Reference Base (WRB) for Soil        determined in laboratory tests and not in the field (Fach and
Resources update in 2015 and the work on urban soils from          Geiger, 2005). Thus, the understanding of their long-term ca-

SOIL, 7, 15–31, 2021                                                                    https://doi.org/10.5194/soil-7-15-2021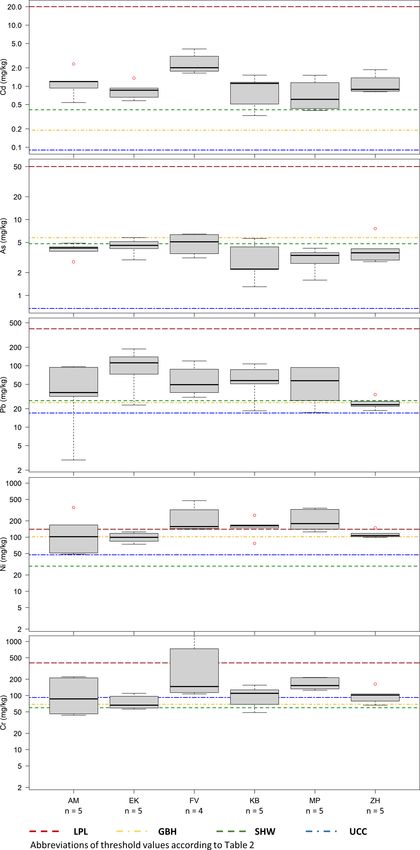
C. J. Weber et al.: Spatial variability in heavy metal concentration in urban pavement joints                                     17

pacity to retain heavy metals is still limited (Zhang et al.,       and the locations of the main employers), the traffic volumes
2018). Apart from this, the question of whether already in-         reach levels above the limits at rush hours.
stalled and used pavement joints, not only in car parks but            For the investigation of the spatial variability in the pres-
also, for example, on pavements, contain accumulated heavy          ence of heavy metals in pavement joints, we based our se-
metals, still remains unclear (Dierkes et al., 2005).               lection of possible study sites, firstly, on the traffic volume
   In this paper, we report on a case study in the inner city       and, secondly, on the location of other possible sources of
area of Marburg (Hesse, Germany). The goals of our study            heavy metals. As traffic emissions, and especially brake abra-
were (1) the implementation of a heavy metal pollution as-          sion or exhaust fumes, are regarded as the main sources of
sessment of pavement joints distributed in an inner city area,      heavy metals on road sites, traffic volume and shielding from
which, to our best knowledge, represents the first assessment       roads are important factors for the limitation of heavy metal
considering diverse installed pavements and different sam-          emission (Duong and Lee, 2011; Gunawardena et al., 2015).
pling sites, and (2) to empirically depict possible sources and     However, other sources like house emissions, run-off and
mobilities of heavy metals in pavement joints with a geospa-        weathering of urban-installed materials (e.g. the pavement
tial approach. The results of this study should improve the         itself) should also be considered as possible sources (Gu-
understanding of the heavy metal contaminations in pave-            nawardena et al., 2015). Based on this, we aimed to investi-
ment joints, which is necessary for the development of tar-         gate sites that exhibited (1) differences in traffic volume and
geted urban land management strategies.                             (2) difference in the distance to roads and (3) are represen-
                                                                    tative of the different types of paving and construction used
                                                                    within the inner city zone.
2     Material and methods
                                                                       Following these criteria, the following six sampling sites
2.1    Study area
                                                                    were chosen across the inner city zone (Figs. 1, S2): Ketzer-
                                                                    bach road (KB) and Zwischenhausen road (ZH) as parallel
Our case study was conducted in the inner city area of Mar-         streets, while KB is an arterial road and ZH is a side road with
burg (Hesse, Germany) located 75 km north of Frankfurt.             very low traffic volume in a low traffic area; Elisabethkirche
The city of Marburg covers an area of 123.91 km2 , including        (EK), a square around a medieval church with no direct traffic
suburban areas (Hessisches Statistisches Landesamt, 2019;           but exposed on two sides to streets which carry a heavy vol-
Fig. 1). With 67 851 inhabitants (620 persons km−2 ; Hes-           ume of traffic; Audimax (AM) square and the parking area at
sian average: 297 persons km−2 ), the city of Marburg is the        the Schwanhof (FV), which are private places without traffic
eighth-largest city in Hesse. The city is a central town in a ru-   but are also exposed to streets; and Marktplatz (MP), which
ral region. Land use is divided into settlement areas (14.9 %),     is the centre of the medieval district of Marburg, in a low traf-
traffic areas (7.5 %) and vegetation containing green spaces,       fic area with a high volume of pedestrian traffic. The site MP
forests and agricultural areas (76.5 %; Hessisches Statistis-       is located on a hillside that is clearly above the main traffic
ches Landesamt, 2019). In contrast to the greater city area,        routes and completely shielded by buildings.
the inner city consists of a medieval town centre with dense
urban structures surrounded by residential, university and          2.2   Pavement joint material sampling
commercial districts. Traffic in the inner city is composed
of local public transport, delivery traffic and individual traf-    This study aims to investigate the spatial variability in heavy
fic. Various main streets with high traffic volumes, espe-          metals in urban pavement joints at six study sites located
cially during rush hours, alternate with low traffic zones and      in the inner city of Marburg and selected according to the
squares. Unfortunately, the database on traffic counts is very      above-mentioned criteria (Table 1). At each site, five com-
limited. A traffic census conducted by the Hessen Mobil road        posite pavement joint material samples from a 1 m2 pave-
and traffic management agency in 2015 counted 44 195 vehi-          ment area were taken out of the pavement joints (Fig. S1).
cles per 24 h (national highway B3, which passes the city           The sampling was carried out with a metal spatula (stain-
from north to south), 11 728 vehicles per 24 h (main road           less steel) and plastic spoon. Material was collected from the
L3125, located in the south of Marburg) and 6145 vehi-              joints to a depth of 2 to 7 cm in five places on each 1 m2
cles per 24 h (main road L3092, located in the northwest            site. Each composite sample was stored in airtight plastic
of Marburg; Fig. 1; Hessen Mobil, 2015). All census points          (PE) bags until further analyses. Sampling points were se-
are located at city area entry roads. A second census con-          lected randomly, with the aim of covering the respective sam-
ducted by the city administration in 2019 counted 13 039            pling area. At site FV and AM, the sampling points follow a
vehicles per 24 h for an inner city main road (Ketzerbach,          straight line between street and the next main building. The
along with sampling site KB; Bürgerversammlung Marbach,             distance to the nearest road was measured during fieldwork.
2019). Out of this limited data set, the traffic volume in the      The material structure in pavement joints was documented
city area of Marburg could be regarded as moderate com-             according to German soil classification standards (Ad-hoc
pared to similar-sized cities. However, by concentrating traf-      AG Boden, 2005) and international soil classification stan-
fic on certain main routes (resulting from urban development        dards (FAO, 2006; IUSS Working Group, 2015). In addition,

https://doi.org/10.5194/soil-7-15-2021                                                                      SOIL, 7, 15–31, 2021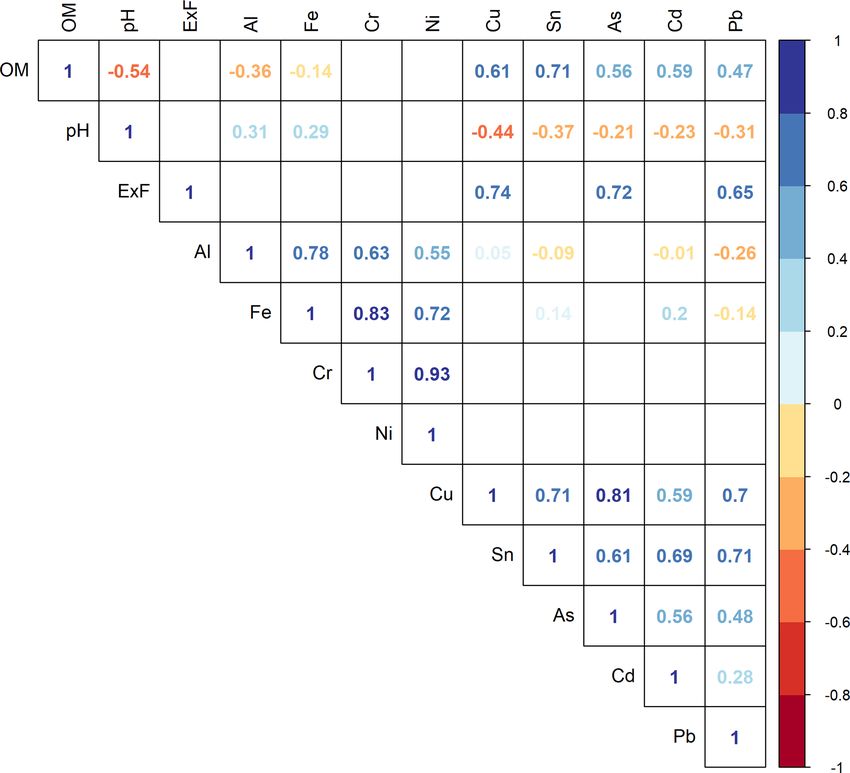
18                                C. J. Weber et al.: Spatial variability in heavy metal concentration in urban pavement joints

                                                                     ing fieldwork. Substructure was finally determined by the re-
                                                                     moval of individual paving stones.

                                                                     2.3   Laboratory analyses

                                                                     All soil samples were oven-dried at 105 ◦ C for 24 h. After-
                                                                     wards, each sample was ground by mortar and sieved through
                                                                     a 2 mm stainless steel mesh. The content of the organic mat-
                                                                     ter (OM) was measured by loss of ignition (DIN ISO 19684-
                                                                     3:2000-08; Deutsches Institut für Normung e.V., 2000). The
                                                                     pH value was determined in potassium chloride (KCl), with a
                                                                     pH 91 electrode (WTW, Weilheim, Germany), in accordance
                                                                     with DIN ISO 10390:1997-05 (Deutsches Institut für Nor-
                                                                     mung e.V., 2000).
                                                                        Pseudo-total concentrations of the metals (Al and Fe),
                                                                     heavy metals (V, Cr, Co, Ni, Cu, Sn, Cd and Pb) and
                                                                     the metalloid As was performed after the digestion of a
                                                                     1 g prepared subsample with 20 mL aqua regia (12.1 M HCl
                                                                     and 14.4 M HNO3 ; ratio 1 : 3; DIN ISO 11466:2006-12).
                                                                     Metal content was quantified with an inductively coupled
                                                                     plasma–mass spectrometry (ICP–MS; XSERIES 2; Thermo
                                                                     Fisher Scientific, Bremen, Germany). The ICP–MS system
                                                                     was calibrated with a certified multi-element standard solu-
                                                                     tion (ROTI® STAR; Carl Roth GmbH, Karlsruhe, Germany).
                                                                     Each digest of a soil sample was measured three times and
                                                                     averaged. The resulting mean metal concentrations were
                                                                     converted into units (mg kg−1 ). Relative standard deviation
                                                                     (RSD) was quantified for all single measurements after three-
                                                                     fold measurements to account for data reproduction and the
                                                                     effects of heterogeneous matrixes (Weihrauch, 2018; Voica
Figure 1. Study area map composition. (a) Inner city area of Mar-    et al., 2012). Data with an RSD ≥ 20 % were excluded from
burg. (b) Sampling site Schwanhof (FV) in the southwestern area of   further evaluation (Thomas, 2001).
the inner city. Data source: © OpenStreetMap contributors 2020 and
Hessian Administration for Soil Management and Geoinformation.
Distributed under a Creative Commons BY–SA License.                  2.4   Statistics and data evaluation

                                                                     Basic statistical operations were carried out using Microsoft
                                                                     Excel 2016 (Microsoft, Redmond, USA), R (R Core Team,
                                                                     2019) and RStudio (Version 3.5.3; RStudio Inc.; Boston,
the joint size and the size and type of installed stones were        MA, USA). Additional analyses of height data from lidar
determined. Slope, potential run-off accumulation and abso-          measurements were carried out with ArcGIS (Esri, Redlands,
lute heights (metres above mean sea level) were determined           USA) and QGIS (QGIS Development Team).
by field measurement and additional height data from lidar              A major problem during the risk assessment for urban
measurements (Hessian administration for land management             soils and pavement joint material is the absence of urban
and geoinformation, 2019). Potential run-off accumulation            geochemical background values of heavy metal contamina-
was classified according to the following: 0 – no accumula-          tion. Natural soils and anthropogenic urban soils are only
tion (slopes > 2◦ ; highest point at site); 2.5 – moderate ac-       hardly comparable in terms of soil development or soil pro-
cumulation (slope < 2◦ ; no specific feature); and 5 – high          cesses (Burghardt et al., 2015). Out of this circumstance,
accumulation (no slope; lowest point at site, drainage gutter        we decided to perform a three-step risk assessment based
or discharge way). Furthermore, the vegetation coverage of           on the (1) comparison of heavy metal concentrations (given
pavement joints by mosses, lichens and small vascular plants         in mg kg−1 ) with worldwide values, (2) comparison with
was classified (no vegetation – 0; very low coverage < 1 % –         the available legal requirements and (3) comparison with re-
1; low coverage < 2 % – 2; medium coverage < 10 % – 3;               gional geochemical background values from natural soils and
strong coverage < 50 % – 4; very strong coverage > 50 % –            soil substrate. As a first approach, however, due to the lack of
5). The distance from each sampling point to the next traffic        comparative values, there is only the possibility to attempt an
frequented street (distance to next road) was measured dur-          approximation, which is also done in order to enable compar-

SOIL, 7, 15–31, 2021                                                                       https://doi.org/10.5194/soil-7-15-2021
Table 1. Sampling site and pavement joint features. Note: Ketzerbach road – KB; Zwischenhausen road – ZH; Elisabethkirche – EK; Audimax – AM; Schwanhof – FV; Marktplatz –
MP.
Sampling Site features Sampling Distance to Pavement features
station points street (m)
Usage Traffic Slope Pavement material Average joint Plant pH OM∗
size (cm) coverage (KCl)
EK Pedestrians; square Not directly frequented, but Medium (2–5◦ ) 1 57.02 Sandstone paving stones 0.87 0 6.54 10.30
around church surrounded by 2 55.42 50 × 37 cm on basalt gravel 1.40 4 6.31 9.84
https://doi.org/10.5194/soil-7-15-2021
busy streets 3 21.48 1.26 2 5.64 14.66
4 15.49 0.91 3 7.18 9.85
5 13.82 0.86 2 6.95 –
AM Pedestrians; square Not directly frequented, single Medium (2–5◦ ) 1 4.17 Concrete paving stones 0.90 0 – 4.74
around the university very busy road alongside 2 6.14 40 × 40 cm on basalt 0.45 1 – –
building 3 8.60 Gravel and sand 0.55 1 6.91 11.12
4 30.56 0.55 1 – 19.44
5 56.00 0.30 0 7.52 –
ZH Pedestrians and traffic; Directly frequented; Low (0–2◦ ) 1 Points directly to the street Sandstone paving stones 1.06 1 7.35 3.55
side street low traffic area 2 25 × 20 or 35 × 20 cm 0.83 1 7.81 –
3 On basalt gravel and sand 0.93 0 7.60 –
4 0.94 0 6.99 2.00
5 0.93 1 – 3.29
KB Pavements on a main Very busy road alongside; Low (0–2◦ ) 1 6.84 Sandstone paving stones 1.20 3 6.44 5.94
road 13 039 vehicles (24 h; 2019) 2 6.89 25 × 20 or 35 × 20 cm 1.27 4 6.94 10.55
3 4.66 On basalt gravel and sand 1.47 3 6.80 3.02
4 11.00 1.41 4 7.16 5.41
5 8.90 1.43 3 – 5.66
MP Pedestrians, historic Directly frequented, low Low (0–2◦ ) 1 21.46 Sandstone and basalt paving 0.57 1 7.53 7.03
square in the city centre traffic area 2 19.83 Stones (heterogenous) 1.28 1 7.23 8.41
3 9.50 0.86 1 7.97 5.19
4 9.70 1.23 2 7.32 6.01
C. J. Weber et al.: Spatial variability in heavy metal concentration in urban pavement joints
5 7.35 1.47 1 6.97 9.49
FV Delivery traffic; Individual traffic only; Medium (2–5◦ ) 1 3.41 Concrete on basalt gravel 0.34 1 6.20 32.69
carriage entrance side road ahead 2 8.36 0.41 1 6.48 28.14
for a company 3 14.04 0.35 0 9.44 12.09
4 18.55 0.31 1 4.01 38.08
∗ OM – organic matter (mass – %).
SOIL, 7, 15–31, 2021
1920 C. J. Weber et al.: Spatial variability in heavy metal concentration in urban pavement joints
isons with other studies. For step one, we took the worldwide 3 Results and discussion
general levels of heavy metal and metalloid concentrations
for soil surface horizons (SHW; Kabata-Pendias, 2011) and 3.1 Pavement joint properties
the composition in the upper continental crust (UCC; Rud-
nick and Gao, 2003). The legal precautionary level (LPL) for Pavement joints are common in urban and suburban areas;
residential areas and sandy substrate of natural soils (with- they are purely anthropogenic in origin and, therefore, linked
out land use differentiation) given by the German Federal to human settlement. The build-up material of pavement
Soil Protection Ordinance (Bundesregierung, 1998; Bund- joints consists of mineral components (gravel and sand),
/Länderarbeitsgemeinschaft Bodenschutz, 2003) were ap- organic components (organic matter) and artefacts (glass,
plied in step two. Even if these values are comparatively waste and plastics). Based on their properties, it could be
old, they are nevertheless valid according to the legislation distinguished between the substructure of pavements and the
in Germany. Finally, we compare our data with regional geo- anthropogenic material in pavement joints itself, which can
chemical background values from natural soils. Even though be considered as an upper pavement structure.
the pavement material is not comparable to natural soil, nat- The pavement joints in the inner city of Marburg are
ural materials are used in its construction. For this reason, mainly built up sands with basaltic gravel. From the sur-
we have examined the materials used for most of the pave- face, starting with a thin layer (< 0.5 cm) of organics (of-
ment joints in the study area. These materials are firstly the ten mosses, lichens and single plants) and organic material,
substructure of basalt gravel (origin – alkaline basalt; Vogels- the major part is built up of sands or sandy loams, with or-
berg, Westerwald mountains) and sand for the first filling of ganic material and artefacts (waste fragments and glass frag-
the pavement joints (origin – sand and gravel pits; Lahn val- ments). A layer of sand or basaltic gravel (partly mixed) fol-
ley). From this, we have calculated a geogenic background lows further down, with concrete or mortar in a few places.
value (GBH) by averaging the background values for soils Even if the pavement material or substrate could not be clas-
from regional volcanogenic substrates (n = 94) and exter- sified as a soil in common understanding, the WRB (2015)
nal sand substrates (n = 64) for topsoil and subsoil in Hesse provides the possibility for classification of those materi-
(Friedrich and Lügger, 2011). als. According to WRB classification system, each pave-
Besides the description of the spatial distribution based on ment joint could be classified as Ekranic, Urbic, and Isolatic
basic data evaluation, we have calculated the exposure factor Technosol (Arenic and Humic) or Linic, Urbic, Isolatic and
(ExF) according to Babelewska
˛ (2010) Eq. (1) as follows: Hyperskeletic Technosol (Arenic and Humic; IUSS Work-
ing Group, 2015). Overall, the material built up in pavement
X Cn − Cav
y= , (1) joints is very young and has not been undisturbed by conver-
Cav sion measures for long periods.
The average lateral joint size is 0.89 cm (± 0.15), with a
where Cn is the content of heavy metal at a sampling point,
vertical depth of 2–10 cm. The most common pavement ma-
and Cav is the average content of heavy metal at the sam-
terial installed is sandstone (natural paving stones), followed
pling site. This index is based on the absolute measurement
by concrete and basalt paving in different size ranges (Ta-
data, without the inclusion of geochemical background con-
ble 1). Plant coverage in joints is heterogenous and occurs in
tent like other heavy metal pollution indices, and provides in-
small or medium coverage classes (Table 1). Thus, organic
formation in which, in a given study area, the highest metal
matter varies widely, with a total average of 11.10 % by mass
loads are located (Kowalska et al., 2018). The ExF values
and a standard deviation of 9.25 %. Maximum values above
were compared with absolute terrain heights given in metres
30.0 % by mass occur at single points at sampling station
(above sea level – a.s.l.) to proof possible metal transport and
FV. The extent of variability is explained by the variety of
accumulation through surface run-off on pavements.
growth upon pavement joints, the building age of the pave-
To further investigate the possible accumulation of heavy
ment areas and the joint size. For example, wide pavement
metal and their spatial variability in pavement joints, we
joints with a massive growth of moss and other vegetation
tested for different correlations between our data set. Spear-
have a high OM content. However, younger, smaller joints,
man correlation analyses and tests for normal distribution
filled only with sand or brash, show overall less OM content.
(Shapiro–Wilk test) were performed with the R-packages
As pavement joints are affected by dust and even light plant
“graphics”, “stats” and “corrplot” (R Core Team, 2019;
growth, higher organic matter content is typical, like in urban
Wei and Simko, 2017). Interpretation of significant (p ≤
soils (Lehmann and Stahr, 2007).
0.05) Spearman correlation coefficients (rSP) was carried out
The pH in pavement joints ranges between 4.01 and 9.44
according to the following criteria: weak (rSP 0.4 ≤ 0.6),
(average – 6.97). These overall neutral to slight or medium
clear (rSP 0.6 ≤ 0.8) and strong (rSP >0.8; Zimmermann-
alkaline properties can be traced back to the general sur-
Janschitz, 2014).
rounding of alkaline materials (e.g. plaster itself and con-
crete; Räsänen and Penttala, 2004; Björk and Eriksson,
2002). Additionally, the basaltic under bed could be another
SOIL, 7, 15–31, 2021 https://doi.org/10.5194/soil-7-15-2021C. J. Weber et al.: Spatial variability in heavy metal concentration in urban pavement joints 21
factor, as regional basaltic rocks are highly alkaline (Jung than the comparative values and, in the case of Sn, 245.4
and Masberg, 1998). Like OM enrichment, this pH range is times greater than SHW and UCC.
specific to urban soils (Lehmann and Stahr, 2007). This exceeding of the values is generally not surprising,
In general, these young anthropogenic materials, which as each sampling site is exposed to different anthropogenic
partly fulfil the characteristics of urban Technosols, appear heavy metal sources. Besides the release of heavy metals, ei-
in a wide variety, resulting from different materials and con- ther by dust or gas in urban areas through incineration, there
struction conditions (e.g. size and substructure). Overall, are other traffic-associated sources (Bryan Ellis and Revitt,
pavement joints are individually small in size, but through 1982; Duong and Lee, 2011). For example, Cd, Cr and Ni, as
their widespread occurrence, they account for a large propor- a product of combustion of fossil fuels, can reach pavement
tion in urban areas, especially as the only interface between joints through emissions (Duong and Lee, 2011). Pb, Cu and
the atmosphere and urban substructure (e.g. in heavily sealed Sn are strongly associated with traffic emissions (fossil fuel)
areas). or the abrasion from brake pads and tyres (Duong and Lee,
2011; Yan et al., 2013). For the spatially narrow inner city
3.2 Heavy metal pollution of pavement joints
area, both larger point sources and a large number of diffuse
sources must be considered with this in mind, and the highest
All 11 metals studied were detected in each of the sam- concentrations of heavy metals coincided with typical urban
ples taken and analysed via ICP–MS. In general, the rela- source patterns. Although increased contamination is typi-
tive standard deviation of metal concentrations ranging be- cal for urban soils (Schad, 2018; Lehmann and Stahr, 2007),
tween 0.71 % and 2.84 % indicates that our data are clus- partial concentrations can also be attributed to the materials
tered around mean values with a small overall variation. Only used in pavement construction. Jung and Masberg (1998) no-
the content of the trace metals Al (35853.00 mg kg−1 ) and ticed high concentrations of Ni, Cr and Co for mafic volcanic
Fe (65968.50 mg kg−1 ) reached absolute maximum values. rocks from the Vogelsberg mountains, located next to the city
Both elements are ubiquitous in each of the soil and rock of Marburg, which have important quarries for regional con-
materials. In addition, the high values of Al and Fe are a struction activities (Fach and Geiger, 2005).
result of the fact that the under bedding of each pavement In contrast to this significant excess of geochemical back-
is basaltic grit, which, when weathered, releases Al and Fe grounds, the heavy metal concentrations do not exceed any
at an increasing rate through decay of the rock (Bain et al., of the legal precautionary levels for residential areas (Bun-
1980). desregierung, 1998). Only the maximum values of Cr and Ni
From the 11 metals measured, six heavy metals (Cr, Ni, and the third quartile value of Ni (168.3 mg kg−1 ) are above
Cu, Sn, Cd and Pb) and the metalloid As will be included the given LPL values and, therefore, approximately 25 % of
in the results analysis as they show comparatively high val- the samples. As the given LPL values are the legal basis for
ues. Additionally, global and local geochemical background the need for action in case of soil contamination in Germany,
values for natural soils and legal comparison values are avail- the data indicate that there is no need for countermeasures
able for these metals. Primarily, the concentrations decrease on a legal basis. However, as the LPL values are on average
from Sn over Ni, Cr, Cu, Pb and As to Cd (Table 2). 9.6 times greater than the mean values of Cr, As, Cd and Pb in
Starting with the general comparison on a global level, pavement joints, it seems to be difficult to achieve a status in
average and median concentrations of each heavy metal ex- which action must be taken at the legal level. Apart from this,
ceed the average concentration in natural soil surface hori- taking into account other values of the legislation without a
zons worldwide (Kabata-Pendias, 2011; Table 2). This cir- direct need for action, like the preventative values for natu-
cumstance is also based on the fact that the heavy metal con- ral soils or preventative thresholds for sandy substrates, both
centrations also exceed the assumed metal concentration in values are exceeded by the average concentrations of Cr, Ni,
the upper continental crust (Rudnick and Gao, 2003). In con- Cd and Pb (Bundesregierung, 1998). Furthermore, the range
trast, the As concentration is significantly higher than the of Cr and Ni concentrations were above the preventative val-
average SHW value but lower than the UCC value. These ues for playgrounds (200 mg kg−1 Cr; 70 mg kg−1 Ni; Bun-
comparisons are only possible to a limited extent, as these desregierung, 1998) at five sampling points for Cr (27 sites
are very general global mean values, but they are neces- for Ni, respectively). Irrespective of the fact that there is no
sary as proper background values for pavement joints or ur- need for countermeasures at the legal level, the fact that the
ban anthropogenic substrates and soils are lacking. A bet- comparative values and less strict legal values were exceeded
ter approximation can be achieved by comparing the heavy indicates that a potential risk for humans and urban and extra-
metal concentrations with the geochemical background in urban environments cannot be excluded. Further discussion
Hessian soils (Friedrich and Lügger, 2011). The average con- about a first risk assessment for pavement joints is given in
centration of Cr, Ni, Cu, Cd and Pb exceeds the calculated Sect. 3.5.
GBH values, whereas As stays below the value. When sum-
marised, the heavy metal loads in pavement joints are, on av-
erage, 3.6 (SHW), 4.4 (UCC) and 2.9 (GBH) times greater
https://doi.org/10.5194/soil-7-15-2021 SOIL, 7, 15–31, 202122 C. J. Weber et al.: Spatial variability in heavy metal concentration in urban pavement joints
Table 2. Summary of metal and heavy metal concentrations (given in mg kg−1 ) in pavement joints compared to natural background levels
and legislative values.
n = 29 Cr Ni Cu Sn As Cd Pb
mg kg−1
Mean 157.1 160.2 101.7 560.2 3.9 1.2 61.4
Median 109.7 140.3 94.4 387.6 4.0 1.1 50.9
Min. 43.4 48.5 35.7 104.6 1.3 0.3 2.9
Max. 1290.3 474.3 252.5 3728.1 7.6 4.1 187.7
SD 220.6 97.4 54.9 647.1 1.4 0.8 43.5
SHWa Average content surface horizons worldwide 60.0 29.0 38.9 2.5 0.67 0.41 27.0
UCCb Composition in upper continental crust 92.0 47.0 28.0 2.1 4.8 0.09 17.0
GBHc Geochemical background in Hessian soils 68.8 101.5 26.3 – 5.7 0.19 25.5
LPLd Legal precautionary level for residential areas 400.0 140.0 – – 50.0 20.0 400.0
a Kabata-Pendias (2011); b Rudnick and Gao (2003); c Calculation explained in Sect. 2, according Friedrich and Lügger (2011); d German Federal Soil
Protection Ordinance – BBodSchV (1998). Note: SD – standard deviation.
3.3 Spatial variability in heavy metal pollution the main sources of urban heavy metal pollution and accu-
mulation in pavements, it is interesting that the maximum
Different studies dealing with the topic of heavy metal con- concentrations are reached at FV (sidewalk and private drive-
tamination of pavement or urban soils have noted the signifi- way at secondary road) and MP (historic market place; low
cant influence of (a) spatial traffic differences (e.g. traffic vol- traffic area). In both cases, no particular exposure to traffic
ume and braking points at crossings) and/or (b) land use (e.g. or contamination-promoting land use (e.g. industry) can be
industrial sites versus parks) and/or, if considering urban run- identified. However, exposure to traffic could play an impor-
off (especially storm water run-off), (c) the distance to inlets tant role for sites AM and EK as both sites, though not used
or other emission sources as the major drivers for spatial pat- directly by vehicles, are exposed to major roads. In compar-
terns of urban heavy metal pollution (Bryan Ellis and Revitt, ing the locations KB and ZH, the heavy metal concentration
1982; Duong and Lee, 2011; Herngren et al., 2006; Tedoldi at KB is 2.5 times the values from ZH. This finding could be
et al., 2017; Logiewa et al., 2020). Through the selection and traced back to the higher traffic frequency at site KB (major
distribution of our sampling sites and points, we can give re- road) in contrast to side road ZH (Manta et al., 2002). In-
sults for the spatial distribution of heavy metals in pavement dividual differences between the five sampling points at site
joints on two spatial levels, namely level one, with a differen- KB are explained by stop and go traffic as levels of Cu, Cd,
tiation between sampling sites located in the inner city area and Pb are often higher in areas around traffic lights, and Ni
of Marburg, and level two, including the comparison of sin- and Cu are attributed to braking (Duong and Lee, 2011). The
gle sampling points at each site with its neighbourhood and locations EK and MP are low traffic areas, and the highest
distance to different heavy metal sources. concentration at EK is reached at EK-3, which is the near-
Comparing the individual metal concentrations on the spa- est point to both heavily used streets (Fig. S2). The low-
tial level one, the concentrations of Cd, Pb and Ni exceed est concentration is reached at EK-5, a sample point which
the SHW and UCC levels at each sampling site (Fig. 2). The is shielded from the streets by the church and where traffic
average As values at each site range between the SHW and emission sources cannot fully reach, as Hagler et al. (2011)
UCC level, whereas the average Cr values exceed both values noted in their study. At site MP, the highest level is clearly
at four sampling sites. Also, the regional geochemical back- reached at MP-4 and MP-5. They are the only sample points
ground for natural soils is exceeded for all metals (except As) with higher concentrations. MP-4 is located directly in a rain-
at the main number of sampling sites. Out of these findings, water drainage channel, and MP-5 is subject to a lot of sur-
a general pollution of pavement joints in the inner city area face run-off. At site AM, maximal values are reached for Cr,
could be concluded. Ni, Cu and Pb next to the major street (AM-1 and AM-2;
However, within this general pollution, differences be- Fig. S2). As sampling site AM was a linear one, AM-5 (great-
tween sampling sites and points occur. Maximal levels of est distance to street) also shows higher values, especially
Cd, Ni, Cr as well as Sn are reached at site FV, followed by for Cd, and the second-highest pollution load index (PLI) is
MP and AM. Although the median values are quite narrowly recorded at this site, whereas the other linear sampling site,
spaced, the differences become clear in the maximum values. FV, reflects an alternative trend. At site FV, the highest con-
Considering traffic emissions (a) or a specific land use (b) as
SOIL, 7, 15–31, 2021 https://doi.org/10.5194/soil-7-15-2021C. J. Weber et al.: Spatial variability in heavy metal concentration in urban pavement joints 23
Ni (residential area) are reached by 100.0 % of sampling
points at FV and 80.0 % at KB and MP (Fig. 2). The
legal maximum value for Cr (playground) is reached at a
maximum of 40.0 % of all points at site AM and MP. It
could therefore be concluded that single pollution hot spots
occur in the inner city area of Marburg. The origin of these
hot spots cannot be attributed exclusively to traffic, as stated
in the majority of other studies dealing with heavy metals in
urban soils (Yan et al., 2013; Herngren et al., 2006; Duong
and Lee, 2011; Bryan Ellis and Revitt, 1982).
The Spearman correlation between the distance from each
sampling point to the next traffic-frequented street (distance
to the next road), shows weak positive correlations for Sn
and Pb in subordinate data (all sampling sites; Table 3). Ad-
ditional single sampling, site-specific significant correlations
occur at site AM for Cd, at site EK for Ni and site KB for
Sn. Besides these results, the correlation between distance to
the next road and the ExF is not significant for subordinate
and specific data. Therefore, it can be concluded that traffic
emissions do not seem to be the main reason for the spatial
distribution of heavy metals.
Another possible factor in understanding the distribution
patterns could be urban drainage and surface run-off, includ-
ing storm water run-off, as drainage could be a possible trans-
port medium for heavy metals on paved areas (Gilbert and
Clausen, 2006; Tedoldi et al., 2017). The sites AM and FV
are examples in which the influence of slope and drainage
for the distribution of heavy metals in pavement joints can be
monitored. The highest individual metal concentration and
ExF values are reached at the lowest section in these areas
and near drainage gutters (Fig. 3). FV has a consistent slope
from FV-1 to FV-3. Only FV-4 is located beyond the gutter
on a flat section. Site AM presents a similar case because
sample point AM-2, with higher concentrations, is also the
lowest point and near the gutter. The samples were taken in
a straight line from AM-1 near a road, over a gutter to AM2
and across a permanent incline to a second gutter (AM-5) in
front of a building.
An additional Spearman correlation analysis was carried
out to test these relationships between potential run-off accu-
mulation and absolute height (above mean sea level) of each
sampling point, with metal concentrations and the ExF (Ta-
Figure 2. Concentrations of the heavy metals (given in mg kg−1 ) ble 4).
Cd, Pb, Ni and Cr, with the metalloid As, according to sampling Overall, strong positive correlations (p < 0.05) were
sites and different thresholds according Table 2.
found between run-off accumulation value and the ExF
and Cr values. Additional clearly positive correlations were
found for Ni, Cu, Sn, As and Pb (Table 4). However, the cor-
centration of each heavy metal and pollution index is FV-3 relation with absolute heights (metres above mean sea level)
followed by FV-4. Both sites are located furthest from the shows no clear subordinate correlations. For the sites AM,
road. MP and FV, a clear trend is apparent when plotting abso-
Considering maximum heavy metal loads, the highest con- lute heights against ExF data (Fig. 3). The highest pollution
centrations are reached at point FV-3 for Ni (474.3 mg kg−1 ), loads are reached at the sites clearly at the lowest point. In the
Cr (1290.3 mg kg−1 ), Sn (> 3000 mg kg−1 ) and Cd case of site MP, the highest ExF value is reached by the sam-
(4.1 mg kg−1 ), followed by MP-4 and MP-5 and AM-2 with pling point with largest terrain height. As concluded from
additional higher loads. Critical legal maximum values for fieldwork, sampling point MP-5 is higher but has the high-
https://doi.org/10.5194/soil-7-15-2021 SOIL, 7, 15–31, 202124 C. J. Weber et al.: Spatial variability in heavy metal concentration in urban pavement joints
Figure 3. Exposure factor (ExF) according to sampling point height (metres above mean sea level) for all sampling sites with significant
height differences. (a) Sampling site AM; (b) sampling site EK; (c) sampling site FV; (d) sampling site MP. Linear trend is shown as a red
dashed line.
est potential run-off accumulation as it is reached by a larger have strong to weak positive correlations among themselves.
surface run-off area above and is located next to discharge From these findings, based on significant inter-element re-
points in the pavement or drainage gutters. In the case of site lationships, the data set could be divided into group 1 (Al,
EK-1 and EK-4, with medium terrain height for the site, they Fe, Cr and Ni) and group 2 (Cu, Sn, As, Cd and Pb). Other
show highest ExF values, which could also be traced back authors suggest that strong inter-element relationships could
to the location of drainage gutters on site. This result is con- be traced back to a combined metal pollution from similar
trary to other findings, as Tedoldi et al. (2016) reported the long-term sources (Manta et al., 2002; Lu and Bai, 2010).
highest accumulation of heavy metals at inflow points as a Therefore, group 1 and group 2 metals may have a different
consequence of filtration capacity. origin or different controlling factors (Dragović et al., 2008).
Next to those inter-element relationships, different cor-
relation clusters with OM and pH could allow suggestions
3.4 Accumulation and mobility tendencies of heavy about metal, metalloid and heavy metal retention in pave-
metals in pavement joints ment joints as both values could be important controlling fac-
Each sampled pavement joint in the inner city of Marburg tors. First of all, the pavement joint substrate, built up from
shows an alkaline soil milieu and high organic matter (OM) sands and coarse gravel with artefacts, allows only poor ad-
content (Table 1). Additional correlation analyses of OM sorption of heavy metals on clay minerals, silt or pedogenic
content and pH with metal concentration reveal two groups oxide surfaces (Blume et al., 2016; Alloway, 2013). In con-
with significant relationships (p = < 0.05) but opposite and trast, the high content of OM could lead to the sorption on
reversed conditions (Fig. 5). Group 1, including the trace humic substances and the formation of metal–humus com-
metals Al and Fe, shows slightly weak negative correlations plexes (Herms and Brümmer, 1984; Alloway, 2013). In this
with OM and weak positive correlations with pH. Accord- context, we interpret the clear to strong positive correlation
ingly, group 2, including Cu, Sn, As, Cd and Pb, shows clear between group 2 metals (Cu, Sn, As, Cd and Pb) and OM as
positive correlation with OM and weak negative correlation being evidence of those processes. The adsorption was also
with pH. The weak negative correlations are consistent with found in urban soils for Cu and Pb but not for Cd (Mahanta
the findings from urban soils in which no significant corre- and Bhattacharyya, 2011). Also, Defo et al. (2017) found a
lation occurs (Manta et al., 2002) Additional clear to strong major influence of OM on the retention of Pb and Cd in urban
positive correlations between metals themselves appear be- soils (Defo et al., 2017). These different findings stayed in
tween Al, Fe, Cr and Ni. In contrast, there are very weak neg- line with the fundamental role of OM for Pb and Cu sorption
ative and positive correlations of these metals with the group in soils (Lee et al., 1998; McLaren et al., 1983). The overall
of Cu, Sn, As, Cd and Pb. In addition, Cu, Sn, As, Cd and Pb neutral to alkaline pH milieu (6.97 total average) supports a
SOIL, 7, 15–31, 2021 https://doi.org/10.5194/soil-7-15-2021C. J. Weber et al.: Spatial variability in heavy metal concentration in urban pavement joints 25
Table 3. Spearman correlation between distance to next road, exposure factor (ExF) and metal concentrations.
Variable A Variable B All sampling sites AMa EKa KBa MPa
Spearman ρ p Spearman ρ p Spearman ρ p Spearman ρ p Spearman ρ p
Distance to OMb 0.50 0.01 1.00 0.00 0.00 1.00 0.10 0.87 −0.10 0.87
next road (m) pH −0.15 0.50 1.00 0.00 −0.20 0.80 0.80 0.20 0.30 0.62
ExFc 0.12 0.55 0.20 0.78 0.60 0.35 0.70 0.23 -0.40 0.51
Cr −0.21 0.27 −0.60 0.28 −0.70 0.19 −0.60 0.28 −0.60 0.28
Ni −0.27 0.16 −0.60 0.28 −0.90 0.04 −0.60 0.28 −0.70 0.19
Cu 0.32 0.09 −0.50 0.39 0.60 0.28 0.20 0.75 −0.40 0.50
Sn 0.52 0.00 0.70 0.19 0.60 0.28 0.90 0.04 −0.50 0.39
As 0.20 0.29 0.20 0.75 −0.50 0.39 −0.20 0.75 −0.20 0.75
Cd 0.07 0.73 0.90 0.04 0.60 0.28 0.80 0.10 −0.70 0.19
Pb 0.58 0.00 0.40 0.50 0.60 0.28 0.50 0.39 −0.40 0.50
a Sampling sites; b organic matter; c exposure factor.
Table 4. Spearman correlation between run-off accumulation value,
exposure factor (ExF) and metal concentrations for sampling points
at sites significant height differences (sites – AM, FV, and MP).
Variable A Variable B Spearman ρ p value
Run-off ExF∗ 0.80 0.00
accumulation Cr 0.80 0.00
value Ni 0.76 0.00
Cu 0.76 0.00
Sn 0.65 0.01
As 0.61 0.02
Cd 0.35 0.21
Pb 0.68 0.00
∗ ExF – exposure factor.
fixation of metals by specific bindings since unspecific bonds
and dissolutions only occur at more acidic pH values (Herms
and Brümmer, 1984; Blume et al., 2016). Comparing the op-
Figure 4. Spearman correlation matrix for organic matter (OM),
posite relationships of group 1 and group 2 metals with addi- pH, exposure factor (ExF) and elemental concentrations in pave-
tional inter-element relationships, we conclude that there is a ment joints. Spearman’s ρ is displayed in the grid if the correlation
medium-fixated group of metal complexes including Al, Fe, is significant (p value < 0.05). Positive correlations in blues; nega-
Cr, and Ni with weaker relationships to the controlling fac- tive correlations in reds.
tors OM and pH (medium potential mobility; less adsorption
tendency) and a partially more fixed group of Cu, Sn, As, Cd
and Pb with stronger relationships to the controlling factors ering points (Bryan Ellis and Revitt, 1982). Even if the major
(low potential mobility; strong adsorption tendency). heavy metal share with the metalloid As could be seen as be-
Out of the correlation analyses and the additional ing accumulated and more or less fixed by OM and pH con-
widespread spatial pollution with comparatively high con- ditions, this accumulation can become especially problem-
centrations of different metals in pavement joints, an accu- atic in the case of strong surface storm water run-off through
mulation of metals in pavement joints could be stated. Avail- precipitation. If urban surface or storm water run-off is re-
able sorbents, the alkaline environment and a constant supply garded as a major driver for heavy metal transport and ac-
of heavy metal emissions from a minimum of two different cumulation at the lowest points, further transport after the
main sources, provide suitable conditions for pollution ac- infiltration in pavement joints seems to be possible. Parti-
cumulation. This point deserves special attention, as other cle uptake and transport as suspended load as a major pro-
authors have noted heavy metal enrichment by organic ma- cess and the transport as dissolved metals in surface run-off
terial, especially in gutters, which would demonstrate a link for the less fixed metal group as a secondary process could
between transport by water and accumulation at run-off gath- be possible (Gilbert and Clausen, 2006). Applying this on a
https://doi.org/10.5194/soil-7-15-2021 SOIL, 7, 15–31, 202126 C. J. Weber et al.: Spatial variability in heavy metal concentration in urban pavement joints
larger scale, and considering urban pavements as pollution Under the considerations of the given limitations of this
sources for the environment out of urban areas, polluted ur- study, we conclude the following main issues as being im-
ban run-off could provide a link between both systems as portant for a general risk assessment (regarding Sect. 3.1–
especially storm water run-off is discharged directly into re- 3.4): (a) metal contamination of urban pavement joint ma-
ceiving waters from urban areas, so less polluted environ- terial with single spatial hot spots from multiple sources is
ments like rivers, wetlands and floodplains in downstream given, even if legal precautionary levels are only exceeded by
areas may also be affected. Therefore, a risk for agricultural single maximum concentrations, (b) spatial distributions of
land in alluvial zones, and for river ecosystems, is conceiv- metal concentration are given, indicating inner urban trans-
able. port and accumulation of metals through surface run-off, and
(c) pavement joint properties and statistical relationships are
3.5 Contamination pathways and risk assessment for given, indicating fixation and accumulation tendencies for
heavy metal pollution in urban pavement joints heavy metals in pavement joints.
When combining these findings with previous research,
Heavy metals as environmental pollutants could pose a wide each contamination pathway starts with a potential source for
variety of potential risks for different ecosystems, plants and heavy metals in urban areas. Even if this study can only give
animals (Alloway, 2013; Blume et al., 2011, 2016; Craul, limited estimations on possible sources (e.g. no direct rela-
1999). Even if different metals act as important trace metals tionship to traffic emissions), different authors take various
(e.g. Ni, Co and Cu) for organisms, increased or excessive potential sources into account (e.g. emissions and construc-
concentrations in combination with the hazardous and toxic tion material; Gunawardena et al., 2015; Craul, 1999; Manta
properties of other metals (e.g. As and Cd) lead to the need et al., 2002; Sansalone et al., 1998; Defo et al., 2017; Lu and
for risk assessments of heavy metals in the environment (Al- Bai, 2010; Mahanta and Bhattacharyya, 2011). Independent
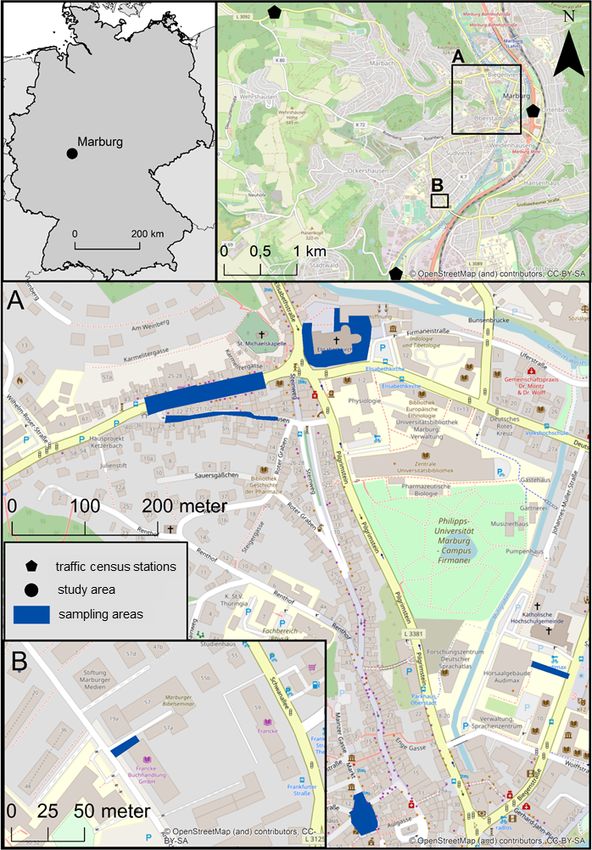
loway, 2013). of the specific source, three different processes result from
Common practices developed for risk assessment of heavy the presented data, which could be responsible for the ob-
metal pollution in natural soils are based on the considera- served accumulation (Fig. 5a), namely rainfall followed by
tion of various direct and indirect contamination and expo- surface run-off or infiltration on the one hand and airflow on
sure pathways (e.g. soil–human and soil–plant; Blume et al., the other hand. Starting with processes which require wa-
2016). Additionally, exposure time and potential doses or up- ter as a transport medium, the transport of metals in a dis-
take quantities are important factors when evaluating poten- solved form or as suspension freight is conceivable. The pos-
tial risks. Furthermore, negative influences on soil functions sible flow distance is limited at the surface by the network
must be assessed (Gałuszka et al., 2014; Strode et al., 2009). of drainage units (e.g. gutters and gullies) and the compar-
Often rules and limit values from legislation can be used atively high infiltration capacity of paved areas. Infiltration
for this purpose, such as the precautionary values for soils rates from the literature for different urban substrates range
from the German Federal Soil Protection Act applied in this between 80 and 2000 cm h−1 (permeable interlocking con-
study (Bundesregierung, 1998; Blume et al., 2011). Various crete pavers; Bean et al., 2007) or 1.2 and 577.1 cm h−1 (per-
geochemical indices (e.g. geoaccumulation index, pollution vious concrete; Chopra et al., 2010) and could be named as
load index and ecological risk index) are also applied to as- highly heterogenous based on the structure properties. This
sess the potential contamination (e.g. ecological risk index; transport processes, especially during heavy rainfall events
Kowalska et al., 2018): due to the high sealing in inner urban areas, can lead to the
In the case of urban pavement joints and their contami- accumulation and deposition of metals in the pavement joint
nation with heavy metals, common tools and practices need material and to initial accumulation in puddles or further
to be reconsidered for a risk assessment. Geochemical in- transport into the urban sewage system. In addition, trans-
dices for natural soils based on geochemical background val- port by airflow is conceivable as a further process, especially
ues cannot be applied purposefully due to the lack of data and under dry conditions. High heavy metal contents in road
studies, as there is no basis for comparison. Limit and thresh- dust are already known (Christoforidis and Stamatis, 2009;
old values based on legislation can be applied but may un- Duong and Lee, 2011; Logiewa et al., 2020). Under dry and
derestimate potential risks, as inner urban areas are preferred windy conditions, pavement joints, which are mostly open
living areas for humans and lead to long-term exposure to and not covered with plants, can theoretically lead to a con-
urban pollutants (United Nations, 2019). The combination of stant alternation of transport and deposition, which can be in-
expected long-term or lifetime exposures and the worldwide tensified by urban wind systems and heat islands (Grimmond
increase in urban population highlights the necessity for a and Oke, 1998; Arnfield, 2003; Vardoulakis et al., 2003).
first risk assessment on pavement joint pollution (United Na- With the consideration of these transport or migration pro-
tions, 2019). cesses, direct and indirect exposures, additionally divisible
by spatial units, could occur for heavy metals in pavement
joints (Fig. 5b).
SOIL, 7, 15–31, 2021 https://doi.org/10.5194/soil-7-15-2021C. J. Weber et al.: Spatial variability in heavy metal concentration in urban pavement joints 27
Figure 5. Risk assessment for heavy metal pollution in urban pavement joints. (a) Potential contamination pathways of heavy metals in
urban pavement joints. (b) Potential risk exposures from heavy metals from urban pavement joints.
For inner urban areas, direct exposure to humans, espe- al., 2020). In addition, heavy metals may also reach semiter-
cially to children, through inhalation or oral or dermal up- restrial systems (e.g. floodplains) and their soils and enter
take is conceivable. From the legislation side, no trigger or further contamination paths (e.g. plant–root uptake) through
action thresholds are exceeded by the detected heavy metal flooding (Miller, 1997).
concentrations, which indicates a low exposure risk (Bun- The potential contamination pathways and risks posed by
desregierung, 1998; Blume et al., 2016). In contrast, the low heavy metal contamination in urban pavement joints can be
exposure risk could be higher than assumed when taking the described as manifold, which leads to a clear demand for
long-term exposure for humans into account. As pavement more research in this field in order to conduct precise risk as-
joints are primarily built in residential areas, those areas are sessments. Based on the present study, we estimate the risk
simultaneously preferred living areas, which makes a daily of direct exposures within our study area to be low. Never-
exposure possible for a lifetime (Luo et al., 2012; Li et al., theless, there is also a risk for non-urban areas, which should
2014). The direct exposure to other species like animals or not be neglected. More intensive use of urban areas during
plants is more difficult to assess, since urban areas are not the increasing extreme weather events caused by climate change
preferred habitat of most species here. The uptake of metals (e.g. heavy rain, flooding and heat) can intensify the risk of
is basically conceivable; the risk of damage is probably low heavy metal discharge and the negative impacts on important
(Munzi et al., 2014; Wang et al., 2020). aquatic ecosystems (IPCC, 2018). Finally, the question arises
In addition to these potential risks, there are other indi- as to whether the risk for urban ecosystems and urban habi-
rect exposures outside the inner urban area. As a result of tats and for functions of the pavement joints (e.g. infiltration
the transport processes mentioned above, heavy metals can and heavy metal retention) should be reassessed in the future.
quickly pass through waste water into rivers, especially dur-
ing heavy rainfall events. The consequences of heavy metal
inputs into aquatic systems from urban or other sources (e.g. 4 Conclusions
mining sites) are well known (Sansalone et al., 1998; Sorme
and Lagerkvist; 2002; Atanackovic et al., 2013). As a re- In our study, pavement joints, mentioned as an important part
sult, the quality of the water can deteriorate significantly, of the urban soils, were found to be polluted by Cr, Ni, Cu,
and there are many negative influences on aquatic organ- Cd and Pb at each sampling site, as shown by absolute con-
isms (Atanackovic et al., 2013; Sakson et al., 2018; Zhang et centrations. Despite the limitations mentioned, a spatial com-
parison showed that traffic emissions are not the main cause
https://doi.org/10.5194/soil-7-15-2021 SOIL, 7, 15–31, 2021You can also read