Paleoecology of the Rhinocerotidae (Mammalia, Perissodactyla) from Béon 1, Montréal-du-Gers (late early Miocene, SW France): Insights from dental ...
←
→
Page content transcription
If your browser does not render page correctly, please read the page content below
Palaeontologia Electronica
                        palaeo-electronica.org

 Paleoecology of the Rhinocerotidae (Mammalia, Perissodactyla)
 from Béon 1, Montréal-du-Gers (late early Miocene, SW France):
        Insights from dental microwear texture analysis,
               mesowear, and enamel hypoplasia
       Manon Hullot, Yves Laurent, Gildas Merceron, and Pierre-Olivier Antoine

                                                         ABSTRACT

                 The late early Miocene Béon 1 locality has yielded an abundant vertebrate fauna
            with more than 5,000 remains assigned to four rhinocerotid species: the stem rhinocer-
            otine Plesiaceratherium mirallesi, the teleoceratines Prosantorhinus douvillei and
            Brachypotherium brachypus, and the early-diverging elasmotheriine Hispanotherium
            beonense. Such a profusion of closely related large herbivore species co-occurring
            raises questions about habitat capacity and niche partitioning. To investigate potential
            niche partitioning of Béon 1 rhinocerotids, we studied their ecology through texture
            microwear (short-term diet proxy), mesowear (long-term diet proxy), and enamel hypo-
            plasia (environmental stress proxy). The mesowear revealed no significant differences
            between the species, with low scores suggesting browsing preferences, while
            microwear suggested subtle dietary variations. We concluded that Plesiaceratherium
            mirallesi and Prosantorhinus douvillei were browsers probably consuming a lot of
            leaves, while Brachypotherium brachypus and Hispanotherium beonense were mixed-
            feeders. Concerning hypoplasia, the overall prevalence was high at Béon 1, with more
            than 25 % of the teeth affected (216 teeth out of 832). There were, however, huge dis-
            crepancies depending on the species, tooth loci, or type of hypoplasia considered.
            Interestingly, H. beonense had the greatest dietary flexibility and the lowest hypoplasia
            prevalence (13.04 %). Both teleoceratines were very affected by hypoplasia, suggest-
            ing whether a comparable high sensitivity to stress (phylogeny) or similar habitat-
            related stresses (environment). The most affected loci were p4 (48.15 %), m3 (46.81
            %), and D4 (46.15 %), reflecting vulnerability periods around weaning, environment-
            related, and near birth, respectively.

Manon Hullot. Institut des Sciences de l'Évolution, UMR5554, Université de Montpellier, CNRS, IRD,
EPHE, Place Eugène Bataillon, CC064, 34095 Montpellier, France. manon.hullot@gmail.com
Yves Laurent. Muséum de Toulouse, 35 Allées Jules Guesde, F-31000 Toulouse, France.
Yves.LAURENT@toulouse-metropole.fr

Hullot, Manon, Laurent, Yves, Merceron, Gildas, and Antoine, Pierre-Olivier. 2021. Paleoecology of the Rhinocerotidae (Mammalia,
Perissodactyla) from Béon 1, Montréal-du-Gers (late early Miocene, SW France): Insights from dental microwear texture analysis,
mesowear, and enamel hypoplasia. Palaeontologia Electronica, 24(2):a27. https://doi.org/10.26879/1163
palaeo-electronica.org/content/2021/3433-beon-1-rhinocerotids-ecology

Copyright: August 2021 Palaeontological Association.
This is an open access article distributed under the terms of Attribution-NonCommercial-ShareAlike 4.0 International (CC BY-NC-SA
4.0), which permits users to copy and redistribute the material in any medium or format, provided it is not used for commercial
purposes and the original author and source are credited, with indications if any changes are made.
creativecommons.org/licenses/by-nc-sa/4.0/
HULLOT ET AL.: BÉON 1 RHINOCEROTIDS ECOLOGY

Gildas Merceron. PALEVOPRIM, UMR 7262, CNRS, Université de Poitiers, 86073 Poitiers, France.
gildas.merceron@univ-poitiers.fr
Pierre-Olivier Antoine. Institut des Sciences de l'Évolution, UMR5554, Université de Montpellier, CNRS,
IRD, EPHE, Place Eugène Bataillon, CC064, 34095 Montpellier, France. pierre-
olivier.antoine@umontpellier.fr

Keywords: environmental stress; feeding ecology; General Linear Mixed Models (GLMM); niche
partitioning; rhinocerotids; ungulates, rhinoceros, France
Submission: 21 April 2021. Acceptance: 6 August 2021.

                   INTRODUCTION                               ences (Schulz et al., 2007; Jones and DeSantis,
                                                              2017; Rivals et al., 2020).
     Using multiple approaches for addressing a
                                                                    The locality of Béon 1 (Montréal-du-Gers,
question proves to be useful in paleontology
                                                              Occitanie, France; Figure 1) is dated from the late
because it allows for yielding more robust results
                                                              early Miocene, about 17 million years ago and cor-
and broader insights. Despite that fact, many stud-
                                                              responding to the upper part of the MN4 of the
ies remain centered around one method only,
                                                              European Neogene Mammal zones system
which may lead to misinterpretations (Jones and
                                                              (Antoine and Duranthon, 1997; Rage and Bailón,
DeSantis, 2017). For instance, both microwear and
                                                              2005; Antoine et al., 2018). The locality landscape
mesowear are diet-related proxies, but they are rel-
                                                              is reconstructed as an oxbow lake surrounded by a
evant at different time scales (Davis and Pineda-
                                                              wooded savannah-like biome (Duranthon et al.,
Munoz, 2016). The study of mesowear alone,
                                                              1999; Rage and Bailón, 2005). It has yielded an
which is a cumulative over-life dietary signal (Ack-
                                                              abundant and diverse vertebrate fauna, including
ermans et al., 2020), might miss seasonal varia-
                                                              five species of rhinocerotids (Crouzel et al., 1988;
tions or near-death modifications of the diet, while
                                                              Antoine and Duranthon, 1997; Duranthon et al.,
microwear alone, which documents the diet during
                                                              1999; Orliac et al., 2006; Antoine et al., 2018). Four
the last days to weeks (Grine, 1986; Winkler et al.,
                                                              of these species – Plesiaceratherium mirallesi
2020), might only reveal a subset of dietary prefer-

FIGURE 1. Location map of Béon 1 locality, Montréal-du-Gers (MN4; mid-Orleanian, late early Miocene, south west-
ern France). The locality of Béon 1 is located (red circle) on the map of France (upper left corner) and on the zoom of
south western France. Main cities (grey circles; bold) and rivers are indicated on the zoomed map. Dashed line rep-
resents the Spain-France frontier. Modified from Antoine and Duranthon (1997).

2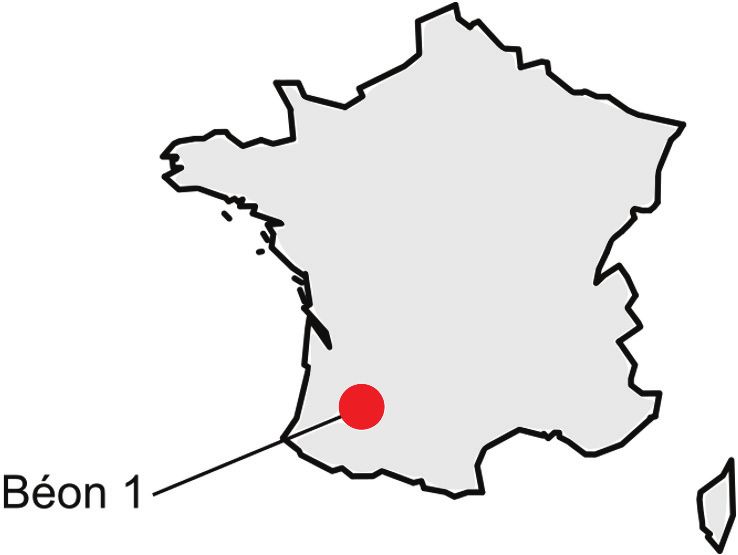
PALAEO-ELECTRONICA.ORG

(abbreviated Pl. mirallesi hereunder), Prosantorhi-      (10-100 km2 in extant species; Owen-Smith, 1988)
nus douvillei (abbreviated Pr. douvillei hereunder),     without necessarily being their preferred habitat.
Brachypotherium brachypus, and Hispanotherium            Eventually the few differences between the δ18O of
beonense – are documented by abundant dental             both teleoceratine species, thought to live in the
samples, with over 1000 teeth found either isolated      same habitat (swamp), might be due to different
or in tooth rows (Antoine and Duranthon, 1997;           dietary preferences with different oxygen content
Antoine et al., 2000; Hullot and Antoine, 2020).         (Bentaleb et al., 2006). All these previous findings
The postcranial material is also abundant (Antoine,      point towards niche partitioning of Béon 1 rhinocer-
2002), and it allows for considering the following       otids.
minimum number of individuals (MNI): five individu-           To investigate the ecology and the eventual
als of B. brachypus, 40 of Pr. douvillei, 38 of Pl.      niche partitioning of these four rhinocerotid species
mirallesi, and seven of H. beonense, for a total MNI     from the Miocene locality of Béon 1, we used sev-
equaling 90. Regarding other herbivore mammals,          eral approaches on the abundant dental material.
Béon 1 locality yielded proboscideans, such as the       For this matter, multi-proxy approaches proved
deinotheriid Prodeinotherium bavaricum and the           successful in revealing subtle niche partitioning in
elephantoid Gomphotherium gr. sylvaticum                 extant species (Merceron et al., 2021). Our
(Antoine and Duranthon, 1997; Tassy, pers. comm.         approach combined dental microwear textures
2021), a wide array of ruminants (Duranthon et al.,      analyses (DMTA), mesowear, and enamel hypo-
1995) and suoids (Orliac, 2006; Orliac et al., 2006),    plasia. Microwear (DMTA) and mesowear allowed
and a three-toed equoid (Anchitherium aurelian-          for assessing dietary preferences at two different
ense; Crouzel et al., 1988). This species-rich herbi-    time scales (short term for microwear and long
vore assemblage is interpreted as resulting from         term for mesowear), and enamel hypoplasia
an attritional accumulation and most specimens           revealed stress vulnerability. The objectives of this
originate from a single 15-50 cm thick dark clay         paper were to: i) characterize the dietary prefer-
layer, distributed over a 500 m2 surface, in one         ences of Béon 1 rhinos, ii) investigate intraspecific
piece (Antoine and Duranthon, 1997; Duranthon et         stress vulnerability, and iii) reveal subtle details of
al., 1999; Hullot and Antoine, 2020). Indeed,            niche partitioning and competition.
numerous marks of trampling are observed on cra-
nio-dental and postcranial remains, most being                            ABBREVIATIONS
compatible with three- and four-toed rhinocerotid
feet (see Hullot and Antoine, 2020 for further                 For teeth, lowercases refer to lower teeth and
details on geology and taphonomy of the locality).       uppercases to upper teeth as follows: d/D – decid-
As such, it offers a perfect setting for testing         uous teeth, p/P – permanent premolars, m/M – per-
resource availability and potential niche partitioning   manent molars. Prosantorhinus douvillei is
among associated rhinocerotids, even if direct eco-      abbreviated as Pr. douvillei and Plesiaceratherium
logical interaction could not be evidenced a priori      mirallesi as Pl. mirallesi to avoid confusion.
between these four species.                              DMTA: Dental microwear texture analyses (here
      Previous studies investigated the rhinocerot-      using scale-sensitive fractal analyses)/
ids from Béon 1 but remained evasive on their            Abbreviations of DMTA parameters as follows,
ecologies. Nevertheless, different habitats were         epLsar: anisotropy, Asfc: complexity, FTfv: fine tex-
inferred for these four species based on their mor-      tural-fill volume, HAsfc: heterogeneity of the com-
phology. Both teleoceratines (B. brachypus and Pr.       plexity (whether it is HAsfc9 or HAsfc81).
douvillei) are considered swamp dwellers due to          Other abbreviations, OR: occlusal relief, CS: cusp
their short limbs and stout silhouette, while the        shape, LEH: linear enamel hypoplasia, MHNT:
slender-limbed hornless rhinocerotine Pl. mirallesi      Muséum d’Histoire Naturelle de Toulouse.
is interpreted as living in open woodland, and the
early-diverging elasmotheriine H. beonense in                       MATERIALS AND METHODS
savannah-like open environments (Antoine and                  All material from Béon 1 is stored permanently
Duranthon, 1997; Antoine et al., 2000; Bentaleb et       at the MHNT. We studied all available teeth, both
al., 2006). Enamel carbonate oxygen isotope com-         isolated and from tooth rows, for a total amount of
position (δ18O) suggested that all species shared a      around 1,000 teeth. However, depending on the
common source of drinking water (Bentaleb et al.,        constraints of the different methods used
2006), i.e., the oxbow lake itself or the main river,    (microwear, mesowear, and hypoplasia) the data-
falling in the home range of all rhinocerotid species    set was restricted as detailed thereafter.

                                                                                                              3
HULLOT ET AL.: BÉON 1 RHINOCEROTIDS ECOLOGY

Dental Microwear Texture Analyses (DMTA)                    or ethanol, and two silicone molds were produced
                                                            (Regular Body President, ref. 6015 - ISO 4823,
      Dental microwear is the study of microscopic
                                                            medium consistency, polyvinylsiloxane addition
scars left by food at the surface of the enamel. The
                                                            type; Coltene Whaledent). The second mold was
shape and quantity of these scars are linked to the
                                                            used for further analyses. Scans of the molded fac-
type of food items (and especially to their mechani-
                                                            ets were obtained with a Leica DCM8 confocal pro-
cal properties) consumed by the individual and the
                                                            filometer (“TRIDENT” profilometer housed at the
way to comminute these items, during the last few
                                                            PALEVOPRIM, CNRS, and University of Poitiers)
meals prior to its death (Hoffman et al., 2015; Win-
                                                            using white light confocal technology with a Leica
kler et al., 2020). Dental microwear is a short-term
                                                            100× objective (Numerical aperture: 0.90; working
(Teaford and Oyen, 1989; Winkler et al., 2020)
                                                            distance: 0.9 mm; Leica Microsystems). The .Plμ
proxy of diet (Teaford, 1991; Rivals et al., 2014;
                                                            files obtained were then pre-treated under Leica-
Ramdarshan et al., 2016), widely used in paleon-
                                                            Map v.8.2. (Leica Microsystems) as follows: sur-
tology for various mammalian clades (Grine, 1986;
                                                            face inversion (scans produced on negative
Solounias and Semprebon, 2002; Calandra et al.,
                                                            replicas), replacement of the missing points (i.e.,
2008; Jones and DeSantis, 2017; Berlioz et al.,
                                                            non-measured, less than 1%) by the mean of the
2018; Rivals et al., 2020). In this study, we used
                                                            neighboring points, removal of aberrant peaks with
Dental Microwear Texture Analyses (DMTA) with
                                                            automatic operators including a morphological filter
sensitive-scale     fractal   analyses    to    study
                                                            (see Supplementary Information in Merceron et al.,
microwear. This DMTA method was developed by
                                                            2016 for details), and levelling of the surfaces. A
Ungar et al. (2003), and we followed a protocol
                                                            200×200-μm area (1551×1551 pixels) was
based on Scott et al. (2005).
                                                            selected and saved as a digital elevation model
      We sampled one molar – preferentially the
                                                            (.sur) to be used for DMTA. As some surfaces
second (first or third otherwise) whether it was
                                                            included Hunter-Schreger bands we ran a final
upper or lower, left, or right – displaying a good
                                                            removal of form (polynomial of degree 8) and a last
state of preservation and a sufficient wear, for each
                                                            levelling to temper the potential relief effects in the
specimen. We analyzed two facets, one shearing
                                                            parameter calculations. These surfaces were then
and one grinding, from the same enamel band on
                                                            analyzed using the Scale-Sensitive Fractal Analy-
the lingual part of the protocone on upper molars
                                                            sis with Toothfrax and Sfrax softwares (Surfract,
and distally to the protoconid or hypoconid (if the
                                                            www.surfract.com) following Scott et al. (2006) or
protoconid facet was unavailable) on lower molars
                                                            using Sfrax and LeicaMap. For our study we
(Figure 2). Sometimes the shearing facet was not
                                                            selected five classical DMTA parameters:
developed and could not be sampled. Our dataset
was also split according to the preparation method                • anisotropy (exact proportion of length-scale
used on the specimens – hand-prepared or sand-                    anisotropy of relief; epLsar), which measures
prepared (using sand blasting) – to test the effect               the orientation concentration of surface rough-
of sand blasting on microwear signals.                            ness;
      After selection, the facets of interest were
cleaned twice with cotton-swabs soaked in acetone

FIGURE 2. Localization of the microwear facets on rhinocerotid molars. Position of the two microwear facets (grinding
and shearing) on the second upper molar (left) and second lower molar (right). Both facets are sampled on the same
enamel band with (grinding) or without (shearing) Hunter-Schreger bands (HSB). Modified after Hullot et al. (2019).

4
PALAEO-ELECTRONICA.ORG

      • complexity (area-scale fractal complexity;               giving scores between 1 (high-high sharp) and
      Asfc) that estimates the roughness at a given              17 (low blunt), based on the work of Winkler
      scale;                                                     and Kaiser (2011);
      • heterogeneity of complexity (heterogeneity               • Score B: or ‘Mesowear II’ which is a conver-
      of area-scale fractal complexity here at 3×3               sion of the classic original scoring (‘Mesowear
      and 9×9; HAsfc9 and HAsfc81) reflecting the                I’) from Fortelius and Solounias (2000) as pro-
      variation of complexity within the studied                 posed by Rivals et al. (2007) into a score
      zone;                                                      ranging from 0 (high relief sharp cusp) to 3
      • fine textural fill volume (here at 0.2 μm; FTfv)         (low relief blunt cusp);
      estimated by filling the surface with square               • Ruler: mesowear II ruler developed by Mihl-
      cuboids of different volumes and is linked to              bachler et al. (2011) on equid perissodactyls,
      surface relief (see Scott et al., 2006 for                 giving scores from 0 to 6.
      details).                                                  These methods were applied to all available
      We used a dataset modified from that of Hullot       upper permanent molars (M1, M2, and M3) and to
et al. (2019), with two new specimens as detailed          the third and fourth upper deciduous teeth (D3 and
below, and encompassing all five living rhinoceros’        D4). Mesowear was assessed on the paracone
species to facilitate the interpretation of fossil tex-    and not on the sharpest cusp (paracone or
tural microwear. The dataset consists of 17 speci-         metacone)       because      significant    differences
mens of Ceratotherium simum (white rhinoceros),            between cusps have been reported in rhinoceros
four of Dicerorhinus sumatrensis (Sumatran rhi-            (Taylor et al., 2013). We studied deciduous teeth
noceros), 21 of Diceros bicornis (black rhinoceros),       as they are molarized in rhinocerotids, which
15 of Rhinoceros sondaicus (Javan rhinoceros;              means that mesowear methods are easily trans-
one new specimen), and five of Rhinoceros unicor-          posable, and as they might give insights of the diet
nis (Indian rhinoceros; one new specimen).                 of juvenile and subadult individuals, and not only of
                                                           adult individuals. Examples of scoring using the
Mesowear
                                                           three different methods are provided in Figure 3.
      Dental mesowear studies ungulate molars
                                                           Enamel Hypoplasia
occlusal morphology through relief and sharpness
of cusp apices to categorize the gross dental wear                Enamel hypoplasia is a permanent, sensitive,
observed into dietary preferences. Mesowear typi-          but non-specific and individual marker of stress.
cally relies on two variables (Figure 3) scored origi-     Causes of this enamel defect can be very diverse
nally on second upper molars as proposed by                (around 100 factors interfering with normal amelo-
Fortelius and Solounias (2000):                            genesis in human are listed by Small and Murray,
      • occlusal relief (OR) that can be high or low;      1978), such as environmental stress (e.g., drought,
      • cusp shape (CS) taking the values sharp,           food shortage; Skinner and Pruetz, 2012; Upex
      round, or blunt.                                     and Dobney, 2012), physiological stress (e.g., dis-
                                                           ease, parasitism; Suckling et al., 1986; Rothschild
      With this method, browsers are characterized
                                                           et al., 2001; Niven et al., 2004), and psychological
by a high percentage of attrition-dominated speci-
                                                           stress (e.g., depression; Guatelli-Steinberg, 2001).
mens with high relief and sharp cusps, while graz-
                                                                  All cheek teeth available (deciduous and per-
ers are abrasion-dominated with low relief and
                                                           manent) were included in the study of hypoplasia,
blunt cusps (Fortelius and Solounias, 2000). Nev-
                                                           with the exception of teeth too damaged, too worn,
ertheless, as abrasion is cumulative over-life, there
                                                           with not enough enamel visible (e.g., tooth
is an ontogeny effect in the mesowear signal (For-
                                                           unerupted in bone, sediment occluding), or not
telius and Solounias, 2000), which we took into
                                                           properly identified. This exclusion was considered
account by using age classes as defined by Hill-
                                                           because absence of hypoplasia in worn or dam-
man-Smith et al. (1986).
                                                           aged teeth might generate false negatives, and
      In this study, we used three different
                                                           because hypoplasia on unidentified teeth is difficult
mesowear scores to assess dietary preferences
                                                           to link to potential causes. This exclusion con-
(Table 1):
                                                           cerned 81 teeth: 10 permanent in B. brachypus, 19
      • Score A: better known as ‘Mesowear I & II—         (two deciduous – 17 permanent) in H. beonense,
      Expanded’ (Solounias et al. 2014; Ackermans          28 (one deciduous – 27 permanent) in Pl. mirallesi,
      2020) with refined categories for both OR and        and 24 (four deciduous – 20 permanent) in Pr. dou-
      CS (e.g., high-high,     high-low, round-round)      villei. The analyzed sample represents a total of

                                                                                                                5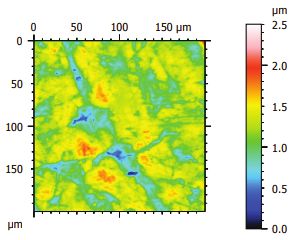
HULLOT ET AL.: BÉON 1 RHINOCEROTIDS ECOLOGY

FIGURE 3. Principle of mesowear scoring with the main variables illustrated (occlusal relief and cusp shape) and
examples on rhinocerotid teeth. A- Typically two parameters are studied in mesowear: cusp shape and occlusal relief.
Cusp shape can be sharp, round or blunt, while occlusal relief is whether high or low. Illustration on the upper right M1
of the specimen MHNT.PAL.2004.0.58 (H. beonense). Examples of mesowear scores using the three methods tested
in this study (ScoreA, ScoreB, Ruler) are provided on the paracone of the following specimens: B- Right D4 of
MHNT.PAL.2015.0.1204 (G2 685; Pl. mirallesi), C- Left M1 and M2 MHNT.PAL.2015.0.277 (Pr. douvillei), D- Left D4 of
MHNT.PAL.2015.0.1204 (Béon F2 193; Pl. mirallesi), E- Left D3 and D4 of MHNT.PAL.2015.0.2796 (Pr. douvillei).
ScoreA: mesowear score based on Winkler and Kaiser (2011); B- ScoreB: mesowear score adapted from Fortelius
and Solounias (2000); C- Ruler: mesowear score based on Mihlbachler et al. (2011).

6
PALAEO-ELECTRONICA.ORG

TABLE 1. Conversion of occlusal relief (OR) and cusp         duration of the stress). Other qualitative parame-
shape (CS) into a mesowear score depending on the            ters were recorded: the type of tooth affected (e.g.,
method. ScoreA: extended mesowear (refined categories        second upper right molar), the position of the
for CS and OR) giving scores between 1 and 17, based         defect on the crown (labial or lingual, near which
on the work of Winkler and Kaiser (2011); ScoreB: con-
                                                             cusp), and its severity.
version of the classic original scoring from Fortelius and
Solounias (2000) as proposed by (Rivals et al., 2007)        Statistics and Figures
into a score ranging from 0 to 3; Ruler: mesowear ruler
developed by Mihlbachler et al. (2011), giving scores              All statistics were conducted in R (R Core
from 0 to 6.                                                 Team, 2018. R: A language and environment for
                                                             statistical computing. R Foundation for Statistical
     Occlusal                                                Computing, Vienna, Austria. URL https://www.R-
      relief      Cusp shape ScoreA ScoreB Ruler
                                                             project.org/.). Figures were done using R packages
   High-high     Sharp             1       -      -          ggplot2 (Wickham, 2016), cowplot (Wilke, 2020),
   High          Sharp             2      0       0          and gridExtra (Auguie, 2017), as well as Inkscape
   High-low      Sharp             3       -      -          v.0.91.
   High-high     Round-sharp       4       -      -
                                                                   General Linear Mixed Models (GLMM) were
                                                             applied to our data. They were built using a R code
   High          Round-sharp       5       -      1
                                                             modified from Arman et al. (2019), based on the
   High-low      Round-sharp       6       -      -          package lme4 (Bates et al., 2015), and adapted to
   High-high     Round             7       -      -          each tested response variable. For DMTA,
   High          Round             8      1       2          response variables were the five DMTA parame-
   High-low      Round             9       -      -          ters (epLsar, Asfc, FTfv, HAsfc9, and HAsfc81) and
   High          Round-round      10       -      -
                                                             factors were: specimen (random factor), species,
                                                             tooth (e.g., first molar, fourth premolar), position
   High-low      Round-round      11       -      3
                                                             (upper or lower), side (left or right), cusp (proto-
   Low           Sharp            12       -      -          cone, protoconid, hypoconid), and facet (grinding
   Low           Round-sharp      13       -      -          or shearing). For mesowear, the variables were
   Low           Round            14      2       4          ScoreA (from 1 to 17; Winkler and Kaiser, 2011),
   Low           Round-round      15       -      5          ScoreB (from 0 to 3; Rivals et al., 2007), and Ruler
   High-low      Blunt            16       -      -
                                                             (from 0 to 6; Mihlbachler et al., 2011), and the fac-
                                                             tors were: specimen (random factor), species,
   Low           Blunt            17      3       6
                                                             tooth (e.g., first molar, fourth premolar), category
                                                             (deciduous or permanent), side (left or right), wear
832 teeth (197 deciduous molars and 635 perma-               (low = stages 1 to 4, average = stages 5 to 7, high
nent premolars and molars).                                  = stages 8 to 10 according to scale defined by Hill-
     To our knowledge, no standard protocol nor              man-Smith et al., 1986), ontogeny (adult, subadult,
threshold is available to differentiate normal from          juvenile; as defined in Hullot and Antoine, 2020),
pathological enamel in any given species. Here,              and cusp (sharpest or paracone). For hypoplasia,
we have chosen to investigate enamel hypoplasia              response variables were Hypo (1 or 0 for presence
with the naked eye. The approach consisted in the            or absence of hypoplasia), Defect (e.g., LEH, Pits,
macroscopical identification of defects, following           Aplasia; converted to numbers), Multiple (number
the Fédération Dentaire Internationale index                 of defects), Severity (0 to 4), and factors were:
(1982) and associated caliper measurements. In               specimen (random factor), species, tooth (e.g., first
this paper, we distinguished three types of hypo-            molar, fourth premolar), position (upper or lower),
plasia as illustrated in Figure 4:                           side (left or right), defect (converted to factor; for
     • linear enamel hypoplasia (LEH), defect form-          response variables Severity and Multiple), and
     ing a line around the crown;                            wear (low, average, high; same categories as
     • pitted hypoplasia, restricted rounded defect;         above). An example of this code applied to
     and                                                     mesowear ScoreA is given in Appendix 1.
                                                                   Model construction followed a bottom-up
     • aplasia, zone entirely missing enamel.
                                                             approach (i.e., adding factors incrementally to the
     Figure 4 also details the measurements taken:           model), starting with the factor specimen alone,
distance to enamel-dentine junction (linked to the           which was the only random factor of our dataset.
age at which the defect occurred) and width of the           For the second model we added the factor species,
defect when applicable (linked to the severity and
                                                                                                                 7
HULLOT ET AL.: BÉON 1 RHINOCEROTIDS ECOLOGY

FIGURE 4. The three different types of hypoplasia considered in this study and the associated measurements. A- Lin-
gual view of right M2 of the specimen MHNT.PAL.2004.0.58 (H. beonense) displaying three types of hypoplasia. B-
Interpretative drawing of the photo in A illustrating the hypoplastic defects: a- pitted hypoplasia, b- linear enamel hypo-
plasia, and c- aplasia. C- Interpretative drawing of the photo in A illustrating the measurements: 1- distance between
the base of the defect and the enamel-dentin junction, 2- width of the defect (when applicable).

as this was the principal interest of our analyses.            specimens are usable. Therefore, we will mainly
We tested few interactions (e.g., Species x Facet              refer to this subsample and compare it to the sand-
for microwear) in the models as most factors were              prepared subsample to assess the influence of
considered independent and to avoid unnecessar-                sand blasting on the microwear signal. In the hand-
ily complex models (models with interaction effects            prepared subset, values of complexity were rela-
rarely selected after preliminary analysis; Arman et           tively similar among the four species on both fac-
al., 2019). We created additional sets of models by            ets, especially both teleoceratines, with most
adding a different factor (e.g., ontogeny, tooth, cat-         specimens plotting between 0.5 and 2 (Figure 5).
egory, side, wear, cusp) to the second model (spe-             Mean and median of complexity were low to mod-
cies + specimen) and selected the model that                   erate in all four species on both facets, ranging
produced the lowest AIC score (Akaike’s Informa-               from 0.72 to 1.69. Within this sample, Pl. mirallesi
tion Criterion) as the base for the next set of mod-           had the highest values of anisotropy on the shear-
els. We repeated this process until there was no               ing facets (mean and median above 5x10⁻³) but
improvement in AIC score. After selecting the best             values similar to those of Pr. douvillei and H. beon-
model (lowest AIC), we checked for over-disper-                ense on the grinding ones (2.5-3x10⁻³; Figure 5,
sion (estimated through the ratio of deviance and              Table 2). The lowest values of anisotropy were
degrees of freedom) and corrected the model by                 those of B. brachypus, mostly around 2x10⁻³. The
using quasi-Poisson or quasi-Binomial laws from                heterogeneities of complexity (HAsfc9 and HAs-
the MASS package (Venables and Ripley, 2002) if                fc81) were low for Pl. mirallesi but moderate in
necessary. In total, 200 models were compared                  other species on both facets (except shearing of
across the 12 response variables (see Appendices               Pr. douvillei). Eventually, FTfv had the highest
2 to 5).                                                       value on the grinding facets of two teleoceratines,
                                                               with a mean of 4.78x10⁴ for B. brachypus and
                       RESULTS
                                                               5.21x10⁴ for Pr. douvillei, and the lowest value on
DMTA: Modelling, Impact of Sand Preparation,                   the shearing facets of B. brachypus, with a mean of
and Dietary Preferences                                        1.63x10⁴. Overall, the shearing facet seems to dis-
     Median, mean, and standard deviation of the               criminate better between the species, especially
mean were calculated for every DMTA parameter                  through anisotropy (Figure 5), though both facets
(anisotropy, complexity, FTfv, HAsfc9, and HAs-                are useful for dietary studies, as they give insights
fc81) by species, facet, and preparation type (hand            into different moments of the mastication.
or sand blasting). All results are detailed in Table 2.              Sand-prepared specimens show lower values
As for dietary interpretation, only hand-prepared              and less dispersion in anisotropy on both facets,
                                                               but higher values and more dispersion in complex-

8
PALAEO-ELECTRONICA.ORG

TABLE 2. Median, mean, and standard deviation of the mean of DMTA parameters by species, type of preparation and
facet. lepLsar: anisotropy, Asfc: complexity, FTfv: fine textural-fill volume, HAsfc: heterogeneity of the complexity
(whether it is HAsfc9 or HAsfc81). Gr: grinding facet; Sh: shearing facet.
   Species                B. brachypus                 Pr. douvillei               Pl. mirallesi                H. beonense
    Prep.               Hand        Sand            Hand           Sand         Hand           Sand          Hand         Sand
    Facet              Gr  Sh      Gr  Sh          Gr  Sh       Gr    Sh       Gr  Sh        Gr   Sh        Gr  Sh      Gr   Sh
      N                 7      5      6      3     15      4     13      8     14     12     19     12      6      3      2      1

     Asfc     Median   1.20   0.72   2.72   0.63   1.24   0.77   2.00   1.96   0.98   0.96   2.23   1.31   0.76   0.92   0.73   1.47
              Mean     1.50   0.92   3.36   0.71   1.50   1.03   3.67   2.00   1.27   1.02   2.20   1.38   1.69   0.75   0.73   1.47
               SD      0.73   0.65   2.94   0.22   1.00   0.52   3.27   0.89   0.94   0.67   1.07   0.53   1.89   0.31   0.01   NA

    epLsar    Median   1.70   1.83   1.90   2.96   2.60   2.53   2.32   1.94   2.46   5.60   2.39   2.06   3.01   3.33   1.46   1.33
    (*10-3)
              Mean     2.56   1.98   1.87   3.58   2.81   2.41   2.30   2.39   3.36   5.70   2.43   2.23   2.95   3.67   1.46   1.33
               SD      1.58   0.44   0.78   3.01   1.68   1.34   1.79   1.74   2.14   2.21   1.06   1.09   0.93   2.02   0.12   NA

     FTfv     Median   4.76   1.98   6.58   2.38   5.39   2.66   4.27   4.29   4.05   2.34   5.27   3.13   3.73   4.23   2.65   2.76
    (*104)
              Mean     4.78   1.63   5.94   2.54   5.21   3.85   4.80   3.99   4.20   2.35   5.31   2.97   4.22   4.50   2.65   2.76
               SD      1.10   0.96   1.99   0.89   2.50   2.57   2.14   1.67   1.99   1.34   1.97   0.61   1.57   0.73   0.31   NA

    HAfsc9    Median   0.27   0.23   0.32   0.24   0.32   0.18   0.30   0.35   0.21   0.16   0.31   0.29   0.27   0.22   0.25   0.18
              Mean     0.34   0.27   0.33   0.24   0.32   0.18   0.34   0.58   0.26   0.19   0.39   0.34   0.29   0.31   0.25   0.18
               SD      0.20   0.11   0.10   0.07   0.14   0.03   0.23   0.58   0.10   0.15   0.23   0.17   0.13   0.20   0.08   NA

   HAfsc81 Median      0.49   0.46   0.69   0.52   0.56   0.37   0.70   0.78   0.40   0.40   0.72   0.59   0.45   0.53   0.46   0.76
              Mean     0.61   0.51   0.68   0.51   0.66   0.39   0.72   1.30   0.50   0.42   0.76   0.61   0.58   0.58   0.46   0.76
               SD      0.28   0.18   0.13   0.06   0.26   0.10   0.26   1.40   0.20   0.17   0.30   0.14   0.36   0.14   0.05   NA

ity, especially on the grinding facet (Figure 5). This                  threshold and sensibly less above the anisotropy
is confirmed by mean and median values of Asfc                          one, for all species but H. beonense. These ten-
for all species but H. beonense grinding and B.                         dencies between hand prepared and sand pre-
brachypus shearing, both exhibiting equivalent or                       pared are more subtle on the shearing facet: H.
lower values in the sand-prepared subset (Table                         beonense displays less anisotropic specimens but
2). Concerning anisotropy, the shift is verified for                    still no complex ones, Pl. mirallesi presents less
species/facets with high values (Pl. mirallesi and H.                   anisotropic specimens and slightly more complex
beonense) but is less clear (shearing facet of Pr.                      ones, Pr. douvillei has still no anisotropic speci-
douvillei) or inverted for other species (B. brachy-                    mens but much more complex ones, and B.
pus). The differences between       hand- and sand-                     brachypus has more anisotropic specimens but still
prepared surfaces are illustrated in Figure 6.                          no complex ones (Figure 7).
Photo-simulations of the sand-prepared surfaces                               For all response variables (epLsar, Asfc, FTfv,
show bigger pits and coarser scratches, and the                         HAsfc9, and HAsfc81), model support increased
orientation of the scars is less obvious than in the                    (lower AIC) when intraspecific factors (e.g., tooth
hand-prepared surfaces. These observations are                          loci, preparation type, facet) were included. The
consistent with previous statements on anisotropy                       final models contained three to five factors. Along-
and complexity.                                                         side species and specimen, preparation type was
      When compared to the living rhinoceros spe-                       in all final models but that of FTfv. Facet appeared
cies dataset, we found that no species from Béon 1                      in the final models of epLsar, Asfc, and FTfv. Both
was in the extant dietary space, except for the                         HAsfc had the same final model, and epLsar and
shearing facet of Pl. mirallesi, which clusters with                    Asfc shared the same factors but differ in the pres-
the extant strict grazer C. simum and the folivore                      ence of interactions. Details and comparison of all
D. sumatrensis (Figure 7). The microwear pattern                        models can be seen in Appendix 3.
is clearly distinct at the species level, as the pro-                         Based on GLMMs results, we can infer the
portions of specimens with high anisotropy (epLsar                      impact of sand preparation on the microwear pat-
> 0.005) and high complexity (Asfc > 2) change.                         tern. Sand-prepared specimens display signifi-
Regarding sand preparation on the grinding facet,                       cantly higher mean complexity (p-value = 5x10⁻⁴),
we observe more specimens above the complexity
                                                                                                                                       9
HULLOT ET AL.: BÉON 1 RHINOCEROTIDS ECOLOGY

FIGURE 5. Comparison of the DMTA patterns by species, facet and preparation type. Upper graphs: hand-prepared
specimens; lower graphs: sand-prepared specimens. Left graphs: grinding facet; right graphs: shearing facet. Box-
plots of anisotropy and complexity were plotted along with the dotplots to facilitate graph interpretation.

HAsfc9, and HAsfc81 (df = 122, α = 0.95, t-values         Mesowear: Modelling, Impact of Ontogeny, and
> 2.5). The choice of facet also appears crucial as       Dietary Preferences
shearing facet has higher mean anisotropy (p-
                                                               Out of the complete dataset used for GLMMs,
value = 4x10⁻⁴), and lower mean complexity (p-            we selected one tooth per specimen (preferentially
value ≈ 0.003) and FTfv (p-values < 5x10⁻⁴). Signif-      M2) to calculate mean, standard deviation of the
icant or nearly significant interspecific differences     mean, and median of all mesowear scores
were observed relatively to Pl. mirallesi (set as ref-    (ScoreA, ScoreB, Ruler) by species. The results
erence for GLMMs): Pr. douvillei had higher mean          are given in Table 3. Mean of Ruler was around 2
Asfc (p-value ≈ 0.06) and HAsfc81 (df = 122, α =          for Pr. douvillei and Pl. mirallesi, lower in H. beon-
0.95, t-value = 1.97). The effects of interactions        ense (1.77), and higher in B. brachypus (3.5; Table
(species x preparation type x facet) were signifi-        3). Median of Ruler was 2 for all species but B.
cant for anisotropy. The final model of FTfv              brachypus. Mean ScoreA was around 7.5 and
includes tooth and position as factors, and it            mean ScoreB between 0.77 and 0.98 for all spe-
reveals that M3 has significantly lower mean FTfv         cies but B. brachypus for which they were consid-
than M2, and that upper teeth have significantly          erably higher (10.5 and 2 respectively; Table 3).
lower mean FTfv than the lower ones.                      However, mesowear was assessed on only two
                                                          molars for B. brachypus.

10
PALAEO-ELECTRONICA.ORG
FIGURE 6. Comparison of hand- and sand-prepared DMTA surfaces (200x200 µm) by species. Topography and
black and white photosimulation of the following specimens:
B. brachypus – hand-prepared MHNT.PAL.2015.0.1262 right m3 (protoconid, shearing facet) and sand-prepared
MHNT.PAL.2015.0.2830 left m2 (hypoconid, shearing facet); Pr. douvillei – hand prepared MHNT.PAL.2015.0.1228
left m3 (protoconid, grinding facet) and sand-prepared MHNT.PAL.2015.0.2758 left m2 ptc (protoconid, grinding
facet); Pl. mirallesi – hand-prepared MHNT.PAL.2015.0.1196 left m2 ptc (protoconid, shearing facet) and sand-pre-
pared MHNT.PAL.2015.0.2794 (2002 E2 30) left m1 (hypoconid, shearing facet); H. beonense – hand-prepared
MHNT.PAL.2015.0.1140 left m1 (hypoconid, grinding facet) and sand-prepared MHNT.PAL.2015.0. 1136.1 right M3
(protocone, grinding facet).
ScoreB and Ruler had lower means when ones for Pl. mirallesi and H. beonense, but it was
only deciduous teeth were considered and higher the opposite for Pr. douvillei (Table 3).
ones when permanent teeth alone were studied for Generalized linear mixed-models were built
all species (Table 3). Median of ScoreB was 1 in all for each response variable (ScoreA, ScoreB,
species and sample (all teeth, deciduous only, or Ruler). For all variables, model support increased
permanent only), while that of Ruler was 1 with (lower AIC) when intraspecific factors (e.g., tooth
deciduous teeth and 2 otherwise (all teeth and per- loci, ontogeny, cusp) were included. The final mod-
manent only). Concerning ScoreA, deciduous teeth els contained three to five factors, always including
also had lower means and permanent teeth higher species, specimen, and ontogeny. Final models of
ScoreA and ScoreB contained the same factors:
11HULLOT ET AL.: BÉON 1 RHINOCEROTIDS ECOLOGY
FIGURE 7. Percentages of specimens above anisotropy (epLsar > 0.005) or complexity (Asfc > 2) cutpoints by spe-
cies, facet, and preparation type. Triangles: living rhinoceros’ species; circles: Béon 1 fossil rhinocerotids; size propor-
tional to the number of specimens.
specimens, species, tooth, cusp, and ontogeny. ent mesowear score profiles (Figure 8). The only
Details and comparison of all models can be seen two teeth of B. brachypus studied yielded very dif-
in Appendix 4. Based on GLMMs results, we can ferent mesowear scores for all methods (ScoreA: 6
infer the impact of ontogeny, tooth loci, or cusp and 15; ScoreB: 1 and 3; Ruler: 2 and 5). Concern-
sampled on the mesowear pattern. Ontogeny ing ScoreA, many specimens displayed the aver-
seems to play a crucial role in mesowear, as juve- age mesowear score of 8 in all three remaining
niles and subadults had significantly lower scores species and most specimens had a mesowear
than adults for all methods (p-value < 0.05). Sur- score below 10 (Figure 8). ScoreB for H. beonense
prisingly, we found that D3, D4, M1, and M3 had was 0 or 1 for all specimens, while all scores from
higher mean mesowear ScoreA and ScoreB than 0 to 3 were observed for Pl. mirallesi and Pr. dou-
M2. When scored on paracone, ScoreA and villei. ScoreB over 1 was however limited for Pr.
ScoreB yielded significantly higher mean values douvillei. Eventually, Ruler was between 1 and 3
than with the sharpest cusp approach. Eventually, for H. beonense with most specimens having a
no significant interspecific differences were found score of 2. All scores but 5 were observed for Pl.
in the mesowear score for any method (ScoreA, mirallesi and Pr. douvillei but similarly to ScoreB,
ScoreB, Ruler). the profile was skewed to higher scores in Pl.
Despite the absence of significant differences mirallesi (Figure 8).
between Béon 1 rhinocerotids, we observed differ-
12PALAEO-ELECTRONICA.ORG
TABLE 3. Descriptive statistics (sample size, median, mean, standard deviation of the mean) of mesowear score by
species and method. ScoreA: extended mesowear giving scores between 1 and 17, based on the work of Winkler and
Kaiser (2011); ScoreB: conversion of the classic original scoring from Fortelius and Solounias (2000) as proposed by
Rivals et al. (2007) into a score ranging from 0 to 3; Ruler: mesowear ruler developed by Mihlbachler et al. (2011), giv-
ing score from 0 to 6. Only one tooth per specimen was considered.
B. brachypus Pr. douvillei Pl. mirallesi H. beonense
ScoreA Score B Ruler ScoreA ScoreB Ruler ScoreA ScoreB Ruler ScoreA ScoreB Ruler
All Teeth
N 2 2 2 31 31 31 32 32 32 13 13 13
Median 10.5 2 3.5 8 1 2 8 1 2 8 1 2
Mean 10.5 2 3.5 7.42 0.90 1.90 7.61 0.98 2 7.19 0.77 1.77
SD 6.36 1.41 2.12 3.69 0.83 1.54 3.93 0.81 1.50 2.63 0.44 0.83
Deciduous only
N / / / 7 7 7 9 9 9 3 3 3
Median / / / 8 1 1 8 1 1 9 1 1
Mean / / / 7.71 0.71 1.71 6.67 0.67 1.22 6.33 0.67 1.33
SD / / / 3.55 0.76 1.50 2.18 0.5 0.67 4.62 0.58 1.53
Permanent only
N 2 2 2 27 27 27 24 24 24 9 9 9
Median 10.5 2 3.5 8 1 2 8 1 2 8 1 2
Mean 10.5 2 3.5 7.44 0.93 2 7.98 1.10 2.25 7.39 0.78 1.89
SD 6.36 1.41 2.12 3.94 0.87 1.62 4.32 0.86 1.62 2.15 0.44 0.60
Enamel Hypoplasia difference is clear for H. beonense (milk: 1/30, 3.33
%; permanent: 11/62, 17.74 %) and Pl. mirallesi
At Béon 1, 216 teeth out of the 832 studied
(milk: 12/76, 15.79 %; permanent: 86/264, 32.58
are affected by hypoplasia (all types of hypoplasia,
%), but less pronounced in proportions for Pr. dou-
all species, all dental loci), corresponding to an
villei (milk: 21/90, 23.33 %; permanent: 72/264,
overall prevalence of 25.96 %. This prevalence
27.27 %). For B. brachypus there is only one
corresponds to a minimum number of individuals
deciduous tooth – a D1 – and it presents hypopla-
affected by hypoplasia of 27 (Table 4) out of the 61
sia (two LEHs). Multiple events of hypoplasia were
estimated at Béon 1 using tooth eruption incompat-
twice as frequent on permanent teeth (68/635;
ibilities (see Hullot and Antoine, 2020). There are,
10.71 %) than on deciduous ones (11/197; 5.58
however, great variations depending on the type of
%). However, the ratio of multiplicity against the
hypoplasia, the species and the tooth locus consid-
number of hypoplastic teeth is similar in deciduous
ered.
(11/35, 31.43 %) and permanent (68/181; 37.57 %)
As for species, the prevalence was between
teeth, around one third. Overall, upper teeth (100/
13.04 % (12/92 teeth) for H. beonense and above
446; 22.42 %) are also significantly less hypoplas-
28 % for both Pl. mirallesi (98/340; 28.82%) and B.
tic than lower teeth (116/386; 30.1 %). The differ-
brachypus (13/46; 28.26%; Table 5). The preva-
ence between upper and lower teeth was similar
lence by species must however be nuanced by the
for Pr. douvillei (lower: 46/148, 31.08 %; upper: 47/
number of teeth available for each species: Pl.
206, 22.82 %) and Pl. mirallesi (lower: 54/151,
mirallesi and Pr. douvillei are equally abundant
35.76 %; upper: 44/189, 23.28 %), but inverted for
(340 and 354 teeth, respectively), while B. brachy-
H. beonense: upper teeth (8/44; 18.18 %) were
pus and H. beonense are scarce (46 and 92 teeth,
more affected than lower ones (4/48; 8.33 %). For
respectively; Table 5).
B. brachypus, very few upper teeth were available,
Similarly, there are huge differences in the
making such comparison hazardous.
prevalence by tooth locus. Deciduous teeth are for
More precisely, d1/D1, d2/D2, and D3 were
instance less affected than permanent teeth with
the least affected loci with less than 5% of the teeth
prevalences of 17.77 % (35/197) and 28.5 % (181/
presenting hypoplasia (even 0 % for d1 and D2).
635), respectively, but permanent teeth are three
The most affected loci were p4 (48.15 %), m3
times more numerous in the dataset (Table 5). This
(46.81 %), and D4 (46.15 %). Hypoplasia preva-
13HULLOT ET AL.: BÉON 1 RHINOCEROTIDS ECOLOGY
FIGURE 8. Barplots of mesowear scores on permanent teeth by method (ScoreA, ScoreB, Ruler) and by species. A-
ScoreA: mesowear score based on Winkler and Kaiser (2011); B- ScoreB: mesowear score adapted from Fortelius
and Solounias (2000); C- Ruler: mesowear score based on Mihlbachler et al. (2011). Only one tooth per specimen was
considered.
TABLE 4. Minimum number of individuals (NI) at Béon 1 by species based on teeth. Corrected MNI based on dental
eruption incompatibilities (e.g., no m3/M3 in wear associated with deciduous teeth but d1/D1) as proposed by Hullot
and Antoine (2020).
Corrected
MNI Tooth MNI Teeth
B. brachypus 3 left m3 3 left m3
Pr. douvillei 7 right M2 12 right M2 + left D4
Pl. mirallesi 8 left p4 9 left P4 + left d2
H. beonense 3 left m1 3 left m1
Total 21 27
TABLE 5. Hypoplasia (all type) and LEH prevalence by species and tooth type.
Number of teeth All types of hypoplasia LEH only
Milk Permanent All Milk Permanent All
% of
hypoplastic
Milk Permanent N % N % % total N % N % % total teeth
B. brachypus 1 45 1 100.00 12 26.67 28.26 1 100.00 5 11.11 13.04 46.15
Pr. douvillei 90 264 21 23.33 72 27.27 26.27 12 13.33 36 13.64 13.56 51.61
Pl. mirallesi 76 264 12 15.79 86 32.58 28.82 11 14.47 43 16.29 15.88 55.10
H. beonense 30 62 1 3.33 11 17.74 13.04 1 3.33 5 8.06 6.52 50.00
Total 197 635 35 17.77 181 28.50 4.21 25 12.69 89 14.02 13.70 52.78
14PALAEO-ELECTRONICA.ORG
lence is also high for d4 with 40 % of the teeth ogy (less ameloblasts disrupted than for LEH or
affected (Figure 9). Figure 9 highlights inter-spe- aplasia).
cific differences in the most affected tooth loci. Few
loci are affected for B. brachypus and H. beon- DISCUSSION
ense: for B. brachypus all lower permanent molars
Impact of Sand Preparation on Microwear
seem to be particularly affected, while for H. beon-
Signal
ense M2 and m1/M1 seem more frequently hypo-
plastic. The other two species present a wider As suggested by Table 2 and Figures 5 to 7,
range of loci affected: for Pr. douvillei the most the microwear signal is modified by sand blasting
affected teeth are d4/D4, p4, and m3, while for Pl. preparation. Before our study we had three hypoth-
mirallesi it is p4, m3, and p3 (Figure 9). eses concerning the impact of sand blasting on the
Concerning the type of hypoplasia, LEH (lin- microwear signal observed: 1) no significant effect
ear enamel hypoplasia) was the most frequent, of sand blasting (null hypothesis), 2) generation of
affecting 17.55 % of the teeth (146/832) and corre- new features resulting in a different microwear sig-
sponding to about the half of the defects encoun- nal, and 3) flattening of the surface and erasing of
tered (Table 5). Pits were found on 7.45 % of the microwear features. Our results suggest a shift
teeth (62/832) and aplasia on 2.4 % (20/832). towards lower anisotropy and higher complexity
For all response variables (Hypo, Defect, Mul- values in all studied species, regardless of their
tiple, and Severity), model support increased diet. A decrease in anisotropy is likely to be
(lower AIC) when intraspecific factors (e.g., tooth explained by sand particles impacting randomly
loci, wear stage) were included. The final models and erasing any eventual pre-existing preferential
contained three to five factors. Besides species orientations, while an increase in complexity could
and specimens, tooth type was in the final models be due to sand particles generating new features of
of the variables Hypo (i.e., presence or absence of various sizes and shapes primarily due to the wide
hypoplasia) and Defect (i.e., type of defect), and range of angles of incidence while blasting sand.
defect (converted to factor) in that of variables Mul- These results point towards our second hypothe-
tiple and Severity. Details and comparison of all sis, with the apparition of a de novo microwear sig-
models can be seen in Appendix 5. Based on final nal that may in turn bias microwear interpretation
GLMMs, we found significant differences (Appen- towards browsing or frugivory artificially. Sand
dix 5; p-values < 0.05) in species vulnerability to blasting is a real issue for undertaking microwear
stress: H. beonense had suffered significantly less studies a posteriori. Accordingly, not only this
hypoplasia than Pl. mirallesi (set as reference for method should be used with care and parsimony
GLMMs), and it was more through single LEH than for museum preparation of occlusal surfaces of
any other types of defects (e.g., aplasia, combina- fossil teeth, but it is also necessary to be particu-
tion of defects). The prevalence and defect type did larly cautious when analyzing museum fossil speci-
not differ significantly between Pl. mirallesi and the mens for microwear analyses.
two teleoceratines. Similarly, mean severity was
Interest of GLMM
not different in all species. Upper teeth appeared
less affected by hypoplasia but neither the defect Generalized linear mixed-models are
types nor the multiplicity were different (p-values > extremely powerful yet very complex tools in ecol-
0.05). We also found significant differences ogy. Their application and their interpretation
depending on dental loci: p4/P4 had a higher prev- require many precautions. Yet, the use of GLMMs
alence of hypoplasia than d2/D2, d3/D3, p2/P2, is a good way to compare different methods and
and p3/P3. The defect types also differ between assess the impact of factors all at the same time. In
p4/P4 and d2/D2 or m3/M3 (p-values < 0.05). More our study, GLMMs revealed that the choice of the
surprisingly, we found that right teeth display sig- cusp for scoring mesowear was crucial in rhinocer-
nificantly different hypoplastic patterns and that otids as ScoreA and ScoreB yielded significantly
lightly worn teeth were presenting less hypoplasia. different means depending on the cusp studied
Eventually, our results suggest that pits were less (sharpest cusp or paracone). This matter has
severe and less frequently multiple than LEH, but already been emphasized in rhinocerotids (Taylor
this result can be imputed to how pits were et al., 2013) as well as in equids (Taylor et al.,
recorded in the first place (i.e., several pits identi- 2016), probably due to the asymmetry of their
fied as a single hypoplasia event) and their aetiol- teeth. This issue is apparently restricted to perisso-
dactyls as no cusp differences are reported in rumi-
15HULLOT ET AL.: BÉON 1 RHINOCEROTIDS ECOLOGY FIGURE 9. Prevalence of hypoplasia (all types) by species and tooth locus. A- Number of hypoplastic teeth (dark col- ors) compared to the number of healthy teeth (light colors). B- Frequency of hypoplastic teeth (dark colors) and healthy teeth (light colors). White stands for non-documented loci. 16
PALAEO-ELECTRONICA.ORG

nant taxa, for instance (Fortelius and Solounias,       mesowear I (ScoreA) and extended mesowear I &
2000; Ackermans et al., 2018). GLMMs also high-         II (ScoreB) are scored on the sharpest cusp, which
lighted differences due to ontogeny for mesowear.       is not fully applicable for rhinocerotid teeth as dis-
This result was expected, and it has been dis-          cussed in the previous section. This means that
cussed before (Fortelius and Solounias, 2000;           these methods may not be the most adapted to
Rivals et al., 2007). However, the present study is     study mesowear for representatives of this clade or
the first investigation of mesowear on rhinocerotid     that they should be applied to the paracone, which
deciduous teeth to our knowledge. These decidu-         in turn would impede comparison to other studies.
ous teeth were probably reacting differently to wear    Moreover, the very large scale (1-17) used in
than would permanent teeth. Indeed, the enamel          extended mesowear (ScoreB) is probably a source
layer is thinner in deciduous teeth, which might        of intra- and inter-observer errors, instead of pro-
lead to a distinct wear pattern (i.e., faster and/or    viding a finer discrimination between dietary prefer-
more marked wear). Interestingly, the confounding       ences. Thus, we would recommend the use of
factors – such as tooth loci/position in microwear,     Mesowear II – Mesowear Ruler (Ruler) to study
or left/right tooth (side) in hypoplasia or mesowear    mesowear on rhinocerotid teeth, especially since it
– were absent of most final models. This absence        has been specifically designed on equids (Mihl-
suggests that these factors might not play a crucial    bachler et al. 2011), which are more closely related
role in the variations observed, meaning that the       to rhinocerotids than artiodactyl ruminants.
most variation observed is due to actual interspe-
                                                        Dietary Preferences
cific differences.
      Despite all these interests, our models are not         The dietary preferences of four associated rhi-
perfect. First, we chose to study certain interac-      nocerotid species from Béon 1 were investigated at
tions and not others to simplify the models, which      two timescales: a short (days-to-weeks) scale with
may have oriented our final results. Secondly, we       microwear, and a longer more cumulative, over-life
based our model selection on AIC but several other      scale, with mesowear. Previous work, based on
criteria exist, with different sensitivities. For       gross dental and postcranial morphology, proposed
instance, when all models tested were ordered by        a habitat partitioning for these rhinocerotids –
Bayesian information criterion (BIC), the best can-     swamps for the teleoceratines B. brachypus and
didate model differed for several response vari-        Pr. douvillei, open woodland for the stem rhinocer-
ables (Mesowear: Ruler, ScoreB; Microwear:              otine Pl. mirallesi, and savannah-like open environ-
Anisotropy, FTfv, HAsfc9, HAsfc81; Hypoplasia:          ments for the early-diverging elasmotheriine H.
Hypo, Defect). For FTfv the best model selected by      beonense (Antoine and Duranthon, 1997; Antoine
BIC was based on different factors, but for the         et al., 2000; Bentaleb et al., 2006) – so we were
other variables, inter-individual variation (1|Speci-   expecting to find dietary differences.
men) was the only factor present. This could be               Concerning mesowear, no significant differ-
due to the risk of over-fitting when using AIC and      ences were found between the four rhinocerotid
under-fitting with BIC. However, some biological        species in any methods (ScoreA, ScoreB, and
parameters might also be responsible for this prev-     Ruler). The mesowear score profiles were different
alence of inter-individual variation. For mesowear      (Figure 8). In mesowear, leaf browsers have the
variables (ScoreB and Ruler), as no species differ-     lowest scores and grazers the highest, while mixed
ences were highlighted in the models, individual        feeders and fruit browsers have intermediate over-
variability might be the greatest variation observed.   lapping scores. At Béon 1, all species had rela-
As, for hypoplasia variables (Hypo and Defect),         tively low mean mesowear scores for all methods
this could indicate that vulnerability is more at the   (ScoreA: 6.5-7; ScoreB: 0.7-1; Ruler: 1.2-2),
individual level rather than at a species level.        excluding grazing as a dietary preference. Only B.
                                                        brachypus had higher mean mesowear scores,
Which Mesowear Method is best for
                                                        which could suggest mixed-feeding, but as
Rhinocerotids?
                                                        mesowear could be assessed on two teeth only,
      In this study, we tested three different          this remains an assumption. Accordingly, this spe-
mesowear methods on our rhinocerotid sample. No         cies will not be further discussed. For the other
critical difference was observed between the three      associated species, ScoreB and Ruler suggest leaf
methods (Figure 8; Table 3), however each of them       browsing or mixed-feeding (Figure 8). Differences
relies on different scoring systems with their own      between deciduous and permanent teeth
advantages and disadvantages. For instance,             mesowear are highlighted with Ruler for all species

                                                                                                           17
HULLOT ET AL.: BÉON 1 RHINOCEROTIDS ECOLOGY
and for Pl. mirallesi only with ScoreB (Table 3). bachler et al. 2016 for 2D microwear), we found
Permanent teeth display higher mesowear score subtle variations in the textures suggesting differ-
than deciduous teeth, which might indicate a ent feeding behaviors among the four rhinocerotid
resource partitioning between the youngsters species. The relatively low values of Asfc for all
(weaned juveniles and subadults) and the adults. A species on both facets exclude the consumption of
less abrasive diet seems to be adopted by young- hard items, such as seeds, branches, or fruits with
sters still possessing milk teeth, which might help stone. This finding is consistent with the relatively
to avoid competition with adults and to preserve open environment proposed from Montréal-du-
deciduous teeth from excessive wear. ScoreA Gers (oxbow lake surrounded by savannah and
points toward a more abrasive diet than ScoreB open woodlands; Duranthon et al., 1999; Hullot
and Ruler, but still coherent with browsing or and Antoine, 2020). For the teleoceratines, the
mixed-feeding (Figure 8). Previous studies higher mean values of HAsfc for B. brachypus indi-
reported mesowear scores for extant rhinoceroses cate that this species might have included more
using different approaches (Fortelius and variety to its diet (Scott et al., 2006) compared to
Solounias, 2000; Taylor et al., 2013; Mihlbachler et Pr. douvillei. The anisotropy and textural fill volume
al., 2018; Rivals et al., 2020). The mean values were lower in B. brachypus than in Pr. douvillei,
reported by Rivals et al. (2020) for extant rhinos which confirms that the investigated specimens of
using Ruler are under 0.5 for all extant species but these closely related species had different dietary
C. simum (4.67). Such values are very different preferences. The microwear signature of Pl.
from those observed at Béon 1 (between 1 and 2 mirallesi (Table 2) is suggestive of an abrasive and
for Pl. mirallesi, Pr. douvillei, and H. beonense), homogeneous diet especially on the shearing
which could mean that modern rhinoceroses are facet. This pattern is similar to what is observed in
not strict dietary analogues of the most abundant extant strict grazers such as the white rhinoceros
rhinocerotid species documented at Béon 1. How- or in strict selective folivores like the Sumatran rhi-
ever, the values reported in the study of Mihl- noceros (Scott, 2012; Hullot et al., 2019). Given the
bachler et al. (2018) were more contrasted, with low-crowned dental pattern similar to that of D.
mean mesowear scores around 2 for Asiatic sumatrensis, selective folivory seems to be more
browsing rhinoceroses (Javan + Sumatran rhinos), likely than strict grazing as a diet for Pl. mirallesi.
3 for the Indian rhino, 4 for the black rhino, and 6 Eventually, H. beonense exhibits moderate values
for the grazing white rhino. With these scores, of all parameters suggestive of a relative flexibility
Béon 1 rhinos appear closed to the Asiatic brows- in the diet and probably of a mixed-feeding behav-
ing rhinoceroses, known to live in close dense for- ior (as inferred in early mesodont equids; Mihl-
est and relying mostly on leaf-browsing (Kahlke et bachler et al., 2011).
al., 2011; Hullot et al., 2019). With all the previous results discussed in
Concerning microwear, the patterns observed mind, we tried to provide feeding ecologies for
can be summed up as in Table 6. Although there is Béon 1 rhinocerotids. Overall, microwear and
a little overlap in microwear signals that could be mesowear concur, suggesting browsing or mixed-
due to sampling sites (see the discussion of Mihl- feeding diets. This congruence is especially veri-
TABLE 6. Summary of microwear pattern by species and DMTA parameter. epLsar: anisotropy; Asfc: complexity; FTfv:
fine textural fill volume; HAsfc: heterogeneity of the complexity (9 and 81 cells).
epLsar Asfc FTfv HAsfc9 HAsfc81
B. brachypus Low Low-Moderate Low-High Moderate Moderate
Pr. douvillei Moderate Low-Moderate Moderate-High Low-Moderate Low-Moderate
Pl. mirallesi Moderate-High Low Low-Moderate Low Low
H. beonense Moderate Low-Moderate Moderate-High Moderate Moderate
C. simum High Low - Moderate High Low Low
D. sumatrensis High Low Low Low Low
D. bicornis Low Moderate - High Moderate Moderate-High Moderate-High
R. sondaicus Low High High High High
R. unicornis Moderate High Moderate Moderate Moderate
18You can also read