Korean National Report to IAG 2015-2019 - International Association ...
←
→
Page content transcription
If your browser does not render page correctly, please read the page content below
International Union of Geodesy and Geophysics
                  International Association of Geodesy

                              2015-2019
             Korean National Report to IAG

           National Report to the XXVII General Assembly
                            Montreal, Canada
                            8. – 18. July, 2019.

                                  Edited by
                                Jungho Cho
                     National Delegate of IAG Council,
             Korea Astronomy & Space Science Institute (KASI)

Contributions from Sang-Oh Yi (National Geographic Information Institute:
NGII), So-Young Park (NGII), Hyun-Ho Kim (NGII), Seung-Weon Shin (NGII),
Kyoung-Min Roh (KASI), and Mansoo Choi (KASI)
CONTENTS

1. INTRODUCTION................................................................................................................ 1

2. SPACE GEODETIC INFRASTRUCTURE ..................................................................... 3

   2.1 GNSS ............................................................................................................................... 3

   2.2 VLBI ................................................................................................................................ 7

   2.3 SLR ................................................................................................................................ 11

   2.4 GGOS ............................................................................................................................ 13

3. GRAVITY FIELD ............................................................................................................. 15

4. EARTH ROTATION AND GEODYNAMICS ............................................................... 18

   4.1 Erath Rotation .............................................................................................................. 18

   4.2 Geodynamics ................................................................................................................. 26

5. APPLICATIONS ............................................................................................................... 31

   5.1 GNSS Data Sharing Platform ..................................................................................... 31

   5.2 Natural Hazards ........................................................................................................... 32

   5.3 SLR Dynamics .............................................................................................................. 40

INTERNATIONAL CONFERENCES ................................................................................ 43

PUBLICATION LISTS ......................................................................................................... 46

   Reports ................................................................................................................................ 46

   Reviewed Papers ................................................................................................................. 47

REFERENCES ....................................................................................................................... 54

Korean National Report to the International Association for Geodesy, 2019

1. INTRODUCTION

Over the period from 2015 to 2019, meaningful progresses on Space Geodesy in South Korea
have been made. On the aspect of Global Geodetic Observing System (GGOS) of
International Association of Geodesy (IAG), National Geographic Information Institute
(NGII) and Korea Astronomy and Space Science Institute (KASI) has successfully
cooperated to establish the Sejong geodetic fundamental site in which GNSS, VLBI, and SLR
are collocated since 2015. As needs of real time GNSS data both in geodetic and public are
growing, a GNSS data sharing system was opened in 2016 as a real time web-service in
which 174 GNSS sites nation-widely distributed are available.

KASI has taken the role of GPS Radio Occultation (RO) data center under the collaboration
with University Corporation for Atmospheric Research (UCAR), National Oceanic and
Atmospheric Administration (NOAA), Korea Meteorological Administration (KMA), and
Korea Aerospace Research Institute (KARI) since 2014. During the period, researches on
natural hazards monitoring and Earth rotation modelling had been performed at KASI while
NGII mainly focused on strengthening the role of geodetic VLBI facility as the national
geodetic origin and improving the national geoid model KNGeoid18. In recent years, Korea
Positioning System (KPS) designed to be seven satellites is under preliminary study
regarding reference frame, time system, and signal structure. This idea will be in depth
investigated for the feasibility and the usefulness by government.

Korean GNSS Network (KGN), which consists of Continuously Observing Reference Station
(CORS), has been upgraded by changing the GNSS receiving system and related facilities in
last few years. NGII cooperates with eight domestic institutions to make the GNSS Data
sharing platform in order to provide unified GNSS CORS data service. KASI has been
operating a data center of GPS radio occultation data obtained from the Atmosphere
Occultation and Precision Orbit Determination (AOPOD) system onboard Korea Multi-
Purpose Satellite (KOMPSAT)-5 since 2013. KOMPSAT-5 radio occultation products are
now available to worldwide weather communities via Global Telecommunication System of
the World Meteorological Organization (WMO) information system.

KASI completed the construction of the Accurate Ranging system for Geodetic Observation

                                               1
Korean National Report to the International Association for Geodesy, 2019

(ARGO) which consists of a mobile and a fixed SLR system. The ARGO-M (40 cm mobile
SLR) was developed in 2012 and relocated to Sejong GGOS site from KASI Headquarter,
Daejeon in July 2015 and the ARGO-F (1 m fixed SLR) was established with adaptive optics
at Geochang site in November 2017. The ARGO-M and the nearby VLBI and GNSS stations
of NGII will be fiducial stations for the International Terrestrial Reference Frame (ITRF).
Since September 2014, the geodetic VLBI system of NGII has been a participant of the
geodetic observation program of the IVS, an international body for VLBI. From the second
quarter of 2019, local tie survey will be started by integrating the various space geodetic
observation stations in Sejong.

NGII maintains the gravity control point which consists of absolute and relative gravity
points. In the course of this duty, NGII has developed Korea National Geoid (KNGeoid)
model since 2009 in order to provide the optimal precise geoid over whole Korean peninsula.
The latest version is the KNGeoid18 with a higher precision and a wider range. Meanwhile,
research works on Earth Orientation Parameters (EOP) Analysis based on a Machine
Learning Algorithm, Loading Effects on Reference Frame, and GNSS meteorological
applications have also been actively done and several key results are summarized in this
report.

                                            2
Korean National Report to the International Association for Geodesy, 2019

2. SPACE GEODETIC INFRASTRUCTURE

2.1 GNSS

For the GNSS-based geodetic surveying and an establishment of a positional reference
system, NGII operates the GNSS CORS distributed with approximately 40 km interspace and
a master control center as shown in Figure 2-1. The first of these is the Suwon CORS,
established in 1995. The CORS consists of GNSS receiver/antenna, dedicated communication
lines, power management systems, and meteorological monitoring equipment for temperature
and humidity, etc. The master control center comprises several components such as a real-
time monitoring system of the CORS status, a real-time data calibration service (Networked
Transport of RTCM via Internet Protocol: NTRIP) system, a GNSS data sharing system, and
a precise positioning and displacement monitoring system.

                                Figure 2-1. NGII GNSS CORS

                                             3
Korean National Report to the International Association for Geodesy, 2019

                             Figure 2-2. NGII GNSS CORS at Uljin

The CORS has Trimble or Leica equipment for continuous observation of satellite signals
such as GPS, GLONASS, Galileo and Beidou. Data observed at CORS are collected in real-
time at the NGII GNSS master control center. The center monitors CORS and provides the
observation data with RINEX format to support precise positioning and various real-time
calibration data services.

KASI is operating 11 GNSS reference stations including one IGS station DAEJ. Two of these
stations are located in the Chuuk Island of Micronesia (CHUK) and the Sainshand of
Mongolia (SSND). The geographical location of the reference stations is shown in Fig. 2-3.

                                Figure 2-3. KASI GNSS CORS

In 2017, KASI has replaced the SCIS type radome as shown in Fig. 2-4.

                                             4
Korean National Report to the International Association for Geodesy, 2019

              SKMA                                           SKCH

              MKPO                                           MLYN

              BHAO                                           KOHG

              JEJU                                           SBAO

              SSND                                           CHUK

                 Figure 2-4. Image of the KASINET GNSS stations

                                       5
Korean National Report to the International Association for Geodesy, 2019

KASI is also operating the IGS global data center (GDC) that archives and provides GNSS
data from the Asia-Oceania region. The KASI GDC also archives and shares all the IGS
products from worldwide IGS stations and IGS analysis centers (ftp://nfs.kasi.re.kr,
http://gdc.kasi.re.kr). In 2018, KASI extended GDC storage by adding another 32TB real-
time backup disk to prevent from a disk failure.

In addition, KASI has been operating a monitoring station (DAE2) of the Japanese Quasi-
Zenith Satellite System (QZSS) signals since 2011. In international collaboration with the
French space agency (CNES) and Institute Geographique National (IGN), KASI has been
established REGINA (REceiver GNSS network for IGS and NAvigation) in South Korea for
scientific purposes regarding the GNSS positioning and navigation. The REGINA GNSS
station (GAMG) began regular operation in July 2016 and was registered in 2018 as an IGS
network.

As a spaceborne GNSS infrastructure, KASI has been operating a data center of GPS radio
occultation data obtained from the Atmosphere Occultation and Precision Orbit
Determination (AOPOD) system onboard Korea Multi-Purpose Satellite (KOMPSAT)-5
since 2013 in collaboration with University Corporation for Atmospheric Research COSMIC
Data Analysis and Archive Center (CDAAC) for data processing and distribution to research
community. In order to make the data available in near real-time for numerical weather
prediction, KASI is working with Korea Aerospace Research Institute (KARI) and National
Oceanic and Atmospheric Administration (NOAA) National Environmental Satellite Data,
and Information Service to increase downlink capability reducing the data latency.
KOMPSAT-5 radio occultation products are now available to worldwide weather
communities via Global Telecommunication System of the WMO information system; a
global network of high-quality meteorological data distribution. Data and products are also
available at AOPOD website (https://aopodweb.kasi.re.kr; ftp://aopod-ftp.kasi.re.kr) and
CDAAC.

                                              6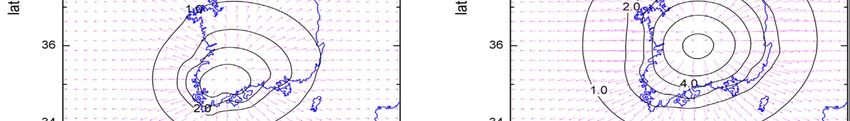
Korean National Report to the International Association for Geodesy, 2019

2.2 VLBI

Construction of the geodetic VLBI system, operated by the Space Geodetic Observation
Center of NGII, was completed in June 2012 (Figure 2-5). Since September 2014, the system
has been a participant of the geodetic observation program of the IVS, an international body
for VLBI. As can be seen in Figure 2-6, approximately 1,400 hours of domestic and overseas
observations are being made from 2015 to 2019. From 2018 onward, the ratio of domestic
observations has been increased slightly.

      Figure 2-5. The Korean Space Geodetic Observation Center and the Sejong VLBI Antenna

       Figure 2-6. Annual observation hours for the Sejong VLBI (KVN: Korean VLBI Network)

                                               7
Korean National Report to the International Association for Geodesy, 2019

The technical specifications of the Sejong antenna are presented in Table 2-1. The Sejong
VLBI has a Cassegrain main reflector having a 22M diameter, and a total of four S, X, K, and
Q band receivers. The S and X band receivers are mainly used for IVS observation, while the
K and Q band receivers are used in observations for the KASI VLBI Network and the East-
Asia VLBI Network (EAVN).

                               Table 2-1. Sejong Antenna Specifications

   Parameters                                                       Sejong VLBI
   IVS letter codes                                                Sejong (KV)
   CDP number                                                          7368
   DOMES number                                                     23907S001
   Location                                             127°.18′E 36°.31′N Elevation 177m
   Diameter of main reflector                                          22m
   Antenna type                                                 Shaped Cassegrain
   Aperture efficiency                                              about 60%
   Pointing accuracy                                                 0.0131°
   Reflector surface accuracy                                           100㎛
   Operation range                                              AZ: ±270° EL: 0 ~ 90°
   Slew speed                                                    5°/sec (AZ and EL)
   FS Version                                                           9.10.4
   Data acquisition Recorder                                              K5

                         Table 2-2. Receiving system of the Sejong VLBI

        Band                            S               X                 K        Q
        Freq.[GHz]                   2.1~2.6          8.0-9.0       21-23         42-44
        Receiver noise temp.          < 20K           < 30K         < 50K         < 80K
        Polarization                   R,L              R,L          R,L           R,L
        SEFD                          1,000             800            -             -
        Aperture efficiency            0.6              0.6          0.6           0.6

Two different systems, which are Mark6 and K5, are used to record observation data from the
Sejong VLBI. Recently, existing equipment is being upgraded, including the adoption of
DBBC3 digital back end equipment. As a correlator, DiFX software is being used to perform
correlation analysis for domestic VLBI observation data in-house. A server cluster, connected
to 10 servers, has been implemented, capable of storing and performing correlation analysis
on approximately 250TB of data. Domestic observation data is being analyzed approximately
10 times per year.

                                                  8
Korean National Report to the International Association for Geodesy, 2019
KVN Reference Points
The Korean VLBI Network (KVN) is the first VLBI facility in Korea, with three 21-m radio
telescopes in Seoul (Yonsei), Ulsan, and Jeju (Tamna) island, operated by KASI. KVN has
been participating in K band (22 GHz) geodetic VLBI observations together with VLBI
Exploration of Radio Astrometry (VERA) of the National Astronomical Observatory in Japan
(NAOJ) on behalf of the KVN and VERA Array (KaVA) geodesy program since 2011.
For Astrometry and Geodesy, it is important to determine an accurate reference position,
often called the invariant point (IVP), of the radio telescope and to monitor the variation
caused by crustal movement and gravitational deformation. To determine the IVP of KVN
telescopes, we performed geodetic surveys at the KVN Ulsan and Tamna sites in a
conventional way for the first time in 2017. Since the IVP is the intersection of the vertical
(Az) and horizontal (El) axes, it is not directly accessible in most cases. Shown in Figure 2-7,
the IVP marked in bold on the Az axis is the invariant point to be determined. IVP1 and IVP2
are the nearest points on the Az axis. ⃗
and ⃗
represent the nearest distance vectors from
the El axis perpendicular to the Az axis.
Figure 2-7. Illustration of IVP determination
9Korean National Report to the International Association for Geodesy, 2019
Based on the results of the optical survey using Leica Nova MS60 Multistation, the targets
form circles and arcs from the Az and El surveys, respectively. And the Az and El axes were
estimated by applying 3D least-square line fitting method that minimizes the distance
between the center points of circles calculated from the 3D circle fitting of target positions as
shown in Figure 2-8 and 2-9.
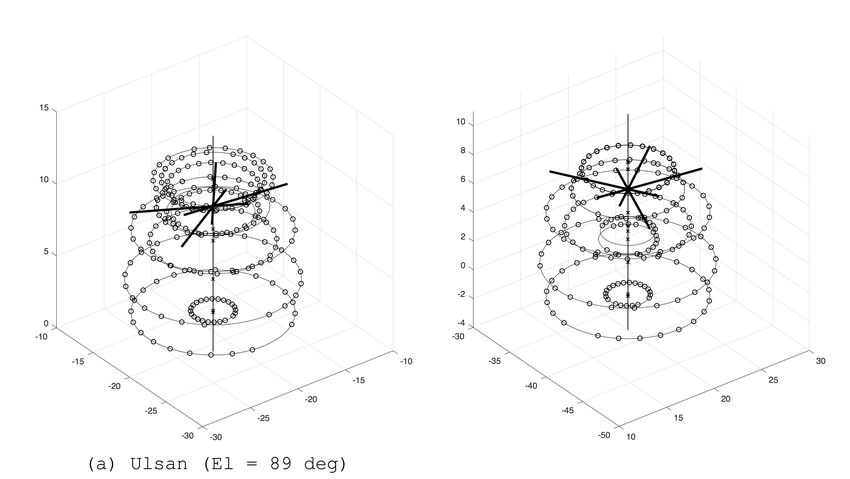
Figure 2-8. The results of 3D circle fitting for the El axis (Yoo et al., 2018)
(a) Ulsan (El = 89 deg) (b) Tamna (El = 89 deg)
Figure 2-9. The results of 3D circle fitting for the Az axis (Yoo et al., 2018)
In order to obtain the 3D geocentric coordinates of the IVP, the Helmert transformation were
used to convert coordinates from the local frame in which the IVP survey can be performed
to the geocentric frame. The geocentric coordinates of the IVP in ITRF2014 are listed in
Table 2-3.
10Korean National Report to the International Association for Geodesy, 2019
Table 2-3. KVN IVP Coordinates in ITRF2014
Ulsan Tamna
IVP 2017 Nov. 23, UT12:00 2017 Dec. 06, UT12:00
X -3287268.72004 -3171731.72457
Y 4023450.07902 4292678.45749
Z 3687379.93904 3481038.73301
Also, the axis-offsets caused by the telescope type, imperfections in construction, and
gravitational deformations were estimated as 0.86 ± 0.49 mm for Ulsan and 2.43 ± 0.45 mm
for Tamna. Based on the IVP determination of the KVN Ulsan and Tamna telescopes, high
precision astrometric and geodetic VLBI observations using KaVA and EAVN will be
promoted, especially at higher frequencies (22/43 GHz). In addition, these results will
provide an important basis for the multi-frequency VLBI phase referencing, which is capable
of constraining the amount of delay errors separately, so that a new prospect on astrometry
and geodesy will be explored with the KVN. For the KVN Yonsei located in Seoul, we are
planning to use the gimbal-mounted GNSS antennas as an alternative method due to the
limited area near the site for optical survey.
2.3 SLR
Sejong ARGO-M
KASI has completed the ARGO (Accurate Ranging system for Geodetic Observation) project
to develop one mobile and one fixed SLR systems, ARGO-M and ARGO-F respectively. The
ARGO-M SLR system was developed and installed temporarily at the KASI headquarters in
2012, and system improvements were made in 2014. In July 2015, the system was relocated
to Sejong and is under regular operation phase. Since January 11, 2016, Sejong SLR Station
has been providing official data to ILRS. In particular, it is capable of making observations at
a high repetition of 5 kHz, thus enabling greater precision in research.
11Korean National Report to the International Association for Geodesy, 2019
Figure 2-10. Sejong SLR Station (ARGO-M)
Figure 2-11. Registration of Sejong SLR Station in ILRS
Geochang ARGO-F
Having established its SLR system and adaptive optics system in November 2017, Geochang
SLR Station is currently conducting test observations. While Sejong SLR Station can track
medium Earth orbit satellites (approx. 24,000 km) with its 0.4 m primary mirror, it is unable
to track satellites in geostationary orbit (36,000 km). Equipped with a 1.0 m primary mirror,
Geochang SLR Station can track satellites in low Earth orbit (LEO), medium Earth orbit
(MEO), and geostationary orbit.
12Korean National Report to the International Association for Geodesy, 2019
Figure 2-12. Geochang SLR Station (ARGO-F)
Figure 2-13. Registration of Geochang SLR Station in ILRS
2.4 GGOS
Local Tie at the Sejong GGOS Site
The GGOS site integrates space geodetic systems that previously operated independently of
one another, and aims to provide a reference coordinate, necessary for geodetic observations,
as well as high-precision data for the determination of Earth’s rotation parameters. It is
certified and managed by the GGOS committee of IAG.
Sejong SLR Station of KASI and the nearby VLBI and GNSS stations of the Space Geodetic
Observation Center of NGII will contribute to determining the ITRF and EOPs. Since each
station utilizes different space geodetic techniques, their relative positions must be precisely
determined to ensure the accuracy of the resulting reference frame.
13Korean National Report to the International Association for Geodesy, 2019
As shown in figure 2-14, each pillar around the Sejong SLR Station was designed to be solid
from the deformation due to annual and daily temperature changes. In consideration of inter-
visibility with Pillar 1 at the NGII Center, Pillars A, B, and C were given heights of 3,100
mm, 1,000 mm, and 1,700 mm, respectively.
Figure 2-14. Local tie survey pillar installation at Sejong GGOS Site
From the second quarter of 2019, the local tie survey between VLBI-GNSS-SLR will be
started. Measurements will be taken four times a year, and the results will be released in the
form of a quarterly report.
Figure 2-15. The certificate of Sejong GGOS Site (May 2019)
14Korean National Report to the International Association for Geodesy, 2019
3. GRAVITY FIELD
National Control Point
The National Control Point (NCP) is a measured point providing basic position information
for national base map and land development. The NCP in Korea, based on the Act on the
establishment, management, etc. of spatial data, consisted of 7 types for land and 2 types for
maritime affairs: VLBI, Satellite control point (GNSS CORS), Unified control point,
Triangulation point, Benchmark, Gravity point, Magnetic Point; Hydrographic point and
Territorial base point. Among above, NGII has determined the NCPs for land which is the
hierarchy shown in Fig. 3-1.
Figure 3-1. The hierarchy of national control points (NCP) in Korea
Unified Control Point
In the recent years, one of the dominant changes in Korean geodetic network is the activities
15Korean National Report to the International Association for Geodesy, 2019
on the establishment of the Unified Control Points (UCP). The UCP provides the geodetic
coordinates, ellipsoidal height, orthometric height and the gravity value at the same point.
The objective is to fully utilize the satellite positioning technology and to establish the
complete compatibility in worldwide coordinate system. On top of that, scientific and
engineering data being provided at the same point with accurate spatial information is
expected to enhance research quality so that more detailed analysis on physical phenomena
could be performed. From 2008 until 2019, there are a total of 5,500 markers installed all
over the country with 3 km ~ 5 km spacing.
Gravity Survey
NGII also maintains the gravity control point which consists of absolute and relative gravity
points. Currently, 20 absolute gravity points have been established by the measurement of
FG5 absolute gravimeter and regularly measured in 5-year intervals. In order to achieve
denser gravity data over the country, relative gravity surveying has been conducted by CG5 at
a part of the NCPs, and around 15,000 points have been measured until 2019.
Korea National Geoid Model
NGII has developed Korea National Geoid (KNGeoid) model since 2009 in order to provide
the optimal precise geoid over whole Korean peninsula. After developed the KNGeoid14, the
KNGeoid18 (NGII, 2018) was newly developed with a higher precision and a wider range, by
using measured data until 2017. The comparison of the version of the KNGeoid is shown in
Table 3-1.
In next years, additional measurements will be obtained on outlying areas of the country to
construct a more precise geoid model. In addition, to support the adoption of orthometric
height taking advantage of GNSS measurements in practical fields, related regulations are
under consideration.
16Korean National Report to the International Association for Geodesy, 2019
Table 3-1. Comparison of KNGeoid14 and KNGeoid18
Item KNGeoid14 KNGeoid18
Precision
Gravimetric model 6.81cm 4.38cm
Hybrid model 3.55cm 2.33cm
Coverage
Latitude 33˚ ~ 39˚ 33˚ ~ 39˚
Longitude 125˚ ~ 131˚ 124˚ ~ 132˚
Resolution 0.01636˚ 0.01636˚
Used data
Global gravity model EGM08 XGM2016
Gravity data (land) 9,455 points 12,117 points
GNSS/Leveling data 1,034 points 2,791 points
17Korean National Report to the International Association for Geodesy, 2019
4. EARTH ROTATION AND GEODYNAMICS
4.1 Earth Rotation
A Machine Learning Algorithm and Topological Data Analysis
Precise analysis of Earth rotation metrics is crucial in understanding changes to the Earth
environment and for short- and long-term climate change forecasting. Development of VLBI
has made possible extremely precise observation of Earth’s polar motion. NGII and Ajou
University have proposed an accurate and efficient method for detecting motion anomalies in
VLBI data through topological data analysis and deep learning (NGII, 2018).
Theoretical models for Earth rotation metrics are assessed using convection, glacial
movement, crust movements, ocean base pressure, atmospheric pressure and wind direction
as parameters. Actual observation values and theoretical model values can be visualized as
shown in Figures 4-1 and 4-2.
Figure 4-1. Observed and theoretical values for time-series data on Earth rotation metrics (X component)
Figure 4-2. Observed and theoretical values for time-series data on Earth rotation metrics (Y component)
18Korean National Report to the International Association for Geodesy, 2019
Earth rotation observation data is a collection of values which are determined by numerous
parameters including solar and lunar gravity, and movement of the Earth’s atmosphere and
crust. In this data exists multi-dimensional topological space created by these parameters.
Accordingly, Earth rotation data obtained through simulation experiments based on theory is
expressed as the multiplication product of the probability distributions for the respective
parameters, expanding data size. The data obtained through VLBI observations also has high
spatial and temporal resolution, and is data of a massive scale. Finding regular signal patterns
apparent in this big data to understand Earth rotation, and detecting signal anomalies
divergent from theoretical values or regular observation patterns involves mathematical and
computational difficulty. In particular, comparing theoretical values found using known
parameters and actual observation data to find parameter probability distributions or discover
anomalous patterns requires consideration of both noise in observed values and theoretical
model uncertainties. Accordingly, development of high-precision analytical methods is
necessary.
The National Geographic Information Institute and Ajou University, in keeping with such
requirements, wish to propose two big data analysis techniques for analysis of big data on
Earth angular momentum deduced from VLBI observation data. The first is a topological data
analysis method wherein observation signals are mathematically interpreted by calculating
the topological shape of data in the topological space where the observation data exists, and
performing deep learning based on such interpretation to analyze data. The second method
involves use of deep learning using data obtained through theoretical models and
observational big data, finding patterns in changes to Earth angular momentum and analyzing
signal anomalies.
For analysis of residuals between observed and theoretical values for Earth rotation metrics, a
method of Earth rotation metrics data analysis using topological data analysis and
convolutional neural networks was devised. This is because the conventional methods of
signal analysis, including Fourier analysis, spectrum analysis and wavelet analysis are limited
to linear models and are unsuitable for signal anomaly detection. Topological data analysis is
carried out by mapping given time-series data to a specific topological space, and calculating
homology groups for each dimension of the topological space. The observed and model
values for Earth rotation data given for topological data analysis were projected onto a two-
dimensional sphere, and the homology groups for the topological space were calculated.
19Korean National Report to the International Association for Geodesy, 2019
At the respective points on the topological space formed by projection onto a two-
dimensional sphere, the reference distance t is increased. If the distance between two points is
less than t, the two points are connected. As t gradually increases, first-dimension and
second-dimension groups are created and disappear, and this data is used to output a
persistent diagram. The resulting persistent diagrams show that the observed and model
values for Earth rotation metrics data form different topological spaces.
Figure 4-3. Persistent diagram for topological space with Earth rotation metrics data projected onto two-
dimensional sphere (Green dots: observed values; Red dots: theoretical values)
Upon visual inspection of the graphs for observed and theoretical Earth rotation metrics data,
it is difficult to identify whether or not the theoretical model explains natural phenomena well,
or whether anomalies which the model cannot explain exist. The convolutional neural
network model and other deep learning models have recently exhibited high performance in
classification models and regression models. Two-dimensional convolutional neural networks,
which are exhibiting particularly high performance in the field of computer vision, use small
rectangular filters to discover patterns in regional data within an image. By the same principle,
applying a one-dimensional convolutional neural network to time series data, it is possible to
find patterns which occur repetitively in data. In the present study, learning was performed
with observed values and theoretical model values with added random Gaussian noise and a
convolutional neutral model classifier. By carrying out tests with random given data,
classifier performance was quantified. 10,000 data were generated for each of observed
values and theoretical model values for learning, adding random Gaussian noise.
20Korean National Report to the International Association for Geodesy, 2019
Figure 4-4. Results of classifier accuracy assessment using test data
Figure 4-4 illustrates classifier performance when a one-dimensional neural network was
taught using data for the entire period (January 1979 to December 2013, 420 months). From
the fact that the given observed values and theoretical model values were accurately
classified using a simple two-layer depth one-dimensional convolutional neural network, it
was confirmed that there were periods where the theoretical model was unable to explain
actual metrics.
To detect the existence of Earth rotation signals in periods of scales smaller than above, data
was sequentially horizontally shifted in 12-month units to form a data set. The one-
dimensional convolutional neural network classifier model was taught using the data set, and
the results of classifier performance quantification are shown in Figure 4-5. This Figure
illustrates the ratio of incorrect results from the one-dimensional SNN classifier when using
x-axis component data for Earth rotation metrics. Values closer to 0 indicate higher classifier
accuracy, and the results imply that the theoretical model does not sufficiently explain natural
phenomena. Conversely, values closer to 0.5 indicate the classifier was unable to distinguish
between observed and theoretical model values.
Through topological data analysis, a clear difference was confirmed between the topological
spaces formed by observed and theoretical model values for Earth rotation metrics. From the
fact that a shallow, 2-layer depth convolutional neural network classifier was able to
accurately distinguish observed values and model values with added noise, it could be known
that the Earth rotation metrics theoretical model was unable to sufficiently explain actual
natural phenomena. In future research, a means of predicting actual phenomena and detecting
movement anomalies through a theoretical model for Earth rotation metrics based on
parameters such as atmospheric movement, crust movement, and glacial movement, etc.
21Korean National Report to the International Association for Geodesy, 2019
while using a recurrent neural network taught using past data will be proposed.
Figure 4-5. Ratio of incorrect results from one-dimensional CNN classifier
Atmospheric Excitation
The atmosphere strongly affects the Earth’s spin rotation in wide range of timescale from
daily to annual. Its dominant role in the seasonal perturbations of both the pole position and
spinning rate of the Earth is once again confirmed by a comparison of two recent data sets; i)
the Earth orientation parameter and ii) the global atmospheric state.
A daily basis Earth’s spin rotational time series data by the name of EOP 08 C04 (Bizouard
& Gambis 2009) was obtained from the IERS website for this study (http://www.
iers.org/IERS/EN/IERSHome/). The EOP C04 dataset is composed of the pole position (xp, yp)
and the spin change in terms of excessive amount of length of day (Δl.o.d.). ECMWF datasets
for global atmospheric pressure and wind velocity for the time span between Jan 1981 and
Dec 2015 were extracted and processed to derive the atmospheric excitation function
(http://www.ecmwf.int). Two contributions from: i) excessive mass (pressure) and ii) motion
(wind) were evaluated separately, and then summed together resulting the total atmospheric
excitation functions (χ1, χ2, χ3) to be compared with the observed excitation inferred from
polar motion data.
From the polar motion and l.o.d. time series of EOP C04, the observed excitation functions
were computed. And the atmospheric excitation functions acquired from ECMWF data. To
22Korean National Report to the International Association for Geodesy, 2019
better compare the two kinds of excitation functions, those parts of five year time span (2010-
2015) are shown again on three separate figures (Fig. 4-6 (a)-(c)). In all these three
comparisons (a-c), similarities between the observed excitation and the calculated
atmospheric excitation are noticeable. From the excitation function χ3obs shown in Fig. 4-6
(c), it is found that l.o.d. is shorter by about -0.65 millisec in late June - early September and
longer by +0.65 millisec from winter to spring time. Seasonal variations are not quite clear in
the two (observed and atmospheric) excitation time series of χ1, while one-year periodicity is
distinct in both sets of χ2 and χ3. The amplitude of atmospheric excitation χ2atm slightly
exceeds that of observed one. Correlation of observed and atmospheric excitation is best for
χ3; however, high frequency terms are much reduced in the atmospheric excitation χ3atm.
Figure 4-6. Three sets of both observed and calculated excitation functions χ1, χ2, χ3 redrawn for a five-
year time span between Jan 1, 2010 to Dec 31, 2014. Units are [arcsec] for χ1, χ2 and [10-8] for χ3
(Na et al., 2016)
23Korean National Report to the International Association for Geodesy, 2019
Deceleration & Acceleration (New Calculation)
The global oceanic/atmospheric tides exert decelerating/accelerating secular torques on the
Earth rotation. We developed new formulations to accurately calculate amounts of two kinds
of secular tidal torques. After Melchior, we found that an additional factor 1+k-l = 1.216,
which has been formerly neglected, must be multiplied unto the tidal torque integral. By
using our refined formulations and the recent oceanic/atmospheric global tide models, we
found that: (i) semidiurnal oceanic lunar/solar tides exert decelerating torques of about -4.462
x 1016 / -0.676 x 10¹⁶ Nm respectively and (ii) atmospheric S2 tide exerts accelerating torque
of 1.55 x 10¹⁵ Nm. Former estimates of the atmospheric S2 tidal torque were twice as large as
our estimate due to improper consideration of loading effect. We took the load Love number
for atmospheric loading effect from Guo et al. (2004). For atmospheric loading of spherical
harmonic degree two, the value of k’= -0.6031 is different from that for ocean loading as k’ =
-0.3052, while the latter is currently used for both cases e ocean/atmospheric loading e
without distinction. We discuss (i) the amount of solid Earth tidal dissipation (which has been
left most uncertain) and (ii) secular changes of the dynamical state of the Earth-Moon-Sun
system. Our estimate of the solid Earth tidal torque is -4.94 x 10¹⁵ Nm.
Tidal force on the Earth is schematically illustrated in Fig. 4-7 a. Ocean tide is one of the
largest periodic perturbations of the Earth, and its prediction has been important both in the
scientific communities and civic societies. Due to tidal dissipation, there exists certain
amount of phase delay in ocean tides. As a result a decelerating torque is being exerted to the
Earth (see Fig. 4-7 b). Although pioneers suspected this interaction should occur in the Earth-
Moon system, they could not figure out its amount until the global ocean tide modeling being
feasible. Compared with the first stage ocean tide models in 70s and 80s, the model accuracy
and resolution are being enhanced by one order of magnitude nowadays. It has been our first
objective in this study to make more accurate estimate of the secular ocean tidal torque. There
were two former investigations on the same issue but with more or less different approaches
two or one decade ago (Ray et al., 1999, Mathews & Lambert, 2009). Both of them neglected
the factor -1+k-l = 1.216.
24Korean National Report to the International Association for Geodesy, 2019
Due to periodic solar insolation unto the
Earth, two harmonic oscillations of
periods of 12 and 24 h exist in the
barometric pressure over the globe,
which are referred as S2 and S1
atmospheric tides respectively, although
they are not caused by lunisolar tidal
force. Unlike ocean tide, the 12 h period
barometric pressure records maximum
about 2 h early in most places and
therefore exert accelerating torque (see
Fig. 4-7 c). Munk and MacDonald early
estimated the atmospheric tidal
acceleration on Earth rotation (Munk &
McDonald, 1960). Later others
occasionally made estimates of
atmospheric tidal acceleration
(Lambeck, 1980, Ray et al., 1999).
However their results overestimated it
due mainly to inaccurate treatment of
loading effect. Atmospheric tide models
are also being updated as well from its
early versions (Ray & Ponte, 2003,
Schindelegger, 2014).
As our new calculation, the secular tidal
torques exerted to the Earth by ocean
tide and atmospheric tide are found as -
Figure 4-7. Schematic figures of tidal force exerting on the 5.14 x 10¹⁶ and 1.55 x 10¹⁵ Nm
Earth and comparison of accelerating torque by oceanic
M2 tide and decelerating torque by atmospheric S2 tide: respectively. The sum of these two tidal
(a) Tidal force vector on the surface of the Earth, (b)
Description of oceanic M2 tidal torque and associated
torques is – 4.99 x 10¹⁶ Nm. Ocean
equivalent phase delay, (c) Description of atmospheric S2 tidal torque -5.14 x 10¹⁶ Nm is
tidal torque and associated phase lead. (Na et al. 2019)
composed of torques of two distinct
origins - the Moon and Sun.
25Korean National Report to the International Association for Geodesy, 2019
Lunar tidal torque -4.46 x 10¹⁶ Nm decelerating the Earth should be accompanied with
opposite torque exerting to the Moon. Due to obliquity angle of about 23.5º, secular torque
on the Moon is effectively reduced by a factor of 0.917. Corresponding increase rate of lunar
distance is 1.09 x 10⁻⁹ m/s. Present lunar recession rate of 3.8 cm/yr or 1.22 x 10⁻⁹ m/s is
larger than this amount; 1.09 x 10⁻⁹ m/s, and the difference could mainly come from tidal
dissipation in the Earth's mantle and crust. Although the Earth's body tide itself can be
predicted quite accurately, inelasticity and energy dissipation inside the Earth is not well
known. Based on our estimates above, we conclude that body tidal torque is -4.94 x 10¹⁵ Nm,
which is about 10 percent of ocean tidal torque.
4.2 Geodynamics
Atmospheric loading on the Korean Peninsula
Displacement of the Earth’s surface due to atmospheric loading has been recognized since a
century years ago, and its accurate estimation is required in present day geodesy and
surveying, particularly in space geodesy. Atmospheric load deformation in continental region
can readily be calculated with the given atmospheric pressure field and the load Green’s
function, and, in near coastal area, approximate model is used for the calculation. The
changes in the Earth’s atmospheric circulation and the seasonal variation of atmospheric
pressure on two hemispheres of the Earth are the each main causes of variation of the Earth’s
spin angular velocity and polar motion respectively. Wind and atmospheric pressure do the
major role in other periodic and non-periodic perturbations of the positions in the Earth’s
reference frame and variations in the Earth’s spin rotational state. In this reviewing study, the
developments of related theories and models are summarized along with brief description of
phenomena, and the geodetic perturbing effects of a hypothetical typhoon passing Korea are
shown as an example.
We calculated the deformation of the Korean peninsula induced by a hypothetical typhoon
passing through it. The assumed path is drawn with five particular locations on its way (Fig.
4-8 a). The central pressure and radius of the typhoon were taken constant as 950 hPa and
150 km respectively at all the five locations. The simulated deformation due to the low
26Korean National Report to the International Association for Geodesy, 2019
atmospheric pressure of the hypothetical typhoon placed at the each location was acquired
repeatedly and illustrated (Fig. 4-8 b-f). Maximum uplift in the peninsula slightly exceeds 6
mm, when the main parts of the typhoon lie on the peninsula.
We used the load Green’s function calculated for the IASPEI Earth model (Na and Baek,
2011), because the physical properties of the Earth’s crust and upper mantle around Korea is
closer to that one. Unlike the Yellow Sea and the South China Sea (called ‘South Sea’ in
Korea), the Korea-Japan Sea (called ‘East Sea’ in Korea) has narrow channels to outer open
oceans, therefore, the ‘inverted barometer’ concept need to be used differently with treating
the Korea-Japan Sea as a large lake. According to van Dam et al. (2010), a few millimeter
errors were found during the atmospheric loading calculation in area of highly variable
topography. Further investigations are needed on such points.
Seasonal Atmospheric Loading on Continents
Northern Eurasian continent has been regarded to contribute as the major source area, of
which seasonal atmospheric pressure loading and unloading cycle leads to the annual wobble
of the Earth. In the early days when reliable data of global coverage were not accessible, this
dominance has remained as only a hypothesis. Nowadays, however, European Centre for
Medium-Range Weather Forecasts and National Centers for Environmental Prediction
produce reliable datasets, therefore, such unique feature has become clearer with quantitative
evidences. Having both the Earth’s polar motion and the global atmospheric state known with
unprecedented accuracy, we hereby identify and scrutinize whether Siberia and Manchuria
dominate the annual polar motion of the Earth.
Annual wobble is one of the two main components of Earth’s wobbling motion. While
Chandler wobble excitation mechanism has been controversial for a long time, it is evident
that annual wobble is driven by geophysical phenomena having periodic seasonal variations.
And it has been presumed since early times that Siberia does a noticeable role in the annual
wobble excitation, i.e., periodic loading/unloading of air mass over the wide Siberian land
may result in major contribution on the Earth’s annual wobble.
Information of worldwide weather are gathered and assimilated in European Centre for
Medium-Range Weather Forecasts (ECMWF) and National Centers for Environmental
Prediction (NCEP) for the purpose of weather forecasting as well as to provide datasets
necessary for scientific investigations. The 6-hr period global data coverage by ECMWF on
27Korean National Report to the International Association for Geodesy, 2019
Figure 4-8. Demonstration of the atmospheric loading induced deformation due to a hypothetical typhoon:
(a) Path of the hypothetical typhoon passing Korea, (b-f) Calculated vertical and horizontal displacement
induced by the hypothetical typhoon placed at 5 each locations marked in (a). The contour lines
correspond to equal uplift (contour interval: 0.5 mm in (b) and 1 mm in (c-f)), and the pink arrows
represent horizontal displacements at grid points. (Na & Cho, 2015)
28Korean National Report to the International Association for Geodesy, 2019
wind velocity and barometric pressure can be used to infer the atmospheric excitation of
Earth rotation. We analyze monthly average values of differential surface atmospheric
pressure from local yearly average in the year of 2016. On the northern part of Eurasian
continent, i.e., Siberia and Manchuria, high atmospheric pressure exists from October to
March, while low atmospheric pressure prevails from May to August. Although this seasonal
loading/unloading cycle has been thought as the main input to annual wobble since the
beginning of last century, reliable estimations have been deferred until the advent of accurate
source of information, such as ECMWF dataset or comparable sort.
In this study, we compare (1) the observed geodetic excitation inferred from the recent polar
motion data and (2) the calculated atmospheric excitation due to seasonal atmospheric
loading/unloading on Northern Eurasia as well as four other continents, namely, North
America, South America, Australia, and Africa. We used IERS EOP C04 and ECMWF
atmospheric pressure datasets each. As the results, we have five-year (2010-2015) geodetic
excitation function for χ1 and χ2. Each function consists of five components which are
geodetic excitation, atmospheric excitation (wind and pressure), atmospheric excitation (wind
only), atmospheric excitation (pressure only), and atmospheric excitation (pressure of Siberia
and Manchuria).
We repeated the computation for atmospheric pressure excitation on other continents, North
America, South America, Australia, and Africa. The amplitudes of the geodetic excitation
and calculated excitation due to atmospheric pressure on the five continents are illustrated
together in Fig. 4-9 for their comparison. It has been found that the atmospheric pressure
loading/unloading annual cycle on Siberia and Manchuria gave rise to 15.61 milliarcsec
excitation in χ2 component, which is 54% of total excitation observed, while the same area
gave rise to much smaller χ1 excitation. The atmospheric loading/unloading on Australia gave
rise to rather large excitation both on χ1 and χ2.
29Korean National Report to the International Association for Geodesy, 2019
Figure 4-9. Comparison of geodetic excitation and five annual excitation fits on the atmospheric pressure
loading/unloading on the 5 continents – Eurasia, N. America, S. America, Australia, and Africa. (Na et al.,
2018)
30Korean National Report to the International Association for Geodesy, 2019
5. APPLICATIONS
5.1 GNSS Data Sharing Platform
The NGII uses PIVOT from Trimble and GNSmart from Geo++ to provide free VRS and
FKP calibration signal services to the private sector. One million users use the Networked
Transport of RTCM via Internet Protocol (NTRIP) based real-time calibration data service
through each year, with usage increasing every year.
Figure 5-1. Ntrip calibration data service
Recently, addition of various communication protocols such as DMB and LTE is being
considered to furnish additional services. Since 2017, through agreements with domestic
broadcasters, Single-RTK calibration signals are being serviced using terrestrial DMB.
An State Space Representation (SSR) correction data service is also being prepared.
Feasibility studies for adoption of new calibration signals, including positioning accuracy
checks and other utilization of SSR correction signals, are being carried out, and depending
on the results, private sector SSR correction data service will begin in 2020 at the earliest.
The NGII works with eight institutions to operate the GNSS Data Sharing Center in order to
provide unified service using data from the GNSS CORS operated by domestic research
institutes and universities. The GNSS Data Sharing Center gathers data from upward of 180
CORS operated by the respective institutions. This data is serviced through the website, and
daily RINEX and RTCM are provided. RTCM is provided through the Ntrip server, and the
respective CORS function as mount points to provide calibration signals.
31Korean National Report to the International Association for Geodesy, 2019
Figure 5-2. The webpage of the GNSS Data Sharing Center
5.2 Natural Hazards
Troposphere
Atmospheric water vapor is one of crucial gases for energy transfer and greenhouse effects.
Nowadays GNSS meteorology enables continuous monitoring of the atmospheric water vapor
in near real time. KASI developed GNSS precipitable water vapor (PWV) system in order to
apply the PWV to numeric weather predictions in near real-time.
Figure 5-3 shows the near real-time GNSS PWV system that consists of Data PRocessing
server (DPR), Data Receive and Service server (DRS), and Test and EValuation server (TEV).
The DPR processes GNSS data and then retrieves PWV from estimated zenith total delay
(ZTD) with an optimal mean temperature equation (MTE) for the Korean Peninsula. The
DRS collects data from more than eighty permanent GNSS stations using NTRIP and
provides the GNSS PWV to a user. The TEV is in charge of redundancy of the DPR. The
GNSS PWV system uses three high performance computers to process enormous data in near
real-time. In addition, Bernese GNSS software 5.2 produces a local network solution every
32Korean National Report to the International Association for Geodesy, 2019
10 minutes using GNSS observation data that shifts every 10 minutes with a sliding time
window of 24 hours.
Figure 5-3. Near real-time GNSS PWV system
Several local mean temperature equation models (MTEs) had been developed and were
compared with each other including a regional (Bevis et al., 1992) and a global (Mendes,
1999). Detailed information of the models are summarized in Table 5-1 (Wu, 2003; Ha &
Park, 2008; Song &G.-Brzezinska, 2009; Song, 2009). Unlike the other annual models, Song
I and Song II are seasonal corresponding to summer and winter respectively. As shown in
Figure 5-4, each MTE shows different inclination. Thus, each MTE is separated big
particularly in summer and winter range of the surface temperature.
Table 5-1. Summary of details of the mean temperature equations
Models a b RS Sites Periods
Bevis 0.72 70.2 U.S. 1989 – 1991
Mendes 0.789 50.4 Global 1992
Wu 0.968 1.056 South Korea 1998 – 2004
Ha 0.884 23.4 South Korea 1998 – 2005
Song I 1.01 (summer) -12.35 (summer) South Korea 2003 – 2005
Song II 0.97 (winter) 8.67 (winter) South Korea 2003 – 2005
33Korean National Report to the International Association for Geodesy, 2019
Figure 5-4. Comparisons between the MTEs with respect to surface temperature and histogram of
surface temperature in summer and winter.
Figure 5-5. GNSS PWVs applied different mean temperature models were compared to RS particularly in
summer and winter for Sokcho site from 2009 to 2014.
34Korean National Report to the International Association for Geodesy, 2019
To check the effects of the MTE biases in summer and winter, GNSS PWV estimated from
each model were compared to Radiosonde (RS) measurements during the period from 2009
to 2014 over the Sokcho (Park et al., 2016). The comparison results are shown in Figure 5-5.
Although the local seasonal models, which are Song I and Song II, are best fitted to
Radiosonde PWV, local annual model Wu was selected as an optimal model because
boundaries of the seasons are not clear. In addition, the annual model is proper to maintain
consistency of near real-time GNSS PWV.
Figure 5-6. GNSS PWV for Heavy rainfall in Aug. 25, 2014.
Figure 5-7. Precipitation contour map of the heavy rainfall events (left), weather forecast at that time with
no the optimal GNSS PWV data assimilation (middle), and WRF prediction with 3D-Var assimilation of
the optimal GNSS PWV (right).
35Korean National Report to the International Association for Geodesy, 2019
To check the applicability of the GNSS PWV to weather forecast, a heavy rainfall event in
August, 2014 was chosen. The GNSS PWV estimates based on VMF1 and Wu MTE were
applied to WRF 3D-Var assimilation (KASI, 2016). Figure 5-6 shows optimal estimation of
the GNSS PWV over South Korea for the event period. While weather forecast at that time
failed to heavy rainfall in southwest part (dashed circles), WRF prediction including the
GNSS PWV information was improved particularly in the area of dashed circles in Figure 5-7.
Ionosphere
Ionospheric Storms in Korea
The two radio frequencies (L1=1.57542 GHz and L2=1.22760 GHz) transmitted the Global
Positioning System (GPS) satellites at the altitude of 20,200 km can be abnormally refracted
or degraded by suddenly temporal and spatial variations of electron densities when its radio
signals pass through the Earth’s ionosphere. The unusually enhanced electron densities in the
ionosphere make the unexpected GPS time delay errors and its irregularities can fluctuate the
amplitudes and phases of GPS L1 and L2 signals called by ionospheric scintillation. These
abnormal ionospheric variations finally result in the low accuracy in GPS position (Ledvina
et al., 2002; Xu et al. 2007). Thus, understanding of abnormal ionospheric variations can
practically help to the GPS error estimation. Here we will firstly present the results of the
statistical analysis of ionospheric storms over Korea using GPS TEC measurements from the
ground-based JEJU GNSS site which has been operated by KASI since 2002. This work
presents statistics of positive and negative ionospheric storms using GPS TEC data observed
at the KASI JEJU GNSS site between 2002 and 2014. The number of positive ionospheric
storms was 170, which is more than five times the number of negative ionospheric storms of
33. The trends of both positive and negative ionospheric storms seem to follow the solar
activity during solar cycle 23, but only positive ionospheric storms show the solar activity
variation during solar cycle 24. The number of positive and negative storms during solar
cycles 23 and 24 were 134 and 69, respectively. This result indicates that the ionosphere was
actively perturbed in solar cycle 23, whereas it was relatively quiet in solar cycle 24 in Korea.
Ionospheric storms frequently occurred during May to July. The occurrence of the negative
36Korean National Report to the International Association for Geodesy, 2019
ionospheric storms shows the seasonal trend of the maximum in summer. The positive
ionospheric storms show larger occurrence during solstices than equinoxes.
Figure 5-8. Yearly trend of ionospheric storm between 2002 and 2014 on Jeju in Korea.
Figure 5-9. Monthly trend of ionospheric storm between 2002 and 2014 on Jeju in Korea.
37Korean National Report to the International Association for Geodesy, 2019
GPS TEC variation in the equatorial region
The equatorial region of the Earth’s ionosphere generally exhibits the largest spatial and
temporal gradients in electron density (Ne) due to the well-known Equatorial Ionization
Anomaly (EIA), with a trough at the geomagnetic equator and two crests at ~15° north and
south geomagnetic latitudes. Ionospheric measurements using GPS TEC are very sparse in
the East Asia Pacific region because a significant portion of the EIA is over the ocean, where
ground-based receivers cannot be deployed. KASI has been operating a permanent geodetic
GNSS station in the Korea South Pacific Ocean Research Center of the Korea Institute of
Ocean Science and Technology (KIOST). The station is located at Chuuk (Geographic: 7.5°
N, 151.9° E; Geomagnetic: 0.4° N, site marker name: CHUK) in the Federated States of
Micronesia. It is the ideal location to study the ionospheric characteristics of the EIA trough
that have not been thus far observed.
Daily mean TEC values exhibited the variation corresponding to the 27-day period of the
solar rotation; this trend showed a clear contrast in summer. The seasonal variation of daily
mean TEC exhibits the combined features together with the semi-annual anomaly, the
equinoctial asymmetry, and the annual anomaly. The semi-annual anomaly had the
amplitudes of 12.4 TECU (33%) on March 19 and 8.8 TECU (23%) on October 25, with a
yearly average value of 38.0 TECU. An equinox asymmetry was also observed where the
March equinox has higher amplitude than the October equinox, as shown by the daily mean
TEC variation. The last anomaly feature reflected the annual anomaly where the daily mean
TEC values were higher in December than in June.
The annual/semi-annual anomaly and equinoctial asymmetry may be explained by the
significant effects of the solar flux variation between 08:00 and 18:00 LT. During daytime,
the first and second peaks of the semi-annual anomaly occurred in March and October,
respectively. It disappeared after midnight and began to gradually develop after 06:00 LT. The
nighttime GPS TEC enhancements between 20:00 LT and 24:00 LT similarly exhibited the
semi-annual variation during daytime. Considerable peaks appeared around 22:00-23:00 LT
in the spring equinox, whereas the GPS TEC values continuously decreased during daytime
in the autumn equinox. The nighttime TEC enhancement between 22:00- 23:00 LT in the
spring equinox could be attributed to the mixed effect of the slow Ne loss time and other Ne
production mechanisms such as the Pre-Reversal Enhancement during the spring equinox.
The ionospheric anomaly originally indicates any departure from the solar-controlled
38You can also read