SWAT Watershed Model Calibration using Deep Learning
←
→
Page content transcription
If your browser does not render page correctly, please read the page content below
SWAT Watershed Model Calibration using Deep Learning
                                                                            M. K. Mudunuru∗ , K. Son, P. Jiang, X. Chen
                                                  Watershed & Ecosystem Science, Pacific Northwest National Laboratory, Richland, WA 99352, USA
arXiv:2110.03097v1 [cs.LG] 6 Oct 2021

                                                                                             ABSTRACT
                                        Watershed models such as the Soil and Water Assessment Tool (SWAT) consist of high-dimensional physical and
                                    empirical parameters. These parameters need to be accurately calibrated for models to produce reliable predictions
                                    for streamflow, evapotranspiration, snow water equivalent, and nutrient loading. Existing parameter estimation
                                    methods are time-consuming, inefficient, and computationally intensive, with reduced accuracy when estimating
                                    high-dimensional parameters. In this paper, we present a fast, accurate, and reliable methodology to calibrate
                                    the SWAT model (i.e., 21 parameters) using deep learning (DL). We develop DL-enabled inverse models based on
                                    convolutional neural networks to ingest streamflow data and estimate the SWAT model parameters. Hyperparameter
                                    tuning is performed to identify the optimal neural network architecture and the nine next best candidates. We use
                                    ensemble SWAT simulations to train, validate, and test the above DL models. We estimated the actual parameters
                                    of the SWAT model using observational data. We test and validate the proposed DL methodology on the Ameri-
                                    can River Watershed, located in the Pacific Northwest-based Yakima River basin. Our results show that the DL
                                    models-based calibration is better than traditional parameter estimation methods, such as generalized likelihood
                                    uncertainty estimation (GLUE). The behavioral parameter sets estimated by DL have narrower ranges than GLUE
                                    and produce values within the sampling range even under high relative observational errors. This narrow range of
                                    parameters shows the reliability of the proposed workflow to estimate sensitive parameters accurately even under
                                    noise. The best DL-based calibrated set has R2 , Nash-Sutcliffe efficiency, logarithmic Nash-Sutcliffe efficiency, and
                                    Kling-Gupta efficiency scores of 0.53, 0.67, 0.78, and 0.74, respectively. The best GLUE-based calibrated set has
                                    0.48, 0.6, 0.7, and 0.68, respectively. The above scores show that the DL calibration provides more accurate low
                                    and high streamflow predictions than GLUE. Due to its fast and reasonably accurate estimations of process param-
                                    eters, the proposed DL workflow is attractive for calibrating integrated hydrologic models for large spatial-scale
                                    applications.

                                    KEYWORDS: SWAT, calibration, watershed modeling, parameter estimation, inverse problems, convolutional
                                    neural networks.

                                                                                HIGHLIGHTS AND NOVELTY
                                              • We developed a deep learning (DL) methodology to estimate the parameters of the SWAT model.
                                              • DL-enabled SWAT model calibration shows higher streamflow prediction accuracy than traditional param-
                                                eter estimation methods such as Generalized Likelihood Uncertainty Estimation (GLUE).
                                              • Estimated SWAT model parameters from observational discharge are within the sampling range of ensemble
                                                simulations and are well clustered even under noise.
                                              • An added benefit is that DL-enabled parameter estimation after training is at least O(103 ) times faster
                                                than GLUE-based methods, which may require 100-1000s of forward model runs.

                                        ∗
                                            Corresponding author’s email address: maruti@pnnl.gov.
                                                                                                     1
2 M. K. MUDUNURU ET.AL.,
1. INTRODUCTION
Watershed models are frequently used to estimate streamflow and water exchanges among different compo-
nents of the terrestrial water cycle. These components are affected by a wide range of anthropogenic activities
(e.g., agricultural intensification) and climate perturbations (e.g., wildfire, rain-on-snow, rising temperatures and
precipitation, earlier snowmelt in mountainous regions). [1–3]. Watershed models can also assess the sustainability
of the water supply for effective water resource management. Some popular and open-source watershed modeling
software that can accurately simulate various components of water cycling in intensively managed watersheds in-
clude the Soil and Water Assessment Tool SWAT and its variants (e.g., SWAT-MRMT-R) [4–6], the Advanced Terrestrial
Simulator (ATS) [7], the Precipitation Runoff Modeling System (PRMS) [8,9], the Weather Research and Forecasting
Model Hydrological modeling system (WRF-Hydro) [10,11], RHESSys [12], VIC [13], MIKE-SHE [14], DHSVM [15], and
HSPF [16].
The software mentioned above has process models that simulate the watersheds’ different hydrological compo-
nents (e.g., infiltration, groundwater flow, streamflow). Watershed hydrologic models feature two types of param-
eters [17, 18]. The first type includes parameters with physical significance (e.g., permeability, porosity) [19] that
can be determined from observational data. The second type of parameters is conceptual or empirical, which are
currently impossible or difficult to measure directly. Most of the watershed simulators mentioned above (e.g., SWAT,
PRMS) consist of parameters that fall in the second category [1]. As a result, observational data, such as stream-
flow collected at the watershed outlet, are used to estimate the conceptual parameters through model calibration.
Many watershed models, including the SWAT and PRMS models, can only achieve adequately accurate predictions
after calibrating their parameters to available observations, making them less ideal for ungauged watersheds. On
the other hand, advanced mechanistic process-based watershed models (e.g., ATS) can predict watershed responses
with reasonable accuracy without undergoing intensive model calibration [20]. The parameters in these mechanistic
models are measurable and physically significant.
Various techniques and software for calibrating watershed models exist in the literature [21]. Popular methods
include generalized likelihood uncertainty estimation (GLUE) [22, 23], maximum likelihood estimation [24], the
shuffled complex evolution method developed at the university of Arizona (SCE-UA) [25], Bayesian parameter
estimation methods [26–28], ensemble-based data assimilation methods (e.g., ensemble Kalman filter, ensemble
smoother) [29–34], and adjoint-based methods [35, 36]. These techniques underpin popular software packages
such as PEST [37], DAKOTA [38], SWAT-CUP [39], MATK [40], MADS [41], and DART [42], which are developed to
perform model calibration. These existing calibration methods and tools are time-consuming (e.g., can have slow
convergence), require good initial guesses, and can be computationally intensive (e.g., may require a lot of forward
model runs or running on high-performance computing clusters) [43–45]. Moreover, calibration using such tools
can potentially result in reduced accuracy when estimating high-dimensional parameters (> 10) due to the difficulty
in solving a multi-objective optimization problem [21, 46]. Many of the methods mentioned above have challenges
(see supplementary text S1) estimating the strong nonlinear relationships between parameters and observational
data [47]. Recent advances in deep learning (e.g., deep neural networks, convolutional neural networks) show
promise for developing reliable model calibration workflows that overcome the above-mentioned challenges [20,48].
In this paper, we present a deep learning (DL) methodology for estimating high-dimensional SWAT model parameters
from observational streamflow data efficiently, reliably, and with reasonably good accuracy.
Deep learning (DL) shows promise in aiding conceptual or process-based inverse modeling associated with
highly nonlinear relationships [48–53]. DL utilizes multiple neural layers to extract features that are representa-
tive of inputs. DL-enabled inverse models for parameter estimation are known to be robust with observational
errors or noise [54–57]. In hydrology, neural networks (e.g., deep, convolutional, recurrent) have been used to
model and predict rainfall-runoff, streamflow, water quality, and precipitation [58–60] based on synthetic data.
Here synthetic data refers to data generated through watershed model simulations conditioned on site-specific pa-
rameters. Recently, deep neural networks guided by physics and domain knowledge have been used to predict lake
temperatures, streamflows, and estimate biophysical parameters [61–65]. This study uses convolutional neural
networks (CNNs), which are popular in hydrological applications [66–68].
CNNs offer many advantages over dense neural networks (DNNs). A significant advantage of CNNs is that
they learn local representations (or patterns) in time-series data while the DNNs can only understand globalDEEP LEARNING FOR WATERSHED MODELING 3
features. CNNs generally have lower data requirements than DNNs to obtain similar performance levels due
to fewer trainable weights. This superior performance of CNNs can be attributed to the multiple convolutional
layers learning hierarchical patterns from the inputs. The resulting broader set of abstract patterns are used
to develop nonlinear mappings between streamflow and SWAT model parameters. Another benefit of DL-enabled
inverse models is their low inference time for parameter estimation compared to traditional methods. However, the
data requirements and associated training time needed to develop such inverse models can be substantial. Once
the DL-enabled inverse model is trained on synthetic data, it can allow for seamless assimilation of observational
data, thereby significantly reducing the time required to estimate parameters in high-dimensional space [20].
1.1. Main contributions. The main contribution of this study is developing a fast and accurate parameter
estimation methodology using deep learning that calibrates watershed models better than traditional methods.
The DL-enabled inverse models are built on synthetic data generated using the SWAT model and guided by sensi-
tivity analysis. Hyperparameter tuning is performed to identify the top ten architectures based on validation mean
squared error. In many scenarios, observational data is most likely corrupted by noise. We analyze the influence of
noise on parameter estimation in both testing and observation data. A significant advantage of the proposed DL
workflow is that it accurately estimates sensitive parameters even at high noise levels (e.g., 25% relative observa-
tional errors). Moreover, these estimated parameters are well clustered and within the prior sampling range, showing
the proposed methodology’s robustness to observational errors. Compared to the GLUE method, the parameters
estimated by the DL-enabled inverse models provide more accurate streamflow predictions within and beyond the
calibration period. The GLUE method identified a set of behavioral parameters within the ensemble parameter
combinations. By ‘behavioral’ parameters, we mean to signify parameter sets whose SWAT model simulations are
deemed to be ‘acceptable’ upon satisfying certain user-defined performance metrics (e.g., Kling-Gupta efficiency
greater than 0.5) on observational data [22]. Based on a cutoff threshold that utilizes metrics such as Kling-Gupta
efficiency, the entire set of simulations is then split into behavioral and non-behavioral parameter combinations.
The behavioral parameter set provides better accurate predictions than the non-behavioral set. Our analysis also
showed that the DL estimated set clusters better than the GLUE-based behavioral set. Another advantage of the
proposed DL-based inverse models is that it is at least O(103 ) times faster than the GLUE-based method. From
a computational cost perspective, traditional parameter estimation (e.g., using PEST, DAKOTA) requires multiple
forward model runs. As a result, inversion modeling requires high-performance computational resources that can
be prohibitively expensive. The savings in computational cost enables our DL-enabled parameter estimation to be
inclusive (i.e., easy to adapt using transfer learning [69]) and ideal for calibrating multi-fidelity models (e.g., ATS,
PFLOTRAN, WRF-Hydro, PRMS) at spatial scales of watersheds and basins.
1.2. Outline of the paper. The paper is organized as follows: Sec. 1 discusses state-of-the-art methods for
parameter estimation and their limitations. We also demonstrate the need for developing DL workflows to better
calibrate hydrological models, such as the SWAT. Section 2 describes the study site and SWAT model developed using
a National Hydrography Dataset PLUS (NHDPLUS v2)-based watershed delineation. We discuss data generation
to develop DL-enabled inverse models and provide the top seven parameters that are sensitive to discharge. We
also compare observation data with the SWAT model ensemble simulations. Section 3 introduces the proposed DL
methodology for estimating SWAT parameters. We developed three different types of DL-enabled inverse models
using sensitivity analysis as a guide. We performed hyperparameter tuning to identify the optimal deep learning
model architectures and described the associated computational costs for training the DL models and generating
inferences (e.g., on test and observational data). Sec. 4 presents the training, validation, and testing results of the
DL models. We compare the performance of DL estimated parameters with that of the GLUE method. Performance
of calibration model within and beyond calibration period is provided. Finally, Sec. 5 presents our conclusions.
2. STUDY SITE and DATA GENERATION
This section first describes the study site, the American River Watershed (ARW) in the Yakima River Basin
(YRB), before discussing the SWAT model, its parameters, and specifics on the ensemble runs needed to develop
DL-enabled inverse models. We also compare the observational streamflow/discharge used to calibrate the SWAT
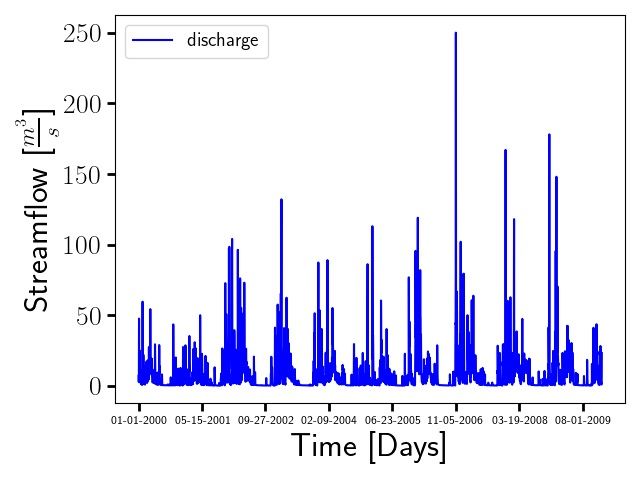
model with the ensemble runs within the calibration period (i.e., from 10/01/1999 to 30/09/2009).4 M. K. MUDUNURU ET.AL.,
2.1. Study site. The Yakima River Basin (YRB), situated in Eastern Washington, has a drainage area of
about 16,057 km2 [70]. The YRB produces an average annual runoff of approximately 90 m3 s−1 . A major
tributary of the Yakima River is the American River near Nile in Washington, a third-order order stream, with a
watershed of about 205 km2 . Within the ARW, the mean annual precipitation and temperature range from 978
to 2164 mm and 2.8 to 4.9o C, respectively. This range is estimated according to the 30 years normalized PRISM
data [71–73]. ARW’s climate has a strong seasonality, including cold, wet winters and hot, dry summers. About
60% of precipitation occurs in the winter as snow, with snowmelt occurring from April to June the following year.
Peak snow accumulation and flow occur in April and May, respectively. This prior site-specific knowledge shows
that the snow process parameters in the SWAT model are essential. Guided by the information mentioned above and
sensitivity analysis, our results demonstrate that we can better estimate such important process model parameters
using DL than GLUE.
The ARW has a steep slope that varies from 0o to 83o , with a mean slope of 23o . The major surface geology
types are andesitev (72%), granodiorite(20%), and alluvium (8%). The primary soil texture is gravelly loamy sand
with a maximum soil depth of 1524 mm based on USDA State Soil Geographic Data (STATSGO) [74]. This soil is
classified as hydrologic group B with moderate runoff potential and infiltration rates. Evergreen trees (83%) and
shrub (11%) dominate land cover and use, with other types of land cover, including urban, grass, and wetlands.
The ARW has a USGS gauging station (USGS 12488500) located in the watershed outlet, recording the daily
observed streamflow from 07/16/1988 to the present. A snow telemetry (SNOTEL) station (site name: Morse
lake) is located northwest of the watershed. This SNOTEL station has measured the snow water equivalent, daily
precipitation, and air maximum/mean/minimum temperatures from 10/1/1979 to the present.
2.2. Brief description of the SWAT model. SWAT is a semi-distributed ecohydrological model. It can
simulate land surface hydrology, soil or plant biogeochemistry, and instream processes [75]. The SWAT model requires
spatial Geographic Information System (GIS) data to simulate various quantities of interest (e.g., streamflow).
ARW’s watershed properties such as topography, land cover, and soil are parameterized using this GIS data. USGS’s
10m digital elevation model (DEM) is used to compute the topographic parameters (e.g., drainage area, slope, slope
length) with the ARW’s basin and sub-basin boundary and stream networks defined by the National Hydrography
Dataset Plus (NHDPus) catchment/streams. Previous studies [76, 77] have demonstrated that NHDPlus-based
catchment/streams outperformed the modeled streamflows that did not account for such delineation.
Figure 1 shows the NHDPlus-based SWAT model used to simulate streamflow at the ARW study site. This
model is composed of 87 sub-basins with five slope classes (percent rise of the slope): (1) 0-26, (2) 26-51, (3)
51-80, (4) 80-129, and (5) 129-999. USGS National Landcover Database (NLCD) 2016 (30m resolution) and USDA
STATSGO database are used to estimate the land cover/use and soil parameters, respectively. Hydrologic response
unit (HRU) maps are developed by combining the slope class, land cover/use, and soil type, resulting in a total of
2421 HRUs for the study site (see Fig. 1). The supplementary material text S2 provides additional details on SWAT
model development for our study site.
Daily precipitation, maximum air temperature, and minimum air temperature from a daily Daymet [78] with
1 km spatial resolution are used to prepare the climate input data for the SWAT model simulations. Other climate
variables (e.g., radiation, relative humidity, wind speed) are generated using weather generators in the SWAT. Five
elevation bands (at 100m intervals) per sub-basin are created to better represent the spatial variation of the
precipitation and temperature within the region. The spatially varied lapse rate of precipitation and temperature
based on the 1 km Daymet data is then applied to each of the ARW’s sub-basins. Basin averaged lapse rates are
used if the Daymet is less than five data points per sub-basin. Note that we also verified the Daymet products
using SNOTEL’s precipitation and temperature data.
2.3. Data for the SWAT model calibration and sensitivity analysis. Table 1 summarizes the 21 pa-
rameters and their associated sample ranges (e.g., minimum and maximum values) we calibrated in the SWAT model
to generate simulation data. The table clearly shows six groups/types of SWAT model parameters: (1) landscape,
(2) soil, (3) groundwater, (4) channel, (5) snow, and (6) plant. Each parameter in a specified group is calibrated at
different spatial scales. For example, snow group parameters such as SFTMP and SMTMP represent basin-scaleDEEP LEARNING FOR WATERSHED MODELING 5
Figure 1. NHDPlus-basedSWAT model for ARW: This figure shows the watershed delineation and data products used
to develop the SWAT model for our study site. The top left figures show the delineation of the YRB into different watersheds,
including our ARW study site. It also shows the DEM used for modeling the ARW and the associated stream gauge at the
watershed outlet. The top right figures show the spatially varying slope and soil data within the study site. The bottom left
figure shows the delineation of third-order streams in the ARW. The bottom right figures show the spatially varying land cover
(primarily evergreen) and the number of HRU employed in the SWAT model.
snow processes. Channel group parameters are at the sub-basin level, and soil/groundwater/plant group param-
eters represent HRU level spatial variation. Even though some parameters (e.g., CANMX) are calibrated at the
HRU level, their associated values represent basin-scale average as the initial value of that specified parameter is
the same for all HRUs.
We randomly generated 1000 sets of these 21 parameters using uniform distribution to develop DL-enabled
inverse models. The daily streamflow/discharge data simulated using the SWAT model for these 1000 realizations
are shown in Fig. 2. The simulated time for the SWAT model calibration is between 10/01/1999 to 30/09/2009,
referred to as the calibration period. The validation period is beyond 30/09/2009, stretching from 10/01/2009 to
30/09/2016. The calibrated SWAT model is run during the validation period, and its performance is then compared
with the observational data. Figure 2 compares the mean ensemble of simulated discharge (i.e., 1000 realizations)
with the observational data. The light orange color represents the standard deviation of the 1000 simulated
discharge realizations. This figure qualitatively shows the similarities of the trends in the simulated discharge and
observed data. Process model assumptions in the SWAT modules contribute to clear structural deficiencies in the
predicted streamflow (e.g., over/under predictions of peak/low flows). Thus, SWAT model fidelity needs enhancement
to overcome these structural deficiencies. The generated data is used to estimate SWAT parameters by both the
DL-based calibration and the GLUE method. The GLUE-based SWAT model calibration is also compared with the
observational data for both periods. The behavioral model parameter sets (i.e., from GLUE) are selected based
on KGE metrics. One can also use the other accuracy measures (e.g., NSE, logNSE, R2 -score) to evaluate the
calibrated SWAT model performance. We note that each of the accuracy metrics reflects a different aspect of the
calibration performance. As a result, including multiple accuracy metrics for evaluating a calibrated model has
obvious advantages.6 M. K. MUDUNURU ET.AL.,
80
Observed
Mean ensemble
60
Streamflow [ ms ]
3
40
20
0
10/01/99 02/12/01 06/27/02 11/09/03 03/23/05 08/05/06 12/18/07 05/01/09
Time [Days]
Figure 2. SWAT model simulations vs. observational data within calibration period: This figure compares the
synthetic data generated based on NHDPlus-based SWAT model with observational data for the ARW study site. The dark
brown color dashed line represents the ensemble mean of 1000 SWAT model simulations. The light orange color region represents
the standard deviation of ensembles. The black-colored line corresponds to the observed streamflow data.
Table 1 also provides the sensitive parameters that influence simulated discharge at the ARW study site.
Simulated discharge is sensitive to seven of the 21 parameters – SFTMP, SMTMP, SMFMX, CH_K2, CH_N2,
ALPHA_BF, and RCHRG_DP. The important parameters mentioned above are identified using mutual informa-
tion (MI) methods [79]. Figure S1 in the supplementary material provides the MI-based parameter ranking [80,81].
We note that discharge is primarily influenced by the SFTMP parameter (i.e., the most sensitive). This inference
from MI is per the seasonality of the study site mentioned in Subsec. 2.1. As ARW is snow-dominated, sensitivity
analysis identified that snow processes influence peak flow behavior.
3. DEEP LEARNING METHODOLOGY
This section presents the overall methodology consisting of data pre-processing, hyperparameter tuning, and
the computational cost of constructing the DL-enabled inverse models. Figure 3 shows the DL workflow for training
the inverse model and then inferring the SWAT parameters. The DL workflow can be divided into two main steps.
In the first step, we train, validate, and test DL-enabled inverse models based on convolutional neural networks
(CNNs) [82–84] using SWAT model ensemble runs. The synthetic streamflow and parameter sets are assembled into
a data matrix and then partitioned into training (80%), validation (10%), and testing (10%) sets. Each SWAT run
contains 3654 daily measurements, which are normalized by removing the mean and scaling the training dataset to
unit variance. This standardizes the raw datasets into a representation suitable for training CNNs. The resulting
pre-processing estimator is then used to transform the validation and testing sets. Pre-processing is necessary
for DL model development, as CNNs are filter/kernel-based methods that benefit from the normalization of their
inputs to make accurate predictions [85, 86]. Hyperparameter tuning is performed to identify the optimal CNN
architectures. In the second DL workflow step, the observational data is standardized using the pre-processing
estimator. This normalized data is input to the tuned DL-enabled inverse models to estimate the study site
parameters. These calibrated parameter sets are given to the SWAT model to obtain daily streamflow values in the
calibration and validation periods. The predicted discharge is then compared with the raw observational data to
measure the performance of the DL-enabled calibrated SWAT model.
3.1. CNN architectures based on hyperparameter tuning. Three different types of DL-enabled inverse
models are developed based on CNNs. First, a CNN architecture is used as multi-task learning (MTL) model,
which estimates all the 21 parameters. Correlations between the SWAT parameters are accounted for in this 21-
parameter model. The second architecture is also an MTL model but focused on estimating the top seven sensitive
parameters. This 7-parameter model estimates the boldfaced parameters listed in Table 1. The third architecture
1
Table-1: Note that the sensitive parameters are identified using the MI method. The top seven sensitive parameters are boldfaced
in this parameter column.
2
In Table-1, the parameter modification column indicates how SWAT model parameters are modified during calibration and the
training data generation for DL-enabled inverse modeling. ‘Replace’ indicates that the existing values are replaced with values in the
provided range. ‘Relative’ means relative changes in SWAT model parameters by multiplying existing values.DEEP LEARNING FOR WATERSHED MODELING 7
Table 1. This table provides a list of SWAT model parameters that are calibrated using the proposed DL methodology. The
associated lower and upper limits of parameter values are also specified.
Parameter Parameter1 Lower Upper Brief description (units) Parameter Spatial
group/type limit limit modification2 scale
Landscape SURLAG 1 12 Surface runoff lag coefficient Replace HRU
Landscape CN 40 95 SCS runoff curve number Relative HRU
Groundwater RCHRG_DP 0 1 Deep aquifer percolation fraction Replace HRU
Threshold depth of water
Groundwater GWQMN 0 5000 in the shallow aquifer required Replace HRU
for return flow to occur (mm)
Groundwater GW_REVAP 0 0.2 Groundwater ‘revap’ coefficient Replace HRU
Threshold depth of water
Groundwater REVAPMN 1 500 in the shallow aquifer Replace HRU
for ‘revap’ to occur (mm)
Groundwater GW_DELAY 1 100 Groundwater delay (days) Replace HRU
Groundwater ALPHA_BF 0.01 0.99 Baseflow alpha factor Replace HRU
Soil SOL_K 0.001 1000 Saturated hydraulic conductivity Relative HRU
(mm h−1 )
Available water
Soil SOL_AWC 0.01 0.35 capacity of the soil layer Relative HRU
(mm H2 O mm soil−1 )
Soil ESCO 0.01 1 Soil evaporation compensation factor Replace HRU
Soil OV_N 0.008 0.6 Manning’s ‘n’ value for overland flow Replace HRU
Effective hydraulic
Channel CH_K2 0 200 conductivity in main Replace Sub-basin
channel alluvium (mm h−1 )
Channel CH_N2 0.016 0.15 Manning’s ‘n’ value for the main channel Replace Sub-basin
Snow SFTMP -5 5 Snowfall temperature (o C) Replace Basin
Snow SMTMP -5 5 Snow melt base temperature (o C) Replace Basin
Maximum melt rate
Snow SMFMX 1.4 6.9 for snow during the year Replace Basin
(mm H2 O o C day−1 )
Minimum melt rate
Snow SMFMN 1.4 6.9 for snow during the year Replace Basin
(mm H2 O o C day−1 )
Snow TIMP 0.01 1 Snowpack temperature lag factor Replace Basin
Plant EPCO 0.01 1 Plant uptake compensation factor Replace Basin
Plant CANMX 0 10 Maximum canopy storage (mm H2 O) Replace HRU
is based on a single-task learning (STL) model, which estimates one sensitive SWAT parameter. We, therefore,
trained seven different 1-parameter models to estimate all the sensitive parameters.
Hyperparameter tuning is performed to identify the optimal CNN architecture of the 21-, 7-, and 1-parameter
models. This tuning is necessary as the training process, and predictions of the DL-enabled inverse model are
controlled by the CNN architecture’s parameters and topology. We tested two types of hyperparameters: (1) model
hyperparameters and (2) algorithm hyperparameters. Model hyperparameters define the neural network architec-
ture. For instance, the selection of CNN topology is influenced by model hyperparameters such as the number and
width of hidden layers. Algorithm hyperparameters influence the training process after the architecture is estab-
lished. The values of the trainable weights of a CNN architecture are controlled by algorithm hyperparameters
such as learning rate and the number of epochs. Table 2 shows the search space and best set of both model and
algorithm hyperparameters. During the tuning process, the batch size is kept constant (equal to 10) and ReLU
is the activation function. The optimal hyperparameter set is chosen based on the validation mean squared error
using the grid search tuning method. In addition to identifying the optimal hyperparameter set, we also identified
the next best candidates using validation mean squared error. Table S1 in the supplementary material shows the
hyperparameters of the remaining nine best DL-enabled inverse models. Note that we obtained a total of ten best
hyperparameter sets for each of the 21-, 7-, and 1-parameter model scenarios. In Sec. 4, we show the predictions
of these ten best models and the associated uncertainty in their streamflow predictions.
We used the Keras API in Tensorflow package [87] to build our DL-enabled inverse models. Figure 4 shows a
pictorial description of the tuned architecture of the 21-parameter model. Figures S2 and S3 in the supplementary8 M. K. MUDUNURU ET.AL.,
DL-model
qSWAT qSWAT-sd fSP
based on
…
CNN
…
…
SWAT discharge Standardize
…
fSP = Full SWAT
(ensemble runs)
Parameters
(True vs. DL
Train, validate, and test DL-enabled inverse models predictions)
+
Hyperparameter tuning
Scale back
fSPest Run
qobs qobs vs. qSWAT-est
SWAT
…
…
…
Observational fSPest = Estimated Full Compare SWAT
discharge data SWAT parameters discharge with
(standardized) (standardized) observational data
Figure 3. Proposed deep learning workflow for the SWAT model calibration: A pictorial description of the proposed DL
workflow to estimate parameters and calibrate the SWAT model using observational discharge. Ensemble simulations generated
by the SWAT model are used to train, validate, and test the DL-enabled inverse models. The observational data is then provided
as an input to the developed DL models to estimate site-specific parameters. These parameters are then used by the SWAT model
to simulate discharge for comparison with observational data.
Inputs Feature Maps Feature Maps Feature Maps All 21 SWAT parameters
1 @ 3653 x 1 128 @ 3638 x 1 64 @ 1812 x 1 32 @ 903 x 1
… … …
CN2
Normalize Discharge
ESCO
Time-Series
SURLAG
…
Convolution
…
Convolution 4 x 1 kernel
16 x 1 kernel
Convolution Max-pooling
8 x 1 kernel 2 x 1 kernel EPCO
Max-pooling Pool-stride = 2
Flatten = 14432
2 x 1 kernel CANMAX
Max-pooling Dropout = 0.2
Pool-stride = 2
2 x 1 kernel, Pool-stride = 2
Figure 4. A tuned DL-enabled inverse model architecture: This figure shows a pictorial description of a deep convolu-
tional neural network for estimating SWAT model parameters. This DL model inversely maps simulated discharge to 21 different
conceptual parameters. Hyperparameter tuning is then performed to arrive at the CNN architecture. This DL-enabled inverse
model is a multi-task learning model, which accounts for the correlation between different SWAT parameters during training.DEEP LEARNING FOR WATERSHED MODELING 9
material show pictorial descriptions of the tuned architectures for the 7- and 1-parameter models, respectively. The
CNN filters are initialized with the Glorot uniform initializer. After each convolution, a max-pooling operation
is applied and the final convolutional layer is then flattened. After the dropout layer, the remaining features are
mapped to the SWAT parameters. The entire CNN is compiled using an Adam optimizer, with the loss being the
mean squared error. The resulting tuned 21-, 7-, and 1-parameter models have a total of 379,093; 177,031; 90,433
trainable weights, respectively.
Table 2. This table provides the hyperparameter space to develop and tune 21-, 7- and 1-parameter models. The optimal set
identified is boldfaced in the ‘Explored options’ column. The tuned CNN architecture of the 21-parameter model is shown in
Fig. 4.
Hyperparameter type Description Explored options
Layers Number of 1D convolutional layers [1, 2, 3, 4, 5]
Filters The number of output filters in the 1D convolution [16, 32, 64, 128, 256]
Kernel size An integer to specify the length of the 1D convolution window [2, 4, 8, 16, 32]
Dropout rate Applies dropout to the input3 [0.0, 0.1, 0.2, 0.3, 0.4]
Learning rate The value of the optimizer in the Adam algorithm [10−6 , 10−5 , 10−4 ]
Epochs The number of times the algorithm sees the training data [100, 200, 300, 400, 500, 1000]
3.2. Computational cost. The wall clock time to run a single ten-year SWAT model simulation is approxi-
mately 240 seconds on a four-core processor (Intel(R) i7-8650U CPU @ 1.90GHz), a standard desktop machine.
The ensemble run simulations for training the DL-enabled inverse models were developed using a cluster of 56 cores
(Intel(R) Xeon(R) Gold 5120 CPU @ 2.20GHz) and 256 GB DDR4 RAM. We trained the proposed models on a
MacBook Pro Laptop (2.3GHz 8-Core Intel i9 CPU, 64GB DDR4 RAM) with an associated computational cost of
5 seconds per epoch per model. The wall clock time needed to generate a best tuned DL-enabled inverse model
is approximately 2500 seconds, which can be accelerated using GPUs. After the DL model is trained, the com-
putational inference cost to estimate the SWAT model parameters is 0.16 seconds. The wall clock time for making
a prediction/inference shows that our DL-enabled parameter estimation is at least O(103 ) times faster than the
GLUE-based method (e.g., may require 100-1000s of forward model runs), in addition to its predictive capability.
Our future work involves accelerating the training process using GPUs available at leadership class supercomputing
resources (e.g., NERSC, OLCF, and ALCF user facilities) [88–90].
4. RESULTS AND DISCUSSION
This section presents results on the overall accuracy and efficiency of the proposed DL methodology. First,
we describe the DL-enabled inverse modeling results from the ensemble runs. Second, we show the SWAT model
parameters estimated from observational discharge and compare the performance of DL-enabled parameter esti-
mation and the GLUE method. We then compare the streamflow predictions from the calibrated SWAT model with
the observation discharge for both the calibration and validation periods. Next, we provide the sensitivities of the
estimated SWAT model parameters under a range of relative errors. Finally, we give the performance metrics, and
calibration uncertainties for DL-enabled and GLUE estimated parameters.
4.1. Training, validation, and testing results. Figure 5 shows the training and validation loss of the best
DL-enabled inverse models in estimating the SWAT parameters. The MSE values in Fig. 5(a) show the overall loss for
all 21 SWAT parameters. Based on the tuned 7-parameter model, Fig. 5(b) provides the overall loss of the top seven
sensitive parameters. Figure 5(c) shows the loss in estimating SFTMP based on the 1-parameter model developed
for that most sensitive parameter. The supplementary figure S4 shows the loss for the other six 1-parameter models
that estimate the remaining sensitive parameters. Figure S4(g) also compares the sum of losses of the 1-parameter
models for the top seven sensitive parameters with that of the 7-parameter model. The 7-parameter model’s losses
are lower than the sum of 1-parameter models as the 7-parameter model’s training accounts for the correlation
between sensitive parameters, producing a better MSE value than the sum of 1-parameter models. Furthermore,
these figures show that all the tuned models have converged. The validation loss of the 21-parameter model
3
Table-2: To reduce model overfitting, we randomly set the last convolutional layer units that connect to the output to 0 at each
step during training time. The rate value controls the frequency of dropping the units.10 M. K. MUDUNURU ET.AL.,
(a) 21-parameter model: Loss (b) 7-parameter model: Loss (c) 1-parameter model: Loss (SFTMP)
Figure 5. Loss metrics of best inverse models: This figure shows the overall training and validation loss of three different
DL-enabled inverse models. The overall loss of the 21-parameter model is the sum of the loss of individual SWAT parameters.
Similarly, the overall loss of the 7-parameter model is the sum of the loss of the top seven sensitive SWAT parameters. The loss
of the 1-parameter model corresponds to the SFTMP, which is the top sensitive parameter.
plateaus after 200 epochs, even as the training loss decreases. Over-fitting is due to the lack of valuable information
in the streamflow data to constrain the lesser and insensitive parameters. Over-fitting is less pronounced in the
7-parameter model as the validation loss is much closer to training. The 1-parameter model estimating SFTMP
does not demonstrate this over-fitting problem. Similarly, the 1-parameter models for ALPHA_BF, CH_K2, and
SMTMP sensitive parameters do not show over-fitting problems (see Fig. S4). However, over-fitting occurs for
RCHRG_DP and, to a lesser extent, the CH_N2 and SMFMX parameters as their validation losses closely follow
the training losses. As the sensitivity of the parameters to discharge decreases, over-fitting occurs.
Figure 6 shows the prediction of the tuned DL-enabled inverse models for estimating SFTMP. Supplementary
figures S5-S10 provide the predictions of the best models for the remaining sensitive parameters. All three models
estimate the most sensitive parameters (SFTMP, ALPHA_BF, SMTMP, CH_N2, and CH_K2) well using the
training set. The one-to-one plots between the estimated and true parameters are closely distributed along the
1:1 line. The accuracy of the training predictions is lower for SMFMX and RCHRG_DP. This reduced accuracy
is evident from the more scattered drift away from the one-to-one straight line, seen in Fig. S5 and S10 in the
supplementary material. This indicates that the CNNs could not extract sufficient information from the discharge
time series to estimate these less sensitive parameters.
For the validation and testing sets, the tuned 21-, 7-, and 1-parameter models perform very well for estimating
SFTMP. This is evident from the one-to-one scatter plots shown in Fig. 6. Similar inferences can be drawn for
the parameters ALPHA_BF, CH_N2, and CH_K2, although they have lesser estimation accuracy. Figs. S5, S9,
and S10 demonstrate the disparity in estimation accuracies for RCHRG_DP, SMTMP, and SMFMX, respectively.
This reduced accuracy is comparable to the training results, where we see an increased deviation of the scatters
from the one-to-one straight line. Figure 7 shows the performance of all the three tuned DL-enabled inverse models
on the testing set for SFTMP. The supplementary Figs. S11 to S16 compare the performance of the other six
sensitive parameters. These figures show that all three models provide very similar results in terms of percent
errors. For specific scenarios (e.g., SFTMP), the 1- and 7-parameter models provide slightly better estimates than
the 21-parameter model. This can be attributed to contributions of the less sensitive parameters that potentially
reduce the performance of the 21-parameter model. Figures S29-S35 show the performance of the remaining
nine best DL-enabled inverse models on test datasets. These tuned architectures are identified using validation
mean squared error and produce similar predictions to those of the best DL-enabled inverse model. These other
models can accurately estimate the most sensitive parameter, SFTMP, but have reduced accuracy for less sensitive
parameters.
4.2. Sensitivity of estimated SWAT parameters to observation noise. We selected all test realizations
to evaluate the parameter estimation sensitivity of the DL-enabled inverse models to observational errors. We
added random observation errors to the synthetic observed discharge time series for each test realization. We thenDEEP LEARNING FOR WATERSHED MODELING 11 (a) 21-parameter model: Training (b) 21-parameter model: Validation (c) 21-parameter model: Testing (d) 7-parameter model: Training (e) 7-parameter model: Validation (f) 7-parameter model: Testing (g) 1-parameter model: Training (h) 1-parameter model: Validation (i) 1-parameter model: Testing Figure 6. Predictions of DL-enabled inverse models for the SFTMP: This figure shows one-to-one plots of the best inverse models for the most sensitive parameter, SFTMP (units in o C). It compares the DL estimation with the ground truth for the training, validation, and test datasets. Each blue dot represents a realization from the corresponding train/validation/test set of ensembles. The red line is the one-to-one line. (a) 1- vs. 21-parameter model (b) 7- vs. 21-parameter model (c) 1- vs. 7-parameter model Figure 7. Comparison of the best DL-enabled inverse models in predicting SFTMP on the test dataset: This figure provides a one-to-one plot of percent errors in predicting SFTMP. The DL analysis is shown for the test data, where each data point represents a realization from this set. The red line is the one-to-one line. The DL models (i.e., 1-parameter and 7-parameter models) guided by sensitivity analysis slightly outperform the 21-parameter models. This is because the percent errors of such models are less than those of the 21-parameter model.
12                                                                              M. K. MUDUNURU ET.AL.,

                                          21-parameter model
                                                                                                              2.0
                                                                                                                         21-parameter model
                        3.6               7-parameter model                                                              7-parameter model
                                          1-parameter model                                                   1.8        1-parameter model
                                          Synthetic truth                                                                Mean estimated value
                        3.4
        SFTMP

                                                                                                      SFTMP
                                                                                                              1.6
                        3.2
                                                                                                              1.4
                        3.0
                                                                                                              1.2
                        2.8
                                                                                                              1.0
                                  0%        5%          10%      15%         20%       25%                          0%     5%        10%        15%   20%       25%
                                            Relative observational error                                                  Relative observational error
                        (a) Noise added to a randomly selected test realization                       (b) Noise added to observational discharge (calibration period)

                        5                                                                                                                              21-parameter model
                        4                                                                                                                              7-parameter model
 SFTMP (prior range)

                        3                                                                                                                              1-parameter model
                        2                                                                                                                              Synthetic truth
                        1
                        0
                       −1
                       −2
                       −3
                       −4
                       −5
                            0                      20                   40                       60                       80                    100
                                                                             Test realizations

                                                                          (c) Noise added to all test realizations

                                Figure 8. Sensitivity of DL estimated parameters to noise (SFTMP): This figure shows the sensitivities of the DL-
                                enabled inverse models to different noise levels added to the simulated and observational discharge. The results are based on
                                the best models represented by the colors filling the box plots. The top left figure shows the variation in SFTMP (units in
                                o C) with noise level for a simulated test realization. The markers in the top left figure show the synthetic truth and compare

                                it with predictions under no noise. Similarly, the markers in the top right figure show the mean estimated value from the
                                three best models for real data. The right figure also compares the estimations with different noise values. The maximum
                                possible variation in SFTMP is less than 0.5o C even under 25% relative observational errors. Moreover, the estimations of the
                                most sensitive parameter SFTMP are robust to noise as the predictions are closer to ground truth for all synthetic predictions,
                                shown in the bottom figure. The prediction uncertainty in SFTMP, shown by a black line, is obtained by combining the noisy
                                predictions from 1-, 7-, and 21-parameter models. The red, green, and blue markers represent the mean predictions across 100
                                noisy samples generated for each realization.

generated 100 different observation realizations for parameter estimation, i.e., (qn ), which is given by

                                                                                   qn = q +  × q × r                                                                (4.1)

where  is the standard deviation of the noise, usually taken as 13 of the observation error, and r is a random
vector of the same size as q. The elements of the random vector contain samples drawn from a standard normal
distribution with a mean of 0 and a standard deviation of 1. We tested different levels of observation errors, i.e.,
5%, 10%, 15%, 20%, and 25% relative to the observed values. These noisy discharge data (both synthetic and
observations) are provided as input to the best DL-enabled inverse models to estimate the SWAT model parameters.
    Figure 8 shows the variability in estimated SFTMP from the 21-, 7-, and 1-parameter models as boxplots. It also
shows DL model predictions for all noisy test realizations (see Fig. 8(c)). Figs. S23 to S28 in the supplementary
material provide estimations for the other six sensitive parameters. Note that the parameter estimations are
within the prior sampling range even after adding high relative noise, which instills confidence in the predictive
capabilities of DL models. From Fig. 8, it is evident that all the three DL-enabled inverse models are robust to
DEEP LEARNING FOR WATERSHED MODELING 13
noise in estimating the most sensitive parameter. Variation in SFTMP from the DL models is less than 0.5o C even
under high observational noise (e.g., 25%) for both test and real data. This shows that the SFTMP predictions
are not sensitive to noise, as the CNNs’ performance is stable even after adding noise to data. This predictive
capability under noise also provides the insight that CNNs can effectively learn the underlying representations in
the streamflow data rather than modeling noise. Similar assessments can be made for the ALPHA_BF, CH_N2,
RCHRG_DP, and SMTMP parameters. However, the predictions of the 21- and 7-parameter models for CH_K2
seem to be influenced by noise. The 1-parameter model seems to be more robust to noise for estimating CH_K2 in
this case. The performance of DL estimation for SMFMX, which is the least sensitive parameter, is lower than that
of sensitive parameters such as SFTMP. As discussed in Sec. 4.1 and from MI analysis, it is evident that estimations
are inadequate for this parameter. This reduced performance is because less valuable information is available in
the discharge data to estimate SMFMX robustly, limiting the proposed models to extract useful representation
from input data to calibrate lesser sensitive parameters better, thus reducing the estimation accuracy.
4.3. Calibrated SWAT model based on real observed discharge. The trained DL-enabled inverse models
are used to estimate parameters at the ARW study site based on actual discharge observations. As the 21-, 7-,
and 1-parameter models have similar performances (shown in Subsecs. 4.1 and 4.2), we provide the streamflow
predictions of the calibrated SWAT model based on 21-parameter models. In addition to the tuned 21-parameter
model, we also show the estimations of nine following best candidates. Similar inferences can be drawn for 7- and
1-parameter models.
Figure 9 shows the DL estimation of SFTMP and demonstrates its calibration performance with four different
metrics. Supplementary Figs. S17-S22 provide estimations for the other six sensitive parameters. We compare
the DL-enabled estimations with estimates from the GLUE-based method and prior ensemble predictions. The
evaluation criteria include R2 -score, NSE, logNSE, and KGE. For instance, NSE, logNSE, and KGE are evaluated
as follows:
n
X
(qi − qˆi )2 n
i=1 1X
NSE(q, q̂) = 1 − n where µq = qi (4.2a)
X 2
n
(qi − µq ) i=1
i=1
Xn
(log [qi ] − log [qˆi ])2
i=1
logNSE(q, q̂) = 1 − n (4.2b)
X 2
(log [qi ] − log [q̄])
i=1
s 2 2
2 σq̂ µq̂
KGE(q, q̂) = 1 − (r − 1) + −1 + −1 (4.2c)
σq µq
where qˆi ∈ q̂ is the SWAT model predictions and qi ∈ q is the observational streamflow. n is the dimension of q̂ and
q, which is the total number of time-steps. r is the Pearson product-moment correlation coefficient. σq̂ and σq are
the standard deviations in the SWAT model predictions and observations, respectively. µq̂ and µq are the standard
deviations in the SWAT model predictions and observations, respectively.
Each metric takes into account different aspects of calibration performance [91]. The R2 -score indicates the
goodness of fit, which measures how close the streamflow predictions from the DL-enabled calibration are to the
observed data. NSE evaluates how well the calibrated SWAT model predictions capture high flows. Complementary
to NSE, logNSE determines the accuracy of model predictions concerning low flows. KGE combines these three
different components of NSE (i.e., correlation, bias, a ratio of variances or coefficients of variation) in a more
balanced way (e.g., more weight on low flows and less weight on extreme flows) to assess the SWAT model calibration.
To summarize, DL-enabled parameter estimation is better than the behavioral parameter sets estimated by GLUE
for all four studied metrics. Moreover, the uncertainty ranges in DL estimated parameters are low compared to
GLUE and result in a well-clustered set.14 M. K. MUDUNURU ET.AL.,
1.0 1.0
Ensemble runs Ensemble runs
GLUE GLUE
0.8 CNN 0.8 CNN
R2-score
0.6 0.6
KGE
0.4 0.4
0.2 0.2
0.0 0.0
−4 −2 0 2 4 −4 −2 0 2 4
SFTMP SFTMP
(a) KGE vs. SFTMP (b) R2 -score vs. SFTMP
1.0 1.0
Ensemble runs Ensemble runs
GLUE GLUE
0.8 CNN 0.8 CNN
logNSE
0.6 0.6
NSE
0.4 0.4
0.2 0.2
0.0 0.0
−4 −2 0 2 4 −4 −2 0 2 4
SFTMP SFTMP
(c) NSE vs. SFTMP (d) logNSE vs. SFTMP
Figure 9. Estimated SWAT parameter (SFTMP) using observational data (DL vs. GLUE): This figure compares
the estimation of the SFTMP parameter using observational data with four different performance metrics. The calibration sets
are identified using the top 10 DL-based inverse models and the GLUE method. The blue, red, and light orange colored data
points represent the DL estimation, GLUE behavioral set, and ensemble runs in parameter space. Across performance metrics,
it is evident that estimation using the DL-enabled inverse models is better clustered than GLUE.
Figure 10(a) and (b) compares the predictive performance of the top ten calibrated parameter sets within and
beyond the calibration period. These figures show that most of the DL estimations consistently perform better
than the GLUE-based sets. The one-to-one scatter plots in Figs. 10(c)-(f) compare the streamflow predictions with
observational data, where each dot corresponds to daily streamflow. The predictions are based on the best sets
calibrated by either DL or GLUE. The best DL-based calibrated set has R2 , NSE, logNSE, and KGE scores of
0.53, 0.67, 0.87, and 0.74, respectively. The best GLUE-based calibrated set has R2 , NSE, logNSE, KGE scores of
0.48, 0.6, 0.7, and 0.68, respectively. From these values, it is clear that the DL-enabled inverse model estimations
have higher accuracy in the SWAT model calibration than the GLUE estimations. Therefore, CNNs show promise
for parameter estimation, especially in nonlinearly relating streamflow data to conceptual parameters.
Figure 10(g) shows that the uncertainty ranges are narrower for the top ten DL estimations in both calibration
and validation periods than the GLUE estimations. As a result, the probability that the prediction intervals
estimated by the DL sets contain the observed streamflow is lower compared to GLUE, as seen in Fig. 10(h). One
of our next steps is to improve this predictive uncertainty through probabilistic Bayesian neural networks [92].
This type of network can account for uncertainty so that DL-enabled inverse models can assign lesser confidenceDEEP LEARNING FOR WATERSHED MODELING 15
Performance metric 1.0 1.0
Performance metric
0.8 0.8
0.6 0.6
0.4 R2 -score (CNN)
0.4 R2 -score (CNN)
R2 -score (GLUE) R2 -score (GLUE)
NSE (CNN) NSE (CNN)
NSE (GLUE) NSE (GLUE)
0.2 logNSE (CNN) 0.2 logNSE (CNN)
logNSE (GLUE) logNSE (GLUE)
KGE (CNN) KGE (CNN)
KGE (GLUE) KGE (GLUE)
0.0 0.0
0 2 4 6 8 10 0 2 4 6 8 10
Top-10 calibrated parameter sets Top-10 calibrated parameter sets
(a) Calibration period (b) Validation period
Calibrated SWAT (GLUE)
Calibrated SWAT (GLUE)
Calibrated SWAT (CNN)
Calibrated SWAT (CNN)
60 60
60 60
40 40 40 40
20 20 20 20
20 40 60 20 40 60 20 40 60 20 40 60
3 3 3 3
Observational data [ ms ] Observational data [ ms ] Observational data [ ms ] Observational data [ ms ]
(c) Calibration period: KGE-based (d) Validation period: KGE-based (e) Calibration period: KGE-based (f) Validation period: KGE-based
best set (KGE = 0.74) best set (KGE = 0.76) best set (KGE = 0.68) best set (KGE = 0.75)
10 1.0
Mean variation of streamflow
CNN CNN
GLUE GLUE
8 0.8
Probability
6 0.6
4 0.4
2 0.2
0 0.0
Calibration Validation Calibration Validation
Time period Time period
(g) Size of mean variation of streamflow vs. time period (h) Probability that observational data is contained
within the prediction bounds estimated by DL or GLUE
Figure 10. Performance of DL vs. GLUE estimated parameters on observational data: This figure compares the
performance of the calibrated parameter sets evaluated by DL (i.e., using the 21-parameter inverse model) and GLUE within
and beyond the calibration period. The top figures show the performance metrics of the top 10 sets in the calibration and
validation period. The performance metrics (e.g., NSE, logNSE) focus on the predictive capability of DL- and GLUE-based
calibrated SWAT models in both low and high flow scenarios. DL outperforms GLUE across all metrics. The central figures
provide the one-to-one plots of the calibrated SWAT model compared to observational discharge. The discharge predictions are
based on the best calibrated set from the DL-enabled inverse model and GLUE methods. The red line is the one-to-one line.
Data points based on the DL estimated set are closer to the red line than data from the GLUE-based set. The bottom figure
shows the size of the mean streamflow variation. It also provides the probability that the observational data is contained
within the prediction bounds (i.e., the light blue or red colored region in Fig. 11) estimated by the calibrated SWAT model. The
uncertainty in the GLUE-based calibration sets prediction, and associated probability is higher than DL.16 M. K. MUDUNURU ET.AL.,
levels to incorrect predictions. Figure. 11 compares the streamflow predictions from the calibrated SWAT with the
observed data using the top ten DL and GLUE estimated sets. The DL estimations capture the various high
and low flows better than GLUE in both the calibration and validation periods. However, the calibrated SWAT
model demonstrates over predictions in the year 2008 and under forecasts in the year 2005. This lower predictive
performance may imply potential deficiencies (i.e., structural errors) in the underlying SWAT model representation
of the watershed processes. Additional investigations are necessary to identify other processes and parameters that
reduce structural errors and discrepancies in streamflow predictions.
4.4. Discussion. Our results demonstrate the applicability of using deep learning to calibrate the SWAT model.
We note that the proposed methodology is general and can be used to calibrate other watershed models such as ATS
and PRMS. This extensibility for calibrating other models and study sites can be achieved using transfer learning
methods [69]. Transfer learning will allow us to reuse the CNNs developed in this study and leverage them for a
new, similar problem. Minimal re-training is necessary to fine-tune the trained CNNs and apply them to calibrate
watershed models for other study sites. Such a transfer of knowledge across study sites is usually performed when
generating large training data needed to develop a full-scale CNN and tune its trainable weights from the start
is too computationally expensive (e.g., when using ATS). Additionally, we can improve our DL methodology to
calibrate the SWAT model by incorporating other multi-source data streams (e.g., ET, SWE) along with streamflow.
Our next step is to use such data streams to further investigate the deficiency of the model structure or processes
in the SWAT by ingesting streamflow, ET, and SWE into CNNs.
Figures 10(g) and (h) show that the uncertainty boundary of the streamflow predictions estimated using the
DL sets are narrower than GLUE, which is a limitation of the current methodology. Our future work involves
investigating this DL-based predictive uncertainty. Improved uncertainty intervals can be calculated by performing
ensemble SWAT model runs using the calibration sets (i.e., 500 runs for a single tuned CNN) with all the observational
errors (i.e., from 5% to 25%). Specifically, computing streamflow predictive uncertainty with noise involves running
a total of 5000 DL estimated calibration sets, which may be computationally expensive. However, incorporating
the DL calibration sets obtained using noisy observational data may allow us to better understand the uncertainty
intervals of streamflow predictions [93]. In addition to observational errors, developing CNNs tailored to estimate
the SWAT model parameters under different hydrological seasons [94] (e.g., winter vs. summer) may enhance the
calibration process. For example, comparing DL estimated sets from wet and dry periods of the year can provide
better insights on the SWAT model parameters that control streamflow predictions across different seasons. When
making such comparisons between real data and model predictions, hydrological signatures and their associated
metrics [95–99] can be used to shed light on the structural deficiencies of the SWAT model. Hydrological signatures
on which we can evaluate performance metrics include the slope of flow duration curve, rising limb density, recession
shape, and baseflow index of streamflow time-series data [97].
To conclude our discussion, in addition to the data-driven methodology presented in this study4, the efficacy of
the proposed DL methodology can also be improved by embedding domain knowledge into deep neural networks
[59, 60, 62, 63]. Recent advances in knowledge-guided machine learning provide an avenue to incorporate model
states/fluxes and water balance as part of recurrent neural network architectures [59]. The papers mentioned above
used such neural architectures to develop forward emulators for watershed models. One can extend the methods
presented in those works to incorporate process model knowledge into our proposed CNNs to improve SWAT model
calibration.
5. CONCLUSIONS
In this paper, we have developed a fast, accurate, and reliable methodology better to calibrate the SWAT model.
The developed DL-enabled inverse models were used to estimate SWAT parameters for the ARW study site in
YRB. Our approach leverages recent advances in deep learning techniques, CNNs, to extract representations from
streamflow data and map them to SWAT model parameters. Hyperparameter tuning was performed to identify
optimal CNN architectures. Ensemble runs from the SWAT model are used to train, validate, and test three
different DL-enabled inverse models (i.e., 1-parameter, 7-parameter, and 21-parameter models). We also used
4or by combining MCMC with forward emulators [65] for model calibrationYou can also read