GROUNDWATER MODEL OF THE MEADOW VILLAGE AQUIFER AT BIG SKY, MONTANA - Kirk Waren, James Rose, and Ronald Breitmeyer Ground Water Investigation ...
←
→
Page content transcription
If your browser does not render page correctly, please read the page content below
June 2021                                      Montana Bureau of Mines and Geology Open-File Report 742

            GROUNDWATER MODEL OF THE MEADOW VILLAGE AQUIFER
                          AT BIG SKY, MONTANA

                     Kirk Waren, James Rose, and Ronald Breitmeyer

                          Ground Water Investigation Program
                         Montana Bureau of Mines and Geology
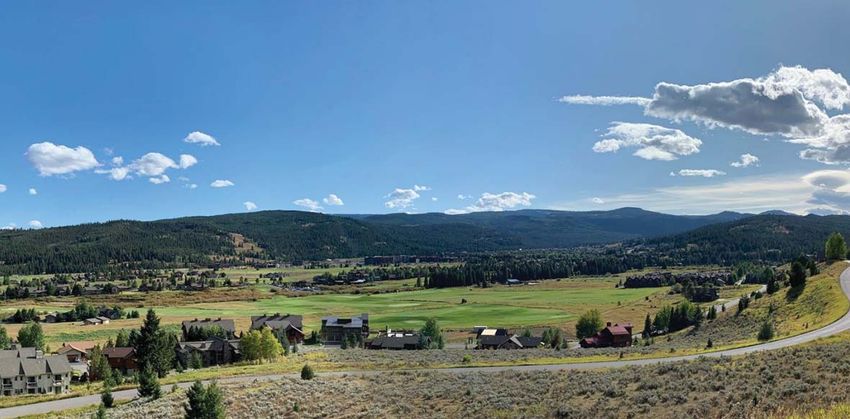
Cover image: Photo by James Rose, September 2019.
GROUNDWATER MODEL OF THE MEADOW VILLAGE AQUIFER
              AT BIG SKY, MONTANA

           Kirk Waren, James Rose, and Ronald Breitmeyer

                Ground Water Investigation Program
                Montana Bureau of Mines and Geology

                             June 2021

      Montana Bureau of Mines and Geology Open-File Report 742
Montana Bureau of Mines and Geology Open-File Report 742

                                                             TABLE OF CONTENTS

Abstract ..............................................................................................................................................................1
Introduction ........................................................................................................................................................1
     Background ..................................................................................................................................................1
     Objectives ....................................................................................................................................................2
Area Description ................................................................................................................................................2
Data Collection Methods ...................................................................................................................................6
     Data Management ........................................................................................................................................6
     Stream Discharge and Stage ........................................................................................................................6
     Groundwater Levels .....................................................................................................................................6
     BSWSD Well Pumping Rates ......................................................................................................................6
     Irrigation Rates.............................................................................................................................................6
     Aquifer Characteristics ................................................................................................................................8
     Meteorological Inputs ..................................................................................................................................8
Conceptual Model ..............................................................................................................................................8
     Geologic Framework ...................................................................................................................................8
     Hydrogeological Setting ............................................................................................................................10
           Climate .................................................................................................................................................10
           Meadow Village Aquifer ......................................................................................................................10
           Surface Waters .....................................................................................................................................10
     Groundwater Flow System ........................................................................................................................12
           Potentiometric Surface .........................................................................................................................12
           Aquifer Properties ................................................................................................................................12
Groundwater Budget ........................................................................................................................................14
     Groundwater Budget Components.............................................................................................................14
           Surface-Water Inflow (SWin) ................................................................................................................15
           Alluvial Groundwater Inflow (GWal-in).................................................................................................15
           Recharge (R) ........................................................................................................................................16
           Lateral Groundwater Inflow (GWlat-in) .................................................................................................17
           Surface-Water Outflow (SWout) ............................................................................................................17
           Alluvial Groundwater Outflow (GWal-out) .............................................................................................17
           Pumping Wells (PW) ...........................................................................................................................17
           Riparian Evapotranspiration (ET) ........................................................................................................18
           Discharge to Springs (SPR) .................................................................................................................18
           Changes in Storage (∆S) ......................................................................................................................18
           Transient Groundwater Budget ............................................................................................................18
Numerical Model Construction........................................................................................................................19
                                                                                                                                                                           iii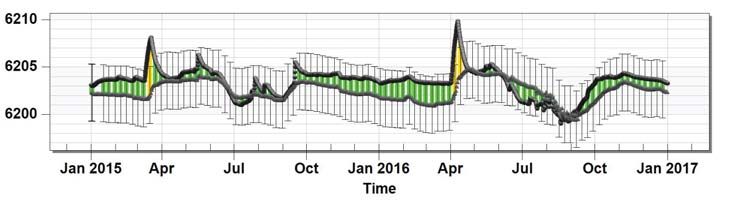
Waren and others, 2021

     Software Description .................................................................................................................................19
     Model Domain ...........................................................................................................................................19
     Spatial Discretization .................................................................................................................................20
     Temporal Discretization .............................................................................................................................22
           Steady-State Model ..............................................................................................................................22
           Transient Model ...................................................................................................................................22
     Hydraulic Parameters .................................................................................................................................22
     Internal Boundary Conditions—Sources and Sinks ..................................................................................22
           Recharge...............................................................................................................................................22
           River.....................................................................................................................................................23
           Wells.....................................................................................................................................................24
           Riparian Evapotranspiration ................................................................................................................24
     External Boundary Conditions...................................................................................................................24
Calibration........................................................................................................................................................25
     Selection of Calibration Targets and Goals................................................................................................25
     Steady-State Calibration ............................................................................................................................26
     Transient Calibration..................................................................................................................................29
Sensitivity Analysis and Model Verification ....................................................................................................29
Evaluation of the Models .................................................................................................................................33
     Scenarios ....................................................................................................................................................33
           Scenario 1: Short-Duration, High-Intensity Pumping .........................................................................33
           Scenario 2: Long-Duration, Increased Pumping ..................................................................................34
Model Limitations............................................................................................................................................35
Conclusions ......................................................................................................................................................37
Acknowledgments............................................................................................................................................37
References ........................................................................................................................................................37

                                                                           FIGURES
Figure 1. Topographic map of the Meadow Village area of Big Sky, Montana area with Meadow Village
   groundwater model domain boundary ..........................................................................................................3
Figure 2. Aerial photograph of the Meadow Village Area circa 1970 ...............................................................4
Figure 3. Modern aerial photograph of the Meadow Village area showing current state of development ........5
Figure 4. Map of monitoring sites in the Meadow Village area with GWIC identifiers ...................................7
Figure 5. The surficial geology in the model area consists of alluvium along the Middle Fork (Qal) and
   glacial outwash .............................................................................................................................................9
Figure 6. The saturated thicknesses contour map of the Meadow Village aquifer is based on interpolation of
measured thickness of alluvium reduced by depth to water ............................................................................11
Figure 7. Contour map of the Meadow Village aquifer potentiometric surface based on water levels form
   February 12, 2016 .......................................................................................................................................13
iv
Montana Bureau of Mines and Geology Open-File Report 742
Figure 8. Graph of daily volume (gallons) compiled from pumping data from BSWSD water supply
wells ............................................................................................................................................................18
Figure 9. Graph of monthly water budget components ...................................................................................19
Figure 10. Contour map of the elevation of the surface of the Frontier Shale underlying the Meadow
Village aquifer .............................................................................................................................................21
Figure 11. Monthly transient water budget incorporating riparian evapotranspiration component indicates
that stream gain is decreased relative to calculated stream gain when riparian evapotranspiration is not
included in the water budget .......................................................................................................................24
Figure 12. Map of MODFLOW grid and boundary conditions overlain on DEM hillshade image................25
Figure 13. Map of heads and associated calibration target errors after steady-state calibration .....................27
Figure 14. Hydraulic conductivity field obtained from steady-state calibration .............................................28
Figure 15. Graphs of daily transient calibration results for key wells ............................................................30
Figure 16. Graphs of monthly transient calibration results for key wells ........................................................31
Figure 17. Graph of groundwater pumping and simulated discharge from the aquifer to the Middle Fork,
compared to water budget estimated discharge to the Middle Fork ...........................................................34
Figure 18. Modeled change in groundwater discharge to the Middle Fork associated with short-duration,
high-intensity pumping ...............................................................................................................................35
Figure 19. Modeled stream depletion associated with long-duration increases in pumping (scenario 2) .......36
TABLES
Table 1. Aquifer characteristics obtained from aquifer tests at the Meadow Village public water supply
wells ..............................................................................................................................................................8
Table 2. Meadow Village municipal wells depth and pumping rate information ............................................12
Table 3. Recharge estimates for rain events from March 2015–September 2016 ...........................................14
Table 4. Precipitation recharge fractions..........................................................................................................15
Table 5. Conceptual model average annual groundwater budget ....................................................................16
Table 6. Monthly groundwater budget for the 2015–2016 study period .........................................................20
Table 7. Details of the MODFLOW model grid as constructed in GMS.........................................................22
Table 8. River node information ......................................................................................................................23
Table 9. Steady-state calibration targets for the Meadow Village groundwater model ...................................26
Table 10. Sensitivity analysis for the steady-state model ................................................................................32
vWaren and others, 2021 vi
Montana Bureau of Mines and Geology Open-File Report 742

                                                ABSTRACT
    Big Sky is a mountain resort community located in southwest Montana. Big Sky is currently undergoing a
period of rapid population growth, leading to expected increase in demand on water resources. An area within
Big Sky of particular concern is Meadow Village, which hosts mixed commercial and residential developments,
open space, and a golf course. Meadow Village sources water from a productive, but aerially limited, unconsoli-
dated and unconfined aquifer.
    The Montana Bureau of Mines and Geology (MBMG) Ground Water Investigation Program (GWIP) de-
veloped calibrated numerical groundwater models of the Meadow Village aquifer (MVA) as part of a broader
study of water resources of the Big Sky area. The models include a steady-state model representative of typical
baseflow conditions expected in the aquifer and a transient model that reflects seasonal changes in pumping, re-
charge, and interactions between the groundwater system and the Middle Fork of the West Fork of the Gallatin
River (referred to as Middle Fork). The transient model can be used to test various management and water-use
scenarios.
    The MVA groundwater model is an analysis tool that can be used for evaluating changes in the aquifer
system in response to ongoing development and water resource stress changes in the area. Simulations of
water use and growth scenarios specific to the GWIP study were conducted with the key objectives of assess-
ing aquifer productivity with respect to the existing well field and potential changes to baseflow in the Middle
Fork. Simulations indicated that high-intensity pumping of the MVA over short periods of time result in reduc-
tions in groundwater discharge to the Middle Fork and drawdown of groundwater levels below current public
water supply well depths; these wells fully penetrate the alluvial aquifer. A second scenario included sustained
increases of 25%, 50%, and 75% over current pumping rates. This resulted in a near 1:1 change in simulated
groundwater discharge to the Middle Fork. The maximum simulated groundwater discharge to the Middle Fork
accounted for approximately 20% of Middle Fork baseflow. Thus, our models show that increased utilization of
the MVA should be expected to affect baseflow in the Middle Fork.

               INTRODUCTION                                     The Meadow Village area of Big Sky hosts com-
                                                            mercial development that includes boutique shops,
                     Background                             restaurants, grocery stores, office space, lodging
    Big Sky is a ski resort community in the Madison        facilities, water and sewer treatment and distribution
Mountain Range of southwest Montana, about 40 mi            facilities, and medical and other first responder ser-
south of Bozeman. Established in 1971, the resort now       vices. These commercial spaces provide the support
includes more than 78 mi2 with 5,800 acres of skiable       infrastructure for the broader Big Sky resort. Addition-
terrain. During the resort's first 25 yr, development        ally, the Meadow Village area hosts residences and the
was sporadic; however, since 2013 Big Sky experi-           Meadow Village Golf Course.
enced a 21 percent growth in full-time residents, the
largest population growth rate in the State (Big Sky             Water demand fluctuates with the seasonal nature
Chamber of Commerce, 2019). As of 2019, the resort          of resort activities and population. Monitoring records
has 3,000 full-time residents and a growing seasonal        at the Big Sky Water and Sewer District (BSWSD),
visitor population. During the 2017–2018 ski sea-           which operates the Meadow Village and Mountain
son the resort hosted more than 500,000 skiers, with        Village water systems, show water consumption more
capacity for many more. According to the 2019 Big           than doubles between off seasons (March–May and
Sky, Montana Economic Profile, summer visitations            September–October), and peaks in winter (November–
are also increasing (Big Sky Chamber of Commerce,           April) and summer (June–August) seasons (Rose and
2019). With growth expected to continue, the commu-         Waren, in review). Summer irrigation of lawns and
nity is searching for additional sources of groundwater     four golf courses adds to water demand. Irrigation wa-
to satisfy the anticipated demand.                          ter for the golf courses comes from a combination of
                                                            groundwater and treated wastewater reuse. Irrigation
                                                            of residential lawns is sourced from groundwater.
                                                                                                                  1
Waren and others, 2021
Big Sky relies solely on groundwater for its wa- to development, the Meadow Village area was largely
ter supply. In 1993, the Upper Missouri River Basin grassland, as evident in aerial photos from 1970 (fig.
Closure declared all surface water allocated in the 2). The Big Sky Golf Course currently occupies much
watersheds of the Missouri River, which includes the of the northern and central parts of the Meadow Vil-
West Fork of the Gallatin River at Big Sky. Surface- lage area (fig. 3).
water development is limited, and public water supply
(PWS) system growth must come from groundwater. The MVA lies largely beneath the Big Sky Golf
The Meadow Village area relies on an aquifer hosted Course and extends into adjacent areas. It is an uncon-
in unconsolidated alluvial and glacial outwash de- fined aquifer composed of Quaternary-aged uncon-
posits for their water supply. For the purposes of this solidated glacial outwash and modern alluvium. The
report, the aquifer is referred to as the Meadow Village MVA provides some of the best quality groundwater in
aquifer (MVA). the area and is a productive water supply source (Rose
and Waren, in review).
Objectives
BSWSD operates five municipal wells that draw
The Montana Bureau of Mines and Geology water from the MVA. These wells are connected to a
(MBMG) Ground Water Investigation Program system that delivers water to all residences and busi-
(GWIP) developed a numerical groundwater model of nesses within the district, the extent of which is shown
the MVA as part of a broader study of water resources in figure 3. BSWSD has issued a moratorium on the
at the Big Sky, Montana Resort Area. Details of the drilling and use of privately owned domestic wells
project can be accessed through the GWIP portion of within the water and sewer district boundaries, with
the MBMG website (mbmg.mtech.edu). The MVA limited exceptions applying to older wells. The mora-
groundwater model is an analysis tool that community torium was established in 1971 within covenants that
stakeholders and water planners can use for evaluating established the Meadow Village subdivision (Meabon,
changes in the aquifer system in response to ongoing 1994). Thus, the presumption is that wells established
development and water resource stress in the area. prior to 1971 would be grandfathered in. However, no
Results are presented from hypothetical simulations pre-1971 pumping wells are completed in the MVA,
of the timing of water use and growth in water use and since the MVA is wholly within the BSWSD, all
specific to the study. pumping of the groundwater in the MVA is managed
This report documents the MVA groundwater by the BSWSD. Most of the Meadow Village area is
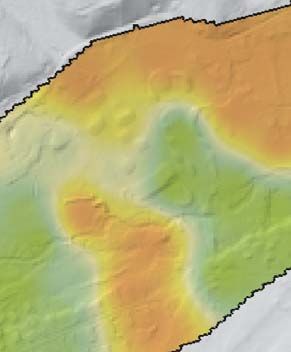
models that include the MODFLOW simulation input within the BSWSD, except for a small developed area
and output files. Details on model construction, opera- along the southwest border of the BSWSD bound-
tion, calibration, and analysis of sensitivity are provid- ary shown in figure 3. Since this area is outside the
ed for groundwater modelers who may utilize and/or BSWSD, any developments are not connected to com-
modify the MODFLOW models to meet their needs. munity water supply or sewer systems and rely upon
In the context of the GWIP study, the numerical model individual wells and septic tank systems for wastewa-
is used as a tool to refine the conceptual water budget ter handling.
for the Meadow Village area and evaluate the capac- All residences and businesses within the BSWSD
ity of the MVA in response to current and hypothetical are connected to BSWSD’s sewer system. Wastewater
future uses. conveyed by the sewer system is highly treated and
stored in lined lagoons at the BSWSD sewer treat-
AREA DESCRIPTION
ment plant to the east of the Big Sky Golf Course
Meadow Village is an approximately 1.7 mi2, (fig. 3). During the growing season (typically when
relatively flat-lying area at the lower elevations of the snow is clear from the ground in the period between
Middle Fork of the West Fork Gallatin River Basin March and September), the treated effluent is used to
(referred to as Middle Fork in this report; fig. 1). irrigate the Meadow Village, Spanish Peaks, and Yel-
Meadow Village includes the Big Sky Golf Course, lowstone Club golf courses. Two pasture areas north
Town Center, businesses, residences, recreational of the Middle Fork are also periodically irrigated with
features (e.g., hiking and biking trails), and support- the treated effluent. Additional detail on irrigation is
ing infrastructure (e.g., water/sewer treatment). Prior provided below.
2.DOLVSHOO
*UHDW)DOOV
0LVVRXOD
+HOHQD
%XWWH
%R]HPDQ
%LOOLQJV
%LJ6N\
rk
Fo
%LJ6N\ le
idd
M
0HDGRZ9LOODJH
*ROI&RXUVH
±
PL
Figure 1. Topographic map of the Meadow Village area of Big Sky, Montana area with Meadow Village groundwater model domain boundary.
Shown on the map are key tributaries (Crail Creek) to the Middle Fork of the West Fork of the Gallatin River (Middle Fork), location of the Meadow
Village Golf course, and river crossings at Center Lane and State Highway 64.
Montana Bureau of Mines and Geology Open-File Report 742
34
Waren and others, 2021
Big Sky
Meadow Village
k
le For
M idd
0 0.125 0.25
±
0.5PL
Figure 2. Aerial photograph of the Meadow Village Area circa 1970. Prior to development, the Meadow Village area was primarily character-
ized by meadow grasses and a riparian environment adjacent to the Middle Fork.Overview
!
( !
(
!
(
!
( *
# !
(
*
# *
#
! !
( !
( !
(#
*
( !
( !
( !
( !
(
(
!!
( !
(
!
(
!
( !
( !
(
!
(
#
*
!
(
*
#
!
( !
(
*
# !
(
*
# ! *
#
(
!
( !
(
!
(
!
(
!
(
!
(
Model Area Detail
(
! (
!
(
! #
*
(
! (
!
(
! ( #
*
(
! (
! #
!*
! (
( ! (
! (
!
(
!!
( (
!
(
!
(
! (
! (
!
(
!
#
*
!
( #
*
(
! (
!
#
* (
!
#
* (
! #
*
(
! (
!
0 0.25 0.5 1 mi (
!
(
!
Explanation (
!
(
! 0 0.125 0.25
± 0.5PL
! Well
West Gallatin & Named Tributaries
! Pumping Well ±
Model Domain
! Pond Gage
BSWSD Boudary
# Spring
# Stream Gage
Figure 3. Modern aerial photograph of the Meadow Village area showing current state of development. Overview shows the BSWSD area (green outline).
Model Area Detail shows Big Sky Golf Course and the BSWSD treatment ponds.
Montana Bureau of Mines and Geology Open-File Report 742
5Waren and others, 2021
DATA COLLECTION METHODS Troll 100s or LevelTroll 300s and two Solinst trans-
ducers with specific conductivity (SC) sensors re-
GWIP hydrogeologists collected data to support corded hourly water levels. Two transducers recorded
model development and calibration. These data in- SC and were located in a shallow and a deep well over
cluded stream discharge in the Middle Fork, ground- the duration of the study. SC values were comparable
water levels, pumping rates from water supply wells, in shallow and deep groundwater. Barometric pressure
irrigation rates from the Big Sky Golf Course, aquifer transducers collected data used for correction of the
characteristics from aquifer tests, and meteorological unvented transducer measurements. Instrument read-
parameters such as precipitation. These data are incor- ings were corrected for offset by adjusting transducer-
porated into the numerical model as calibration objec- measured levels to monthly hand measurements.
tives (water levels), boundary conditions (irrigation, Offsets may have occurred when pulling and replacing
pumping, and meteorological inputs), and calibration the transducers. Monthly surface-water-level measure-
constraints (aquifer characteristics from aquifer tests). ments were collected and transducers were down-
Monitoring took place during 2014–2016. Addition- loaded during each monthly measurement run. Drift of
ally, GWIP installed 15 wells in the Meadow Village the loggers was not found to be a problem and there-
area to refine definition of the base of the Meadow fore did not require correction. Water-level data were
Village aquifer. Included in the drilling were three converted into elevations for preparation of potentio-
pairs of nested wells for monitoring vertical hydraulic metric maps and utilization in the numerical model.
gradients. Water-level elevations were calculated by differencing
Data Management the water-level depth measurements from ground-level
elevations obtained via LiDAR data (Gardner, 2012).
Data collected for the Big Sky area investigation
and the Meadow Village groundwater model are stored BSWSD Well Pumping Rates
in the MBMG’s Ground Water Information Center Pumping data from public water supply (PWS)
(GWIC) database (mbmggwic.mtech.edu). GWIC wells were obtained from BSWSD (Ron Edwards,
contains information on well completions, groundwa- General Manager, BSWSD, written commun., 2018).
ter levels, water chemistry, aquifer tests, surface water, BSWSD monitors pumping rates from their supply
and other information. GWIC identification numbers wells using flowmeters. Hourly pumping data were
(GWIC IDs) reference locations and sites where data compiled and totaled into daily and monthly summa-
were collected for this report (i.e., referred to as well ries as necessary for the numerical simulations. The
275232 or for surface water as site 274333). The data BSWSD PWS wells account for all pumping wells
for this study can also be accessed through the relevant completed in the MVA.
project page within the GWIP section of the MBMG
website (mbmg.mtech.edu). Irrigation Rates
Stream Discharge and Stage Irrigation in the Meadow Village area includes
residential and commercial lawn and garden water-
Streamflow measurements were made at defined ing using groundwater supplied by BSWSD. Treated
stations using the velocity-area method (Turnipseed effluent from the BSWSD sewage treatment plant is
and Sauer, 2010), with a FlowtrackerTM current meter. used to irrigate the golf course and the two pasture
Flows were gaged periodically (about monthly when areas north of the Middle Fork. Irrigation of the Big
the river was not frozen) during the study period at six Sky Golf Course is not expected to significantly affect
locations along the Middle Fork (fig. 4) in the vicinity groundwater recharge since the irrigation rates (ob-
of Meadow Village (sites 275228, 282927, 275230, tained from BSWSD) are carefully controlled to match
282928, 275231, and 274333). Data logging pressure evapotranspiration on the golf course such that there
transducers were installed at each staff gage (discharge is a net zero water balance between irrigation and
measurement point) to track stream stage every hour. evapotranspiration. This has been verified by BSWSD,
Groundwater Levels which uses lysimeters located on the golf course to
track water-level changes during irrigation season.
Groundwater levels were monitored in the well
network shown in figure 4. Unvented in situ Rugged-
6Cr
ai
l
Cr
eek
281371 281367 Middle F
!
(
281373 257677 !
( ork
We
275231
165687 !
(
!
( 236777
st
F o r k Gallatin R iver
!
( #
* !
( 274333
MV-4 281368
166989 103507 103505 165690 275232 103561 #
*
!
( !
( !
( 281366 (#
!* (
!
103560
155052
!
282928( !
(
MV-5
MV-1
!
(
MV-3 MV-2
( 236778
!!
257678( ! 165688
( 165689
!
( 103508 281369 220659
281362 !
(
281360( !
( !
(
281363 ! #
*
281364 !
( 275230 280693
103557
#
*
275228 !
( 281365
!
(
#
* !
(
*
# 282927 ! 281370
(
280689*
#
165686 165685
!
( !
(
281359
!
( 281374
!
(
er
v Explanation
104510 n Ri
!
( llati # Stream *age ! Pumping :ell
Ga # Spring !
281372 k Pond *age
!
( We st F o r
! Well Model Domain
ork
th F ±
Sou
0 0.125 0.25 0.5 mi
Figure 4. Map of monitoring sites in the Meadow Village area with GWIC identifiers.
Montana Bureau of Mines and Geology Open-File Report 742
7Waren and others, 2021
Aquifer Characteristics lations, daily summaries from the period of interest,
Aquifer test data for wells in Big Sky compiled 2014 to 2016, were used directly.
from consultant’s reports, literature, and DNRC re-
CONCEPTUAL MODEL
cords were matched to the appropriate GWIC numbers
(table 1). A summary table of aquifer test analyses A conceptual model is a site-specific interpreta-
from Western Groundwater Services d.b.a. (WGS, tion of the characteristics and dynamics of the physical
2002, 2008, 2015) provided transmissivity (T) and system of interest. It includes descriptions of the geol-
specific yield (Sy) values for the five BSWSD mu- ogy and hydrology of the aquifer system, hydrologic
nicipal pumping wells in the Meadow Village aquifer. boundaries, hydraulic properties, sources and sinks,
GWIP personnel calculated hydraulic conductivity (K) and a water budget. The level of detail is driven by the
using transmissivity and estimated saturated thickness available data (ASTM, 1995). The conceptual model
from well logs available from GWIC. for the MVA is developed by interpreting monitor-
ing well data and surface-water gaging stations, and
Meteorological Inputs
reviewing historical documents. Monitoring sites are
Precipitation measurements for the lower eleva- shown in figure 4.
tions are recorded at the BSWSD weather station
BS-STA01 (Ron Edwards, written commun., General Geologic Framework
Manager, BSWSD, 2014), located in Meadow Village Figure 5 is a geologic map (after Vuke, 2013) of
at about 6,100 ft elevation. Big Sky 2WNW, located the Meadow Village area. Well logs available from the
just west of Meadow Village, records weather data PWS wells, existing monitoring wells, and additional
at 6,600 ft elevation (WRCC, 2016). Low-elevation monitoring wells drilled for this study showed that the
(6,700 ft amsl) snowfall and snowmelt records were MVA consists of unconsolidated Quaternary glacial
obtained from SNOTEL 924 in the Madison Mountain outwash and modern alluvial deposits that extend from
Range at West Yellowstone, 43 mi south of the study the ground surface to a depth of up to 100 ft. Surface
area (not shown on maps; SNOTEL 924, 2018). SNO- geological observations and interpretation of the PWS
TEL 924 is in the Madison Range. SNOTEL Site 590 and monitoring well logs do not show occurrence of
at Lone Mountain, elevation 8,880 ft amsl, provided continuous deposits of glacial till or other potentially
data for higher elevations (SNOTEL 590, 2018). Data low-conductivity material in the Meadow Village area.
from a Gallatin River Task Force (GRTF) sonic depth The underlying Cretaceous age bedrock is dominated
sensor also allowed for tracking of snow depth on the by shale of the Frontier Formation (fig. 5), which
Middle Fork river ice near Meadow Village (Kristen crops out along the South Fork south of the Big Sky
Gardner, GRTF, written commun., 2018). For steady- Golf Course (see fig. 5). The unconsolidated glacial
state simulations, average daily precipitation was outwash and alluvial deposits form an asymmetrical
estimated from the meteorological records to apply to system that is thicker on the north side of the valley
the single, daily stress period. For the transient simu- and thins to the south.
7DEOH$TXLIHUFKDUDFWHULVWLFVREWDLQHGIURPDTXLIHUWHVWVDWWKH0HDGRZ9LOODJHSXEOLFZDWHUVXSSO\ZHOOV
6DWXUDWHG
*:,&
6LWHQDPH 'DWHRI7HVW 7KLFNQHVV 7 IWG 6SHFILFBig Sky
Meadow Village
Frontier Formation
Kf
0 0.125
±
0.25 0.5 mi
Explanation
Qal–Alluvium Tgr–Gravel Jm–Morrison Formation
Contact
Qta–Talus deposit Kgb–Gabbro sills J^ed–Ellis Group, Woodside and Dinwoody Formations
Concealed Contact Qc–Colluvium Kf–Frontier Formation Psh–Shedhorn sandstone
Concealed Fault Qaf–Alluvial fan deposit Km–Mowry shale *Mqsr–Quadrant Formation and Snowcrest Range Group
Syncline
Qls–Landslide deposit Kmd–Muddy sandstone Mm–Madison Group
Concealed Syncline
Qgt–Glacial till Ktu–Thermopolis Formation, upper shale member W–Water
Qgo–Glacial outwash deposit Ktl–Thermopolis Formation, lower sandstone member
Thr–Huckleberry ridge tuff Kk–Kootenai Formation
Figure 5. The surficial geology in the model area consists of alluvium along the Middle Fork (Qal) and glacial outwash (Qgo; from Vuke, 2013).
Note the outcropping of the Frontier Formation south of the model domain.
Montana Bureau of Mines and Geology Open-File Report 742
9Waren and others, 2021
Hydrogeological Setting wells 281359, 281374, and 281372 in fig. 4), drilled
Climate as part of this study, were completed at the bottom of
the MVA at the bedrock contact. These wells showed
Big Sky is located in mountainous terrain where
seasonal saturation after recharge events, but gener-
climate varies from continental-type climate areas at
ally dry conditions during other times. The maximum
around 6,000 ft elevation to alpine-type climate above
saturated thickness of the aquifer is between 40 and 50
11,000 ft. Meadow Village is located in the lower
ft depending on location (fig. 6).
elevation, continental-type climate area that receives a
30-yr average of 20.5 in/yr precipitation (1967–2016; Surface Waters
WRCC, 2016). Rainfall typically occurs in the spring
and throughout the summer; snow is common from The Middle Fork enters the model domain bound-
late fall through early spring. In 2013, precipitation ary at the west end of the Meadow Village area (fig.
was 20.4 in; in 2014, the site received 26.7 in, an 1). From there it flows eastward through the Big Sky
annual high for the period of record (WRCC, 2016). Golf Course area. Portions of the stream appear to
Records for 2015 and 2016 are incomplete. SNOTEL have been reconfigured in the golf course area. Below
924 in West Yellowstone, at 6,700 ft, received 19.2 the bridge on Center Lane, the river flows in an ap-
in of precipitation in 2013, 30.4 in. in 2014, 24.0 in. parently undisturbed, natural channel for about a mile
in 2015, and 26.2 in. in 2016. The 30-yr mean annual before exiting the model boundary, turning south, and
precipitation at West Yellowstone is 23.8 in (WRCC, passing beneath State Route (SR) 64 (Big Sky Road;
2016). Three of the four monitored years received fig. 1). The confluence between the South Fork of the
above-average precipitation. West Fork (South Fork) and the Middle Fork is a few
hundred yards below the SR 64 bridge. Below this
Meadow Village Aquifer confluence, the river is referred to as the West Fork.
Immediately below the SR 64 bridge, the Middle
The MVA occurs in the Quaternary glacial out-
Fork flows on bedrock, and the alluvium is limited to
wash and modern alluvial deposits. This is an aerially
bouldery areas adjacent to the channel. The West Fork
limited, productive, unconfined aquifer. The MVA is
flows into the Gallatin River about a mile east of the
considered unconfined and hydraulically connected
Middle Fork–South Fork confluence.
across its entire thickness based on data from three
pairs of nested monitoring wells that were installed The Meadow Village Aquifer and the Middle Fork
for monitoring vertical hydraulic gradients as part of are interdependent according to Van Voast (1972).
this study (Rose and Waren, in review). For all three This is expected in this geologic setting, where there
pairs of nested wells, static water levels responded is no evidence of till or other low-conductivity mate-
similarly to seasonal fluctuations and were comparable rial within the alluvial and outwash material lining the
regardless of screen depth. The geological setting and Middle Fork valley (fig. 5). Because of their intercon-
observed water levels in local monitoring and PWS nection, the stream and aquifer constitute a single
wells indicate the MVA is hydrologically intercon- water resource and withdrawals from one source affect
nected with the Middle Fork. Therefore, for purposes water availability in the other. Based on the small size
of this study, we assume the aquifer and Middle Fork of the system, only 254 acres aerially and less than 50
are hydrologically connected. ft of saturated thickness, pumping from the aquifer is
expected to affect streamflows with only modest buff-
The underlying shale bedrock serves as a hydro-
ering by storage in the aquifer.
logic boundary that isolates the alluvial aquifer from
the deeper, confined, bedrock groundwater system. Streamflows in the Middle Fork across the MVA
Glacial till and shale bedrock occur along the northern are available in the GWIC database for sites 274333,
boundary of the aquifer. Based on observed lithology, 275228, and 275230 (see fig. 4). Flow measurements
these units are not expected to contribute much flow ranged between 8 and 35 cfs with an average flow of
to the aquifer. At the southern edge of the aquifer, the 13 cfs for all measurements between 2013 and 2017.
underlying shale slopes upward toward the surface, Excluding peak flow measurements (30 and 35 cfs in
such that the saturated zone thins and steepens to June 2016 for sites 275228 and 274333, respectively),
the south. The southernmost monitoring wells (e.g., the average flow in the Middle Fork is approximately
1040 30
20
Big Sky 40 281371
281373 ! 257677
!
236777 ! 275231
Meadow Village 165687
! 30 ! 10
! 103561
103505 281368
166989 103507 ! !
! 20! 281366 ! ! 165690 ! 275232 103560
282928 ! !
! 155052
255834
10
257678
3 !! 236778 ! 165688
0
!
165689 103508
281360 !
20 281362 ! 281369 !
!! 275230 220659
281363
!
! 280693
281364 10
!
281365 !
! ! 280689
! 281370
282927
165686
! 165685
!
281374
!
Explanation
! Monitoring Sites with GWIC ID
5 ft Saturated Thickness Contours ±
Model Domain
0 0.125 0.25 0.5 mi
Figure 6. The saturated thicknesses contour map of the Meadow Village aquifer is based on interpolation of measured thickness of alluvium re-
duced by depth to water. The saturated thickness is greatest in the northern section of the model area near the mountains and thins in the up-
stream and downstream direction along the Middle Fork and toward the Sourthfork. The model domain includes aquifer where the thickness is at
least 10 ft.
Montana Bureau of Mines and Geology Open-File Report 742
11Waren and others, 2021
12 cfs. Peak flows generally occur over a brief period The calculated K for the five wells (summarized in
each year associated with runoff from snowmelt (Rose table 1) are consistent with K reported in the literature
and Waren, in review). Therefore, the typical flow in for glacial outwash aquifers (Fetter, 2010). Specific
the Middle Fork is better represented by the lower yield (Sy) values of 0.036 and 0.028 were calculated
average of 12 cfs. for the two aquifer tests with observation wells (MV-4
and MV-5, respectively).
Groundwater Flow System
Potentiometric Surface As an independent check on Sy, we analyzed the
response of wells to three recharge events: snowmelt
A water table elevation map (fig. 7) developed for in years 2015 and 2016, and one large rain event. The
the MVA based on February 12, 2016 groundwater groundwater response was based on the relationship
elevations represents near base-level conditions. The between the amount of recharge and the change in the
map includes surface-water elevations at the west and volume of aquifer saturated:
east ends of the aquifer based on staff gage readings at
sites 275228 and 271433 (see fig. 4). These sites are Sy = Vd/Vt,
both in locations of relatively undisturbed alluvium, where Sy is specific yield, Vd is volume drained, and
where groundwater is expected to be at about the Vt is total volume of a soil or rock sample (Heath,
same elevation as surface water. Water elevations at 1983). This formula was applied using an estimated
two wells near the southern edge of the area, 281372 recharge (tables 3, 4) and the corresponding response
and 281374, dropped below the level of the pressure in each well by considering the estimated recharge the
transducers during annual low water periods. Water “volume drained,” even though it is actually a volume
elevations in these wells were thus based on seasonal saturated, and considering the response representative
low levels measured with a sounder instead of trans- of the total volume affected. Using well 281363 as an
ducer data. example:
The water table surface is generally similar to the Snow (2015): Sy = 0.23 ft (estimated recharge)/4.01 ft
ground surface topography sloping eastward along the (response) = 0.057
course of the Middle Fork. The shale bedrock underly-
ing the aquifer acts as a floor, restricting groundwater Rain: Sy = 0.0275 ft (estimated recharge)/0.81 ft
from downward or upward flow from the deeper bed- (response) = 0.034
rock aquifer system. Groundwater in the aquifer flows
generally eastward, perpendicular to the contours (fig. The Sy calculated by these means were about the
7). same order of magnitude as those derived from the
aquifer test data. The snowmelt-based Sy ranged from
Aquifer Properties 0.028 to 0.26 (median of 0.059), and the rain-event-
based Sy ranged from 0.015 to 0.12 (median of 0.059).
Transmissivities, hydraulic conductivities, and These values are consistent with reported Sy for a silty
storage coefficients are available from aquifer test or fine-sand unconsolidated aquifer (Dingman, 2002;
analysis for the five BSWSD municipal pumping Fetter, 2010).
wells (WGS, 2008). The BSWSD municipal wells in
Meadow Village, MV-1 through MV-5 (fig. 4), have
pumping rates between 100 and 250 gpm (table 2).
7DEOH0HDGRZ9LOODJHPXQLFLSDOZHOOVGHSWKDQGSXPSLQJUDWHLQIRUPDWLRQ
%6:6':HOO1DPH *:,&,' 'HSWK IW 3XPSLQJ5DWH JSP D
09
09
09
09
09
D
3XPSLQJUDWHVREWDLQHGYLDSHUVRQDOFRPPXQLFDWLRQEHWZHHQ.LUN:DUHQDQG
5RQ(GZDUGV ²VSHFLILFGDWHXQNQRZQ
126209.83 6160.38
!
Big Sky !
!
6201.67 6147.12
Meadow Village !
6244.45 !
6098.46
6188.17 !
! 6145.41
6126.78
6184.89 ! !
!
61
61
60
6217.55 80
614
6242.61
!
6100
6120
0
! 6208.77 62
! 00
6188.08
62
! 6165.19 6154.3
!
20
6247.17 !
!
62
!
40
6274.46
630
0
!
6291.28 !
626
6303.56 ! 6279.88 !
0
6234.89
! 6215.33 !
6240.58
6280
6265.86
!
6273.04 !
Explanation
6283.31
! 10 ft Water Elevation Contours
! Monitoring Sites
Model Domain
±
0 0.125 0.25 0.5 mi
Figure 7. Contour map of the Meadow Village aquifer potentiometric surface based on water levels form February 12, 2016. Contour interval is
10 ft. Water flows perpendicular to potentiometric contours (generally west to east) consistent with flow direction of the Middle Fork.
Montana Bureau of Mines and Geology Open-File Report 742
13Waren and others, 2021
GROUNDWATER BUDGET
A groundwater budget based on field measure-
ments collected by GWIP personnel between 2014 and
7DEOH5HFKDUJHHVWLPDWHVIRUUDLQ 2016 and/or published and proprietary data (WGS,
HYHQWVIURP0DUFK±6HSWHPEHU
2008; WRCC, 2016; Ron Edwards, General Manager,
5HFKDUJH 5HFKDUJH BSWSD, written commun., 2018; Kristen Gardner,
'DWH LQ IW GRTF, written commun., 2018; Rose and Waren, in
review) was developed for the MVA. The groundwater
budget establishes an initial, quantitative estimate of
water fluxes in the groundwater system being mod-
eled. The water budget serves as a tool to evaluate the
numerical groundwater model. Since the MVA serves
as the control volume for the water budget, inflows re-
fer to flow into the aquifer, and outflows refer to flow
out of the aquifer.
For the purposes of groundwater modeling and
water budgeting, hydrologic boundaries where water
flows into the modeled groundwater system are con-
sidered sources and boundaries that represent flow out
of the groundwater system are considered sinks. The
Middle Fork acts as a source or sink depending on rel-
ative elevations of the groundwater surface and river
stage; the gaining or losing nature of the river can vary
over space and time. These fluctuations cannot typi-
cally be captured in a monthly water budget but can
be captured in the models. Other hydrologic boundar-
WRWDO ies include the five BSWSD municipal wells (sinks),
groundwater inflow from upgradient areas of the aqui-
fer (source), and groundwater outflow to downgradi-
ent alluvium (sink). There is also some groundwater
discharge (sink) to small springs in the area.
An atmospheric boundary exists at the ground sur-
face and includes sources and sinks. At the atmospher-
ic boundary, precipitation (snowmelt and large rainfall
events) serves as a source of aquifer recharge. Evapo-
transpiration by riparian vegetation and from ponds
is a sink. Irrigation of the golf course occurs at the
atmospheric boundary. However, golf course irriga-
tion should normally not be recharging the MVA due
WRWDO
to the deliberate efforts to not overirrigate; therefore,
golf course irrigation is not considered as a hydrologic
boundary in this conceptual model.
Groundwater Budget Components
The groundwater budget for the MVA can be
represented as a mass balance equation where inflows
(sources) = outflows (sinks) ± changes in storage. Bro-
ken down into components relevant to the Meadow
14Montana Bureau of Mines and Geology Open-File Report 742
7DEOH3UHFLSLWDWLRQUHFKDUJHIUDFWLRQV
3UHFLSLWDWLRQ
EHWZHHQ +DOIRIWKH &DOFXODWHG5HFKDUJH
6XPRI
3UHFLSLWDWLRQ DQGLQ 3UHFLSLWDWLRQ ([FHHGLQJLQDQG+DOIRI
3UHFLSLWDWLRQ ([FHHGLQJ ZLWKLQWKH5DQJH EHWZHHQ WKDWLQWKH7KUHVKROG5DQJH )UDFWLRQRI3UHFLSLWDWLRQ
LQ LQ RI7KUHVKROG9DOXHV DQGLQ WRLQ $OORFDWHGWR5HFKDUJH
Note.2QO\ILYHSUHFLSLWDWLRQHYHQWVLQDQGH[FHHGHGDFDOFXODWHGUHFKDUJHRILQ$OOEXWQLQHFDOFXODWHGUHFKDUJH
YDOXHVZHUHOHVVWKDQLQ WDEOH
Village aquifer, the resulting mass balance equation is: between 1 and 5 cfs. This is a net streamflow increase
from the upstream end to the downstream end of
SWin + GWal-in + R + GWlat-in = SWout + GWal-out + the model area (see fig. 4). Within the model area,
PW + ET+ SPR ± ΔS, flow measurements at individual sites between sites
where SWin is surface-water inflow to the aquifer; 275228 and 2743333 (see fig. 4) indicate that modest
GWal-in is groundwater inflow through the aquifer at net streamflow gains or losses occur along individual,
the upgradient end of the model area; R is recharge shorter reaches of the Middle Fork within the model
from snowmelt and precipitation; GWlat-in is lateral area. However, the overall measured streamflow gains
groundwater inflow from south and north of the model (i.e., outflow from the MVA) exceeded measured
area; SWout is groundwater outflow to the Middle Fork; losses, indicating that over the entire study area, the
GWal-out is groundwater outflow through the aquifer at stream was gaining groundwater from the MVA. The
the downgradient end of the model area; PW is pump- net gains and losses calculated between stations during
ing wells; ET is riparian evapotranspiration; SPR is baseflow conditions were near or below the measure-
discharge to springs; and ΔS is changes in storage. ment error for surface-water measurements, suggest-
ing that these gains and losses are likely small enough
The rates and volumes for this groundwater budget to be negligible to the overall water budget. Therefore
are based on the 254-acre groundwater model domain we estimated river loss to the aquifer, or SWin, as zero
(fig. 1). Estimates for each component in the water in the analytical groundwater budget calculation. The
budget are described below, and are summarized in numerical MODFLOW model calculates this compo-
table 5. Daily flows in and out of the aquifer were cal- nent of the water budget as a model output.
culated by distributing average annual conditions over
the appropriate number of days in the study period Alluvial Groundwater Inflow (GWal-in)
(2014–2016). Groundwater inflow from the upstream alluvium
Surface-Water Inflow (SWin) was estimated using Darcy’s Law (Fetter, 2010):
Surface-water inflow describes inflow to the Q = -KA(dh/dl),
aquifer from the Middle Fork and is based on field where: Q is total flow (ft3/d); K is hydraulic conduc-
measurements. Increases in streamflow between sites tivity (ft/d); A is cross-sectional area perpendicular to
275228 and 274333 (measurements available in the flow (ft2); and dh/dl is groundwater gradient (dimen-
GWIC database) show that the MVA typically dis- sionless, or ft/ft).
charges water to the Middle Fork at a flow rate of
15Waren and others, 2021
7DEOH&RQFHSWXDOPRGHODYHUDJHDQQXDOJURXQGZDWHUEXGJHW
6RXUFHV IWG DFUHIW\U
6XUIDFHZDWHULQIORZ QHW
$OOXYLDODTXLIHULQIORZD
5HFKDUJHIURPVQRZPHOWDQGSUHFLSLWDWLRQ
E
/DWHUDOJURXQGZDWHULQIORZ
7RWDO VRXUFHV
6LQNV
6XUIDFHZDWHURXWIORZ
$OOXYLDODTXLIHURXWIORZD
3XPSLQJZHOOV
5LSDULDQHYDSRWUDQVSLUDWLRQ
F
'LVFKDUJHWRVSULQJV XQTXDQWLILHG
DVVXPHGWREH
&KDQJHVLQVWRUDJH
]HUR
7RWDO VLQNV
D
$OOXYLDODTXLIHULQIORZRXWIORZDUHIORZLQWRDQGRXWRIWKH09$DWZHVWDQG
HDVWHUQPRGHOERXQGDULHV
E
/DWHUDOJURXQGZDWHULQIORZLVIORZLQWRWKH09$DORQJWKHVRXWKHUQPRGHO
ERXQGDU\DQGWKHQDUURZDUHDDGMDFHQWWR&UDLO&UHHNDORQJWKHQRUWKHUQ
ERXQGDU\
F
6LQFHWKLVLVDQDQQXDOL]HGEXGJHWGDLO\(7UDWHLVFDOFXODWHGDVWKHDQQXDO
WRWDOGLYLGHGRYHUGD\V6HYHUDOPRQWKVRIWKH\HDUOLNHO\KDYHOLWWOHWRQR(7
DQGWKHDQQXDOWRWDORIDFUHIWZRXOGEHFRQFHQWUDWHGRYHUDVKRUWHUSHULRGRI
WLPH7KHGDLO\(7UDWHZRXOGWKHUHIRUHEHKLJKHUGXULQJWKLVSHULRGRIWLPH
Note.6XUIDFHZDWHURXWIORZLVFDOFXODWHGWREDODQFHWKHRXWIORZVZLWKLQIORZV
Using high (151 ft/d) and low (67 ft/d) bounds on and precipitation events (tables 3, 4). Threshold values
K established from aquifer tests for the five BSWSD of daily precipitation were defined for the MVA by
municipal wells (see table 1), an estimated saturated identifying the minimum amount of daily precipitation
alluvial thickness of 10 ft (estimated from the average necessary to generate a water-level signal change in
distance between the water table and underlying shale groundwater. The threshold values for different sites
contact at the western edge of the model domain), and generally ranged from 0.2 to 0.5 in of daily precipita-
a hydraulic gradient of 0.0238 (calculated from the tion. Based on this analysis, any precipitation less than
potentiometric surface, e.g., fig. 7), the groundwater 0.2 in/d is assumed to result in zero recharge, since
inflow across the 1,620 ft upgradient end of the model water levels in wells typically showed no response to
area is estimated to be between 25,832 and 58,220 events this size or smaller. Precipitation from these
ft3/d (0.30 to 0.67 cfs). For modeling purposes, an ini- small events is likely confined to vadose zone storage
tial, uniform K was applied across the model domain. or consumed by evapotranspiration prior to reaching
This initial K was then adjusted during automated cali- groundwater. Half of precipitation between 0.2 and 0.5
bration. A K of 100 ft/d was used for model initializa- in was estimated to contribute to recharge, since some
tion. This is consistent with calculated K values for the wells responded to rainfall events in this range while
MVA (table 1) and literature values for a sandy aquifer others did not. Water levels in all wells responded to
composed of glacial outwash (Fetter, 2010). Using an rain events over 0.5 in, which indicates that all events
initial K = 100 ft/d results in a flow of 38,556 ft3/d (0.4 of this size contribute to recharge. The simplifying
cfs) across this boundary. assumption is made that all precipitation above 0.5 in
was considered recharge.
Recharge (R)
For rain amounts between 0.2 and 0.5 in, non-zero
Recharge estimates applied a simple mathematic recharge estimates using this method fall within 5%
treatment to meteorological data based on how water and 30%, consistent with typical percentages found
levels in instrumented wells responded to snowmelt in literature (Healy, 2010). This suggests that for at
16You can also read


