Antipodes Island grey petrels: assess and develop population estimate methodology - DOC
←
→
Page content transcription
If your browser does not render page correctly, please read the page content below
Grey petrel population size                                                  Rexer-Huber and Parker 2021

                              Antipodes Island grey petrels:
                   assess and develop population estimate methodology

                              Kalinka Rexer-Huber and Graham Parker
                                           January 2021

  Department of Conservation, Conservation Services Programme project POP2020-04: grey petrel population
                                 estimate methodology, Antipodes Island

                                                                                               Photo Keith Jacobs

                                                                                                           1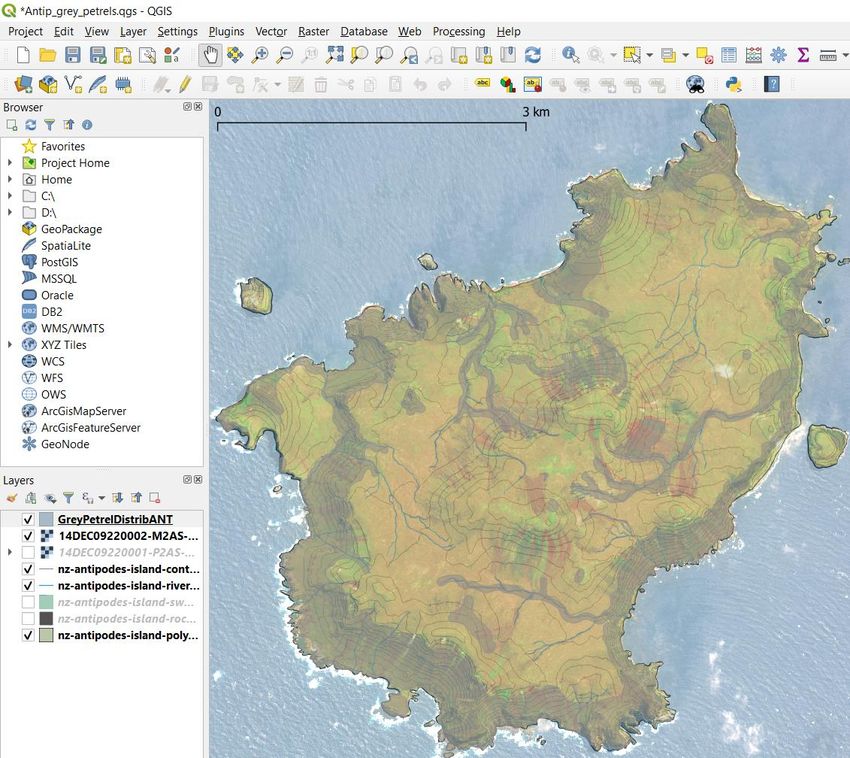
Grey petrel population size                                             Rexer-Huber and Parker 2021

Antipodes Island grey petrels: assess and develop population estimate methodology

Final report to Department of Conservation, Conservation Services Programme for project CSP2020-
04: grey petrel population estimate methodology, Antipodes Island

January 2021

Kalinka Rexer-Huber* and Graham C. Parker

Parker Conservation, 126 Maryhill Terrace, Dunedin, New Zealand

Corresponding author: k.rexer-huber@parkerconservation.co.nz

Please cite as:
Rexer-Huber, K.; Parker, G.C. 2021. Antipodes Island grey petrels: assess and develop population
estimate methodology. Final report to the Conservation Services Programme, Department of
Conservation. Dunedin, Parker Conservation. 34 p.

                                                                                                   2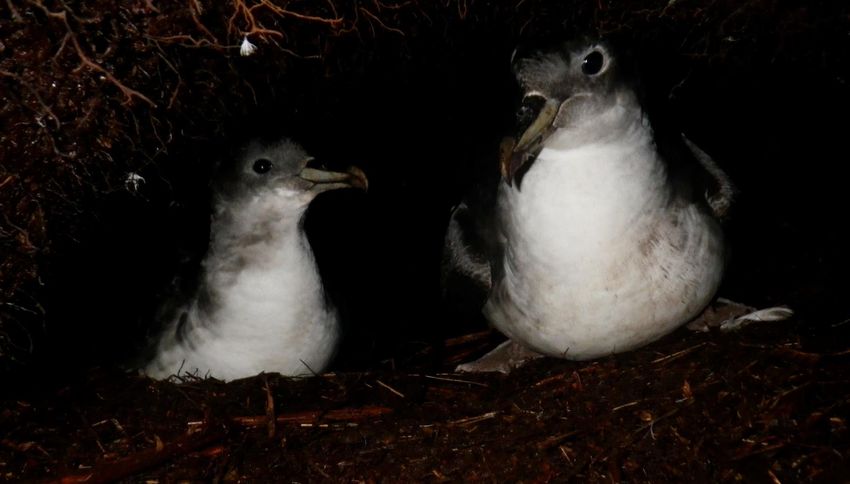
Grey petrel population size                                                Rexer-Huber and Parker 2021

Summary

Antipodes Island is thought to have by far the largest population globally of grey petrels Procellaria
cinerea, but the trend in population size over time remains unknown. This work focuses on planning
an updated estimate of population size and trend. We collate and assess resources from previous work,
using these to develop recommendations for field work that will yield a robust population estimate.

Our focus here is the methods and findings of grey petrel studies on Antipodes in the early and late
2000s: the feasibility study in 2001 (Bell 2002) and population research in 2009–10 (Thompson
2019). A valuable record of observations underpinned those studies, so key observations on grey
petrel behaviour and occurrence over trips since 1969 were extracted from the notebooks of
researchers on those visits by Bell and Burgin (Appendix A).

We first collated resources, then compared and contrasted methods and findings from previous work
(section Assess existing information). Requirements for a robust, repeatable population size estimate
and best-practise approaches are discussed in Design a robust population estimate. Taken together,
previous work and requirements inform a range of options for population size estimation, with key
pros and cons noted for each field strategy (Ranked methodologies).

Balancing effort, flexibility and precision of the population size estimate, the recommended field
strategy is spatial coverage distance sampling. This approach uses distance sampling following a
simple-random design that maximises spatial coverage. Several other good options suggest variations
but with key things in common: timing (occupancy sampling should occur in second half April),
accounting for habitat lost to landslips, and using true surface areas of grey petrel habitat in
calculations. With broad sampling across the grey petrel range, an accurate, robust, repeatable
population size estimate can be produced.

                                                                                                        3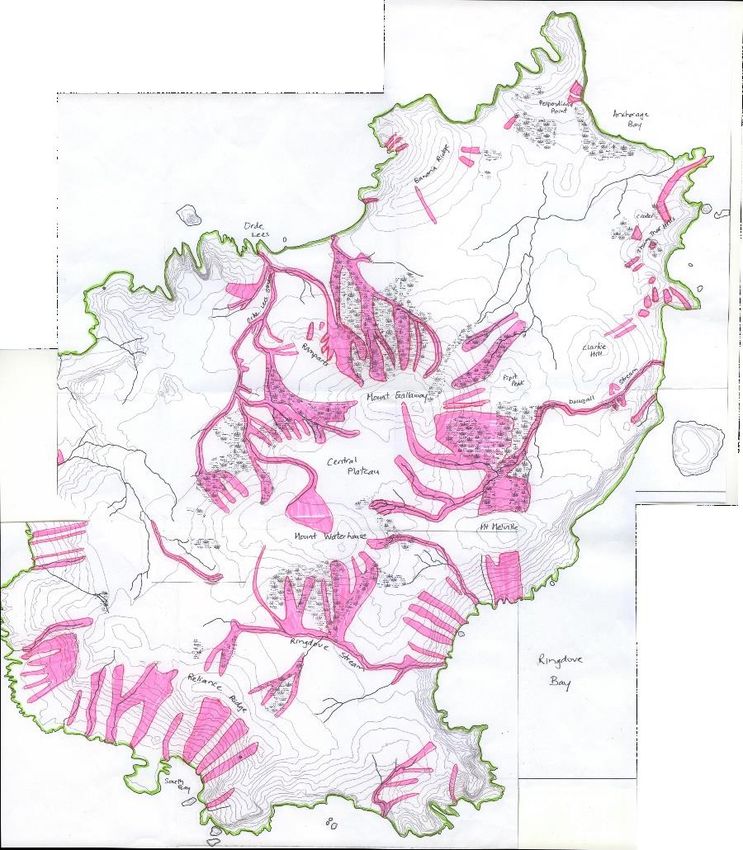
Grey petrel population size                                                                                      Rexer-Huber and Parker 2021

Contents
Summary ................................................................................................................................................. 3
Introduction ............................................................................................................................................. 5
Methods .................................................................................................................................................. 6
Assess existing information .................................................................................................................... 7
   Logistics and focus ............................................................................................................................. 7
   Survey for distribution ........................................................................................................................ 7
   Burrow density .................................................................................................................................... 9
   Burrow occupancy ............................................................................................................................ 10
   Timing relative to breeding ............................................................................................................... 12
Design a robust population estimate ..................................................................................................... 13
   Population size study or trend study? ............................................................................................... 13
   Sampling burrow density .................................................................................................................. 14
        Randomisation and replication...................................................................................................... 14
        Sampling unit size, type ................................................................................................................ 14
        Precision........................................................................................................................................ 14
        Burrow count accuracy ................................................................................................................. 15
        Area accuracy................................................................................................................................ 15
        Habitat availability ........................................................................................................................ 15
   Sampling burrow occupancy............................................................................................................. 16
        Methods......................................................................................................................................... 16
        Separating density and occupancy samples .................................................................................. 16
        Accuracy ....................................................................................................................................... 16
        Revisit permanent plots................................................................................................................. 18
Ranked methodologies .......................................................................................................................... 18
   A.      Spatial coverage, distance sampling ......................................................................................... 18
   B.      Spatial coverage ........................................................................................................................ 19
   C.      Systematic whole-island distance sampling .............................................................................. 19
   D.      Population size estimate AND trend ......................................................................................... 20
   E.      Trend assessment alone............................................................................................................. 20
Population estimate recommendations.................................................................................................. 20
Acknowledgements ............................................................................................................................... 21
References ............................................................................................................................................. 22
Appendix A: Bell & Burgin 2020. Historical data review for grey petrels on Antipodes Island ......... 24
Appendix B: GIS-based mapping resources to inform planning of grey petrel survey ........................ 33

                                                                                                                                                          4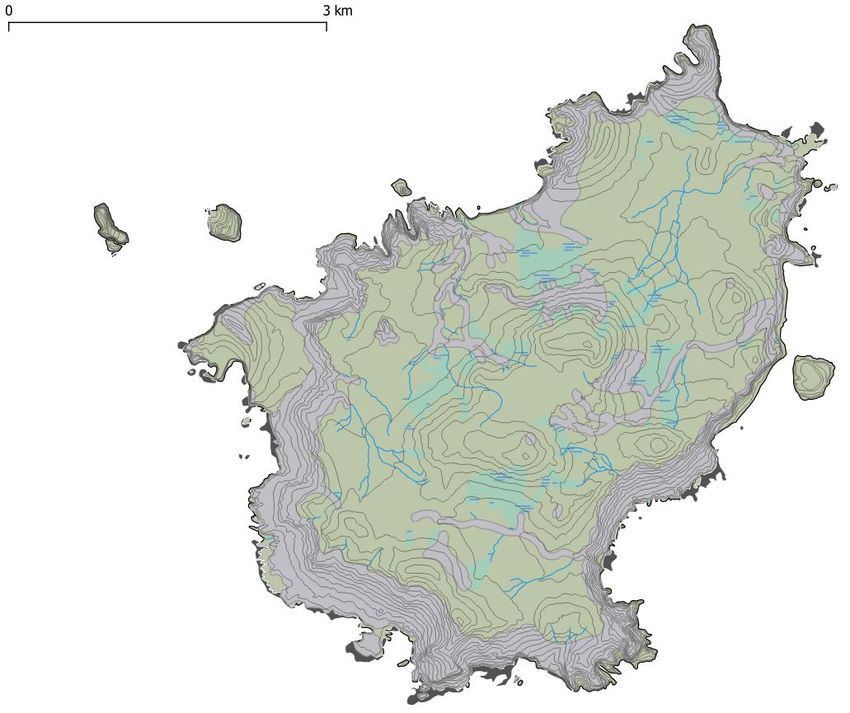
Grey petrel population size                                                Rexer-Huber and Parker 2021

Introduction
New Zealand’s subantarctic Antipodes Island is a key site for grey petrels Procellaria cinerea. The
Antipodes population is thought to be by far the largest population globally of grey petrels (BirdLife
2020). However, the trend in population size over time remains essentially unknown.

Observations from visits since 1969 were the main source of information on grey petrels until the
early 2000s. The 1969 University of Canterbury expedition to the Antipodes was too early in the year
for grey petrels, as they are winter-breeding and the expedition was at the island 28 January to 12
March 1969 (Warham & Bell 1979). The team were present for grey petrels’ pre-lay return to island,
and recorded useful notes on where grey petrels were seen landing (“Many were seen to alight on the
slopes above Ringdove, Stack and Crater Bays, but we also found several nests on flat ground behind
Reef Point only some 20 m a.s.1”). In 1978 the BAAS expedition was on the Antipodes 20 November
to 6 December, too late for grey petrels as just some grey petrel fledglings remained (Imber 1983).
Trips in 1994 and 1995 also took place in the October to December period, focusing mainly on
summer-breeding species. Key notes and observations from the 1969, 1978, 1994 and 1995
expeditions, extracted from the notebooks of Brian Bell and Mike Imber, are summarised in appendix
here (Appendix A: Bell & Burgin 2020).

Although several sources refer to a grey petrel population size of 10–50,000 pairs (Robertson & Bell
1984; O’Brien 1990; Taylor 2000; Bell 2002), there had been no seabird work during autumn/winter
when grey petrels are present at the Antipodes. The figure appears to be based on observations from
1969 and 1978 trips, and was described by Brian Bell as “...an educated guess following thorough
ground surveys by experienced ornithologists during the 1969 and 1978 expeditions to the Antipodes”
(Bell et al. 2013).

In 2000, Graeme Taylor identified possible sites for the population monitoring needed at the
Antipodes, suggested potential methods (“Burrow density should be determined in quadrats or active
burrows should be counted in a defined area”), and proposed that counts be repeated every 10 years
to determine trends (Taylor 2000). Obtaining a population size estimate requires survey to determine
the distribution and extent of the target species, a census or estimate of burrow numbers, and an
assessment of burrow occupancy (what proportion of burrows contains a breeding pair) (Workshop
2006; Parker & Rexer-Huber 2015). A pilot study is ideally conducted first to test methods and ensure
good data can be acquired with the planned method.

The first study focused on the grey petrel population was a feasibility study undertaken for DOC CSP
in 2001 (Bell 2002). Grey petrel population research in 2009 and 2010 was conducted for the then
Ministry of Fisheries (Thompson 2019), with work to inform population size part of a broader remit.
Journal articles and reports summarise much of the methods, data obtained and results from previous
work, but some remain available only as raw data.

Here we focus on planning an updated estimate of population size and trend, building on the existing
knowledge base. This work has three phases: collate, assess, and develop recommendations. We first
collate all previous work, including any unpublished data available. Our focus here is on work in the
early and late 2000s that yielded data on grey petrel populations. These data, summaries and
publications are then assessed, comparing and contrasting methods and findings. Finally,
recommendations on a population survey method suitable for obtaining a robust population estimate
and assessing population trend are developed. Recommendations are based on findings from previous
surveys and informed by the broader literature on grey petrels and burrowing petrel survey methods.

                                                                                                         5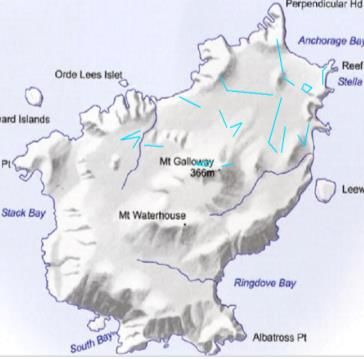
Grey petrel population size Rexer-Huber and Parker 2021
Methods
Reports, publications and primary data are collated from the feasibility work in 2001 and from the
most recent research 2009–2010 (Table 1). We contacted key personnel involved in those studies to
ensure our collated data pool was as complete as possible, and for clarification where questions arose
about field methods and findings.
Resources relevant to grey petrel population size assessment were also obtained, including a
workshop report discussing burrowing petrel work rationale (Workshop 2006), reports and data on
Antipodes white-chinned petrel work (e.g., Sagar & Thompson 2008; Sommer et al. 2011; NIWA
unpubl. data 2007–11), a digital elevation model for the Antipodes (DOC GIS unpubl. data 2015),
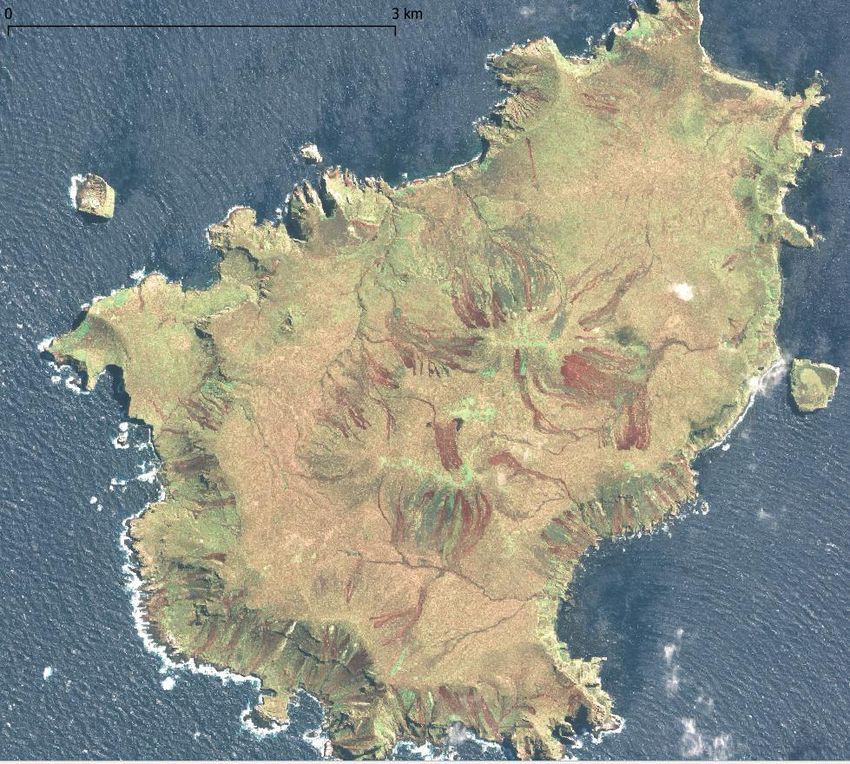
GIS data layers for the Antipodes from LINZ Data Service, and the extent of landslips around the
island (K. Walker and G. Elliott unpubl. data 2014; DigitalGlobe Inc).
A parallel project by Biz Bell and Dan Burgin extracted grey petrel observations from notebooks and
logbooks (Appendix A: Bell & Burgin). Historical grey petrel records from the notebooks of Brian
Bell and Mike Imber are complemented by unpublished notes from the 2001 project notebooks and
logbook.
Table 1. Primary resources: Antipodes grey petrel population size work
Resource Description Type
2001 Bell 2002 Primary grey petrel feasibility study report Final report to DOC
Imber et al. 2005 Some information from the feasibility study Journal article Notornis
Bell et al. 2013 Feasibility report condensed for wider readership Journal article Notornis
WMIL unpubl. data 2001 Raw data from 2001 feasibility study in .xls Raw data in .xls
WMIL unpubl. data 2013 GIS datafile of grey petrel distribution .kml file
Bell & Burgin 2020 Notes from feasibility study logbook, notebooks Report with notebook extracts
2009/10 Sommer et al. 2009 Summary report on first season’s grey petrel work Progress report to MFish
Sommer et al. 2010 Summary report on second season Progress report to MFish
Thompson 2019 Final report with summarised grey petrel findings Final report to MPI
NIWA unpubl. data 2009, 2010 Raw data for population estimate work in .xls, Raw data in xls, notebooks,
notebooks and hand-drawn maps maps
Other K. Walker & G. Elliott unpubl. Hand-drawn map of slips in Jan 2014, composite Map, composite satellite
data 2014 of satellite images showing slips’ extent (imagery image
from DigitalGlobe)
Existing grey petrel population size work was then assessed, scrutinising existing data and methods
for comparability and repeatability. We distinguish comparability (i.e. are methods underpinning
population size estimates comparable) from repeatability, which considers how suitable methods are
for long-term trend assessment (Parker & Rexer-Huber 2015).
The assessment is structured so that each aspect of a population size estimate is considered
individually to compare the methods and the data obtained from those methods. For example, for
burrow density we compare sampling method, extent and randomisation between studies, considering
the implications for the data quantity and data quality obtained.
This evaluation is the basis of recommendations for field work to provide an updated estimate of
population size, designed to enable assessment of population trend. Field work recommendations
consider data on loss of grey petrel habitat due to landslips since grey petrels were last surveyed, to
ensure field surveys provide comparable data. Since population change could be masked if an
estimate has poor precision, suggested field methods are discussed in light of potential error sources,
as mitigating these error sources can improve estimate precision (Parker & Rexer-Huber 2015).
6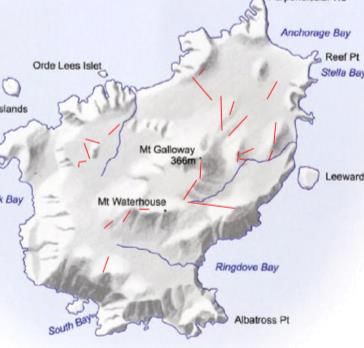
Grey petrel population size                                                 Rexer-Huber and Parker 2021

Assess existing information
Logistics and focus
The 2001 feasibility study was on Antipodes island 24 April–6 June, with a team of seven people
(Bell 2002). The primary focus was investigating the feasibility of a long-term study monitoring
breeding success and population biology, and trialling a range of methods for population size
assessment.
In 2009 and 2010, work on grey petrels took place throughout March until 20 April 2009 (grey petrel
component of a longer trip), and 19 March–30 April 2010 with three-person teams. Population
research focused primarily on adult survival via mark-recapture and tracking, but also collected data
toward estimating population size.
Since the 2001 work was a feasibility study, and the 2009/10 work was focused on demographic study
and tracking, neither study was set up to devote the time to acquiring all the data needed for a robust
population size estimate. However, the work toward population size assessment that was possible
provided a great deal of useful data to inform planning of a robust, repeatable population size
estimate.

Survey for distribution
To identify the distribution of grey petrels around Antipodes, the feasibility study surveyed widely.
Survey effort included transects as well as arrival/departure counts from high points. Transects were
walked throughout the island in all habitats (Fig. 1A, top left, from Bell 2002). Imber et al. (2005)
added that 110 transects of 1000m were walked, searching a 1m-wide strip, and Bell et al. (2013)
mapped 10 sites for arrival counts. Only about half of transects encountered grey petrels (WMIL
unpubl. data 2001) (Fig. 1A), so the grey petrel distribution map was also informed by observations
from earlier trips, grey petrel skulls in skua middens (Appendix A: Bell & Burgin), landing sites
observed during arrival counts, calls from burrows (Bell et al. 2013), and grey petrel-type habitat
identified using aerial photographs and topographic maps (E. Bell pers. comm. 2020). Grey petrel
habitat identified covered 510 ha (grey shading in Fig. 1A, from Bell 2002). Grey petrels were also
found on Bollons Island in a “very exclusive and dense colony” in 1978 (Appendix A Bell & Burgin).
Grey petrels mostly used steep well-draining areas on coastal cliffs, along steep stream banks and
high knobs along ridges. Grey petrels were typically found in dry vegetation areas dominated by Poa
litorosa, areas of mixed Poa and Polystichum vestitum fern, and occasionally Coprosma rugosa.

The 2009/10 grey petrel study used the grey petrel distribution identified in the feasibility work. Grey
petrel work focussed on known grey petrel areas (Fig. 1B, C from Sommer et al. 2009, 2010), and
density estimates were extrapolated to the 510 ha of grey petrel habitat. This seems reasonable since a
longer-running project conducted by the same team 2007–11 conducted intensive survey effort for
white-chinned petrels using randomised plots and transects across the rest of the island (i.e., areas not
identified as grey petrel habitat) (Sagar & Thompson 2008; Sommer et al. 2008, 2009, 2010, 2011)
(Table 2, Fig. 1 column at right). That work did not detect grey petrels in unexpected places (E.
Sommer pers. comm. 2020), suggesting that the distribution remained essentially unchanged and no
grey petrel areas missed in the initial work.
Grey petrel habitat appears to have only limited overlap with white-chinned petrel habitat. The two
species overlap along some cliff-top edges (Bell 2002), at the top of Stella Bay (Imber et al. 2005),
and at Banana Ridge in the white-chinned petrel study area (Sagar & Thompson 2008; Sommer et al.
2009). Grey and white-chinned petrel burrows are readily distinguished (e.g., Bell 2002), and if there
is uncertainty, burrow contents checks can quickly resolve the question since white-chinned petrels
are rearing chicks during the grey petrel incubation period.

                                                                                                         7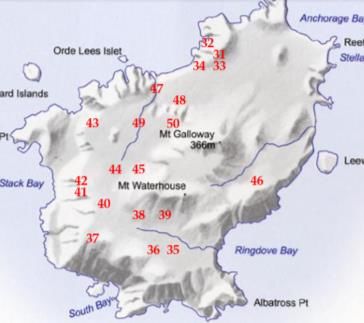
Grey petrel population size                                                     Rexer-Huber and Parker 2021

                                               Grey petrel surveys               White-chinned petrel surveys
Figure 1. Spatial coverage of
                                                                            A
sampling for grey petrels (left)
and white-chinned petrels (right).

                                     2001
                                     2007–08

                                                                         B
                                     2008–09

                                                                        C
                                     2009–10
                                     2010–11

                                     Inset figures from Bell 2002; Sommer et al. 2008, 2009, 2010, 2011.

                                                                                                                8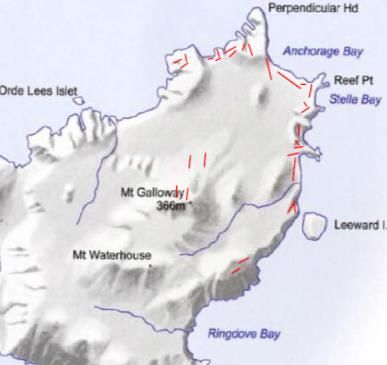
Grey petrel population size                                                   Rexer-Huber and Parker 2021

Burrow density
The feasibility study determined burrow density in four 50x50m census grids, and extrapolated the
density of active burrows (in pairs/ha) to the area of the grey petrel distribution. Grids were sited in
known grey petrel habitat (small squares in Fig. 1A), selected to cover different aspect, and the
position randomised via a random bearing off the primary pole for the first grid side (Bell 2002). Each
grid took a day to set up and two days to check thoroughly. However, as Bell et al. (2013) pointed
out, the four grids used for density (and occupancy) estimates in 2001 do not sample enough of the
variability in grey petrel habitat to be confident in the accuracy of the estimate (Fig. 1).

Grey petrel work set up in the late 2000s did not repeat the 2001 census grids since the focus of that
work was marking and monitoring study burrows for mark-recapture, not estimating burrow density.
Since most burrows in the grids were too long to access birds for mark-recapture (Bell 2002; Sommer
et al. 2009), study burrows were sited elsewhere. Grey petrel habitat was sampled via transects 2 m
wide, with every grey petrel-type burrow checked for occupants. In 2009, 16 transects were
completed in the final days of the trip, largely at the northern end of the island (Fig. 1B), but transects
in 2010 covered more of the grey petrel distribution (38 transects over 13 days) (Fig. 1C) (Sommer et
al. 2009; Sommer et al. 2010; NIWA unpubl. data 2009, 2010). Burrow density can be calculated
from these occupancy transects, and sampling was more widespread and representative than in 2001.

Comparing density estimates from the three years of existing data shows substantial variability: 104
pairs/ha in 2001; 172–175 active burrows/ha in 2009; and 96 pairs/ha in 2010 (Bell 2002; NIWA
unpubl. data 2009; Sommer et al. 2010). The variability could be an artefact of data limitations. The
sample was likely too small in 2001, as discussed above. Density calculations from 2009/10 data are
inaccurate to an unknown extent because transect lengths were calculated from start- and end-
waypoints, and GPS waypoints are of variable accuracy in the steeper terrain favoured by grey petrels
(NIWA unpubl. data 2010). Even when positions of poor horizontal accuracy were flagged for
exclusion (Sommer et al. 2010; NIWA unpubl. data 2010), some calculated transect distances are
surprising (Table 2). Given the importance of accurate density estimates in a population size estimate,
we suggest on-the-ground measurement of sampling unit area (transect length, plot diameter, quadrate
sides) is needed.

In steep terrain planar or map areas are smaller than ground measures of surface area, since planar
area does not account for slope. Since it is the surface area that animals use, a density estimate
extrapolated to planar area of habitat will underestimate animal numbers (Parker & Rexer-Huber
2015). To date a mix of planar and surface areas have been used for petrel work on Antipodes (Table
3). In the feasibility study density was calculated using surface area (grids measured on the ground),
but density was extrapolated to planar area of habitat (estimated in GIS) (Bell 2002). Sommer et al.
(2009, 2010) calculated density based on planar area (estimated from GPS), then also extrapolated to
planar area. The most accurate population size estimate will be surface area density sampling, from
accurate measures on the ground, extrapolated to the surface area of grey petrel habitat. The
planar/map area can be slope-corrected using a digital elevation model (DEM) (e.g., Barbraud et al.
2020), or by sampling slope measurements across grey petrel habitat (Barbraud et al. 2009; Rexer-
Huber et al. 2020). A DEM is available for the Antipodes at 10m resolution (DOC GIS unpubl. data
2015).

To obtain a sounder population size estimate, Bell et al. (2013) suggested using more grids, line-
transect surveys or distance sampling. Increasing the number of randomised grids or transects across
the island is attainable with reasonable effort (Table 2; Fig. 1). For example, transects through the
island’s northern grey petrel habitat took 13 days in 2010 (36 transects; Fig. 1C) (Sommer et al.
2010), but small 10x10m sampling quadrates over most of the island took 4.5–9 days for white-
chinned petrels (20–30 quadrates) (Table 2, Fig. 1 column at right) (Sommer et al. 2008; NIWA
unpubl. data 2007). As many 36 transects were covered in just 1.5d, given short transects and little
travel time between transects (Sommer et al. 2008). Accounting for weather days and the need for a
suitable weather window for trips to more distant sampling locations, we note that 13d of transects

                                                                                                          9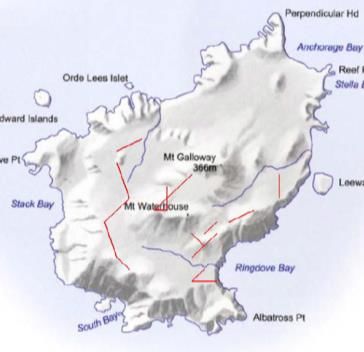
Grey petrel population size                                                                Rexer-Huber and Parker 2021

required a 20-d period, and 4.5d of quadrates required a 10-d period (NIWA unpubl. data 2008, 2010).
Across all the sampling effort data available for large burrowers at the Antipodes, it seems that work
days should be scaled by 1.5 to 2 times (season with most grey petrel effort, and average over all
WCP and grey petrel seasons, respectively). That is, sampling effort requiring for example 10
working days should allow for a 15 to 20-day window.

Table 2. Sampling effort for grey petrels and white-chinned petrels on Antipodes
                    N     type        Effort days    Area/length                             Focus                 Source
2001        greys   4     quadrates   12 d           50x50m grid     measured                Density, occupancy         [1]
2006–07     wcp     30    quadrates   9d             10x10m grid     measured                Density                    [2]
2007–08     wcp     20    quadrates   4.5 d          10x10m grid     measured                Density                    [3]
            wcp     36    transects   1.5 d          50m             measured                Occupancy                  [3]
2008–09     wcp     29    transects   10 d           62–955m         calculated from wpt     Occupancy                  [4]
            greys   16    transects   4d             17–130m         calculated from wpt     Occupancy                  [4]
2009–10     wcp     20    transects   6d             152–1112m       calculated from wpt     Occupancy                  [5]
            greys   38    transects   13 d           25–253m         calculated from wpt     Occupancy                  [5]
2010–11     wcp     31    transects   5d             43–875 m        calculated from wpt     Occupancy                  [6]

Sources: 1 (Bell 2002); 2 (NIWA unpubl. data 2007); 3 (Sommer et al. 2008; NIWA unpubl. data 2008); 4 (Sommer et al. 2009;
NIWA unpubl. data 2009); 5 (Sommer et al. 2010; NIWA unpubl. data 2010); 6 (Sommer et al. 2011; NIWA unpubl. data 2011)

For trend assessment, a new population size estimate should be compared with the most accurate
figures available from existing data. We suggest the following two corrections should be applied if
population size figures are to be compared:
    • More accurate transect lengths could potentially be extracted from the raw data (NIWA
         unpubl. data 2009, 2010). Currently, transect length is the straight line distance from start- to
         end-waypoint (Sommer et al. 2010; Thompson 2019), but data sheets also contain waypoints
         for all burrows found along a transect. Plotting transect length via burrow positions may
         refine the length estimate, as suggested by Sommer et al. (2009), or it may simply compound
         the GPS error. Some transects highlighted as having poor GPS quality also need to be
         checked to ensure those data are excluded.
    • More accurate breeding pair numbers could be calculated if the 2001 and 2009/10 density
         estimates are extrapolated to the surface area of grey petrel habitat, using the available DEM
         (DOC GIS unpubl. data 2015), rather than the planar or map area used for calculations to date
         (Bell 2002; Sommer et al. 2010).

Burrow occupancy
In the feasibility study, all census grid burrows were checked using a mix of methods (visual, bird
removal, playback, scope). Burrows were mostly straight so a bird present could often be seen, but
only a quarter had a nest that could be reached by hand (Bell 2002). Burrow contents were also
checked along two randomly placed 300m transects, with the added observation that activity sign
were not useful because “unoccupied burrows nearly all showed signs of occupancy; typically
moulted contour and coverts feathers of grey petrels, freshly added nest material and often fleas”
(Imber et al. 2005).

In 2009 and 2010, all grey petrel-type burrows were checked for an occupant, by hand or with a
burrowscope, along occupancy transects throughout grey petrel habitat (Sommer et al. 2009; Sommer
et al. 2010). Any burrow whose end could not be reached with the burrowscope was excluded from
occupancy calculation. Good occupancy data were also obtained from study burrows, with 257 grey
petrel-sized burrows marked and monitored in 2009. Study burrows used for breeding in 2009 were
again monitored in 2010. Occupancy can also consider the probability that some of the empty grey
petrel-sized burrows belong to other species (white-headed petrel in particular) and apply a correction,
as done in Thompson (2019). However, Table 4 shows the simple occupancy figure (n breeding pairs/
n grey petrel-type burrows checked) for direct comparison with Bell (2002).

                                                                                                                        10
Grey petrel population size Rexer-Huber and Parker 2021
Table 3. Grey petrel population size work on Antipodes, comparing 2001, 2009/10 and potential next steps
2001 2009/10 Next
Field team size 7 3
Timing On island 24 April–6 June Grey petrels ~1 Mar–20 Apr and 19 Mar–30 Apr; - Occupancy work from 2nd week April
Occupancy work 9–21 May Occupancy transects from 15–20 Apr and 9–30 Apr - Can be preceded or followed by density work (less
timing-sensitive)
Distribution Grey petrel distribution thoroughly defined from Used 2001 grey area, plus noted areas with grey- Use 2001 grey petrel distribution area (Appendix B)
field effort, maps and photos WCP overlap
Density From 4 grids. Sites selected, exact placement Not explicitly sampled but can derive from - Transects (comparable method)
randomised occupancy transects. Transects randomised - Comprehensive sampling through whole grey petrel
range (more representative)
Density sampling 4 grids not representative coverage of greys Coverage OK (if deriving from occupancy transects), - Need coverage right around greys range
coverage habitat but little sampling in southern half - Randomise sampling positions in greys area in GIS
Stratification Data on vegetation, slope and aspect collected Data on variables like veg, slope and aspect Collect data on veg, slope, aspect in case needed for post-
but not used collected but not used stratification
Area surface or Density based on surface area (measured grid) Density based on planar (estimated from GPS), - Use surface area for density sampling (accurate ground
planar extrapolated to planar (GIS) extrapolated to planar measure), extrapolate to surface area using DEM.
- Extrapolate 2001 and 2010 density estimates to surface
area for comparison.
Burrow detectability Systematic searches. No mention detectability Not mentioned Consider distance sampling to explicitly account for detection.
check If not, conduct double-counts
Occupancy From grids using range of methods. Timing bit From study burrows and transects (2009) and - Occupancy by burrowscope in representative sites
late cf. peak lay. transects (2010). Mostly used burrowscope. Timing - Consider including 2001 grids and/or 2009/10 study
cf. lay about right although a bit early in 2010. burrow areas for comparison
Occupant detection Not discussed Excludes not inspected in full Consider testing occupant detection probability
Availability: areas Extrapolated just to grey petrel habitat (as Extrapolated just to grey petrel habitat. Lack of Get coverage right around island, then consider if areas not
not sampled sampled in plots). Named some areas too steep coverage to south not discussed but may not be accessed were represented in existing sampling
to access, but limited sampling so important
representativeness unknown.
Availability: slips - Digitise slipped area in GIS
- Survey slips to identify areas of habitat lost (i.e. scoured
to rock)
- Subtract surface area of habitat lost for new estimate of
grey petrel habitat area
Observer bias Not mentioned Not mentioned Test, multiple counts. Standard measures. Field team working
together initially until metrics consistent.
11Grey petrel population size Rexer-Huber and Parker 2021
Occupancy data from both studies seem robust, with good numbers of burrows checked and wide
sampling across areas (Table 3, 4). Burrow occupancy was 47% in 2001, and it is not clear why this is
substantially higher than in the late 2000s (22.5–32.3%) (Table 4). The methods and sampling seemed
similarly thorough and comprehensive, and both studies excluded non-breeding occupants. Grey
petrel burrow occupancy was substantially higher on Campbell Island (63%) even though the colonies
are very small and burrow checks were late in the season (large chick stage, 13 July–6 August)
(Parker et al. 2017).
Neither study tested for occupant detection, or the probability of missing a bird present (Parker &
Rexer-Huber 2015) (Table 3). In theory, this is redundant if observers only record a bird present in the
burrow if they are certain that the burrow has been inspected in full, and exclude burrows where
contents are not certain. However, grey petrel burrows are long, with as little as a quarter reachable by
hand (Bell 2002), call playback requires a response rate test (e.g., Barbraud et al. 2009), and
burrowscope inspection can miss birds in long burrows or around corners. Occupant detection rates
could potentially be extracted from the repeat-visit data at study burrows (Sommer et al. 2009).
Table 4. Occupancy by breeding grey petrels of grey petrel-sized burrows
Occupancy N grey-sized Sampling coverage Timing
burrows checked
2001 47.1% 221 4 census grids mid–late incubation (9–21 May)
2009 26.8% 257 study burrows 2 areas during lay (Mar–mid-Apr)
28.6% 105 16 transects just after lay (last half Apr)
2010 32.3% 133 study burrows during and after lay (21 Mar–28 Apr)
22.5% 360 38 transects egg laying near end but not yet
complete (9–30 Apr)
Timing relative to breeding
Timing surveys as close to the main lay period as possible can reduce the number of assumptions and
corrections required (Parker & Rexer-Huber 2015). Burrow occupancy, in particular, is sensitive to
the timing relative to egg lay, with the number of pairs underestimated if occupancy sampling is too
early (e.g., 8.5% occupancy at the start of grey petrel laying) (Barbraud et al. 2009). Sampling should
preferably be conducted once most eggs have been laid, before there has yet been much chance for
breeding failure, to avoid the need for failure-rate correction of the breeding pair estimate.
In the 2001 feasibility study, occupancy data were collected 9–21 May (Table 3). The 2009 and 2010
seasons involved occupancy work from 15–20 April and 9–30 April, respectively.
Grey petrels start returning to the island 1–9 February but are back en masse from mid- to late
February (Warham & Bell 1979; Sommer et al. 2009; Appendix A: Bell & Burgin). Data from
monitored study burrows recorded egg lay 21 March–9 April (Sommer et al. 2009), in line with the 20
March–8 April recorded on Kerguelen (Zotier 1990). Although egg lay is known to start before and
continue after those dates (Imber 1983; Bell 2002; Appendix A: Bell & Burgin), the peak of egg
laying occurred around the beginning of April, and 5 April was already past the egg-laying peak
(Sommer et al. 2009). Data from Antipodes on hatching corroborate these lay dates. Bell (2002)
showed peak hatch was 25 May–1 June and “even proportions of eggs and chicks around 31 May,
indicating that hatching peaked then” (Imber et al. 2005). In notebooks, the implications for lay dates
were considered: “suggests now [30 May] that we are at peak of hatching and therefore laying peaks
around 1st April” and “seems that there is a pronounced peak of laying around 25 March to 5 April”
(Appendix A: Bell & Burgin). Peak lay calculated back from the observed hatching dates (25 March–
5 April) thus aligns with the 2009 lay data (21 March–9 April) (Sommer et al. 2009).
Ideal timing for occupancy work would therefore be in the second half April, once lay is largely
complete, to estimate the proportion of burrows containing breeding pairs. Taylor (2000) pointed out
that surveys to map burrow locations and assess numbers could be undertaken earlier, in February to
March.
12Grey petrel population size Rexer-Huber and Parker 2021
The 2001 feasibility study collected occupancy data a bit late relative to peak lay. Burrow contents
were checked 9–21 May, which corresponds to late incubation: some early breeders already had
chicks hatching 6 May while the peak of hatching started 25 May (Bell 2002). Burrow checks will not
have accounted those pairs that had failed early, so breeding numbers will have been underestimated
in the feasibility study (to unknown extent since failure rate data are not available). Occupancy work
from 15–20 April 2009 and 9–30 April 2010 was timed well relative to peak lay, with the majority of
eggs laid by 9 April (Sommer et al. 2009). At Kerguelen, work showed that grey petrel surveys
March–April were too early, recording only 8.5% occupancy (Barbraud et al. 2009).
Design a robust population estimate
In light of findings from existing field surveys for grey petrels on Antipodes, this section proposes
several options for field methods to provide an updated estimate of population size. We discuss the
advantages and disadvantages of these options, informed by the broader literature on burrowing petrel
population size estimation.
Population size study or trend study?
Obtaining a population size estimate requires
a) an initial pilot study to ensure good data can be acquired with the planned method;
b) survey to determine the distribution and extent of the target species;
c) an estimate of burrow numbers that is accurate via sampling that is representative; and
d) an accurate estimate of burrow occupancy from the end-of-lay stage.
In contrast, population trend study design can be simpler, involving as little as burrow numbers and
occupancy (c, d) monitored over time in a sub-sample of permanent repeatedly-visited plots (as
recommended in Workshop 2006). For trend monitoring, we can leave off the initial steps of a pilot
data-quality study and survey of distribution because these have already been determined in a
preceding population size estimate. In other words, a population size estimate provides the confidence
that the subsampled monitored for trends is informative, representative, but manageable (time- and
cost-effective).
We suggest that for grey petrels at Antipodes, a robust population size estimate is needed. The effort
to obtain an accurate, precise, spatially detailed estimate is greater than needed for monitoring a
smaller trend study (Workshop 2006), but is justified being a ‘one-off’ or baseline figure that informs
selection of representative, smaller sample for trend monitoring over time. This is generally
acknowledged in the literature on seabird monitoring, with population size estimates recommended at
~10 yearly intervals while trend monitoring work is conducted annually (e.g., Taylor 2000; Wolfaardt
& Phillips 2011; Moore et al. 2012).
Part of the work toward an updated population size estimate for grey petrels at the Antipodes has
already been done. More than enough information is available from work in the early and late 2000s
to ensure good data can be acquired with a planned method, making a pilot study redundant. Survey to
identify grey petrel distribution on the island does not need to be revisited: surveys to identify
distribution and habitat were conducted thoroughly in 2001 (Bell 2002), building on occurrence
observations from earlier trips (Appendix A: Bell & Burgin). Later work confirmed the distribution
with no sign of range change (grey petrel and white-chinned petrel surveys; Sommer et al. 2008,
2010, 2011). Therefore, work to obtain a robust, accurate population size estimate can focus on broad
representative sampling of burrow numbers across the grey petrel range, with a thorough estimate of
burrow occupancy.
13Grey petrel population size Rexer-Huber and Parker 2021
Sampling burrow density
Grey petrel burrows are widespread in suitable habitat on the Antipodes (Bell 2002; Sommer et al.
2010). It would be implausible to identify every colony and count burrows (Ryan & Ronconi 2011;
Parker et al. 2017), so burrow numbers must be sampled then extrapolated to the grey petrel habitat
available. We discuss what is needed to ensure that a sample of burrow density will be accurate,
precise enough and repeatable.
Randomisation and replication
To get the most accurate and precise density estimates—and thus population size estimates—
sampling design should be tailored to the specifics of species and site (Parker & Rexer-Huber 2015).
In grey petrel habitat, the distribution is more dispersed than densely clustered (E. Bell and E.
Sommer pers. comm. 2020), suggesting a simple randomised sampling design is more suitable than,
for example, targeted or systematic sampling approaches (Dilley et al. 2019).
Random sampling must balance strict randomisation against the need to actually encounter burrows in
a landscape. Random long walking transects largely did not find grey petrels (Bell 2002), but smaller
random transects within the grey petrel habitats encountered burrows (Sommer et al. 2009, 2010).
Large census quadrates limit the number of replicates possible in a given period (Bell 2002) and
wider, more representative sampling was identified as a key requirement for improving existing data
(Bell et al. 2013). Much more replication was possible within feasible timeframes using small,
randomised plots (white-chinned petrels) and transects (grey petrels, white-chinned petrels) within
target species habitats (e.g., Sommer et al. 2008, 2010) (Table 2). More replicates also help deal with
variance in burrow encounter rates, which is expected since we anticipate grey petrel burrows to be
somewhat aggregated, rather than truly random (Rexer-Huber et al. 2017).
We suggest GIS-based randomisation of sampling locations within the grey petrel distribution.
Several relevant data layers are already available; this is discussed in Appendix B. If landslip areas are
incorporated into GIS too, planning can ensure that randomised sampling also has adequate coverage
of slipped and non-slipped habitat (Appendix B).
Sampling unit size, type
Bell (2002) identified transect sampling as problematic in some of the steep terrain occupied by grey
petrels. In very steep or irregular terrain, smaller sampling units may be needed to ensure accurate
data are acquired safely. For example, sampling plots can in some cases be safer than transects in
steep clifftop terrain (e.g., Rexer-Huber et al. 2020). Transects were later used widely 2009–11 on
Antipodes in both white-chinned and grey petrel habitat types (Sommer et al. 2009, 2010, 2011) so
there appears to be no need for small plots. Making transects shorter (but more numerous) may be
more appropriate in the steep terrain used by grey petrels on Antipodes than the fewer, longer
transects sometimes used for grey petrels (Barbraud et al. 2009; Sommer et al. 2010). We suggest
testing transect length onsite to establish a workable length that can still encounter burrows (e.g.,
Rexer-Huber et al. 2017).
Precision
A carefully set up sampling design can increase the precision of a population size estimate (Parker &
Rexer-Huber 2015). Precision can be improved if transects are set up so they all span a known density
gradient (e.g., from high density at island edge to low density inland; systematic sampling; Fewster et
al. 2009). Stratified random estimates can also improve precision if burrows occur in useful pattern
relative to e.g. vegetation and slope, or by geographic area (Barbraud et al. 2009). Pre-identified strata
sometimes have too few burrows to be useful, though, so data that may allow post-stratification
should be collected (Barbraud et al. 2009; Rexer-Huber et al. 2017). Given a known grey petrel
distribution (Bell 2002), we expect the most precise estimate could be obtained by sampling within
the known grey petrel-habitat ‘stratum’ (Rayner et al. 2007; Barbraud et al. 2020), collecting local
habitat data with which to post-stratify if e.g. vegetation type explains burrow distributions at a finer
scale.
14Grey petrel population size Rexer-Huber and Parker 2021
Burrow count accuracy
Burrow count accuracy is affected by burrow detectability, and burrows are much easier to detect in
some vegetation types than others (e.g., Workshop 2006; Dilley et al. 2019). In dense vegetation like
that in grey petrel habitat on Antipodes (Bell 2002; Workshop 2006), burrow count accuracy can be
optimised by using smaller plots, narrower transects, and moving upslope, all of which reduce the risk
of missing a burrow (Parker & Rexer-Huber 2015). Burrow detection rates should be tested, using for
example double-observer counts where the first observer pointing out all burrows seen to a following
observer, who notes anything else detected (e.g., Barbraud et al. 2009).
Ideally, burrow detection probability is included explicitly in the study via distance sampling (Lawton
et al. 2006; Rexer-Huber et al. 2017). Burrow numbers from distance sampling were tested against
exhaustive counts in the same area and showed that distance sampling gave a highly accurate estimate
(Barbraud et al. 2009). For distance sampling to be appropriate, a minimum number of burrows must
be detected (Buckland et al. 2001; Buckland et al. 2004). Grey petrel burrow numbers along transects
(Imber et al. 2005; Sommer et al. 2009; NIWA unpubl. data 2010) comfortably exceeded that
threshold required for distance sampling with as little as 16 short transects, so we are confident that
distance sampling is feasible.
Area accuracy
Whether measuring the distance from transect to burrow for distance sampling, or measuring the
diameter of a sampling plot, measurement error is a known issue. Observers can also vary in their
perception of distance, so physical aids like marked poles, cords or tapes can reduce another source of
inaccuracy. More profound impacts on population size accuracy can occur if transect lengths or plot
diameters are estimated in error. Area and thus density estimates errors compound as they are
extrapolated to whole-island estimates of numbers. Distance measured by GPS proved problematic in
the steep terrain like that favoured by grey petrels, with sometimes poor horizontal accuracy of the
GPS resulting in variably reliable distance measures (Sommer et al. 2009, 2010). On-ground
measures of length/diameter are thus highly recommended.
On-ground measures have the advantage of providing measures of surface area, or the true area
sampled for petrels, rather than the planar or map area. This is valuable because the true surface area
available for petrels is typically larger than the planar area, particularly for species that favour steeper
habitats. Population densities extrapolated to planar map area will be inaccurate, likely
underestimating the true population size. Slope-correction of planar map area to estimate the true
surface area ideally uses a suitable digital elevation model (DEM) (e.g., Barbraud et al. 2020), but
could use repeated slope measurements from density sampling sites (e.g., Rexer-Huber et al. 2017).
As discussed in Appendix B, the DEM available for the Antipodes (DOC GIS unpubl. data 2015)
should be part of the resources used for survey planning and analyses.
Habitat availability
This refers to the proportion of habitat that could not be accessed for sampling. Best-laid field plans
for perfect sampling coverage can be waylaid for all sorts of reasons, most commonly the interface of
weather, logistics and time. Once a sampling dataset is as complete as it can be, availability should be
considered carefully to decide what proportion of habitat could not be accessed for sampling. If
information is available to confirm that grey petrels are present in that area, are there variables that
suggest the unsampled habitat is reasonably represented by sampling elsewhere, in other similar but
available habitat? If not, consider excluding the unavailable area from extrapolations. For example,
Barbraud et al. (2009) only extrapolated density estimates to the area surveyed and areas where grey
petrels are known to breed, rather than extrapolating to a generalised ‘grey petrel habitat’.
Habitat may also become unavailable to grey petrels over time, particularly if habitat is lost due to
landslips. In January 2014, an unusually large number of slips occurred around the island in the
steeper country favoured by grey petrels (Fig. 2). While burrowing petrels can dig new burrows again
15Grey petrel population size Rexer-Huber and Parker 2021
once slip material has settled (Disappointment Isl white-chinned petrels, authors’ unpubl. data), this is
not possible if slips have entirely removed soil to the bedrock or left too little to be burrowed. If soil
depth is measured at slip-sampling locations, the area of burrowable habitat lost to landslips can be
subtracted from the grey petrel habitat available.
The composite of satellite images showing areas that slipped in 2014 should be digitised in GIS using
the map of slips as reference (Fig. 2). These GIS layers would inform planning to ensure that grey
petrel sampling coverage includes slipped areas (Appendix B, Fig. B2), to capture consequences (e.g.,
potentially lower density in recolonised slips) and to determine the area of habitat no longer available
to grey petrels.
Sampling burrow occupancy
Methods
Assessing the contents of burrows is crucial to confirm what proportion of burrows is occupied by a
breeding pair. Burrowscope inspection is preferred so that the breeding status of birds can be seen.
Other methods (looking with a torch, reaching by hand, using a probe to feel for birds, call playback)
can sometimes be faster than a thorough burrowscope inspection, but lack the information on breeding
status. Hand and probe inspection also cannot confirm species present, which is an issue given the
regular presence of white-headed petrels in grey petrel-type burrows (e.g., Sommer et al. 2009).
Separating density and occupancy samples
We suggest that instead of spending time checking every burrow in every density sampling unit (Bell
2002; Sommer et al. 2010), it is better to get high-quality occupancy data from a representative
sample of burrows. Checking every burrow on every transect is slower than when just searching for
and counting burrows, reducing the spatial coverage that can be attained for density sampling. Density
sampling is also less time-sensitive than occupancy sampling, which ideally occurs once egg laying is
largely complete (in the second half of April). Combining occupancy with density sampling would
narrow the time window available for density work, further limiting the spatial coverage possible.
Spatial coverage is crucial for density but less important for occupancy estimation, where the sample
unit of interest is the burrow numbers checked.
By separating occupancy sampling from density sampling, occupancy work could occur at the optimal
time for occupancy, maximising the burrows-checked sample size. Occupancy sites should cover the
broad types of grey petrel habitat already identified in preceding density sampling work. We suggest
sites used for occupancy sampling should include the two study-burrow sites established in 2009/10,
to allow for resighting of any banded birds still present.
Accuracy
Occupancy work to date suggests that the contents of grey petrel-type burrows can be determined with
confidence using a burrowscope (e.g., Sommer et al. 2010), as for other Procellaria petrels that have
large, structurally simple burrows (Waugh et al. 2003; Rexer-Huber et al. 2020). On the Antipodes,
burrows that could not be inspected in full were rare so could reasonably be excluded (NIWA unpubl.
data 2009, 2010). Error in burrow contents, however, could scale up quickly when extrapolated into a
population size assessment, so it is worth considering methods to test the accuracy of burrow content
assignment (Parker & Rexer-Huber 2015). The assumption that occupants are always detected, or
occupant detection probability, is most commonly assessed by resampling methods: two observers
checking the same sub-sample of burrows for occupants (e.g., Whitehead et al. 2014), or via repeated
checks of the same burrows over a time period (Baker et al. 2008; Rayner et al. 2009). Since white-
headed petrels are often found in grey petrel-type burrows (e.g., Sommer et al. 2009), species
identification accuracy could also be assessed via the above resampling approaches.
16Grey petrel population size Rexer-Huber and Parker 2021
Figure 2. Antipodes slips in January 2014 shown in a composite of satellite images (left) and mapped shortly after slips occurred (right). Composite satellite
image by G. Elliott with imagery from DigitalGlobe Inc; map by K. Walker and G. Elliott (unpubl. data 2014)
17Grey petrel population size Rexer-Huber and Parker 2021
For the resulting estimate of the breeding population to be as accurate as possible, it is important that
occupancy work is timed to best reflect the maximum number of breeding pairs; that is, early in the
breeding season, just after laying has finished (Parker & Rexer-Huber 2015). For grey petrels at
Antipodes occupancy work should be conducted the second half of April, once lay is largely complete
(Sommer et al. 2009).
Revisit permanent plots
For a population size estimate, a single accurate estimate of burrow occupancy sampled from
randomised locations across grey petrel habitats is all that is needed. However, where occupancy sites
from previous work can be relocated (Bell 2002; Sommer et al. 2009), new occupancy checks at those
sites could provide some insight into trend (Workshop 2006; Sagar & Thompson 2008). Bell (2002)
calculated occupancy from four census grids and recorded the positions of those grids.
Occupancy sampling by Sommer et al. (2009, 2010) (16–38 randomised locations around grey petrel
habitat) was not set up for repeat monitoring. The grids from 2001 could be revisited to assess trend in
burrow occupancy, although Sommer et al. (2009) noted that since it was difficult to exactly relocate
grids they were not re-used, so there are no data from intermediate time points. Assuming grids could
be relocated exactly, establishing the grids again and checking all burrows could take nine days (Bell
2002). With a population size estimate the primary focus of the planned work, revisiting permanent
plots would have to be in addition to occupancy sampling as described above. This is largely because
of timing: occupancy sampling should take place in the second half of April, to get the best picture of
breeding pair numbers, while census grids should be checked in mid-May to properly replicate the
2001 data (Bell 2002).
Ranked methodologies
A. Spatial coverage, distance sampling
Burrow density estimated by conducting distance sampling to explicitly account for burrow detection
probability. Distance sampling design simple random, for coverage across whole grey petrel habitat to
get best possible replication and spatial detail. Environmental data collected to enable post-
stratification if needed. Burrow occupancy determined by burrowscope at sampling sites in
representative habitats, including the two study-burrow sites established in 2009/10. Density timing
can be March-April, while occupancy best sampled in the second half of April. Breeding population
size would then be calculated using the known 510ha of grey petrel habitat, subtracting area lost to
slips and slope-correcting to the true surface area using DEM.
These methods are expected to refine the accuracy of the resulting population size estimate (directly
accounting for burrow detection probability, and using accurate measured areas rather than calculated
from GPS, applied to the true surface area from DEM at 10m resolution). A resulting estimate would
also be more precise than possible from sampling in 2001, given whole-island sampling and extensive
replication (Bell et al. 2013).
Based on previous work at Antipodes, and our experience sampling difficult terrain elsewhere, we
estimate a fieldwork time budget below:
Table 5. Projected/estimated fieldwork time budget for spatial coverage and distance sampling.
Window is the period or time window required allowing for weather and daylight limitations
window timing
~16 days for two teams (2-pax) for good distance sampling coverage of grey 3 ½–4 weeks March–April
petrel habitat
occupancy sampling over 7 days 1 ½–2 weeks April 15–30
Total field time 6 weeks Mid-Mar to end Apr
18You can also read