The value of information on natural hazards - Unpacking the value of GeoNet
←
→
Page content transcription
If your browser does not render page correctly, please read the page content below
The value of information on
natural hazards
Unpacking the value of GeoNet

NZIER report to EQC
May 2014
About NZIER
NZIER is a specialist consulting firm that uses applied economic research and analysis
to provide a wide range of strategic advice to clients in the public and private sectors,
throughout New Zealand and Australia, and further afield.
NZIER is also known for its long-established Quarterly Survey of Business Opinion and
Quarterly Predictions.
Our aim is to be the premier centre of applied economic research in New Zealand.
We pride ourselves on our reputation for independence and delivering quality
analysis in the right form, and at the right time, for our clients. We ensure quality
through teamwork on individual projects, critical review at internal seminars, and by
peer review at various stages through a project by a senior staff member otherwise
not involved in the project.
Each year NZIER devotes resources to undertake and make freely available economic
research and thinking aimed at promoting a better understanding of New Zealand’s
important economic challenges.
NZIER was established in 1958.

Authorship
This paper was prepared at NZIER by Derek Gill and Peter Clough.
It was reviewed by Rob Laking and quality approved by John Yeabsley.
The assistance of EQC, in particular Richard Smith & Hugh Cowan, GNS in particular
Ken Gledhill, Gill Jolly and Kelvin Berryman, and all those who participated in the
interviews are gratefully acknowledged.

L13 Grant Thornton House, 215 Lambton Quay | PO Box 3479, Wellington 6140
Tel +64 4 472 1880 | econ@nzier.org.nz
© NZ Institute of Economic Research (Inc.) 2012. Cover image © Dreamstime.com
NZIER’s standard terms of engagement for contract research can be found at www.nzier.org.nz.
While NZIER will use all reasonable endeavours in undertaking contract research and producing reports to ensure the
information is as accurate as practicable, the Institute, its contributors, employees, and Board shall not be liable (whether in
contract, tort (including negligence), equity or on any other basis) for any loss or damage sustained by any person relying on
such work whatever the cause of such loss or damage.

Key points
GeoNet is a geological hazard monitoring system that includes a network of
geophysical instruments, automated software applications and staff focused on
earthquakes, volcanic activity, large landslides, and tsunami. The system is the result
of a sustained collaboration between the Earthquake Commission (EQC) as owner
and cornerstone investor, GNS Science (GNS) as steward and developer and a wider
community of researchers and users. In 2009 NZIER conducted a financial analysis of
GeoNet for EQC of the initial years of the operation of GeoNet in ‘peace time’
conditions when there were some minor but no major geo-physical hazard events.
The 2009 review concluded:
“GeoNet has provided a positive return on investment for EQC (through reduction in
reinsurance costs), and also for other parties with interest in academic research (GNS,
universities,…), disaster preparedness (local authorities, …..) and the wider public
through impacts on insurance costs and mapping technology. ... How much of this
benefit is attributable to GeoNet is indeterminate, because it is difficult to separate
out other factors’ influence, but the full report examines this to the extent possible.”
This review evaluates the value of GeoNet in ‘wartime’ by focusing on the major
event – the Christchurch earthquake sequence and associated Port Hills rock falls
along with one less severe event – the Tongariro eruption. We assessed GeoNet’s
contribution during these events to the six goals in the ten-year Strategic Plan1:
hazard assessment information for reinsurers, infrastructure developers
etc.
information for emergency management purposes
improvement of engineering codes and standards
development of the geospatial infrastructure
improving researchers’ analysis
informing and educating the public about natural hazards.
Tongariro eruption - What did we find?
In the Tongariro case we found a complex web of widespread direct and indirect use
of GeoNet by a variety of users for a range of purposes before the event,
immediately after, and over time. Direct immediate users included Department of
Conservation (DOC), New Zealand Transport Authority (NZTA), Civil Aviation
Authority (CAA) and the community of research scientists. Indirect immediate users
included the commercial airlines, local authorities, transport users, tourism operators
and firms potentially subject to ash fall (Genesis Energy, forest owners, Rangipo
Prison etc.). In addition there is an ongoing accumulation of knowledge as the
research community updates its understanding e.g. DOC’s update of Volcanic Hazard
Maps.
Looking phase by phase, GeoNet was instrumental in the preparedness phase as
monitoring detected the increased activity that was a harbinger for the eruption. This
in turn led to increased community awareness with the telephone tree being
1
GNS (2009) GeoNet Strategic Plan 2010-2020.
NZIER report -The value of information on natural hazards iupdated. When the eruption occurred, DOC, NZTA and the CAA acted swiftly on
information. In the mitigation phase the Tongariro Alpine Crossing was re-routed and
structures were moved and armoured.
Overall while it was not possible to quantify the benefits uniquely attributable to
GeoNet (e.g. air travel continuing but with CAA diverting flights away from the area)
there was clear evidence of widespread intensive direct and indirect use for a range
of purposes in all the stages of the Tongariro event. GeoNet was highly influential in
achieving three of GeoNet’s goals: providing information for emergency
management purposes; improved hazard assessment information for infrastructure
management; and informing and educating the public about natural hazards. It also
contributed to improving researchers’ analysis.
Christchurch earthquakes and landslips - What did we find?
We found a similar complex web of direct and indirect use of GeoNet both
immediately after the Christchurch earthquake sequence and over time. Direct and
immediate users included:
insurers – to commit to repair and reconstruction
Christchurch airport – to manage the continued operation of a lifeline
infrastructure in the face of repeated aftershocks
Port of Lyttelton – for the design of lifeline infrastructures
Engineers – improvements in engineering standards (e.g. stairwells)
incorporated in the Building Code
Ministry of Business Innovation and Employment – setting the earthquake
thresholds
Canterbury Earthquake Recovery Authority - delineation of ‘red zones’ and
rockfall zones
reinsurers – in pricing and ensuring capacity remained available.
Indirect users included:
the general public – credible science based assurance (reduced output
losses)
infrastructure developers – avoided the overbuilding of the under surface
network (liquefaction maps)
overseas researchers - Japanese drilling in New Zealand
domestic researchers – 3D mapping of ground motion.
The interview respondents often struggled to separate the information infrastructure
provided by GeoNet from the wider community of practice that has grown up around
GeoNet as a hub. The GeoNet along with the Natural Hazards Research Platform2
creates a collaborative network that extends well beyond GNS and EQC to
researchers in New Zealand institutions and overseas. This wider network, which
GeoNet has enabled, has yielded direct but unforeseen benefits to New Zealand. For
example when the Christchurch earthquake struck, New Zealand was able to access
others’ resources. The US National Science Foundation supplied the ‘T Rex’ ground-
2
The Platform is a network of users and researchers focused on natural hazards for more details see
http://www.naturalhazards.org.nz/NHRP/About-Us
NZIER report -The value of information on natural hazards iishaking machine that was useful because of the GeoNet infrastructure. The Japanese
geotechnical community was mobilised quickly and left behind valuable equipment
when they had to return to Japan to respond to their own earthquake.
Because of the quality of the data infrastructure New Zealand continues to be able to
leverage off others’ research spending. Other geological agencies are doing detailed
work in New Zealand including the Japanese who are undertaking earthquake related
drilling in New Zealand.
We were unable to systematically quantify the benefits from GeoNet in the
Christchurch earthquake sequence. For example, EQC’s reinsurers were unable to
provide with/without estimates of the benefits in reinsuring pricing and or capacity
that were uniquely attributable to GeoNet. However, the reinsurers did emphasise
the wide range of benefits that arose from GeoNet and the improving understanding
of the processes underway that it allowed.
The scale of the losses in Christchurch, the range of users and the intensity of usage
suggest that the benefits from GeoNet far outweigh the costs. Just one user (SCIRT)
in Christchurch suggested that the annualised saving alone would cover around 40%
of the total GeoNet annual operating expenses.
Looking at the Christchurch earthquake sequence phase by phase, the data and
information GeoNet data provided was:
limited use in preparedness
some indirect use in response phase – public confidence/sense making
limited direct use in recovery (timing of remediation)
extensively used indirectly in recovery (infrastructure, reinsurance)
extensively direct used in mitigation (rockfalls and landslides, building
standards, zoning)
increased future preparedness/recovery (indirect accumulative use).
In the Christchurch sequence GeoNet was highly influential in achieving five out of
the six3 GeoNet goals: improved hazard assessment information; hazard assessment
information for reinsurers, infrastructure developers; improvement of engineering
codes and standards; informing and educating the public about natural hazards; and
improved information for emergency management purposes.
What it might it mean?
Formally GeoNet is a project within GNS Science which employs 35 FTEs (around 10%
of total GNS Science staffing). GNS Science is the steward of GeoNet on behalf of the
owner - the Earthquake Commission (EQC). In practice GeoNet is much more than a
GNS project which provides an information database. GeoNet is an information
infrastructure plus:
a resource pool – maintaining a logistics infrastructure
an enabler – connector accessing key people
a seed funder - opening the door to key projects.
3
Data from Christchurch was not relevant to the sixth goal which relates to the development of the geospatial infrastructure.
NZIER report -The value of information on natural hazards iiiThe total annual cost of GeoNet consists of around $5.5m in direct operating costs,
and $2.7m pa in depreciation costs. Looking across the two events these costs are
limited relative to the magnitude of the benefits. In the case of Christchurch the scale
of the losses, the range of users and the intensity of usage suggest that the benefits
from GeoNet far outweigh the costs. The savings accruing from just two immediate
uses of GeoNet Christchurch data would have been sufficient to cover the operating
costs of the total national GeoNet system. This is without counting the more
speculative benefits from the increased public confidence which minimised the losses
in population and output (5% of Christchurch output would be worth around $800
million).
Similarly, in the case of Tongariro, a relatively small proportionate share of GeoNet
resources had a large return in informing and alerting the local community, managing
the closure and reopening of the major tourist attraction of the Tongariro Crossing,
and in assisting in the modification of infrastructure to reduce the impacts and risks
to life of future eruptions.
Figure 1 illustrates how GeoNet generates value in three ways: directly by providing
information (e.g. Tongariro early warning) indirectly by providing data (used in
liquefaction maps) and over time by contributing to the accumulation of knowledge
(the Christchurch sequence is amongst the best recorded earthquake sequences in
human history). While it was not possible to quantify the value added of GeoNet,
respondents consistently emphasised the wide range of significant benefits. What
this diagram doesn’t capture is that GeoNet with its open data policy is now at the
hub of a wider community of practice of researchers and users that extends well
beyond GNS and EQC.
Figure 1 GeoNet value proposition
Geonet
Long-term accumulative world-
Direct information
view changing knowledge
Indirect data
Intermediaries
Processors
repackaging
Information
END USERS END USERS
END USERS Engineers Decision-makers
Risk assessors (Icelandic volcano and
Researchers
Regulators ash-aversion
Engineers
Public General users
Wider public
Insurers (understanding
Policy decision-makers probability etc)
Source: NZIER
NZIER report -The value of information on natural hazards ivContents
1. Introduction – what was the task? ........................................................................ 1
2. Method – what was the approach ......................................................................... 2
3. Literature – what are the key concepts ................................................................. 4
4. Case studies - what we found ................................................................................ 7
4.1. Introduction ................................................................................................. 7
4.2. Volcanoes ..................................................................................................... 7
4.3. The Christchurch Earthquake sequence .................................................... 13
5. Summary of findings and implications for future research ................................. 18
Appendices
Appendix A List of people met ..................................................................................... 20
Figures
Figure 1 GeoNet value proposition............................................................................................. iv
Figure 2 Goals for GeoNet data and information ........................................................................ 1
Figure 3 Uses of data information and knowledge...................................................................... 5
Tables
Table 1 Examples of the uses of GeoNet information ................................................................. 3
Table 2 Disruption to Tongariro Alpine Crossing track .............................................................. 10
Table 3 Assessing GeoNet’s impact on the goals....................................................................... 18
NZIER report -The value of information on natural hazards v1. Introduction – what was the
task?
In October 2009, the NZIER provided EQC an assessment of the costs and financial
benefits (CBA) of GeoNet to EQC and the wider benefits to New Zealand as a whole.
The 2009 CBA was a financial analysis of GeoNet for EQC but findings highlighted the
fall in reinsurance costs as GeoNet research bore fruit. It was not possible to attribute
how much of the fall in reinsurance costs were due to GeoNet and how much to
other factors such as the general softening in the insurance market.
The 2012 GeoNet review panel recommended (p13 2013): 4
“That the previous Cost Benefit Analysis (CBA) be repeated by…commissioning an
update of the CBA for GeoNet in particular, by looking to review the return on GeoNet
in the light of the recent hazard events such as the Christchurch earthquakes, tsunami
warnings5 and volcanic eruptions”.
In response to the GeoNet panel’s recommendations EQC commissioned NZIER to
undertake a study that focused on three Geo-Hazards – the Tongariro eruption, the
Christchurch Earthquake sequence and the Port Hills rockfalls.
The primary research question in this first phase of the research was:
• For each purpose how was GeoNet data and information used?
The GeoNet strategic plan6 identifies the range of potential stakeholders and the
different purposes data and information from GeoNet can be used for. These are
shown in Goals for GeoNet data and information in Figure 2 below. This report
discusses how the information from GeoNet was actually used in the Tongariro
eruption and the Christchurch earthquake sequence. This research informs the
assessment of the value has been created by the investment to date in GeoNet.
Figure 2 Goals for GeoNet data and information
Help emergency management
Inform and educate public Reduce reinsurers uncertainty
Geonet data
information
Improve research analysis and Influence engineering codes and
understanding standards
Improve geospatial Provide infrastructure hazard
infrastructure assessment
4
GeoNet Project Panel Review (2013) Sustaining an Innovative Contribution.
5
Phase 2 will address the recommendation from the 2013 Review (page 6) to examine’ the potential returns on further
investment in a tsunami early warning system for a close-in event.’
6
GNS (2009) GeoNet Strategic Plan 2010-2020.
NZIER report - The value of information on natural hazards 12. Method – what was the
approach
The project involved mixed-method research involving both desk based and
participant interview elements that provides a wide base of both qualitative and
quantitative evidence. We proposed to examine the costs and benefits of GeoNet
using one event from each domain but this approach has not proved tractable
because of problems with defining the counterfactual and availability with credible
quantitative estimates (which are discussed further below). Instead, we proceeded
with the Tongariro eruption for volcanoes, the Christchurch earthquake and the Port
Hills rockfalls and landslides as a series of short case studies (vignettes). The focus of
the case studies was to define how GeoNet information was actually used by
different decision makers.
We conducted a series of semi-structured interviews that focused on volcanoes (6
interviews), earthquakes (19 interviews) rockfalls and landslides (6 interviews). The
volcano interviews were conducted in September 2013 and Christchurch interviews
mainly occurred in October 2013. The list of key stakeholders identified by GNS and
EQC who were interviewed is attached as Appendix A of this report. The interviews
were organised around a set of standard questions about the respondent’s role, the
chronology of events, the key players, how GeoNet was used, what the impact on
decision making was, what estimates were there of the value that was created, and
what would have happened if GeoNet didn’t exist. The focus was on eliciting
Who uses GeoNet natural hazards information?
For what purpose?
To what effect?
What value is created?
What is the unique value added from GeoNet?
These interviews were captured in note form and analysed for patterns – the
purposes GeoNet information was used for and whether usage was direct or indirect,
immediate or accumulative. We also looked for but failed to find examples of where
there were any adverse or unintended consequences from GeoNet.7
7
The external reviewer highlighted the risk that case studies do not take account of information not produced as resources were
invested elsewhere (i.e. crowding out). However while that risk exists, the research found evidence of ‘crowding in’ as
respondents reported that the success of GeoNet encouraged other investments in new improved Geo-hazard information
to occur.
NZIER report - The value of information on natural hazards 2Table 1 Examples of the uses of GeoNet information
Usage Direct Indirect
Immediate Decide whether to Revise the building
keep the airport code standards for
operating stairwells
Delayed Decide whether to Build new 3D
rebuild or relocate models that map
ground motions
Source: NZIER
As part of the research sense-making and synthesis phase EQC convened a reference
group in late February 2014 of all the key players. This workshop reviewed the initial
findings from the case studies. The membership included Richard Smith & Hugh
Cowan (EQC), Rob Laking (VUW), Ken Gledhill and Kelvin Berryman (GNS).
While the original research design envisaged updating the 2009 cost benefit analysis,
it became apparent that no credible estimates from the benefits for the use of
improved information were available8. For example, EQC’s reinsurers were unable to
provide with/without estimates of reinsurance pricing and or capacity that were
uniquely attributable to GeoNet. However, they did emphasise the wide range of
benefits that arose from GeoNet and the understanding of the geo-technical
processes underway. As a result, we reframed the research as an outcome
evaluation.
The GeoNet ten-year Strategic Plan (2009)9 outlines six goals:
hazard assessment information for reinsurers, infrastructure developers
etc.
information for emergency management purposes
improvement of engineering codes and standards
development of the geospatial infrastructure
contributing to researchers’ analysis
informing and educating the public about natural hazards.
We have assessed the extent to which in each of the events GeoNet delivered on the
goals in the Strategic Plan. The next section discusses the concepts in the literature
that are used in the case studies that are presented in Section 4.
8
There was also the counterfactual problem: interviewees found it difficult to define what the world without GeoNet would have
looked like and hence what decisions would have been made in the absence of GeoNet information.
9
ibid.
NZIER report - The value of information on natural hazards 33. Literature – what are the key
concepts
The value of GeoNet substantially revolves around the worth of the improvement in
the data and information it provides. The value of new information (used here to
include data and knowledge) is notoriously difficult to predict or assess as its value is
highly situation specific. The value of information from pure or basic research is a
‘known unknown’ that can range from net negative to large positive depending on
the type of information and the setting. The 2009 NZIER report discussed the
economics of information literature in some depth (see Section 2) and we will not
repeat the detailed argument here. The key point is “there is little by way of a
general economics of information that creates an authoritative framework” (2009
p5). Standard approaches tend to look at the value of ‘known knowns’. Hazard
management is about ‘known unknowns’ and handling discontinuous change in
response to shocks.
GeoNet creates value by narrowing the uncertainty around unpredictable events and
improving understanding of such events. This reduced uncertainty can improve the
strategies that the public agencies, businesses, communities and individuals adopt.
Dixit and Pindyck (Investment Under Uncertainty, 1994) emphasise that given the
ongoing uncertainty in the environment facing decision makers, there is an option
value of waiting for better (but never complete) information. GeoNet may have
reduced the option value of delaying investment decisions by providing more timely
information and reducing the uncertainty surrounding the decision-making.
In order to address how decision makers actually use information about geo-hazards,
it is first necessary to be clear what is meant by the terms ‘use’ and ‘information’. In
brief, information use can be direct/instrumental or indirect/conceptual. With direct
use there is a direct link between information provided and decisions made. With
indirect or conceptual use data, analysis or research is only one among many
information sources – formal and informal, qualitative and quantitative – that
decision-makers access. 10
The improved information can be used in a variety of ways. It is important to
distinguish between immediate event-contingent direct and indirect use and
accumulative effects in the longer term e.g. research understanding affecting
reinsurance availability/cost.
Use of information relates to the demand for and supply of information.
Developments in ICT have increased the ability to collect and analyse data while costs
have continued to decline. The link between the increased supply of information and
the demand for this information is often assumed. However, the information
supplied does not always match the needs of users for particular purposes.
10
There are two distinct view s in the literature on of how decision makers use information: the ‘rational control model’
emphases direct uses of information while the ‘relativistic’ perspective emphases indirect and more subjective use. In the
interviews we looked for both types of usage.
NZIER report - The value of information on natural hazards 4Figure 3 Uses of data information and knowledge
Source: NZIER based on MSD (2001)11
Figure 3 illustrates that usage can range from direct use in day-to-day ‘business as
usual‘ through to providing ‘new blue skies frameworks’ which reframe how we
interpret the world. Information usage also varies in its impact – from support and
legitimisation for an existing course of action through to a decisive reformulation of
what is to be done.
Hazard management is generally portrayed as a cycle involving two ex ante and two
ex post phases:
mitigation - minimising the effects of disaster by reducing exposure (e.g.
through planning restrictions on land use) and reducing vulnerability (e.g.
building codes)
preparedness - planning how to respond (e.g. emergency
exercises/training; warning systems)
response - efforts to minimise the harm created by a disaster (e.g.
emergency relief operations)
recovery - returning the community to normal (e.g. temporary housing).
Arguably there is a fifth learning-from-feedback phase that informs the planning for
the other four phases.
While the ex post phases of the cycle overlap and the length of each phase greatly
depends on the severity of the disaster, this is a useful approximation which is used
in the case studies.
Patterns of information usage can vary across the different phases. Disasters are
relatively rare, occur with varying degrees of warning and are the product of
relatively unpredictably distributed natural hazards and more predictable exposures
and vulnerabilities. The actions taken by human communities can reduce their
exposure and vulnerability to natural hazards. The damage from a disaster stemming
from hazard events of similar magnitude in different jurisdictions can vary widely
according to the precautions and event driven actions taken by all of individuals,
communities and governments to limit exposure and vulnerability.
11
MSD, 2001, Improving the Knowledge Base for Social Policy: Strategic Knowledge Needs.
NZIER report - The value of information on natural hazards 5Broad strategies for geo-hazard risk management fall crudely into four categories
consisting of:
avoidance
control
acceptance
transfer.
Before the event greater understanding of hazard risk and potential loss can allow for
more targeted risk avoidance strategies. Immediately after the event better
information about what has been experienced helps assessment of risk of physical
damage (should the facility be kept operating) and potential financial losses. In the
recovery phase adjustment and revision of models to incorporate the latest
information affects decision on risk transfer as the price and available reinsurance
capacity adjusts.
Damage from hazards varies depending upon the decisions taken by individuals,
communities and governments. Within each stage of the cycle there is a range of
potential strategies. For example, mitigation can be achieved by avoidance,
engineering or administrative controls etc. Different mitigation measures affect
different decision makers.
The GeoNet Ten-Year Strategic Plan goals include a number of potential purposes
GeoNet information could be used for including emergency management,
improvements of engineering codes and standards, hazard assessment (e.g. for
reinsurers), improving researchers’ analysis, and informing and educating the public
about natural hazards.
The next section explores how GeoNet information was actually used in the case
studies. In the case studies we explore:
how information from GeoNet was used by identified decision makers
including Ministers, engineers, insurers, investors, emergency management
personnel, and the general public
how that usage varied depending upon the hazard management phases
how there were different types of use - immediate event-contingent direct
usage, indirect use and accumulative usage.
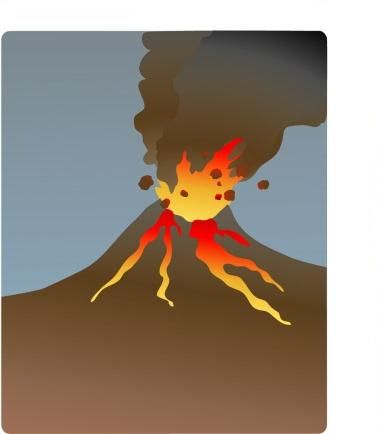
NZIER report - The value of information on natural hazards 64. Case studies - what we found 4.1. Introduction In a series of interviews conducted with key stakeholders over September and October 2013, we explored the different purposes that GeoNet information was used for. We have captured the results from the case studies in two vignettes. These vignettes reflect what we as researchers took out of the interviews and some supporting background material. 4.2. Volcanoes Mount Tongariro is the northernmost of the active volcanoes in the Tongariro National Park. It has multiple craters and vents but in 2012 it had not had a significant eruption for 120 years. Although Mount Ruapehu is well monitored, following recent eruptions and the 2007 lahar event, the monitoring network on Tongariro is sparser, and local iwi have been reluctant to see more permanent equipment installed on the mountain. The Te Maari crater is also on the edge of the gazetted Te Tatau Pounamu wilderness area in the park, which is managed for minimal access and has no permanent man-made structures on the ground. Back in 2002 GeoNet detected under Tongariro a number of low-frequency “tornillo” earthquakes, which are often a precursor to eruption. But nothing eventuated although tornillos continued sporadically until the eruptions occurred. In May 2012 a routine annual survey of hot springs and fumeroles revealed nothing out of the ordinary, but by June a sequence of intermittent earthquake activity suggested fluids were moving below the volcano that could trigger eruption. Towards the end of July GNS convened a meeting of monitoring scientists, which resulted in the Volcanic Alert Level (VAL) being raised from zero to 1 (unrest). GNS formally notified MCDEM, the Meteorological Service Volcanic Ash Advisory Centre (VAAC), and DOC, and informally contacted local iwi, who withdrew their objection to five more monitoring stations being positioned on the mountain “temporarily” for an indefinite period. GNS also contacted researchers at Massey, Waikato and Canterbury Universities who have an interest in volcanic activity and ash impacts, and the local community took the soft precaution of updating a telephone tree of who to contact in the event of an eruption. The VAL was maintained at 1 as earthquake activity subsided, but on 6 August the volcano’s Upper Te Maari crater on its north east flank erupted in the middle of the night. It was first noticed by residents nearby who heard explosions and saw material flying through the air. They phoned DOC who contacted GNS who confirmed that instruments showed activity consistent with an eruption occurring. Some 45 minutes later DOC convened a teleconference with GNS, police, MCDEM and iwi to discuss risk management and response to the eruption. State Highways 46 and 1 were closed by police until the situation became clearer. NZIER report - The value of information on natural hazards 7
The Volcanic Alert Level was raised to 212 indicating an eruption in progress and the
aviation colour code was moved to Red.13 GNS continued to monitor seismic signals
and handle enquiries from the news media through the night. First thing the
following morning, a helicopter made an aerial inspection of the scene, and
researchers came from Massey University in Palmerston North to collect ash
samples. GNS convened another meeting of scientists and agencies to pool their
various findings.
Over the next few days the weather hampered observation of the crater area, but
over-flights were made to measure gas emission rates and ash was collected from
the ground for analysis of composition and distribution. Monitoring showed activity
and gas levels diminishing and GNS worked with DOC to assess the probability of
further eruptions. Impacts of the eruption came mostly from damage to the Ketetahi
Hut and track structures on the nearby Tongariro Alpine Crossing (TAC), and diversion
of aircraft from airspace over the mountain. Ash-fall in the water supply of Rangipo
Prison had potential to damage the pumps, and there was potential risk of damage to
generators in the Tongariro Power Scheme, prompting temporary closure of the
intakes. In mid-October, there was also temporary flooding on SH46 following
collapse of a mud dam formed below the Te Maari crater.
The VAL returned to 1 on 17 August. By October activity appeared to have reduced
sufficiently for DOC to re-open the full TAC track. But on 21 November Te Maari
erupted again in the middle of the day, in view of walkers on the Crossing who took
pictures and film footage and ensured global multi-media exposure of the eruption.
This was however much smaller than the August 6 eruption.

Views on the value of GeoNet and associated facilities
Without GeoNet and its associated facilities, GNS and the emergency management
agencies would have been more in the dark about the potential for an eruption, and
GNS may not have raised the alert until later, with the possibility of agencies being in
a lesser state of preparedness when the eruption occurred. GeoNet was crucial to
the early detection of earthquakes that enabled GNS to put in place additional
sensors that could locate activity within the mountain, and assess a high probability
of eruption being in the Te Maari area. Although the actual eruption was observed
before it was confirmed by GeoNet, the heightened awareness of risk and location of
areas likely to be affected enabled swifter responses once the eruption occurred. The
information gathered by GeoNet before, during and after the eruption also enabled
time varying Volcanic Hazard Maps to be updated – more relevant than the previous
average hazard maps that reflect known activity over the past 27,000 years, not all of
which is still relevant to current risk – and improved risk management planning.

Value for national park risk management
DOC has principal responsibility for risk management in Tongariro National Park. A
particular concern with the Te Maari eruptions was the impact on the Tongariro

   12
        Volcanic Alert Levels in New Zealand are under review, but currently denote minor eruptive activity as Level 2, significant local
          eruption as Level 3 (like much of the Ruapehu eruption sequence in 1995-96) and “hazardous” eruptions with greater threat
          to lives and property as level 4 or higher. Ruapehu in 1995-96 briefly reached Level 4.
   13
        The aviation colour codes, set by the ICAO, are Green for normal; Yellow for unrest; Orange for heightened unrest; and Red for
          eruption imminent or in progress.

NZIER report - The value of information on natural hazards                                                                             8
Alpine Crossing, a popular 8 hour day walk which receives 70-80,000 visitors a year, 60-80% of them from overseas. It is one of the most popular walks in New Zealand and a major draw-card for visitors to the country. It is estimated to bring $20- $80m/year of expenditure into the region, via commercial accommodation and other services. Prior to the August eruption there was resistance to a pre-emptive closure of the TAC from local tourism interests. But the August eruption caused pyroclastic surges to impact over 300m of track and damaged 4 bunks in the nearby Ketetahi Hut. Had it happened in summer between 12 and 3pm, or on a night with people staying in the hut, multiple fatalities would likely have occurred. GeoNet and associated warnings enabled DOC to be ready for the eruption, preparing response plans in July in consultation with iwi, forest managers and Genesis Energy. The TAC was closed immediately after the August eruption and reopened in stages: from Mangatepopo to the Emerald Lakes junction on 18 September and in its entirety on 19 October, with a Rahui imposed to 1 km around the Te Maari crater. The November 21 eruption, when people were on the crossing, led to immediate closure of the track and its road ends. GeoNet monitoring assisted the decision to reopen the track from Mangatepopo to the Emerald Lakes on 29 November 2012. A full re-opening of the TAC, with some rerouting away from the ejection zone from the August eruption, occurred on 8 May 2013. The scientific assessment and reporting on the August eruption also assisted DOC in deciding to remove the old Ketetahi Hut and replace it with a shelter and toilet block, with caretaker’s quarters armoured against medium-sized projectiles that were experienced in the earlier eruption. Warning level lights manually triggered by activity recorded on GeoNet have already been installed at the car parks at either end of the Tongariro Alpine Crossing and at the top of the Active Volcanic Hazards Zone near Blue Lake. Value for infrastructure risk management The biggest infrastructure impact from the eruption was the Tongariro Alpine Crossing, which was subject to closure after each eruption. Taking account of partial opening, there was no access to the track at all for 42 days after August and 8 days after November, and closure of at least part of the track for 73 and 169 days, respectively. Those closures will have reduced visitor spending in the region, although from a national perspective much of that spending will have been diverted to other parts of the country. The long term impact on visitor attraction to Tongariro is unlikely to be significant or negative: the eruptions resulted in no loss of life due to fortunate timing, and media and social network coverage of the November eruption may even have added to this destination’s allure. GeoNet has still had an effect on risk reduction for the future, if not during the actual event, as new information about projectiles and pyroclastic flows has highlighted the eruption hazard for those staying overnight in that part of the mountain that led to the decommissioning of Ketetahi Hut. GeoNet data were also directly influential on the timing and location of the reopening of sections of the Tongariro Alpine Crossing. NZIER report - The value of information on natural hazards 9
Table 2 Disruption to Tongariro Alpine Crossing track
Days of track closure
Tongariro Alpine Crossing Track Closures after eruptions
Days to reopening after eruptions     6-Aug     21-Nov
Mangatepopo-Emerald Lakes                 42           8
Emerald Lakes-Ketetahi Road End           73        169

Source: NZIER, from information provided by Department of Conservation

These track closures do not coincide with the changes in Volcanic Alert Level. Once
the volcano had stopped erupting the VAL could not remain at 2 and was lowered to
1, but there was still a risk of fresh eruption which would pose significant safety risk
for those on the track with limited options to escape. As the first eruption occurred
at night, the principal hazard was assessed to be from ballistic projectiles raining
across the track. After the November eruption in daylight, it was apparent that
pyroclastic surges were also possible, adding a second hazard to that of projectiles.
Also, as there had been two eruptions it was considered there was heightened risk of
further eruptions. Consequently after the November eruption the partial reopening
of TAC sections furthest from Te Maari was quicker, but the full re-opening took
longer, than after the August eruption.
These are consequences of the eruptions, and GeoNet’s contribution rests on what
would have happened without it: mostly marginal changes in costs due to greater
uncertainty about re-eruption risks and increased disruption costs caused by slower
response and recovery. GeoNet also contributes to avoidance of future costs to the
extent that new information from the monitoring of the eruption – for instance on
the type of projectiles ejected and the impact zone around the crater (from
subsequent field measurements as well as GeoNet’s seismic records) – enables
adjustment of infrastructure (such as TAC rerouting) to reduce the event-contingent
damage and disruption from future eruptions.
The other principal infrastructure imposition was from road closure, most of the
costs of which were diversion costs for private vehicles. Temporary measures to
protect water intakes from ash deposits at the Rangipo Prison and the Tongariro
Power Scheme were short lived and inconsequential after ash-fall proved to be
minor.
The value of seismic information from GeoNet comes from the better understanding
it provided of the level and location of activity, which both enabled agencies and
communities to be better prepared for when the eruption occurred, and assisted
with the response and recovery phase in determining when track and road closures
could be lifted. In the longer term it has enabled a better delineation of the high risk
zones around the crater, providing more recent information to an eruption record
that goes back many thousands of years. This should enable better precautionary
activity in future in rerouting parts of the Tongariro Alpine Crossing track and
replacing the Ketetahi hut, reducing the probability and severity of damage from
future eruptions.

Value for airline risk management
The Ruapehu eruptions in 1995/96 caused much disruption to air traffic because of
the volume of ash, the distribution of spread, and CAA’s attempts to delimit no fly

NZIER report - The value of information on natural hazards                           10
zones on limited information. As a result of this experience GNS and CAA now have
systems in place to provide information on impending risks of eruption on the
ground, which is passed to airlines who make their own decisions about whether to
fly. GeoNet provides data on ground-based volcanic activity which GNS passes to the
MetService, who issue Volcanic Ash Advisory notices for up to 18 hours ahead. When
an eruption occurs MetService also models ash plume spread (or “ash polygon”) and
conveys this to the Airways Corporation who distribute it to commercial airlines and
airport operators.
In response to the Te Maari eruption, the presence of ash in the atmosphere created
a state of “conditional airspace” which planes can still fly in given high visibility, and
the controlled air-space in which commercial flights are run was lowered from 33,000
feet to 16,000 feet, enabling commercial flights to continue to fly below the ash
presence. Air New Zealand cancelled a number of regional link flights to places such
as Taupo and Rotorua, which use turbo-prop aircraft flying at lower levels, but
continued to fly domestic jet services with minor route alteration to avoid the crater.
Jetstar cancelled some of its jet services over the North Island. Airlines continued to
fly across the Tasman with co-operation of the Australian authorities, and Qantas
flights over New Zealand to South America continued with minimal deviation in flight
path.
Since recent volcanic events (and particularly the eruption of Iceland’s Eyjafjallajökull
in 2010, which caused much disruption over North Atlantic and European routes, and
showed up the multiplicity and lack of co-ordination and consistency of responses
across different air traffic control jurisdictions) changes have been made to improve
monitoring and response at international levels. Airlines are now seen as having
ultimate responsibility on whether to fly or not, given reliable and timely information
about ash volume (from ground sources) and spread (from meteorological
modelling). Aircraft manufacturers now have better ideas about aircraft tolerance to
ash plumes, and while flying through ash of 2g/m3 poses strong risk of engine seizure,
planes losing power and crashing, ash densities of 0.002
both the Icelandic eruption in 2010 and the Chilean volcanic eruption in 2011 and
which have led to aviation authorities deferring to airlines to decide what
modification to make to flight plans.
The modelling from the November eruption suggested ash spread across the whole
of the North Island, from Gisborne over Taupo to New Plymouth, although the size of
eruption indicates this was not the case. This was a direct result of the modelling
being unable to predict density, and the conservative interpretation put on Volcanic
Ash Advisory notices. Diversion tracks were therefore probably wider than they
needed to be. Air New Zealand has since provided more funding to the Volcanic Ash
Advisory Service to improve aspects of the modelling.
Prior to August 2012, it would take the MetService 35-40 minutes to do its plume
modelling and up to 90 minutes before first communications were sent to airlines.
While this might be acceptable for other airlines operating jet services or
international routes, Air New Zealand has a major domestic service using airways
that track close to the active volcanoes, and regional turbo-prop services flying under
20,000 feet. Subsequently Air New Zealand has obtained agreement from GNS to be
copied into the emails notifying MetService of an eruption taking place. In November
2012 this reduced the notification time to 21 minutes, and that notification was
enough to decide on route changes for the turbo-prop services at risk.

GeoNet and volcanic risks
The role of GeoNet with respect to volcanic risk reveals both strengths and
weaknesses of the current coverage. On the plus side, GeoNet is acknowledged by
users for assisting preparation and response to volcanic events, and improving
understanding of volcanic risks to improve investment in infrastructure to make it
more resilient to future events. It has also had some unexpected benefits, for
example providing a series of seismic data that was used in analysis to allay concerns
about links between hydraulic fracturing in oil and gas production and earthquake
generation in Taranaki: monitoring of the volcano provided the data and the
experience of past seismic activity against which to compare readings caused by
fracking activity. Over time a wider community of practice has grown up around
GeoNet as a hub. The greater collaboration that has built up over time meant that
the research effort was able to be focused after the events. It also means that the
messages to the public that ‘could easily get out of hand’ were able to be managed
and communicated effectively.
GeoNet has improved the coverage of volcanic risks in New Zealand, as now all active
volcanic areas have sufficient seismic monitoring to detect emerging activity as it
happens. Before GeoNet coverage was more piecemeal, with Ruapehu covered as
the principal cone volcano and monitoring on one volcanic field (Auckland) and one
caldera (which switched between Taupo and Okataina, depending on particular
research interests at the time). Ruapehu remains the best monitored volcano
because of its high recreational use and its relatively frequent eruptions, and both
DOC and Ruapehu Alpine Lifts have funded upgrade of the monitoring system, and
provision of a fully automated seismic and acoustic detection system that can
identify eruption and trigger alert sirens on the ski field within 30 seconds.
Gas monitoring, although undertaken as a part of GeoNet, depends on monthly
sampling of fumeroles on the ground or from fly-past remote sensing, so there is no

NZIER report - The value of information on natural hazards                          12
continuous real-time data series to match with seismic data. Ground based
instruments for gas measurement developed by GNS have been deployed at White
Island with their operation funded by GeoNet, and the same is planned to be rolled
out to other locations.
Although Ruapehu has a fully automated system for raising the alert on eruptions
taking place, and Tongariro now has similar capability for detecting eruptions,
GeoNet-informed decisions on changing lower Volcanic Alert levels or the warning
lights on the Tongariro Alpine Crossing still depend on expert interpretation and
judgement calls by scientists and risk managers. Given the importance of timeliness
of information (e.g. with respect to aircraft that may be operating at night) some
aspects of information transmission might be speeded up by automatic messaging
(as appears to be the case now for TAC warning lights).
In summary compared to the counter-factual without it, GeoNet has:
Enabled a denser coverage of seismic sensors around active volcanic areas,
building a more complete picture of activity in these areas
Identified a pattern of activity around Tongariro that enabled additional
sensors to be applied
Enabled the location of likely activity to be pinpointed more accurately, and
encouraged soft responses to improve preparedness for an eruption
Informed responses to the eruption for timely intervention in the short term,
and adjustments to infrastructure for longer term use, both of which reduce
the risks to life in future compared to an alternative situation in which less is
known about the hazards posed by volcanic activity.
In short, GeoNet was highly influential in achieving three of GeoNet’s goals providing
information for emergency management purposes, improved hazard assessment
information, and informing and educating the public about natural hazards. It also
contributed to improving researchers’ analysis.
4.3. The Christchurch Earthquake sequence
The chronology of events surrounding the Christchurch earthquake sequence is well
known to New Zealanders and needs only brief coverage. In short the sequence
began on 4 September 2010 when the Canterbury region experienced an earthquake
recorded as 7.1 on the Richter scale which caused significant property damage to
Christchurch and the central Canterbury region, but no direct fatalities. The
earthquake generated a sustained sequence of minor and major aftershocks. The
largest of these was on 22 February 2011 when a magnitude 6.3 earthquake struck
Christchurch killing 185 people and causing extensive property damage. Three
quarters of Christchurch’s housing stock (150,000 homes) suffered some material
damage, 30,000 houses experienced more than $100,000 damage and around 7,500
were declared unfit for habitation
Both the major earthquakes occurred on "blind" or unknown faults, although the
shake maps and other official reports had predicted moderate earthquakes in
Canterbury with the likelihood of associated liquefaction.
NZIER report - The value of information on natural hazards 13The impact of an earthquake, and hence the risk to human life and of property
damage depends upon a number of factors including location, depth, and how much
energy is released. The peak ground acceleration in the February earthquake was
amongst the highest ever recorded in human history and significantly exceeded the
design load of the building code for a 500-year event. With two tragic exceptions
where building design and construction was at fault, the direct damage was
predominantly to buildings constructed before the 1970s. Most of the other property
damage arose because of extensive liquefaction, but rockfalls and landslides
triggered by the earthquakes (discussed below) were also a contributor.
In the response phase to the February earthquake large parts of the Christchurch
CBD were cordoned off while damage to buildings and land were assessed. The
closure of much of the CBD and temporary closure of a number of tertiary education
providers initially significantly affected tourism, retailing and education services.
However, with utilities being reconnected, manufacturing, industry and the port
were able to continue operations and agriculture was not significantly affected. As a
result business activity proved remarkably resilient and the fall in output from the
Canterbury region and population was less than had been expected.15
The damage to residential housing from ground liquefaction in particular however
has had a significant effect on the lives of many Christchurch residents. The
prolonged recovery process is still playing out as this report is being prepared (March
2014). Survey and focus group research undertaken by Canterbury District Health
Board (2013)16 suggests:
“It is clear that all areas of residents’ lives have been affected by the
earthquakes: homes, relationships, social lives, communities, identities,
finances and careers.
Over eighty percent of respondents stated that their lives had changed
significantly since the earthquakes.
Over three quarters of respondents reported that their home was damaged
and almost as many reported that their neighbourhood was damaged.
Almost two thirds of respondents were grieving for the ‘lost Christchurch’.
The earthquakes have been seen as a ‘double blow’ –the earthquakes and
the perceived subsequent poor management of the recovery.”
There is an element of serendipity in GeoNet’s response to the initial 4 September
2010 earthquake. GeoNet already had a reasonably extensive network in place
before September 2010, originally built with the intention of monitoring the effect on
Christchurch of an earthquake on the great Alpine Fault.
The beginning of the earthquake sequence in September triggered a rapid network
expansion as equipment intended for elsewhere was promptly deployed to
Christchurch. There were significant increases in the number of urban strong motion,
and structural strong motion array stations. As a result 22 February 2011 was one of
the best recorded earthquakes in human history.
15
See Miles Parker and Daan Steenkamp, “The Economic Impact of the Canterbury earthquakes”, Reserve Bank of New
Zealand: Bulletin 75(3) 13-25, September 2012.
16
Canterbury District Health Board (2013) Becoming All Right? A summary of the research behind the wellbeing campaign for
Canterbury.
NZIER report - The value of information on natural hazards 14There were also other technological innovations in GeoNet which enhanced its
usefulness. The adoption of the GFZ Potsdam software package automated and
speeded up the initial earthquake location and magnitude determination. Event
information was posted on the GeoNet webpage and made available to the
stakeholders via mobile devices as well as through social media such as Facebook and
Twitter.
“During the Canterbury earthquake sequence GeoNet became a trusted authoritative
source of information …. became a household name in New Zealand….
elevated GeoNet onto the global stage as one of the top tier data providers
internationally.” 17
Like Tongariro, in Christchurch we found a complex web of direct and indirect use of
GeoNet for a range of purposes. This usage occurred both immediately after the
earthquake sequence and over time. The scale of the damage in Christchurch and
wide range of significant users suggest that GeoNet has yielded significant benefits.
Direct and immediate users (followed limited interpretation for forecast
probabilities) included:
Insurers – optimising the timing of building reconstruction
Airport - deciding whether to keep the airport operating or close for
inspection
Port – deciding where to locate new facilities
Building code – improvements in engineering standards (stairwells)
Building code – used in decision-making on setting thresholds
Mitigation - delineation of red zones and rockfall zones
Reinsurers – whether capacity continued to be available
Reinsurers – reducing the uncertainty premium built into pricing.
Indirect uses included:
infrastructure – avoid overbuilding under surface networks
public confidence and assurance – credible science based assurance
minimised the output losses
public and private decision makers - (Ministers, company directors,
landlords)
research connections - (Japanese liquefaction equipment)
domestic researchers - 3d mapping of ground motion
overseas researchers – Japanese drilling in New Zealand.
We were unable to systematically quantify the benefits from GeoNet. For example,
EQC’s reinsurers were unable to provide with/without estimates of the benefits in
reinsurance pricing or capacity that were uniquely attributable to GeoNet. However,
they did emphasise the wide range of benefits that arose from GeoNet and the
understanding of the processes underway. In particular, GeoNet plus analysis from
research scientists that it supported played a key role in maintaining the confidence
of insurance markets in the basic science behind the existing earthquake models and
improved understanding of stresses facing the structural components of buildings.
17
GeoNet Project Panel Review (2013) P14.
NZIER report - The value of information on natural hazards 15You can also read