NIS INVESTMENTS DECEMBER 2020 - European Union Agency for Cybersecurity
←
→
Page content transcription
If your browser does not render page correctly, please read the page content below

NIS INVESTMENTS

DECEMBER 2020
                  0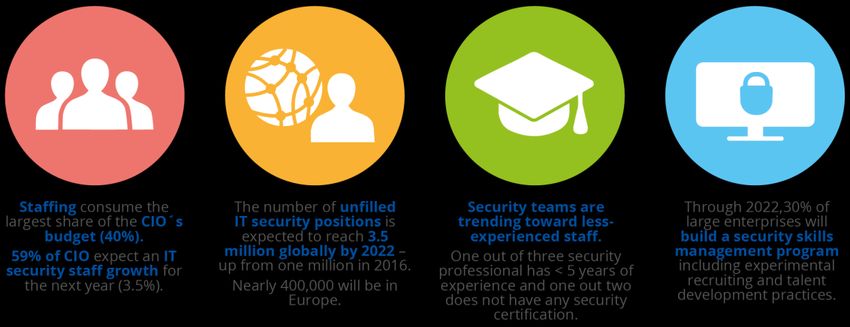
NIS INVESTMENTS
                                                                                                          December 2020

ABOUT ENISA

The European Union Agency for Cybersecurity, ENISA, is the Union’s agency dedicated to
achieving a high common level of cybersecurity across Europe. Established in 2004 and
strengthened by the EU Cybersecurity Act, the European Union Agency for Cybersecurity
contributes to EU cyber policy, enhances the trustworthiness of ICT products, services and
processes with cybersecurity certification schemes, cooperates with Member States and EU
bodies, and helps Europe prepare for the cyber challenges of tomorrow. Through knowledge
sharing, capacity building and raising awareness, the Agency works together with its key
stakeholders to strengthen trust in the connected economy, to boost resilience of the Union’s
infrastructure, and, ultimately, to keep Europe’s society and citizens digitally secure. For more
information, visit www.enisa.europa.eu.

CONTACT
For contacting the authors please use resilience@enisa.europa.eu
For media enquiries about this paper, please use press@enisa.europa.eu.

AUTHORS
Athanasios Drougkas, Georgia Bafoutsou, Viktor Paggio EU Agency for Cybersecurity

LEGAL NOTICE
Notice must be taken that this publication represents the views and interpretations of ENISA,
unless stated otherwise. This publication should not be construed to be a legal action of ENISA
or the ENISA bodies unless adopted pursuant to the Regulation (EU) No 2019/881.
This publication does not necessarily represent state-of the-art and ENISA may update it from
time to time.

Third-party sources are quoted as appropriate. ENISA is not responsible for the content of the
external sources including external websites referenced in this publication.

This publication is intended for information purposes only. It must be accessible free of charge.
Neither ENISA nor any person acting on its behalf is responsible for the use that might be made
of the information contained in this publication.

COPYRIGHT NOTICE
© European Union Agency for Cybersecurity (ENISA), 2020
Reproduction is authorised provided the source is acknowledged.

For any use or reproduction of photos or other material that is not under the ENISA copyright,
permission must be sought directly from the copyright holders.

ISBN 978-92-9204-442-8        -   DOI 10.2824/50973

                                                                                                                     1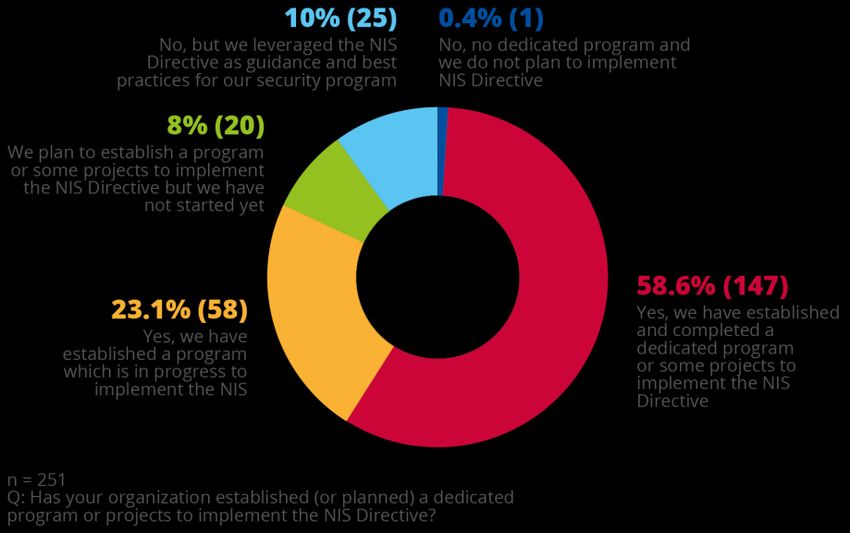
NIS INVESTMENTS
                                                                         December 2020

TABLE OF CONTENTS

1. INTRODUCTION                                               5

2. INFORMATION SECURITY DYNAMICS AND OUTLOOK                  6

2.1 SECURITY BUDGETS                                          6

2.2 INFORMATION SECURITY SPEND DISTRIBUTION                   10

2.3 INFORMATION SECURITY STAFFING                             12

2.4 INFORMATION SECURITY MARKET OUTLOOK                       13

2.5 TRENDS ON SECURITY INCIDENTS LIABILITY                    14

3. INFORMATION SECURITY INVESTMENTS FOR THE NIS
   DIRECTIVE IMPLEMENTATION                     15

3.1 INFORMATION SECURITY SPEND IN THE NIS DIRECTIVE SECTORS   15

3.2 NIS DIRECTIVE IMPLEMENTATION                              18

3.2.1 Current state                                           18
3.2.2 NIS Directive implementation program timeline           19

3.3 NIS DIRECTIVE RESOURCES                                   22

3.3.1 NIS dedicated budget                                    22
3.3.2 NIS dedicated hires                                     25

3.4 NIS DIRECTIVE SECURITY IMPACT                             27

3.4.1 Impact on information security domains                  27
3.4.2 Impact on procurement of technology and services        28

3.5 NIS DIRECTIVE IMPLEMENTATION CHALLENGES                   29

3.6 INFORMATION SECURITY INCIDENTS                            31

3.6.1 Information security incident reporting                 31
3.6.2 Cost of major information security incidents            33

3.7 PERCEPTION OF THE NIS DIRECTIVE IMPACT                    34

4. CONCLUSIONS                                                36

A ANNEX: SURVEY DEMOGRAPHICS                                  38

A.1 SELECTION OF MEMBER STATES TO FOCUS SURVEY                38

                                                                                    2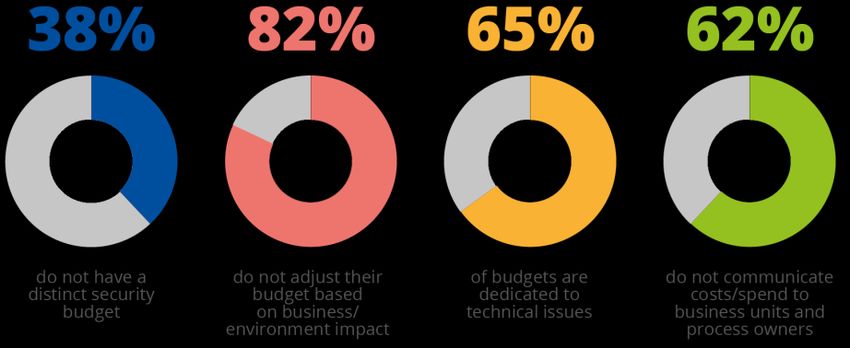
NIS INVESTMENTS
                                                                December 2020

A.2 SURVEY RESPONDENT DEMOGRAPHICS                   39

A.3 LOCATION OF SURVEYED ORGANISATIONS               39

A.4 SECTORS OF SURVEYED ORGANISATIONS                39

A.5 STAFFING AND REVENUE OF SURVEYED ORGANISATIONS   40

A.6 ROLE OF SURVEYED INDIVIDUALS                     41

A.7 TYPES OF SURVEYED ORGANISATIONS                  42

B ANNEX: DEFINITIONS                                 43

B.1 FINANCIALS                                       43

B.2 INDUSTRIES                                       43

B.3 SECURITY DOMAINS                                 47

B.4 SECURITY ASSET TYPES                             49

                                                                           3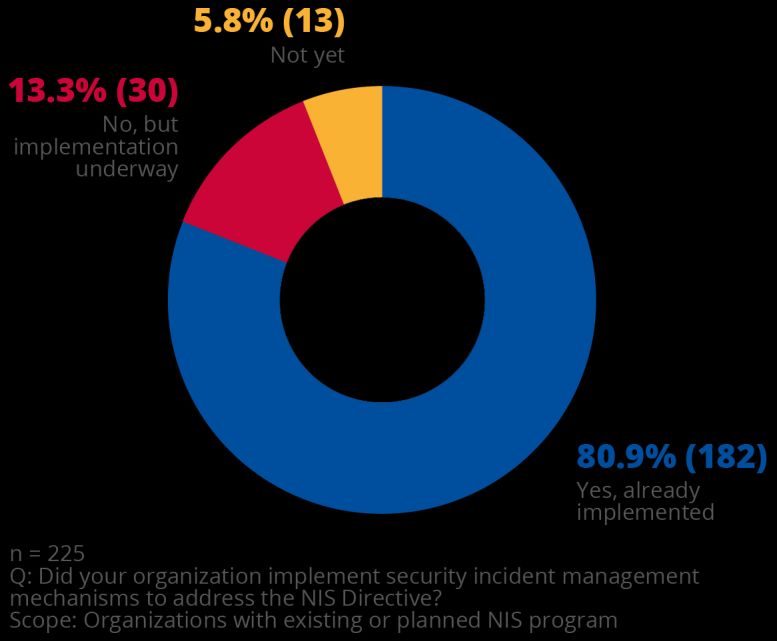
NIS INVESTMENTS
December 2020
EXECUTIVE SUMMARY
The Directive on Security of Network and Information Systems (NIS Directive) represents the
82% of surveyed
first EU-wide legislation on cybersecurity, with the objective to achieve a high common level of
cybersecurity across all European Union (EU) Member States. One of the three pillars of the organisations
NIS Directive is the implementation of risk management and reporting obligations for Operators acknowledge a
of Essential Services (OES) and Digital Service Providers (DSP). positive impact
of the NIS
Four years after the NIS Directive entered into force and two years after the transposition by
Directive on their
Member States into their national laws, this report presents the findings of a survey of 251
organisations across five EU Member States (France, Germany, Italy, Spain and Poland) with information
regards to NIS investments. The report depicts and analyses how OES and DSPs spend their security
information security budget and provides indications as to how this spending has been
influenced by the introduction of the NIS Directive. The results of this NIS survey were
correlated with Gartner security data and insights observed globally and in the EU in order to
better understand the current NIS Directive adoption dynamics and impact on related
investments.
This report provides comprehensive data and insights regarding the NIS Directive
adoption and the effects on the information security budget, staffing, solutions adoption
and security posture of organisations within its scope.
Overall, 82% of surveyed organisations acknowledge a positive impact of the NIS
Directive on their information security.
Regarding the NIS Directive implementation, the collected data revealed the following:
More than 80% of surveyed organisations declared that their NIS Directive
implementation program is either completed or in progress. The average NIS
implementation program is between 14 and 18 months
The average budget for NIS Directive implementation projects is approximately 175
K€, with 42.7% of affected organisations allocating between 100 and 250 K€. A little
under 50% of surveyed organisations had to hire additional security matter experts
(both internally and through staff augmentation), in the majority of cases hiring up to 4
FTEs
Surveyed organisations prioritised the following security domains: Governance, Risk
and Compliance (GRC), Network Security, Business Continuity Management (BCM)
and Vulnerability Management (VM).
When implementing the NIS Directive, 64% of surveyed organisations procured
security incident & event log collection solutions, as well as security awareness &
training services.
“Unclear expectations” and “Limited support from the national authority” are among the
top challenges faced by surveyed organisations when implementing the NIS Directive.
81% of the surveyed organisations have established a mechanism to report
information security incidents to their national authority, with the majority of surveyed
organisations allocating up to 4 people for incident reporting.
Nearly 60% of surveyed organisations reported major information security incidents.
43% of surveyed organisations experienced information security incidents with a direct
financial impact up to 500 k€.
4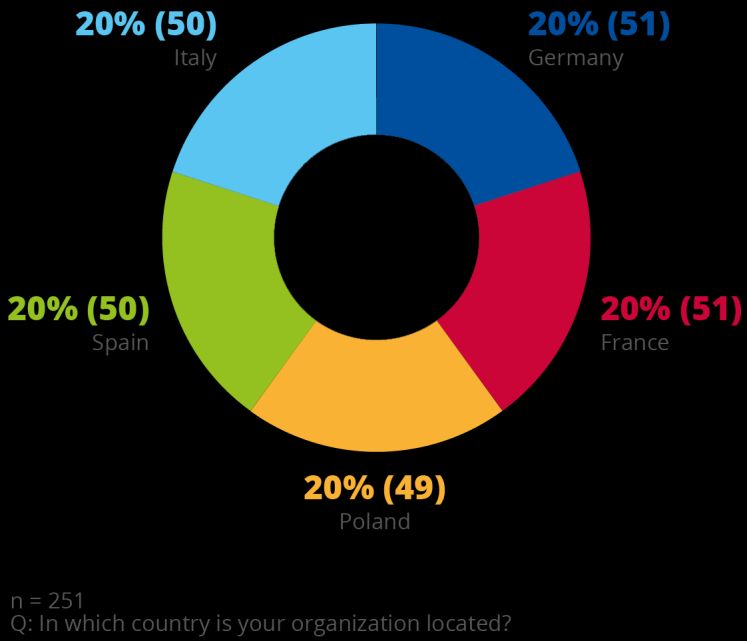
NIS INVESTMENTS
December 2020
1. INTRODUCTION
The Directive on Security of Network and Information Systems (NIS Directive)1 represents
the first EU-wide legislation on cybersecurity, with the objective to achieve a high common level
of cybersecurity for all EU Member States. One of the three pillars of the NIS Directive is the
implementation of risk management and reporting obligations for Operators of Essential
Services (OES) and Digital Service Providers (DSP). Annex II and Annex III of the NIS Directive
identify the following categories of operators / sectors as OES and DSPs respectively:
Table 1: Categories of OES and DSPs as defined in the NIS Directive
Categories of OES and DSPs
OES DSPs
Energy (electricity, oil and gas) Online marketplace
Transport (air, rail, water and road) Online search engine
Banking Cloud computing service
Financial market infrastructures
Health
Drinking water supply and distribution
Digital infrastructure
The objective of this report is to document how operators in these sectors invest in
cybersecurity and how the implementation of the NIS Directive has influenced this investment.
NIS investment data for this report was collected from two sources:
High-level insights on the EU cybersecurity market were drawn from Gartner’s
Research databases, combined with additional analysis of the current market
dynamics and latest forecasts.
To collect specific data on the NIS Directive, an ad hoc survey was conducted on
250+ European organisations identified as OES or DSPs
Surveyed organisations originated from five Member States chosen due to the size of their
information security market as well as the number of OES and DSPs declared: Germany,
France, Italy, Spain and Poland. Additional information on the methodology, rationale for
selecting these 5 MS and additional survey demographics is available in Annex A.
The target audience of this report are EU and National policy makers. As a secondary
audience, this report may provide useful information to OES and DSPs as well.
1
https://eur-lex.europa.eu/legal-content/FR/TXT/?uri=CELEX:32016L1148
5NIS INVESTMENTS
December 2020
2. INFORMATION SECURITY
DYNAMICS AND OUTLOOK
This chapter aims to provide a high-level view of the global information security trends and
outlook. It leverages data provided by Gartner, uncorrelated to the dedicated survey specifically
for NIS investments related to the implementation of the NIS Directive. The specific sources of
data for the following analysis include:
Gartner's IT Score for Security Management 2020 survey
Gartner IT Key Metrics Data 2020
Gartner forecast: IT security and Risk Management, Worldwide
It should be noted that the source of the data provided in chapter 2 (Gartner databases) is
different to the source of the data for chapter 3 (survey). Specifically:
The definitions of the industries in chapter 2 is not the same as the definitions of the
OES used in chapter 3. Moreover, data in chapter 2 also covers sectors that are not in
the NIS Directive.
The source of data in chapter 2 cover a broad EU Member State (MS) and
international scope, whereas data in chapter 3 was collected from OES in 5 MS
A detailed description of the relevant definitions is available in Annex B.
The reason this dataset is presented before the detailed data related to the NIS Directive
implementation is to provide a high level overview of the global market, including EU MS, in
terms of information security investments and highlight a few key statistics and trends. This
broader view serves as an introduction to the more focused analysis presented in
chapter 3 for OES and DSPs in the aforementioned EU Member States.
2.1 SECURITY BUDGETS
Data shows that the tracking and associated allocation of IT security budgets is still growing
within most organisations. Indeed, it is observed that 38% of surveyed organisations still do not
have a distinct security budget and 62% of organisations do not effectively communicate costs
associated to information security to business units and process owners.
Figure 1: Overview of budget issues
6NIS INVESTMENTS
December 2020
When looking at the ownership of Information security budgets and the lines of reporting, it can
be observed that information security is widely recognised as an IT discipline.
Figure 2: Ownership of Information security budgets and the lines of reporting
Organisations
Data shows that organisations allocate a rather stable share of their IT budget to information
security, with a relevant portion of around 6% since 2016. allocate a rather
stable share
The decline in IT Security spend Vs Overall IT Budget actually reflects an accelerated growth of
around 6% of
Overall IT Budget vs IT Security spend resulting in a ‘negative’ proportional trend.
their IT budget to
information
security
7NIS INVESTMENTS
December 2020
Figure 3: Global IT security spending as a share of total IT budget
When comparing organisations from the EU to organisations from the United States of America,
data shows that EU organisations allocate on average 41% less to information security than
their American counterparts.
Figure 4: IT security spending as a share of total IT budget by geography
The below breakdown analysis per industry highlights major discrepancies between different
sectors. The three industries with the highest Information Security (IS) spend as a percentage of
their overall IT budgets are Banking, Financial Services and Pharmaceuticals organisations,
with a ratio higher than 5%. Transportation, Education and Retail are the sectors with the lowest
such ratios, all below 2,5%.2
2
As previously stated, the definition of the industries is not directly related to the definition of the sectors in the NIS
Directive used in chapter 3 of this report. The relevant definitions are available in Annex B.
8NIS INVESTMENTS
December 2020
Figure 5: IT security spending as a share of total IT budget by industry
9NIS INVESTMENTS
December 2020
2.2 INFORMATION SECURITY SPEND DISTRIBUTION
The analysis of the information security budget distribution across various information security
domains (see appendix for the definition of the information security domains) gives further
insights to the type of investment organisations are making3.
In summary:
Vulnerability management and security analytics investments focus on proactive
capabilities for minimising the impact of any breaches once they have occurred.
Application security is how the application was designed and developed, how it’s
operated, and how the application and its supporting elements (network, OS, database
etc.) are configured and deployed to ensure security.
Governance, risk, and compliance management (GRC) focuses on how organisations
deal with their unique set of risks by developing strategies, policies, standards and
awareness that underpin security services. GRC ensures that risk is managed openly
and effectively, that legal and regulatory compliance requirements are met and that
information security is embedded throughout the organisation
Network security, Identity and Access Management (IAM), endpoint security and data
security are part of the operational infrastructure security, which focuses on protecting
the network, hosts and data and on ensuring secure access to systems for authorised
users.
Data indicates that the top 3 domains in terms of spending are:
Vulnerability Management and Security Analytics with a share of 20%
Governance, Risks and Compliance (GRC) with a share of 18%
Network Security with a share of 17%
This distribution between the different functional areas has been quite stable over the last four
years, but, although quite similar when comparing organisations in the EU and US, varies
greatly between industries.
Figure 6: IT security spending distribution by functional area
3
Annex B provides detailed definitions for the security domains referenced in chapter 2.
10NIS INVESTMENTS
December 2020
Software Publishing and Internet Services 39% 35% 3% 14% 3% 3% 3%
Pharmaceuticals 35% 25% 12% 5% 7% 12% 4%
Insurance 28% 20% 24% 10% 6% 6% 6%
CPG 25% 20% 20% 5% 5% 20% 5%
Government 25% 14% 10% 27% 6% 11% 7%
Resources 22% 19% 14% 13% 8% 14% 11%
Professional Services 22% 17% 15% 16% 12% 10% 8%
Banking & Financial Services 22% 19% 13% 14% 13% 11% 8%
Transportation 22% 14% 20% 17% 6% 5% 16%
Manufacturing 19% 19% 15% 16% 9% 15% 7%
Cross industry EU avg 19% 19% 17% 16% 9% 12% 9%
Cross industry US avg 19% 18% 17% 13% 13% 12% 8%
Energy 18% 27% 10% 12% 15% 11% 7%
Utilities 17% 11% 24% 11% 8% 18% 11%
Education 16% 28% 11% 16% 11% 12% 7%
Retail 11% 23% 17% 26% 6% 10% 7%
Government 11% 14% 28% 18% 9% 9% 12%
Food and Beverage Processing 10% 5% 38% 10% 8% 23% 8%
Electronics 8% 9% 20% 16% 14% 17% 16%
Vulnerability Governance, Network Application Identity & Endpoint Data
Risks & Security Security access Security Security
management
Compliance
management
Source: Gartner ITKMD 2020 data, Scope: EU countries + UK and US for reference
In terms of asset class, it is observed that the main area of spending for information security is
Personnel (37%), followed by Software (27%) and Hardware (21%). The share of external
services such as advisory, outsourcing or cloud services is only 15%.
Figure 7: IT security spending distribution by asset class
11NIS INVESTMENTS
December 2020
2.3 INFORMATION SECURITY STAFFING
The demand for information security trained resources is very high and still growing. Many
organisations are facing real issues in hiring resources with the required skillset & experience.
As such, it is foreseen that the number of unfilled information security positions will reach 3.5
million globally by 2022, going up from 1 million in 2016.
Figure 8: Information Security Staffing
Even though the demand for security resources is already high and growing, due to the ongoing
scarcity of these resources in the market, the share of information security resources within the
overall IT staff does not increase.
As of 2020, information security staff represents 5,6% of total IT staff, measured in terms of
FTEs. (Information security personnel includes in-house and contract full-time equivalents
supporting the IT security domains).
Figure 9: Information Security FTEs as a share of total IT staff
On top of the overall lack of security resources, there is also a change in the security skills that
are in demand. This change directly reflects the increasing use of automation in information
security.
Skills that were in high demand in the previous years such as Manual Penetration Testing, Tier
1/2 SOC Analysis or Technology Management are now decreasing in value and are being
replaced by skills in Risk Management, Service Management, Incident Response, Threat
Intelligence, Data Science and Analysis or Coding.
12NIS INVESTMENTS
December 2020
Figure 10: Change the security skills demand
2.4 INFORMATION SECURITY MARKET OUTLOOK
Forecasted growth rates for 2020 through 2024 have recently been substantially revised in
alignment with the revised outlook driven by post-COVID-19 IT spending. Figure below shows
the overall information security and risk management spending and the compound annual
growth rate (CAGR) for 2019 through 2024.
Figure 11: IT security Forecast — Compound Annual Growth Rate (CAGR), 2019 - 2024 (%)
Cloud Access Security Brokers 33%
Network Detection and Response 21%
Access mgt. 19%
Encryption 19%
Threat Intelligence 16%
Endpoint Protection Platform (Enterprise) 14%
Secure E-mail Gateway 13%
Privileged Access mgt. 11%
Enterprise Data Loss Prevention 11%
Network Access Control 11%
Secure Web Gateway 10%
Security Information and Event mgt. (SIEM) 10%
Consulting 9%
Web Application Firewalls 9%
Vulnerability Assessment 8%
Tokenization 8%
Integrated Risk mgt. Solutions 8%
Application Security Testing 7%
IT Outsourcing 7%
Other Information Security 6%
Firewall Equipment 6%
Identity Governance and Administration 6%
User Authentication 5%
Implementation 4%
Hardware Support 4%
Consumer Security 4%
Source: Gartner Forecast: IT security and Risk Management, Worldwide, 2019 - 2024, 3Q20 Update
13NIS INVESTMENTS
December 2020
The fastest growing security segment is Cloud Access Security Brokers (CASB), albeit being
one of the smallest security segments listed. The reason cloud security continues to grow, even
in these difficult economic times, is largely because of its role in digital transformation,
protecting data and user access to Software as a Service (SaaS) services. As organisations
look to support remote workers and continue to move business services to the cloud, CASB is a
key part of that security strategy.
Another security segment that is continuing to grow despite the current economic situation is the
Identity and Access Management segment, including four sub-segments: Access Management
(AM), Identity Governance and Administration (IGA), Privileged Access Management (PAM),
and User Authentication. Indeed, organisations need to provide secure access to their remote
workforce users, including IT users with privileged access. The use of cloud technologies has
also shifted the need from a perimeter-based approach to an identity and context-based
approach.
2.5 TRENDS ON SECURITY INCIDENTS LIABILITY
It is forecasted by Gartner that by 2024 liability for cyber physical systems (CPS)
incidents (impacting human safety or the environment) will break through the corporate
protective barrier to personal liability for 75% of CEOs.
Regulators and governments around the world are expected to strengthen laws and regulations
for CPS as they are viewed as critical systems where incidents can result in physical harm to
people, destruction of property or environmental disasters.
This trend may result CEOs no longer being able to hide behind complex corporate
organisational hierarchies, a potential ‘lack of knowledge’, processes, or insurance policies. This
will be the case particularly in asset-intensive, critical infrastructure and clinical healthcare
environments that extensively use CPS, or for organizations that sell CPS to others.
An example of this trend is the Corporate Executive Accountability Act introduced in the U.S.
Senate in 20194. This development would render CEOs liable for their companies' failure to
implement basic security measures that would have prevented a fatal CPS incident.
If not through a legal action, CEOs may find themselves responsible in front of the
shareholders. There already exists several recent examples: The Yahoo breach settlement5
opened the doors to company officers being directly sued by shareholders. The judge in the
legal proceedings following the Equifax breach refused to dismiss a suit against the former
company CEO6; a suit against the company Chegg and its CEO claiming they failed to disclose
a lack of security measures has been filed7; and Marriott International shareholders filed a
similar suit against that company’s officers8.
4
https://www.congress.gov/bill/116th-congress/senate-bill/1010
5
https://www.natlawreview.com/article/court-approves-class-action-settlement-re-yahoo-inc-customer-data-security-breach
6
https://www.reuters.com/article/otc-equifax-frankel-idUSKCN1PN2TJ
7
https://in.reuters.com/article/dataprivacy-chegg/chegg-data-breach-lawsuit-heads-to-arbitration-idUSL2N2CG2JU
8
https://www.reuters.com/article/us-britain-marriott-dataprotection-idUSKCN25F0S2
14NIS INVESTMENTS
December 2020
3. INFORMATION SECURITY
INVESTMENTS FOR THE NIS
DIRECTIVE IMPLEMENTATION
3.1 INFORMATION SECURITY SPEND IN THE NIS DIRECTIVE SECTORS
The surveyed organisations represent a large range of information technology budgets, ranging
from SMEs devoting less than 5 M€ to IT, to multinational corporations with more than one
billion euros of IT spending, reflecting the diversity of actors identified as OES and DSPs by
national authorities.
Figure 12: IT budget range of surveyed organisations
More than 1Bn€ 6,4% (16)
750 - 1000 M€ 5,2% (13)
500 - 750 M€ 3,2% (8)
250 - 500 M€ 10,4% (26)
100 - 250 M€ 17,5% (44)
50 - 100 M€ 13,9% (35)
10 - 50 M€ 17,9% (45)
5 - 10 M€ 5,2% (13)
Less than 5M€ 10% (25)
Don't know 10,4% (26)
n = 251
Q: What is your organization estimated IT budget range for 2019 (including hardware, software, internal
personnel, contractors and outsourcing spend)?
15NIS INVESTMENTS
December 2020
Figure 13: IT budget range of surveyed organisations by industry
B anking 0,0% 0,0% 17,5% 5,0% 22,5% 10,0% 2,5% 15,0% 15,0% 12,5%
Clo ud co mputing 8,0% 16,0% 12,0% 16,0% 0,0% 12,0% 0,0% 4,0% 16,0% 16,0%
Digital infra. 44,0% 8,0% 16,0% 4,0% 4,0% 8,0% 0,0% 4,0% 4,0% 8,0%
Drinking water 0,0% 6,7% 46,7% 40,0% 0,0% 6,7% 0,0% 0,0% 0,0% 0,0%
Energy 0,0% 0,0% 0,0% 23,3% 33,3% 16,7% 6,7% 10,0% 3,3% 6,7%
Financial market infra. 0,0% 26,7% 20,0% 20,0% 13,3% 6,7% 0,0% 6,7% 0,0% 6,7%
Healthcare 5,7% 0,0% 22,9% 25,7% 22,9% 11,4% 2,9% 0,0% 0,0% 8,6%
Online M arketplace 12,0% 4,0% 24,0% 0,0% 4,0% 4,0% 12,0% 4,0% 16,0% 20,0%
Transpo rt 11,4% 2,9% 20,0% 8,6% 34,3% 14,3% 0,0% 0,0% 0,0% 8,6%
Overall 9,0% 5,3% 18,4% 14,3% 17,6% 10,6% 2,9% 5,3% 6,5% 10,2%
5M €o r less 5 - 10 M € 11- 50 M € 50 - 100 M € 100 - 250 M € 250 - 500 M € 500 - 750 M € 750 - 1,000 M € 1B n€o r mo re Do esn't kno w
This diversity can also be observed in the ranges of Information Security budgets, ranging from
less than 100 K€ to above 100 M€, with the highest percentage of Information Security budget
range among the surveyed organisations being 10 – 25 M€.
Figure 14: Information security budget range of surveyed organisations
More than 100 M€ 11,6% (29)
50 - 100 M€ 13,1% (33)
25 - 50 M€ 15,1% (38)
10 - 25 M€ 17,9% (45)
5 - 10 M€ 11,6% (29)
1 - 5 M€ 10,8% (27)
500 K€ - 1 M€ 4,8% (12)
100 - 500 K€ 8,4% (21)
Less than 100K€ 0,8% (2)
Don't know 6% (15)
n = 251
Q: What is your organization estimated information security budget range for 2019 (including hardware,
software, internal personnel, contractors and outsourcing spend)?
16NIS INVESTMENTS
December 2020
Figure 15: Information security budget range of surveyed organisations by sector
B anking 0,0% 2,5% 0,0% 10,0% 5,0% 15,0% 22,5% 20,0% 20,0% 5,0%
Clo ud co mputing 0,0% 12,0% 12,0% 12,0% 4,0% 16,0% 0,0% 16,0% 20,0% 8,0%
Digital infra. 8,0% 32,0% 16,0% 20,0% 4,0% 0,0% 4,0% 4,0% 12,0% 0,0%
Drinking water 0,0% 0,0% 0,0% 33,3% 40,0% 20,0% 0,0% 6,7% 0,0% 0,0%
Energy 0,0% 0,0% 0,0% 0,0% 3,3% 30,0% 33,3% 20,0% 10,0% 3,3%
Financial market infra. 0,0% 0,0% 6,7% 20,0% 20,0% 33,3% 0,0% 6,7% 6,7% 6,7%
Healthcare 0,0% 5,7% 0,0% 11,4% 14,3% 22,9% 20,0% 17,1% 0,0% 8,6%
Online M arketplace 0,0% 8,0% 8,0% 0,0% 24,0% 0,0% 4,0% 12,0% 32,0% 12,0%
Transpo rt 0,0% 11,4% 0,0% 8,6% 11,4% 28,6% 25,7% 8,6% 0,0% 5,7%
Overall 0,8% 8,2% 4,1% 11,0% 11,8% 18,4% 15,1% 13,5% 11,4% 5,7%
M o re than Less than Do esn't
50 - 100 M € 25-100 M € 10-25 M € 5-10 M € 2-5 M € 0.5-1M € 100-500 K€
100 M € 100K€ kno w
The analysis of the financial data shows that there is a strong correlation between overall IT
budget and Information Security budget, as organisations with a higher IT budget will also The Information
spend more in information security. Security budget
ranges in these
figures refer to
Figure 16: Information Security budget vs. overall IT budget for surveyed organisations
investments
directly related to
5M €o r less 5 - 10 M € 11- 50 M € 50 - 100 M € 100 - 250 M € 250 - 500 M € 500 - 750 M € 750 - 1,000 M € 1B n€o r mo re Do esn't kno w NIS products and
services. They do
not include for
M o re than 100 M € 0,0% 0,0% 0,0% 0,0% 0,0% 7,7% 62,5% 30,8% 93,8% 11,5%
instance additional
budget forecasted
50 - 100 M € 0,0% 0,0% 0,0% 2,9% 2,3% 73,1% 25,0% 46,2% 6,3% 11,5%
for built-in security
features in non-
25-100 M € 0,0% 0,0% 0,0% 0,0% 63,6% 19,2% 12,5% 15,4% 0,0% 7,7% NIS products.
10-25 M € 0,0% 0,0% 8,9% 74,3% 34,1% 0,0% 0,0% 0,0% 0,0% 0,0%
5-10 M € 0,0% 0,0% 46,7% 22,9% 0,0% 0,0% 0,0% 0,0% 0,0% 0,0%
2-5 M € 0,0% 53,8% 42,2% 0,0% 0,0% 0,0% 0,0% 0,0% 0,0% 3,8%
0.5-1M € 24,0% 30,8% 2,2% 0,0% 0,0% 0,0% 0,0% 0,0% 0,0% 3,8%
100-500 K€ 68,0% 15,4% 0,0% 0,0% 0,0% 0,0% 0,0% 7,7% 0,0% 3,8%
Less than 100K€ 8,0% 0,0% 0,0% 0,0% 0,0% 0,0% 0,0% 0,0% 0,0% 0,0%
Do esn't kno w 0,0% 0,0% 0,0% 0,0% 0,0% 0,0% 0,0% 0,0% 0,0% 57,7%
17NIS INVESTMENTS
December 2020
3.2 NIS DIRECTIVE IMPLEMENTATION
3.2.1 Current state
As of November 2020, more than 80% of surveyed organisations declared that their NIS
Directive implementation program is either completed or in progress and 8% of surveyed
organisations plan to implement the NIS Directive but have not started yet.
For the 10% remaining that do not intend to launch a dedicated program or projects, less than
1% actually do not plan to implement the NIS Directive at all, while the rest will leverage some
of its key requirements to improve and guide their information security practices.
Figure 17: Current state of NIS Directive implementation among surveyed organisations
Minor differences can be observed when comparing the NIS Directive implementation status
between operators in different MS. An interesting find is that 10% of all surveyed organisations
are not following an NIS Directive implementation program but are using the NIS Directive as
best practice.
Figure 18: Current state of NIS Directive implementation per country
France 2,0% 7,8% 5,9% 17,6% 66,7%
Germany 0,0% 3,9% 5,9% 19,6% 70,6%
Italy 0,0% 8,0% 8,0% 20,0% 64,0%
Poland 0,0% 16,3% 10,2% 30,6% 42,9%
Spain 0,0% 14,0% 10,0% 28,0% 48,0%
Overall 0,4% 10,0% 8,0% 23,1% 58,6%
Leveraged as Work in
Not planned Planned Completed
best practices progress
18NIS INVESTMENTS
December 2020
The analysis also shows additional differentiation between sectors as regards the Over 75% of
implementation of the NIS Directive. For instance, more than three quarters of surveyed
organisations in the Banking and Energy sectors have fully implemented the Directive, well
surveyed
above the cross-sector average (58.8%). organisations in
the Banking and
Furthermore the percentage of surveyed organisations that declared they will not directly Energy sectors
implement the NIS Directive, but will instead leverage its principles as best practices, varies have fully
substantially across the different sectors.
implemented the
Figure 19: Current state of the NIS Directive implementation per sector Directive, well
above the cross-
sector average
Banking 0,0% 2,5% 5,0% 15,0% 77,5% (58.8%)
Cloud computing 0,0% 16,0% 8,0% 20,0% 56,0%
Digital infra. 4,0% 24,0% 24,0% 16,0% 32,0%
Drinking water 0,0% 26,7% 0,0% 40,0% 33,3%
Energy 0,0% 0,0% 0,0% 23,3% 76,7%
Financial market infra. 0,0% 6,7% 20,0% 6,7% 66,7%
Healthcare 0,0% 5,7% 5,7% 37,1% 51,4%
Online Marketplace 0,0% 12,0% 0,0% 20,0% 68,0%
Transport 0,0% 11,4% 8,6% 28,6% 51,4%
Overall 0,4% 10,2% 7,3% 23,3% 58,8%
Leveraged as Work in
Not planned Planned Completed
best practices progress
3.2.2 NIS Directive implementation program timeline
The majority of organisations falling under the provisions of the NIS directive report having
launched implementation projects by the end of 2019 (64,2% of surveyed organisations), and
nearly a third by the end of 2018, year of transposition into nation law and identification of OES
and DSPs. With 16,4% of organisations having started the implementation in 2020, there
remains an 8% of organisations that will implement the NIS Directive in the future, from 2021
onwards. Furthermore, the analysis shows that implementation projects of the NIS Directive
typically last between 14 and 18 months, with little differentiation between countries or sectors.
19NIS INVESTMENTS
December 2020
Figure 20: Duration of NIS Directive implementation program among surveyed organisations (in
months)
More than 20 0% (0)
18-20 8% (18)
16 - 18 25,8% (58)
14 - 16 35,1% (79)
12 - 14 18,7% (42)
Less than 12 12,4% (28)
n = 225
Q: What are the start date and estimated duration of the NIS program or projects?
Scope: Organizations with existing or planned NIS program
Figure 21: Start year of NIS Directive implementation program among surveyed organisations
2017 1,3% (3)
2018 36% (81)
2019 38,2% (86)
2020 16,4% (37)
2021 6,7% (15)
2022 or later 1,3% (3)
n = 225
Q: What are the start date and estimated duration of the NIS program or projects?
Scope: Organizations with existing or planned NIS program
Variance between countries in terms of project initiation start dates can be explained by timeline
differences in the transposition of the NIS Directive into national laws, including the publication
of detailed requirements9.
9
https://www.enisa.europa.eu/topics/nis-directive/nis-visualtool
20NIS INVESTMENTS
December 2020
Figure 22: NIS Directive implementation program start year per country
France 2,2% 50,0% 28,3% 13,0% 4,3% 2,2%
Germany 4,1% 40,8% 36,7% 12,2% 6,1% 0,0%
Italy 0,0% 37,0% 43,5% 13,0% 4,3% 2,2%
Poland 0,0% 19,5% 43,9% 24,4% 12,2% 0,0%
Spain 0,0% 30,2% 39,5% 20,9% 7,0% 2,3%
Grand Total 1,3% 36,0% 38,2% 16,4% 6,7% 1,3%
2017 2018 2019 2020 2021 2022 or later
The analysis of the start year per sector correlates with previous findings indicating that
operators from the Banking and Energy sectors were ahead of the curve in terms of
implementation: more than 50% of organisations started their NIS Directive programs in 2018,
compared with an average baseline of approximately a third among all sectors.
Figure 23: NIS Directive implementation program start year per sector
Banking 0,0% 51,3% 33,3% 10,3% 5,1% 0,0%
Cloud computing 0,0% 28,6% 38,1% 23,8% 9,5% 0,0%
Digital infra. 0,0% 22,2% 38,9% 11,1% 22,2% 5,6%
Drinking water 0,0% 9,1% 54,5% 36,4% 0,0% 0,0%
Energy 0,0% 63,3% 23,3% 13,3% 0,0% 0,0%
Financial market infra. 0,0% 21,4% 50,0% 7,1% 21,4% 0,0%
Healthcare 0,0% 33,3% 39,4% 21,2% 3,0% 3,0%
Online Marketplace 4,5% 36,4% 40,9% 18,2% 0,0% 0,0%
Transport 3,2% 25,8% 45,2% 19,4% 6,5% 0,0%
Overall 0,9% 36,5% 38,4% 16,9% 6,4% 0,9%
2017 2018 2019 2020 2021 2022 or later
21NIS INVESTMENTS
December 2020
3.3 NIS DIRECTIVE RESOURCES
3.3.1 NIS dedicated budget
Disclaimer: for the following financial figures, it is important to bear in mind
the following limitations.
While low levels of investments cannot be sustained without adverse
impact on the information security readiness, higher spending does
not necessarily correlate with an associated improved maturity
Certain cybersecurity expenditures are not accurately captured
such as secure-by-design ICT products and services, that elevate the
overall security level of an organisation, but do not fall under
specialised security-related budgets
The average budget for NIS Directive implementation projects is approximately 175 K€, with
42.7% of affected organisations allocating between 100 and 250 K€. Such amounts typically
represent a low share of the organisations’ overall Information Security budgets.
Figure 24: Dedicated NIS Directive budget among surveyed organisations
More than 10 M€ 0% (0)
7.5 - 10 M€ 0% (0)
5 - 7.5 M€ 0% (0)
2.5 - 5 M€ 0,4% (1)
1 - 2.5 M€ 1,8% (4)
250 - 1000 K€ 22,2% (50)
100 - 250 K€ 42,7% (96)
50 - 100 K€ 23,1% (52)
Less than 50 K€ 8,9% (20)
No dedicated budget 0,9% (2)
n = 225
Q: What is the estimated budget of your organization dedicated to the NIS program or projects?
Scope: Organizations with existing or planned NIS program
The NIS Directive dedicated budgets are broadly similar and mostly fall in the 100 to 250 K€
range across all countries in scope of the survey.
22NIS INVESTMENTS
December 2020
Figure 25: Dedicated NIS Directive budget per country
France 6,5% 17,4% 60,9% 15,2% 0,0% 0,0% 0,0%
Germany 6,1% 28,6% 42,9% 20,4% 2,0% 0,0% 0,0%
Italy 10,9% 19,6% 30,4% 32,6% 4,3% 0,0% 2,2%
Poland 14,6% 26,8% 31,7% 26,8% 0,0% 0,0% 0,0%
Spain 7,0% 23,3% 46,5% 16,3% 2,3% 2,3% 2,3%
Grand Total 8,9% 23,1% 42,7% 22,2% 1,8% 0,4% 0,9%
no dedicatedNIS INVESTMENTS
December 2020
The analysis of the NIS security program budget against the organisations’ information security
budget shows a correlation between the two figures, though more limited than the link existing
between information security budget and IT budget as reflected in Figure . This is mostly due to
the fact that more than 80% of surveyed organisations allocated less than 1 M€ of budget to
their NIS-related security program.
Figure 27: NIS Directive implementation budget vs. overall information security budget for
surveyed organisations
100K€ 100 M€
100-500 K€ 0.5-1 M€ 1-5 M€ 5-10 M€ 10-25 M€ 25-100 M€ 50 - 100 M€ Doesn't know
or less or more
5M€ or more 0,0% 0,0% 0,0% 0,0% 0,0% 0,0% 0,0% 0,0% 0,0% 0,0%
2.5 - 5 M€ 0,0% 0,0% 0,0% 0,0% 0,0% 0,0% 0,0% 0,0% 3,4% 0,0%
1 - 2.5 M€ 0,0% 0,0% 0,0% 0,0% 0,0% 2,3% 0,0% 3,0% 6,9% 0,0%
0.25 - 1 M€ 0,0% 0,0% 0,0% 0,0% 4,0% 4,5% 21,1% 45,5% 72,4% 23,1%
100 - 250 K€ 0,0% 0,0% 10,0% 20,0% 56,0% 59,1% 68,4% 45,5% 17,2% 38,5%
50 - 100 K€ 0,0% 54,5% 50,0% 45,0% 28,0% 31,8% 10,5% 6,1% 0,0% 38,5%
50 K€ or less 100,0% 45,5% 40,0% 30,0% 8,0% 2,3% 0,0% 0,0% 0,0% 0,0%
No NIS budget 0,0% 0,0% 0,0% 5,0% 4,0% 0,0% 0,0% 0,0% 0,0% 0,0%
24NIS INVESTMENTS
December 2020
3.3.2 NIS dedicated hires
The majority of affected organisations did not require additional staff to implement the NIS Amongst
Directive (50.7% of total respondents). Among those that did, ~29% filled that need by hiring organisations that
new staff, while the remainder had recourse to external contractors (20.4% of total employed
respondents).
additional staff to
Amongst organisations that employed additional staff to implement the NIS Directive, the
implement the NIS
large majority recruited up to 4 people. Directive, the large
majority recruited
Figure 28: NIS Directive-related hires amongst surveyed organisations up to 4 people.
This observation is valid across the EU MS in scope of the survey. Poland is the country where
the NIS Directive was mostly implemented with internal resources. On the other side,
organisations in Italy and France resorted more to new hires, while organisations in Germany
and Spain made a more intensive use of external contractors.
Figure 29: Additional staff hired to implement the NIS Directive per country
France 45,7% 19,6% 34,8%
Germany 49,0% 28,6% 22,4%
Italy 47,8% 15,2% 37,0%
Poland 63,4% 12,2% 24,4%
Spain 48,8% 25,6% 25,6%
Grand Total 50,7% 20,4% 28,9%
No additional Only
New hires
staff contractors
25NIS INVESTMENTS
December 2020
Banking, Healthcare and Energy OES were more likely to have hired additional staff to
implement the NIS Directive (respectively 43,6%, 42,4% and 40,0% vs. 29,7% on average).
Conversely, organisations in the Cloud computing, Transport and Online marketplace sectors
appear to have relied the least on additional staff.
Figure 30: Additional staff hired to implement the NIS Directive per sector
B anking 46,2% 10,3% 43,6%
Clo ud co mputing 71,4% 14,3% 14,3%
Digital infra. 44,4% 38,9% 16,7%
Drinking water 45,5% 45,5% 9,1%
Energy 50,0% 10,0% 40,0%
Financial market infra. 28,6% 35,7% 35,7%
Healthcare 36,4% 21,2% 42,4%
Online M arketplace 63,6% 27,3% 9,1%
Transpo rt 64,5% 9,7% 25,8%
Overall 50,7% 19,6% 29,7%
No additio nal Only
New hires
staff co ntracto rs
Figure 31: Number of additional staff hired to implement the NIS Directive among surveyed
organisations
10+ 3,1% (2)
9 0% (0)
8 0% (0)
7 1,5% (1)
6 9,2% (6)
5 6,2% (4)
4 26,2% (17)
3 32,3% (21)
2 18,5% (12)
1 3,1% (2)
n = 65
Q: Regarding last three years, did your organization hire additional security staff specifically to implement the NIS
Directive? If yes, how many?
Scope: Organizations with existing or planned NIS program that hired new staff to implement NIS Directive
26NIS INVESTMENTS
December 2020
3.4 NIS DIRECTIVE SECURITY IMPACT
3.4.1 Impact on information security domains
According to surveyed organisations, the most frequently cited domains impacted by the NIS
Directive implementation are:
Governance, Risks and Compliance (64.5%), which was to be expected since the
NIS Directive itself is a legislative document.
Network Security (48.6%), which can be explained by the NIS provisions on security
incidents detection and reporting requirements.
Business Continuity Management (33.1%), also related to the management of
security incidents.
Figure 32: Information security domains prioritised for NIS investments among surveyed
organisations
Governance, Risk & Compliance 64,5% (162)
Network Security 48,6% (122)
BCM (*) 33,1% (83)
Vulnerability Management 23,9% (60)
Data Security 17,9% (45)
Applications Security 4% (10)
Physical Security 1,6% (4)
IAM (**) 1,2% (3)
Endpoint Security 1,2% (3)
Security Analytics 0% (0)
n = 225
Q: What are the top 3 security domains where your organization invested the most to implement the NIS Directive?
Scope: Organizations with existing or planned NIS program, (*) = Business Continuity Management (**) = Identity Access Management
Figure 33: Information security domains prioritised for NIS investments per country
France 5,9% 17,6% 25,5% 43,1% 0,0% 49,0% 0,0% 72,5% 35,3% 2,0%
Germany 3,9% 9,8% 25,5% 58,8% 0,0% 51,0% 3,9% 62,7% 39,2% 2,0%
Italy 4,0% 14,0% 32,0% 46,0% 2,0% 52,0% 0,0% 66,0% 30,0% 4,0%
Poland 2,0% 18,4% 16,3% 44,9% 4,1% 55,1% 0,0% 59,2% 30,6% 0,0%
Spain 4,0% 30,0% 20,0% 50,0% 0,0% 40,0% 2,0% 62,0% 30,0% 0,0%
Overall 4,0% 17,9% 23,9% 48,6% 1,2% 49,4% 1,2% 64,5% 33,1% 1,6%
Identity and Governance, Business
Applications Vulnerability Network Endpoint Security Physical
Data Security Access Risk and Continuity
Security Management Security Security Analytics Security
Management Compliance Management
27NIS INVESTMENTS
December 2020
Figure 34: Information security domains prioritised for NIS investments per sector
Banking 10,0% 22,5% 37,5% 47,5% 0,0% 47,5% 0,0% 65,0% 40,0% 2,5%
Cloud computing 0,0% 24,0% 16,0% 40,0% 4,0% 56,0% 0,0% 56,0% 28,0% 0,0%
Digital infra. 8,0% 28,0% 4,0% 44,0% 4,0% 40,0% 4,0% 40,0% 28,0% 0,0%
Drinking water 0,0% 0,0% 13,3% 40,0% 0,0% 13,3% 6,7% 66,7% 40,0% 0,0%
Energy 6,7% 10,0% 30,0% 53,3% 0,0% 60,0% 3,3% 80,0% 36,7% 3,3%
Financial market infra. 0,0% 20,0% 13,3% 66,7% 0,0% 60,0% 0,0% 66,7% 26,7% 0,0%
Healthcare 2,9% 8,6% 31,4% 45,7% 2,9% 60,0% 0,0% 68,6% 25,7% 2,9%
Online Marketplace 4,0% 24,0% 24,0% 56,0% 0,0% 48,0% 0,0% 52,0% 36,0% 4,0%
Transport 0,0% 20,0% 20,0% 45,7% 0,0% 45,7% 0,0% 74,3% 37,1% 0,0%
Overall 4,1% 18,0% 23,3% 48,2% 1,2% 49,4% 1,2% 64,1% 33,5% 1,6%
Identity and Governance, Business
Applications Vulnerability Network Endpoint Security Physical
Data Security Access Risk and Continuity
Security Management Security Security Analytics Security
Management Compliance Management
3.4.2 Impact on procurement of technology and services
It is worth noting that NIS Directive investments did not seem to focus on new technologies. The
services most cited in the survey as NIS investment targets are:
Security incident & event log collection (64%), with an obvious relation to security
incident reporting requirement provisions of the Directive.
Security Awareness & training (63.6%)
Figure 35: Technologies and services procured to implement the NIS Directive
Security incident & event log collection 64% (144)
Security awareness & training 63,6% (143)
Network Intrusion Detection & Prevention 34,2% (77)
Business Continuity Management 32,9% (74)
Vulnerability Mgt. 28,4% (64)
Security Testing 27,6% (62)
Threat intelligence 25,3% (57)
Governance, Risk & Compliance 7,6% (17)
Multi Factor Authentication 4,9% (11)
None. 4,4% (10)
Device Encryption and Mgt. 4% (9)
Enterprise networks Scans 4% (9)
Mobile Deivice Mgt. 2,2% (5)
User Behavior Analytics 2,2% (5)
Managed Detection & Response 1,8% (4)
Next Generation Firewall 1,8% (4)
Privileged Account Mgt. 0,4% (1)
Physical Security 0,4% (1)
Anti-malware or eq. 0,4% (1)
Other 0% (0)
n = 225
Q: Which of the following technologies or services did you procure because of the NIS Directive implementation?
Scope: Organizations with existing or planned NIS program that planned further investments to NIS Directive-related
Note: Total does not add up to 100% since multiple answers could be selected by survey respondents
28NIS INVESTMENTS
December 2020
Figure 36: Technologies and services procured to implement the NIS Directive per country
France 2,0% 27,5% 2,0% 5,9% 5,9% 0,0% 5,9% 56,9% 0,0% 5,9% 3,9% 21,6% 2,0% 19,6% 25,5% 56,9% 31,4% 0,0% 3,9%
Germany 0,0% 31,4% 0,0% 0,0% 2,0% 2,0% 0,0% 64,7% 0,0% 7,8% 0,0% 27,5% 0,0% 25,5% 29,4% 62,7% 21,6% 0,0% 3,9%
Italy 4,0% 28,0% 4,0% 4,0% 8,0% 0,0% 2,0% 54,0% 0,0% 6,0% 2,0% 24,0% 0,0% 36,0% 26,0% 58,0% 26,0% 0,0% 2,0%
Poland 0,0% 34,7% 4,1% 2,0% 4,1% 0,0% 4,1% 59,2% 0,0% 8,2% 2,0% 20,4% 4,1% 20,4% 18,4% 57,1% 34,7% 0,0% 2,0%
Spain 2,0% 32,0% 0,0% 6,0% 2,0% 0,0% 6,0% 52,0% 2,0% 6,0% 0,0% 20,0% 4,0% 26,0% 24,0% 50,0% 34,0% 2,0% 8,0%
Overall 1,6% 30,7% 2,0% 3,6% 4,4% 0,4% 3,6% 57,4% 0,4% 6,8% 1,6% 22,7% 2,0% 25,5% 24,7% 57,0% 29,5% 0,4% 4,0%
Next Netw. Intrus. Mobile Device Device Multi Factor Privileged Enterprise Sec. incident Anti- Monitoring & Managed Threat User Behavior Vulnerability Security Security Business Physical None
Generation Detection & Management Encryp. & Auth. (MFA) Account Mgt. networks & event log virus/spyware/ Mgt. (SIEM) Detection & intelligence Analytics Mgt. Testing Awareness & Continuity Security
Firewall Prevention Mgt. (PAM) Scans collection malware Response Training Mgt. (BCM)
Figure 37: Technologies and services procured to implement the NIS Directive per sector
Banking 5,0% 30,0% 7,5% 5,0% 12,5% 0,0% 10,0% 52,5% 0,0% 7,5% 2,5% 22,5% 5,0% 30,0% 37,5% 67,5% 37,5% 0,0% 0,0%
Cloud computing 0,0% 32,0% 0,0% 4,0% 4,0% 0,0% 4,0% 36,0% 0,0% 8,0% 4,0% 16,0% 4,0% 28,0% 24,0% 68,0% 24,0% 0,0% 4,0%
Digital infra. 0,0% 32,0% 0,0% 4,0% 0,0% 0,0% 0,0% 52,0% 0,0% 0,0% 4,0% 16,0% 0,0% 20,0% 20,0% 56,0% 20,0% 0,0% 4,0%
Drinking water 0,0% 20,0% 0,0% 13,3% 6,7% 0,0% 0,0% 46,7% 0,0% 13,3% 0,0% 6,7% 0,0% 13,3% 33,3% 40,0% 26,7% 0,0% 6,7%
Energy 0,0% 30,0% 0,0% 0,0% 3,3% 3,3% 0,0% 83,3% 0,0% 10,0% 0,0% 33,3% 0,0% 26,7% 16,7% 50,0% 43,3% 0,0% 3,3%
Financial market infra. 0,0% 20,0% 0,0% 6,7% 6,7% 0,0% 0,0% 60,0% 0,0% 6,7% 0,0% 40,0% 13,3% 13,3% 33,3% 33,3% 13,3% 0,0% 6,7%
Healthcare 2,9% 34,3% 2,9% 0,0% 0,0% 0,0% 2,9% 57,1% 0,0% 5,7% 0,0% 14,3% 0,0% 40,0% 28,6% 60,0% 25,7% 0,0% 0,0%
Online Marketplace 4,0% 28,0% 4,0% 4,0% 8,0% 0,0% 8,0% 60,0% 4,0% 4,0% 4,0% 36,0% 0,0% 20,0% 12,0% 60,0% 28,0% 4,0% 8,0%
Transport 0,0% 34,3% 0,0% 2,9% 0,0% 0,0% 2,9% 60,0% 0,0% 8,6% 0,0% 22,9% 0,0% 22,9% 22,9% 54,3% 34,3% 0,0% 8,6%
Overall 1,6% 30,2% 2,0% 3,7% 4,5% 0,4% 3,7% 57,1% 0,4% 6,9% 1,6% 22,9% 2,0% 25,7% 25,3% 56,7% 29,8% 0,4% 4,1%
Next Netw. Intrus. Mobile Device Device Multi Factor Privileged Enterprise Sec. incident Anti- Monitoring & Managed Threat User Behavior Vulnerability Security Security Business Physical None
Generation Detection & Management Encryp. & Auth. (MFA) Account Mgt. networks & event log virus/spyware/ Mgt. (SIEM) Detection & intelligence Analytics Mgt. Testing Awareness & Continuity Security
Firewall Prevention Mgt. (PAM) Scans collection malware Response Training Mgt. (BCM)
3.5 NIS DIRECTIVE IMPLEMENTATION CHALLENGES
Almost all OES and DSPs surveyed reported having faced at least one serious challenge while
implementing the NIS Directive. Irrespective of organisations’ current implementation state, the
challenges that were most cited were the following:
The prioritisation of other regulations e.g. GDPR.
The existence of stronger local regulations e.g. France’s “Loi de Programmation
Militaire” (LPM).
The lack of clarity of the NIS Directive expectations after transposition into national law.
However, as regards the organisations that do not have a dedicated NIS Directive
implementation project, then internal challenges rise to prominence: the lack of resources
(34.6% of such respondents), lack of skills (30.8%) or lack of collaboration (30.8%).
29NIS INVESTMENTS
December 2020
Figure 38: Main challenges in implementing the NIS Directive amongst surveyed organisations
52%
Other regulations prioritized
38,5%
33,3%
Stronger local regulations
53,8%
32%
Unclear expectations
38,5%
22,7%
Limited support from nat. Authority
15,4%
20,9%
Multi-department collaboration issues
30,8%
18,7%
Lack of resources
34,6%
15,6%
Lack of NIS security solutions
7,7%
12,9%
Lack of internal skills
30,8%
4,9%
No challenge
0%
n = 251
Q: In your opinion, what are the main challenges to implement the NIS Directive in your organization?
Note: Totals do not add up to 100% since multiple answers could be selected by survey respondents
For all countries in scope of the survey, the prioritisation of other regulations is the most
frequently cited challenge to implement the NIS Directive, with the exception of France, for
which organisations cited the existence of stronger regulations, such as the LPM.
The lack of clarity in the expectations of national competent authorities is also a relatively
common denominator in all countries, with around 30% of organisations on average citing it as
a challenge to implement the NIS Directive.
Figure 39: NIS Directive implementation challenges per country
France 23,9% 13,0% 23,9% 23,9% 8,7% 52,2% 58,7%
Germany 30,6% 20,4% 16,3% 26,5% 18,4% 49,0% 20,4%
Italy 37,0% 8,7% 17,4% 21,7% 28,3% 52,2% 41,3%
Poland 36,6% 7,3% 17,1% 14,6% 31,7% 56,1% 22,0%
Spain 32,6% 14,0% 18,6% 16,3% 27,9% 51,2% 23,3%
Grand Total 32,0% 12,9% 18,7% 20,9% 22,7% 52,0% 33,3%
Limited Other
Unclear Lack of Collaboration Stronger local
Lack of skills support from regulations
implications resources issues regulations
nat. authority prioritized
30NIS INVESTMENTS
December 2020
For the large majority of sectors, other regulations pose the main challenge faced when
implementing the NIS Directive, whether due to their prioritisation or the existence of stronger
local rules / regulatory requirements.
A sizeable share of Digital infrastructure, Financial Market Infrastructure and to a lesser extent
Online Marketplace organisations state the scarcity of resources devoted to the NIS Directive as
challenge to its implementation.
Finally, the implications of the NIS Directive seem well grasped by Cloud computing
organisations, as less than one in ten cite it as a challenge to set up the Directive, compared to
nearly a third of all NIS affected organisations across the rest of the sectors.
Figure 40: NIS Directive implementation challenges per sector
Banking 38,5% 10,3% 10,3% 15,4% 7,7% 51,3% 28,2%
Cloud computing 9,5% 19,0% 14,3% 14,3% 14,3% 57,1% 33,3%
Digital infra. 38,9% 27,8% 50,0% 11,1% 33,3% 44,4% 50,0%
Drinking water 36,4% 18,2% 27,3% 18,2% 18,2% 54,5% 18,2%
Energy 23,3% 3,3% 3,3% 26,7% 26,7% 50,0% 26,7%
Financial market infra. 42,9% 7,1% 50,0% 21,4% 35,7% 42,9% 7,1%
Healthcare 30,3% 15,2% 9,1% 33,3% 33,3% 51,5% 48,5%
Online Marketplace 27,3% 9,1% 31,8% 4,5% 22,7% 59,1% 54,5%
Transport 38,7% 12,9% 6,5% 25,8% 22,6% 51,6% 22,6%
Overall 31,5% 12,8% 17,8% 20,1% 22,8% 51,6% 33,3%
Limited Other
Unclear Lack of Collaboration Stronger local
Lack of skills support from regulations
implications resources issues regulations
nat. authority prioritized
3.6 INFORMATION SECURITY INCIDENTS
3.6.1 Information security incident reporting
Survey data reveals that the NIS Directive requirements regarding information security incident
management mechanisms are in place for most OES and DSP organisations: more than 80%
have already implemented these mechanisms, with an additional 13.3% of surveyed
organisations declaring to have their implementation underway with little variation between the
MS in scope of the survey. This widespread adoption can be at least partly explained by the
relative low number of personnel involved: more than 70% of affected organisations allocate up
to 4 people to this task.
31NIS INVESTMENTS
December 2020
Figure 41: Implementation of information security incident management mechanisms among
surveyed organisations
Mechanisms for information security incident management are largely in place for the majority of
sectors.
Figure 42: Implementation of information security incident management mechanisms per sector
Banking 5,1% 2,6% 92,3%
Cloud computing 4,8% 23,8% 71,4%
Digital infra. 27,8% 27,8% 44,4%
Drinking water 0,0% 36,4% 63,6%
Energy 0,0% 0,0% 100,0%
Financial market infra. 14,3% 0,0% 85,7%
Healthcare 0,0% 12,1% 87,9%
Online Marketplace 0,0% 18,2% 81,8%
Transport 6,5% 16,1% 77,4%
Overall 5,5% 12,8% 81,7%
Not
Underway Implemented
implemented
32NIS INVESTMENTS
December 2020
Figure 43: Staff responsible for information security incident reporting among surveyed
organisations (FTEs)
10+ 0,4% (1)
9 0% (0)
8 2% (5)
7 2% (5)
6 2% (5)
5 9,2% (23)
4 13,5% (34)
3 23,9% (60)
2 30,7% (77)
1 15,5% (39)
0 0% (0)
Don't know 0,8% (2)
n = 251
Q: How many resources (FTEs) are responsible for the security incident reporting to your
national authority in 2019?
3.6.2 Cost of major information security incidents
Among surveyed organisations, 58.6% did report major information security incidents. Among
those organisations, the majority of respondents reported associated costs between 250 and
500 K€, without significant discrepancy when comparing between the EU MS in scope of the
survey.
Figure 44: Major information security incident financial impact among surveyed organisations
More than 5 M€ 0% (0)
1 - 5 M€ 0% (0)
750 K€ - 1M€ 1,6% (4)
500 - 750 K€ 12,7% (32)
250 - 500 K€ 25,5% (64)
100 - 250 K€ 10,8% (27)
Less than 100 K€ 6,4% (16)
Not experienced major security incident 41,4% (104)
Don't know 1,6% (4)
n = 251
Q: What are the estimated damages incurred by the last major security incident(s) experienced by your organization?
Cloud computing, Digital infrastructure, Drinking water distribution and Transport are the sectors
least affected major information security incidents based on the survey responses, while the
sectors most affected are the Banking and Healthcare sectors.
The severity of the incidents appeared higher in organisations from Banking and Online
marketplaces: respectively 32.5% and 28% of those organisations experienced incidents
incurring more half a million euros of costs, versus less than 15% on average.
33NIS INVESTMENTS
December 2020
Figure 45: Major information security incident financial impact per sector
Banking 5,0% 2,5% 32,5% 27,5% 5,0% 25,0% 2,5%
Cloud computing 0,0% 8,0% 20,0% 16,0% 0,0% 56,0% 0,0%
Digital infra. 20,0% 4,0% 8,0% 12,0% 0,0% 56,0% 0,0%
Drinking water 6,7% 26,7% 13,3% 0,0% 0,0% 53,3% 0,0%
Energy 0,0% 0,0% 36,7% 20,0% 0,0% 43,3% 0,0%
Financial market infra. 6,7% 26,7% 13,3% 6,7% 0,0% 40,0% 6,7%
Healthcare 5,7% 28,6% 37,1% 5,7% 0,0% 22,9% 0,0%
Online Marketplace 8,0% 12,0% 12,0% 20,0% 8,0% 36,0% 4,0%
Transport 5,7% 5,7% 34,3% 0,0% 0,0% 51,4% 2,9%
Overall 6,1% 11,0% 25,7% 13,1% 1,6% 40,8% 1,6%
No majorNIS INVESTMENTS
December 2020
Figure 47: Appreciation of the survey respondents of the NIS Directive impact on their
information security posture per country
France 0,0% 0,0% 11,8% 37,3% 49,0% 2,0%
Germany 0,0% 0,0% 9,8% 60,8% 29,4% 0,0%
Italy 0,0% 0,0% 22,0% 36,0% 42,0% 0,0%
Poland 0,0% 2,0% 20,4% 30,6% 46,9% 0,0%
Spain 0,0% 4,0% 16,0% 34,0% 44,0% 2,0%
Grand Total 0,0% 1,2% 15,9% 39,8% 42,2% 0,8%
No
1 2 3 4 5
opinion
Figure 48: Appreciation of the survey respondents of the NIS Directive impact on their
information security posture per sector
Banking 0,0% 0,0% 12,5% 42,5% 45,0% 0,0%
Cloud computing 0,0% 0,0% 24,0% 52,0% 24,0% 0,0%
Digital infra. 0,0% 8,0% 24,0% 40,0% 24,0% 4,0%
Drinking water 0,0% 0,0% 26,7% 40,0% 33,3% 0,0%
Energy 0,0% 0,0% 10,0% 16,7% 73,3% 0,0%
Financial market infra. 0,0% 0,0% 6,7% 33,3% 53,3% 6,7%
Healthcare 0,0% 0,0% 11,4% 40,0% 48,6% 0,0%
Online Marketplace 0,0% 0,0% 16,0% 48,0% 36,0% 0,0%
Transport 0,0% 2,9% 17,1% 45,7% 34,3% 0,0%
Overall 0,0% 1,2% 15,9% 40,0% 42,0% 0,8%
No
1 2 3 4 5
opinion
35NIS INVESTMENTS
December 2020
4. CONCLUSIONS
The data collected and processed for this report produced a number of interesting findings
leading to some conclusions on the nature of NIS investments across different sectors and
countries, as well as how the relevant spend among EU OES and DSPs has been influenced
over the last few years by the NIS Directive. A summary of the main conclusions is presented
below.
When analysing information security spending in a global, cross-industry scale (section 2.1), it
can be observed that organisations average around 6% of their overall IT budget to
information security, a percentage that has remained fairly stable since 2016. Discrepancies
do exist when comparing organisations in different countries with EU organisations allocating
on average 41% less to information security than their American counterparts.
Discrepancies in information security spending are even more apparent between different
sectors with certain sectors investing in information security a percentage of their IT budget up
to 5-6 times higher than that invested by sectors with the lower information security spending
profiles.
Section 2.2 illustrates how the information security budgets are spent and reveals that the
average spending profile of EU and US organisations is very similar though spending can
significantly vary across different sectors. Solutions related to Vulnerability Management
and Analytics were found to comprise from 8% up to 35% of the organisations' overall
information security budget when comparing different sectors. Smaller variations of the relevant
percentage across sectors can be observed when looking at other information security products
and services, such as Identity and Access Management (7% - 15%) and Network Security (11%
- 28%). Section 2.4 presents the outlook of the information security market and identifies Cloud
Access Security Brokers (CASB) as the fastest growing security segment is, reflecting the
increased adoption of cloud in all sectors. Another key growing domain is Identity and Access
Management, including Access Management (AM), Identity Governance and Administration
(IGA), Privileged Access Management (PAM), and User Authentication. Indeed, organisations
need to provide secure access to their remote workforce users, including IT users with
privileged access, a requirement that has been further emphasised with the new modus
operandi resulting from the on-going pandemic.
Figure 7 shows that the main area of spending for information security is Personnel (37%),
followed by Software (27%) and Hardware (21%). In terms of personnel, as of 2020,
information security staff represents 5,6% of total IT staff, measured in terms of FTEs
(information security personnel includes in-house and contract full-time equivalents supporting
the IT security domains), as further detailed in section 2.3. While this percentage has remained
relatively stable over the past 5 years there has been a change in the security skills that are
in demand. Skills that were in high demand in previous years such as Manual Penetration
Testing, Tier 1/2 SOC Analysis or Technology Management are now decreasing in value and
are being replaced by skills in Risk Management, Service Management, Incident Response,
Threat Intelligence, Data Science and Analysis or Coding.
The EU organisations surveyed (OES and DSPs) declared a broad range of information security
budgets, ranging from less than 100 K€ to above 100 M€, with the highest percentage of
information security budget range among the surveyed organisations being 10 – 25 M€.
There is a strong correlation between overall IT budget and Information Security budget,
as organisations with a higher IT budget will also spend more in information security (section
3.1).
36You can also read