Decadal-scale progression of the onset of Dansgaard-Oeschger warming events - Climate of the Past
←
→
Page content transcription
If your browser does not render page correctly, please read the page content below
Clim. Past, 15, 811–825, 2019
https://doi.org/10.5194/cp-15-811-2019
© Author(s) 2019. This work is distributed under
the Creative Commons Attribution 4.0 License.

Decadal-scale progression of the onset of
Dansgaard–Oeschger warming events
Tobias Erhardt1 , Emilie Capron2,3 , Sune Olander Rasmussen2 , Simon Schüpbach1 , Matthias Bigler1 ,
Florian Adolphi1,4 , and Hubertus Fischer1
1 Climate  and Environmental Physics, Physics Institute & Oeschger Center for Climate Change Research,
University of Bern, Sidlerstrasse 5, 3012 Bern, Switzerland
2 Physics of Ice, Climate and Earth, Niels Bohr Institute, University of Copenhagen, Tagensvej 16,

2200 Copenhagen, Denmark
3 British Antarctic Survey, High Cross, Madingley Road, Cambridge, CB3 0ET, UK
4 Quaternary Sciences, Department of Geology, Lund University, Sölvegatan 12, 22362 Lund, Sweden

Correspondence: Tobias Erhardt (erhardt@climate.unibe.ch)

Received: 13 December 2018 – Discussion started: 17 December 2018
Accepted: 13 April 2019 – Published: 25 April 2019

Abstract. During the last glacial period, proxy records          set of the DO warming, affecting both the moisture transport
throughout the Northern Hemisphere document a succession         to Greenland and the Asian monsoon systems. Taken at face
of rapid millennial-scale warming events, called Dansgaard–      value, this suggests that a collapse of the sea-ice cover may
Oeschger (DO) events. A range of different mechanisms has        not have been the initial trigger for the DO warming.
been proposed that can produce similar warming in model
experiments; however, the progression and ultimate trigger
of the events are still unknown. Because of their fast na-
ture, the progression is challenging to reconstruct from pale-   1   Introduction
oclimate data due to the limited temporal resolution achiev-
able in many archives and cross-dating uncertainties be-         Ice-core records from Greenland reveal millennial-scale
tween records. Here, we use new high-resolution multi-proxy      warming episodes in the course of the last glacial period,
records of sea-salt (derived from sea spray and sea ice over     called Dansgaard–Oeschger (DO) events (Dansgaard et al.,
the North Atlantic) and terrestrial (derived from the central    1993; NGRIP project members, 2004). During their onset,
Asian deserts) aerosol concentrations over the period 10–        temperatures in Greenland increased rapidly by 10–15 ◦ C
60 ka from the North Greenland Ice Core Project (NGRIP)          from cold stadial (GS, Greenland Stadial) to warmer inter-
and North Greenland Eemian Ice Drilling (NEEM) ice cores         stadial (GI, Greenland Interstadial) conditions within a few
in conjunction with local precipitation and temperature prox-    decades (Kindler et al., 2014; Huber et al., 2006; Severing-
ies from the NGRIP ice core to investigate the progression of    haus, 1999), coinciding with an almost doubling of the lo-
environmental changes at the onset of the warming events at      cal snow accumulation (Andersen et al., 2006). Moreover,
annual to multi-annual resolution. Our results show on av-       aerosol records from Greenland ice cores show coinciding
erage a small lead of the changes in both local precipitation    rapid changes in aerosol concentrations during the onset of
and terrestrial dust aerosol concentrations over the change in   the events. These changes are partly caused by reduced at-
sea-salt aerosol concentrations and local temperature of ap-     mospheric lifetime of the aerosols due to increased precipi-
proximately one decade. This suggests that, connected to the     tation scavenging en route and partly by changes in aerosol
reinvigoration of the Atlantic meridional overturning circu-     sources (Fischer et al., 2015; Schüpbach et al., 2018).
lation and the warming in the North Atlantic, both synoptic         Other proxy records throughout the Northern Hemi-
and hemispheric atmospheric circulation changes at the on-       sphere also document the widespread environmental im-
                                                                 print of these rapid warming events. Marine sediment cores

Published by Copernicus Publications on behalf of the European Geosciences Union.
812                                                          T. Erhardt et al.: Progression of the onset of DO warming events

(Dokken et al., 2013) and aerosol records from Greenland           otherwise strongly stratified water column, eventually lead-
(Spolaor et al., 2016) show a reduction in perennial sea-ice       ing to breakdown of the stratification and melting of the sea
cover in the Nordic Sea and Arctic Basin, and ocean circula-       ice from below (Dokken et al., 2013; Jensen et al., 2016).
tion proxies indicate an increase in the Atlantic meridional       Alternatively, Peltier and Vettoretti (2014) and Vettoretti and
overturning circulation (AMOC) (Lynch-Stieglitz, 2017).            Peltier (2015) describe the occurrence of spontaneous DO-
Records from North America indicate a change in the mois-          like oscillations in their fully coupled model caused by the
ture advection from the Pacific with drier conditions during       buildup and breakdown of a meridional salinity gradient be-
the warm interstadial periods likely related to changes in at-     tween the open and the sea-ice-covered North Atlantic. The
mospheric circulation (Wagner et al., 2010; Asmerom et al.,        collapse of the salinity gradient then leads to a rapid dis-
2010). These circulation changes coincide with increased           integration of the sea-ice cover and an invigoration of the
wildfire activity in North America as clearly imprinted in         AMOC. In summary, it is clear that sea ice is a crucial factor
the Greenland ice-core record (Fischer et al., 2015). Fur-         in generating the full climatic change seen at the DO warm-
thermore, records from Eurasia indicate rapid changes in the       ing (Li and Born, 2019). However, the sequence of events,
local ecosystems (Rousseau et al., 2017). In the lower lat-        and whether the sea-ice loss is triggered by atmospheric or
itudes, speleothem and sediment records from both South            oceanic changes, differs between the proposed mechanisms.
America (Wang et al., 2004; Deplazes et al., 2013) and east-          In any case, the progression and possible interaction be-
ern Asia (Wang et al., 2008) indicate a northward displace-        tween the distinct processes that can partake in the DO warm-
ment of the Intertropical Convergence Zone (ITCZ) at the           ing are difficult to constrain from paleo-observations, and
time of DO warming (Cheng et al., 2012) resulting in rapid         their validity therefore difficult to test, especially as some
changes in tropical hydroclimate and methane emissions             of the proposed mechanisms lead to virtually indistinguish-
from the tropical wetlands (Baumgartner et al., 2014). A           able model results (Brown and Galbraith, 2016). The relative
recent synchronization of cosmogenic radionuclide records          timing between the start of DO events in proxy records of
from ice cores and low-latitude speleothems back to 45 kyr         different parts of the Earth system can yield critical insight
ago shows that atmospheric circulation changes in the tropics      into their spatiotemporal progression and possible causal re-
occurred synchronously with the Greenland warming within           lations. However, due to the fast onset of the DO events, rela-
the cross-dating uncertainties of around 180 years (Adol-          tive time differences are expected to be on the order of years
phi et al., 2018). The atmospheric circulation changes asso-       to decades, requiring very high temporal resolution of paleo-
ciated with the Asian monsoon systems documented in the            records and often unattainable small relative dating uncer-
Asian speleothems also reduced the mobilization and export         tainties between records from different archives.
of mineral dust aerosol from the central Asian deserts dur-
ing the warm stadial periods as documented by downstream
sediment records (Porter and Zhisheng, 1995; Jacobel et al.,       2   Data and methods
2017).
   A range of different, non-exclusive mechanisms that pro-        Multi-proxy records from ice cores are ideally suited for this
duce interstadial-like warming events during pre-industrial        type of investigation, as they contain information about dif-
and glacial climate conditions have been proposed and tested       ferent parts of the Earth system in the same archive and thus
in model experiments. These include the direct modulation          with negligible relative dating uncertainty when measured on
of the AMOC by freshwater addition to the North Atlantic           samples from the same depths. Two studies have previously
(e.g. Knutti et al., 2004), where ceasing artificial freshwater    tapped into this potential and used high-resolution proxy
forcing in the North Atlantic results in an increasing strength    data from the North Greenland Ice Core Project (NGRIP)
of the AMOC and subsequently increasing Greenland tem-             ice core to investigate the onset of the Holocene, GI-1 and
peratures. Many of the proposed mechanisms involve the re-         GI-8c using two different approaches to infer the timing
duction of North Atlantic sea-ice cover either as a driving        of changes in the different proxies (Steffensen et al., 2008;
or amplifying process for the warming. In both coupled and         Thomas et al., 2009). In the study presented here, we greatly
uncoupled model experiments, the removal of winter sea-ice         expand on these two studies by using new high-resolution
cover in the North Atlantic and Nordic Seas alone generates        records of mineral dust and sea-salt aerosol as indicated
an increase in Greenland temperatures and snow accumula-           by calcium (Ca2+ ) and sodium (Na+ ) concentrations from
tion rates similar to observations by exposing the relatively      both the NGRIP (NGRIP project members, 2004) and North
warm underlying ocean (Li et al., 2010, 2005). Experiments         Greenland Eemian Ice Drilling (NEEM) (NEEM community
with coupled atmosphere and ocean show that this reduction         members, 2013; Schüpbach et al., 2018) Greenland deep ice
in sea-ice cover can be induced by changes in the wind stress      cores. The datasets span the complete time interval from 10
over the sea ice either arising spontaneously (Kleppin et al.,     to 60 ka and include all interstadial onsets from GI-17.2 to
2015) or controlled by elevation changes of the Laurentide         the onset of the Holocene. The aerosol records were mea-
Ice Sheet (Zhang et al., 2014). Furthermore, heat accumu-          sured using continuous flow analysis (CFA), allowing for
lation under the sea ice during stadials can destabilize the       exact co-registration of the aerosol concentration records at

Clim. Past, 15, 811–825, 2019                                                                 www.clim-past.net/15/811/2019/
T. Erhardt et al.: Progression of the onset of DO warming events                                                                 813

the millimetre scale and resulting in sub- to multi-annual          terpret changes in calcium concentration records in terms
resolution, depending on the thinning of the ice (Röthlis-          of changes in the conditions needed for dust entrainment,
berger et al., 2000; Kaufmann et al., 2008). Sodium concen-         i.e. the latitudinal position of the westerly jet and the Asian
trations were determined using an absorption photometric            hydroclimate.
method and calcium concentrations using a fluorimetric de-             Sodium-containing sea-salt aerosols are produced either
tection (Sigg et al., 1994; Röthlisberger et al., 2000; Kauf-       by bubble bursting at the surface of the open ocean or blow-
mann et al., 2008). We further use the NGRIP GICC05 an-             ing saline snow on the surface of sea ice (Wagenbach et al.,
nual layer thickness record, based on the identification of         1998; Yang et al., 2008). Sea-salt aerosol is transported to-
seasonal variations in the aforementioned aerosol and visual        gether with moist air masses from the North Atlantic onto the
stratigraphy records, as a measure of relative local accumu-        Greenland ice sheet (Hutterli et al., 2006). Under current con-
lation rate changes (Svensson et al., 2006, 2008) as well as        ditions, aerosol transport models point at the emission from
4- to 7-year (5 cm) resolution δ 18 O measurements on the           blowing snow from winter sea ice as the dominant source
ice from NGRIP as a proxy for local temperature changes             of sea-salt aerosol for Greenland in winter and suggest that
(NGRIP project members, 2004; Gkinis et al., 2014). All             this source is responsible for a large fraction of the seasonal
data are shown in Fig. 1 in decadal resolution on their re-         variability seen in ice-core records (Huang and Jaeglé, 2017;
spective timescales. Between the individual datasets, the co-       Rhodes et al., 2017). However, on interannual timescales, the
registration uncertainty is limited by the absolute depth as-       influence of the atmospheric transport and deposition domi-
signment of the datasets. This uncertainty is typically on the      nates the variability at the central Greenland sites for recent
order of a few millimetres for CFA data and around a cen-           times, due to the overall low contribution of sea-ice-derived
timetre between δ 18 O and CFA data, which translates to a          aerosol to the total sea-salt aerosol budget (Rhodes et al.,
co-registration uncertainty in the sub-annual range.                2018). Under glacial conditions, the extended multi-year sea-
   For both ice cores, the current versions of the GICC05 age       ice cover moves both sources of open-ocean and sea-ice-
scale were used, which in the case of NEEM has been trans-          derived sea-salt aerosols further away from the ice-core sites.
ferred from NGRIP using volcanic match points (Rasmussen            Intuitively, this would lead to a reduction in sodium deposi-
et al., 2006; Andersen et al., 2006; Svensson et al., 2006;         tion on the ice sheet due to the longer transport. However,
Rasmussen et al., 2013). All ages are given relative to 1950.       the opposite is observed in the Greenland ice-core records
Even though at the volcanic match points the dating uncer-          of the last glacial with much higher concentrations during
tainty is relatively small, the uncertainty introduced by the       cold climate periods than during warmer periods (Schüpbach
interpolation between the match points generally precludes          et al., 2018; Fischer et al., 2007). Isolating the effect of the
direct comparison of absolute timing between the two cores          more distal sources, Levine et al. (2014) have shown that
with the precision required for this study.                         the more extensive sea ice around Antarctica under glacial
   Mineralogy and isotopic composition of mineral dust              conditions would lead to reduced sea-salt aerosol transport
aerosol from central Greenland indicate that its dominant           to the ice sheet. This effect, however, is overcompensated
glacial sources are the central Asian Taklamakan and Gobi           by changes in the atmospheric circulation that enhance pro-
deserts (Biscaye et al., 1997; Svensson et al., 2000). Large        duction and transport during the glacial in comparison to
dust storms occurring during spring can lift dust up into the       present-day conditions, leading to an observed increase in
westerly jet stream where it is transported over long ranges        sea-salt aerosol concentrations in Antarctic ice cores (Wolff
and at high altitudes (Sun et al., 2001; Roe, 2009). The dust       et al., 2010). This suggests that changes in the transport and
emission and subsequent entrainment into the jet are strongly       deposition regimes must be responsible for a large fraction
dependent on the specific synoptic circulation in the area          of the glacial–interglacial and stadial–interstadial variabil-
which itself is governed by the latitudinal position of the         ity observed in the Greenland ice-core records (Schüpbach
westerly jet (Nagashima et al., 2011; Roe, 2009). Under cur-        et al., 2018; Fischer et al., 2007). One plausible explanation
rent conditions, the position of the westerly jet over central      for the apparently more efficient transport of sea-salt aerosol
Asia varies seasonally, changing from south to north of the         to Greenland during the cold periods is the drier conditions
Tibetan plateau during late spring, in unison with the north-       over the cold, sea-ice-covered North Atlantic compared to
ward movement of the East Asian Summer Monsoon rain                 open-ocean conditions. This implies that changes in the sea-
belt (Schiemann et al., 2009; Yihui and Chan, 2005). Dur-           ice cover do affect the sea-salt aerosol concentrations in the
ing the last glacial, the jet was located further south, and, es-   Greenland ice cores not only because of an influence on the
pecially during cold periods, was enabling more frequent or         source of the sea-salt aerosol but also on the efficiency of its
even permanent conditions for the deflation and entrainment         transport, i.e. its deposition en route. Reduced sea-ice cover
of the central Asian dust (Chiang et al., 2015; Nagashima           increases evaporation from the open ocean, resulting in in-
et al., 2011). Once in the jet stream, the mineral dust aerosol     creased scavenging en route and subsequently reduced trans-
is transported above the cloud level and is largely protected       port efficiency of sea-salt aerosol to the Greenland ice sheet,
from scavenging by precipitation and transported efficiently        especially because of its co-transport with moist air masses
to Greenland (Schüpbach et al., 2018). This allows us to in-        from the North Atlantic (Hutterli et al., 2006). In turn, this al-

www.clim-past.net/15/811/2019/                                                                     Clim. Past, 15, 811–825, 2019
814 T. Erhardt et al.: Progression of the onset of DO warming events
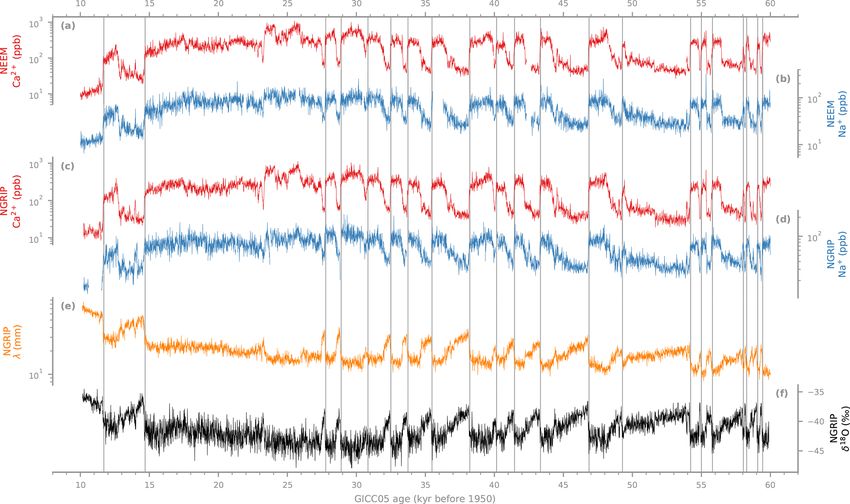
Figure 1. Investigated records from the NEEM (a, b) and NGRIP ice cores (c–f). Panels (a), (d) show the new aerosol records of Ca2+ (a,
c) and Na+ (b, d) alongside the NGRIP layer thickness (λ) (e) and ice δ 18 O records (f). All records are shown as decadal averages on their
respective version of the GICC05 age scale relative to 1950 (Svensson et al., 2008; Rasmussen et al., 2013). The vertical lines mark the
investigated interstadial onsets as given by Rasmussen et al. (2014). Note that the vertical scales for the aerosols and annual layer thickness
are logarithmic.
lows us to interpret the stadial–interstadial changes in sodium ference to determine the parameters of the ramp as well as
concentrations in the ice cores as qualitative indicators of the those describing the multi-annual variability of the records
extent of the sea-ice cover in the North Atlantic. and their uncertainties, conditioning on the data. Inference
In combination, the records of water isotopic composition, is performed on the model using an ensemble Markov chain
annual layer thickness and Na+ and Ca2+ concentrations in Monte Carlo sampler (Goodman and Weare, 2010; Foreman-
the ice allow us to study the phasing between changes in lo- Mackey et al., 2013) to obtain posterior samples for all pa-
cal temperature and precipitation on the Greenland ice sheet, rameters of interest as well as the parameters of the AR(1)
North Atlantic sea-ice cover and dust deflation from the cen- noise model. In this way, any correlations between param-
tral Asian deserts, respectively. To quantify this phase rela- eter estimates and their uncertainties are transparently ac-
tionship, we employ a probabilistic model of the transitions counted for. More details on the inference and the mathe-
to determine their individual start and endpoints as well as matical description of the probabilistic model can be found
the uncertainties of these points. The model describes the in Appendix A. In addition to the start and endpoints, we es-
stadial-to-interstadial transition as a linear (in the case of the timate the temporal midpoints of the transitions, as they are
δ 18 O record) or exponential transition (i.e. a linear transition less influenced by the multi-annual variability that dominates
fitted to the log-transformed data for all other records) be- the uncertainties of the timing estimates. However, here we
tween two constant levels, accounting for the intrinsic multi- focus on the interpretation of the phase relationship of the pa-
annual, auto-correlated variability of the proxy records us- rameters at the onset of the stadial-to-interstadial transitions
ing an AR(1) noise process. This description of the transi- to constrain the causal relationships of the trigger of the DO
tion is similar to the one used by Steffensen et al. (2008), events.
who used a bootstrapping parameter grid-search algorithm The transition model is individually applied to approxi-
to determine the ramp parameters and their uncertainties mately 500-year sections of the data at the highest constantly
(Mudelsee, 2000). However, here we use probabilistic in- available temporal resolution (i.e. number of years per obser-
Clim. Past, 15, 811–825, 2019 www.clim-past.net/15/811/2019/T. Erhardt et al.: Progression of the onset of DO warming events 815
As pointed out above, the cross-dating uncertainty be-
tween the two ice cores does not allow for sufficiently precise
inter-core comparison of the absolute timing of the transi-
tions; however, the comparison of the lags between aerosol
records of one ice core to those of another is not affected by
these uncertainties. Under the assumption that the DO events
show the same imprint in both ice-core records, this enables
crosschecking of the results between the two records.
3 Results
Time differences of the onset, midpoints and endpoints of the
stadial-to-interstadial transitions in Ca2+ , δ 18 O and annual
layer thickness relative to the transition in Na+ are shown
in Fig. 3. All inferred change points and timing differences
can be found in the Supplement. The timing differences for
the Ca2+ and layer thickness records relative to Na+ for in-
dividual events are subtle and their uncertainties are large,
but overall they indicate a consistent picture of the phase re-
lationship between the different events, which is the same
Figure 2. Example of a fitted ramp for the Ca2+ data from the onset
of GI-8c. Panel (a) shows the data together with the marginal poste- for the two ice cores. For most events, the decrease in Ca2+
rior median of the fitted ramp (thick black line). Shaded areas indi- concentrations leads to the decrease in Na+ at the begin-
cate the marginal posterior 5th and 95th percentiles. Panel (b) shows ning, midpoint and end of the transition. Similarly, the begin-
the marginal posterior densities for the onset, midpoint and endpoint ning of the increase in annual layer thickness slightly leads
of the transition (from right to left). the start of the decrease in sea-salt aerosol concentrations,
though the detected lead is more variable between individ-
ual DO events. Nevertheless, the data are overall consistent
vation) around the stadial to interstadial transitions in each with a lead of the increase in annual layer thickness at the
of the records on their respective timescales (Svensson et al., midpoint of the transitions. In the case of the δ 18 O record,
2006, 2008; Rasmussen et al., 2014). The exact width of the timing differences are much more variable between the indi-
window was adjusted to account for gaps in the data and the vidual events with no clear tendency for neither leads nor lags
onset of other transitions within the 500-year window. Be- relative to Na+ . For all of the transitions, the inferred timing
cause of the thinning of layers due to ice flow, the time res- differences relative to the onset of the transition in Na+ are
olution decreases from 2 years for the onset of the Holocene smaller than the duration of the transition itself in each of the
to 3 years at the onset of GI-17.2 for the NGRIP CFA data, proxy records. That means that none of the proxies exhibit
from 2 to 4 years for the NEEM CFA data and from 4 years a complete stadial–interstadial transition before the onset of
at the onset of the Holocene to 7 years for the NGRIP isotope the transition in the sea-salt aerosol concentration.
data. The annual layer thickness data were down-sampled For each individual transition, the uncertainties are large
to match the NGRIP CFA data resolution. Note that using compared to the leads and lags, and only a few events show
the overall lowest available temporal resolution (7 years) for leads that are bigger than zero with a probability larger than
the analysis leads to practically the same results, albeit with 95 %. However, based on the overall tendency of a lead for
slightly larger uncertainties. It is also worth noting that the both Ca2+ and layer thickness relative to Na+ between the
largest source for uncertainties in our estimates stems from GI onsets, we combine the individual estimates of the leads
the multi-annual variability of the proxy records that cannot and lags for each core to determine an average timing differ-
be alleviated by higher-resolution records. ence for the investigated proxies. To combine the estimated
An example of one of the fitted transitions, the onset of GI- timing difference of the individual DO onsets, Gaussian ker-
8c in Ca2+ , is shown in Fig. 2 alongside marginal posterior nel density estimates of the posterior samples were multi-
distributions for the onset, midpoint and end of the transition. plied together. Note that this implicitly assumes that the tim-
The absolute timing estimates for each proxy are used to in- ing differences for all interstadial onsets in the parameters
fer the leads and lags between the different records, propagat- investigated here are the result of the same underlying pro-
ing all uncertainties. In the following, all estimates from the cess or, in other words, are similar between the interstadial
probabilistic inference are given as marginal posterior medi- onsets. This assumption differs from the assumption used in
ans and their uncertainties as marginal 90 % credible inter- other studies of relative phasing of Southern and Northern
vals. Hemisphere climate and changes in precipitation source re-
www.clim-past.net/15/811/2019/ Clim. Past, 15, 811–825, 2019816 T. Erhardt et al.: Progression of the onset of DO warming events
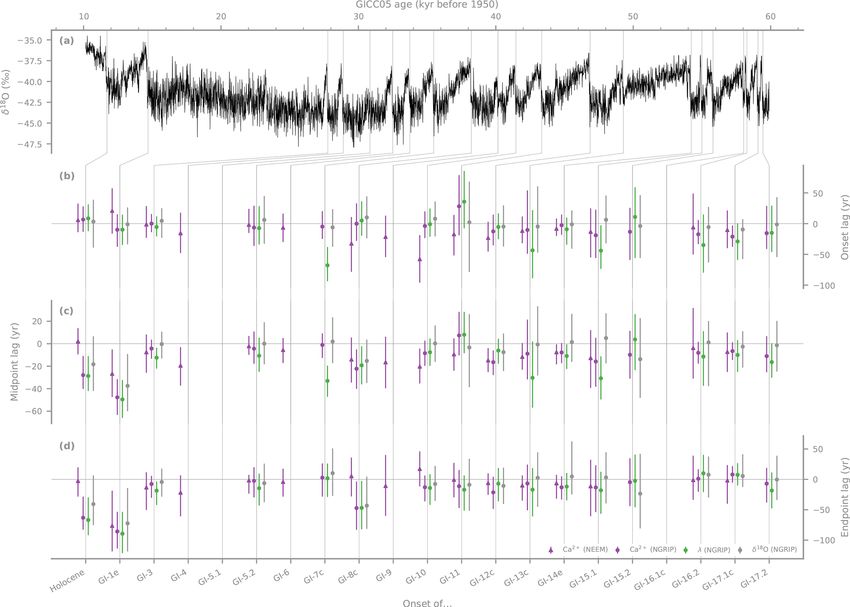
Figure 3. Timing differences for the individual interstadial onsets: (a) the NGRIP δ 18 O record, (b–d) timing difference of NGRIP Ca2+ ,
layer thickness (λ) and δ 18 O records, as well as the NEEM Ca2+ record relative to the transition in the respective Na+ records at the
onset (b), midpoint (c) and end (d) of the transition. No timing results are given for transitions where there are data gaps in one of the
necessary datasets. Error bars show the marginal posterior 5th and 95th percentiles and the symbol the marginal posterior median. Note the
different axis scaling for the start, midpoints and endpoints. All inferred absolute timings, the transition durations and the lags relative to
Na+ can be found in the Supplement.
gions during the last glacial (WAIS Divide Project Members, In the combined estimate, Ca2+ concentrations start to
2015; Markle et al., 2016; Buizert et al., 2018). In these stud- decrease 7+6 +
−6 years before Na in the NGRIP record and
ies, the stacking of the climate events assumes that the com- 8+5
−5 years in the NEEM record, where the error margins re-
plete progression of the climate event is a realization of the fer to the 5th and 95th marginal posterior percentiles. They
same underlying process, which is a wider and more restric- reach the midpoint of the transition 9+3 +4
−2 and 8−3 years before
tive assumption, as it encompasses the whole transition and +6 +6
Na+ and the endpoint 6−5 and 4−5 years, respectively.
not only its onset. The combined estimates are calculated for Furthermore, local accumulation rates at NGRIP start
the data from the two cores separately so that the consistency to increase 7+6 +
−6 years earlier than Na starts to decrease,
of the timing between Na+ and Ca2+ between records can be +3
tested. Probability density estimates for the lead of the other reaching the midpoint 15−3 years and its interstadial level
parameters relative to Na+ at the transition onset, midpoint 12+7
−6 years earlier.
and endpoint are shown in Fig. 4. They clearly show that, on Note, that the density functions shown in Fig. 4 cannot
average, both the reduction in terrestrial aerosol concentra- be used to infer timing differences between the other pa-
tion and the increase in annual layer thickness precede the rameters. This is a direct result of the estimates being con-
reduction in sea-salt aerosol for all stages of the transition, ditional on the timing of the transition in sodium, leading to
whereas no significant lead or lag is identified between δ 18 O large correlations between the lag estimates for the other pa-
and Na+ . rameters. That means that even though, e.g. two probability
Clim. Past, 15, 811–825, 2019 www.clim-past.net/15/811/2019/T. Erhardt et al.: Progression of the onset of DO warming events 817
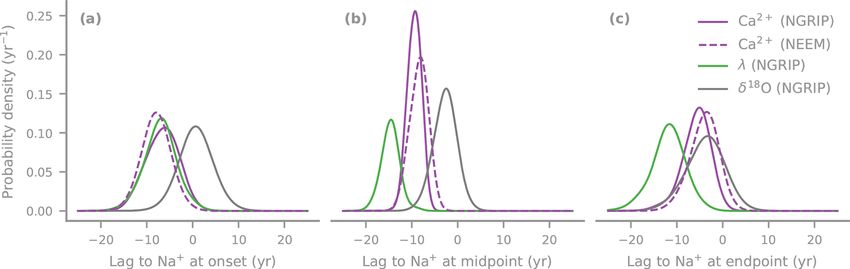
Figure 4. Combined probability density estimates of the lag of the Ca2+ , layer thickness and δ 18 O transitions relative to the respective point
in the Na+ records for the onset (a), midpoint (b) and end (c) of all transitions from stadial to interstadial for the two cores.
4 Discussion
Using much lower resolution mineral dust and ice δ 18 O data
from NGRIP, Ruth et al. (2007) reported coinciding onsets
within 5 to 10 years and a combined lag of 1 ± 8 years for
GI-1 through GI-24 demonstrating the close connection be-
tween the Asian and North Atlantic climate during all of the
DO events. In light of the low temporal resolution of the data
used (0.55 m corresponding to 7–98 or 38 years on average)
and the small timing differences that emerge in the combi-
nation of the individual interstadial onsets presented here,
the results of Ruth et al. (2007) are compatible with the out-
comes presented here. Our results are also in good agreement
with the more detailed studies of the onset of the Holocene
and GI-1 (Steffensen et al., 2008) and GI-8c (Thomas et al.,
Figure 5. Combined order statistics for the onset of the transi- 2009). Similar to the presented study, Steffensen et al. (2008)
tion. The colours indicate the probability of observing the onset of and Thomas et al. (2009) (using high-resolution data from the
the transition in the parameter on the y axis at the position on the NGRIP ice core) also infer slight leads of changes in terres-
x axis. This illustrates that during the onset of the DO warming, the trial aerosol concentrations and accumulation rate and mois-
changes in accumulation and Ca2+ concentrations about equally ture sources ahead of the changes in marine aerosols and lo-
likely occur first, whereas the transitions in Na+ and δ 18 O about cal temperature in good agreement with our results from the
equally likely occur last. respective DO onsets. These results are also overall in good
agreement with the other transitions investigated here. As the
study presented here now covers 19 warming events starting
density functions of the differences relative to the transition from 60 kyr ago and independently investigates the phasing
in sodium largely overlap, it does not necessarily mean that in two ice cores, this adds significant evidence to the initially
their relative timing difference is equal to zero. In the case inferred phasing.
of the timing difference between the transition onsets of the Two studies into Greenland (Schüpbach et al., 2018) and
increase in annual layer thickness and the decrease in Ca2+ Antarctic (Markle et al., 2018) aerosol records have recently
concentrations, the combined lead of the change in annual shown that a large part of the variability on centennial and
layer thickness relative to Ca2+ is not larger than zero at the millennial timescales in these records can be explained by the
0.95 probability level with 4+4−5 years. To establish the most tight coupling between the hydrological cycle and the aerosol
probable sequence of events at the transition offset, we cal- transport to the ice sheets. This coupling is a direct result of
culate the average order of the onset times, shown for NGRIP the efficient removal of aerosols during transport by precip-
in Fig. 5. The average positions show that the change in accu- itation scavenging leading to a negative correlation between
mulation and Ca2+ concentrations about equally likely occur en-route precipitation and aerosol concentration in the ice.
first, whereas the transitions in Na+ and δ 18 O about equally On the short timescales investigated here, this tight coupling
likely occur last. The same analysis for the NEEM results breaks down. This has previously been indicated for Antarc-
confirms this sequence. tica by the lack of coherence at shorter periods (Markle et al.,
www.clim-past.net/15/811/2019/ Clim. Past, 15, 811–825, 2019818 T. Erhardt et al.: Progression of the onset of DO warming events 2018) and here by the lack of synchronous changes between inciding increase in snowfall. However, the increase in snow snowfall, water isotopic composition and/or aerosol concen- accumulation as observed in the annual layer thickness oc- trations during the onset of the warming events. This can curs slightly earlier than the changes in sea-salt aerosol and be explained by the observation that, under glacial condi- δ 18 O, indicative of an initial increase of the advection of ma- tions, models show that the interannual variability of the ac- rine air masses to the ice sheet at the onset of the DO events cumulation is governed by changes in the frequency of the unrelated to changes of the sea-ice cover. A plausible cause advection of marine air masses to the Greenland ice sheet for this change in advection would be a shift in the jet-stream (Pausata et al., 2009; Merz et al., 2013). Furthermore, the location and thus in the track of the low-pressure systems overall reduced amount of snowfall during the glacial is a re- over the North Atlantic (e.g. Wunsch, 2006). sult of generally decreased moisture advection (Merz et al., Mineral dust, like sea-salt aerosol, is deposited very ef- 2013). For the stadial–interstadial transitions, these model re- ficiently during snowfall events because small amounts of sults and the lack of synchronous changes in the data pre- precipitation remove most of the aerosol load from the air sented here suggest a large influence of atmospheric dynam- column (Davidson et al., 1996; Zhang et al., 2014). That ics on the change in snow accumulation as well. This is fur- means that an increase in snowfall frequency would not af- ther supported by other proxy evidence from central Green- fect the observed dust concentration in the ice, despite the land (Kapsner et al., 1995) and is similarly observed in West changing snow accumulation. As pointed out by Schüpbach Antarctica (Fudge et al., 2016). An increase of the advec- et al. (2018), on centennial to millennial timescales, changes tion of air masses from lower latitudes would result in an in the central Asian dust source strengths by a factor of ap- increase of the snow accumulation as more moisture is trans- proximately 4 are needed to explain the complete amplitude ported to the ice sheet but in unchanged sea-salt concen- between stadials and interstadials observed in the ice cores, trations in the precipitation and subsequently the ice core, as further supported by downwind sediment records (Porter as these air masses still carry the same amount of sea-salt and Zhisheng, 1995; Jacobel et al., 2017). The deflation of aerosol. This leads to a decoupling of changes in the sea-salt the dust from the central Asian source regions is strongly aerosol deposition flux vs. the concentrations in the ice; i.e. dependent on location of the westerly jet (Nagashima et al., the deposition flux per event stays constant but the number 2011; Roe, 2009) that under current conditions covaries with of precipitation events increases. In turn, this means that the the East Asian Summer Monsoon on seasonal timescales covariance of snowfall on the sea-salt deposition that is ap- (Schiemann et al., 2009). During the glacial conditions, the parent on centennial and millennial timescales (Schüpbach westerly jet was located further south than today, leading to et al., 2018; Markle et al., 2018) is less important at the in- more frequent or even permanent conditions for dust emis- terannual scale, where atmospheric dynamics dominate over sion (Chiang et al., 2015; Nagashima et al., 2011). As low- thermodynamic changes. This view of changed precipitation latitude proxy records indicate northward movements of the frequency at the very beginning of the DO onset is supported ITCZ during the DO events (Wang et al., 2004; Deplazes by the apparent asynchrony of snowfall and δ 18 O. Similar to et al., 2013; Wang et al., 2008; Yancheva et al., 2007), syn- Na+ , δ 18 O remains unchanged if only the frequency of pre- chronous within approximately 180 years (Adolphi et al., cipitation events is increased with otherwise unaltered sea- 2018), we hypothesize that the accompanying change in at- sonality (and thus isotopic signature). Only later in the tran- mospheric circulation causes a reduction of the dust deflation sition do thermodynamically driven changes in precipitation during interstadials. Because the reduction in mineral dust amount and seasonality affect δ 18 O (Werner et al., 2000). aerosol concentrations in the ice core occurs before the re- The reduction of perennial sea-ice cover during DO events duction in sea-salt aerosol, the data imply that this change that is documented in proxy records (Spolaor et al., 2016; in atmospheric circulation happens before the reduction in Dokken et al., 2013) has a large influence on Greenland tem- the sea-ice cover in the North Atlantic. This is further sup- perature and accumulation due to the exposure of the warm ported by the fact that changes in deuterium excess at the on- ocean in the North Atlantic as shown by model experiments set of GI-1 and GI-8c, indicating changes in moisture trans- (Li et al., 2010, 2005). The increased moisture availability port from the North Atlantic to Greenland, occur after the on- over the open ocean which leads to the snowfall in Green- set of the transition in mineral dust aerosol (Steffensen et al., land likely also decreases the transport efficiency of marine 2008; Thomas et al., 2009). Antarctic records of deuterium aerosol to the Greenland ice sheet due to the increased pre- excess that indicate changes of moisture sources also show a cipitation and washout en route. In turn, this leads to the ob- rapid shift at the onset of the Greenland interstadials, inter- served synchronous start in the transitions in ice δ 18 O and preted as a change in the Southern Hemisphere westerlies Na+ concentrations. This is in good agreement with transient explaining part of the signal observed in multiple Antarc- simulations of DO events (Vettoretti and Peltier, 2015, 2018) tic δ 18 O records (Markle et al., 2016; Buizert et al., 2018). showing that as soon as the North Atlantic sea-ice cover is This further supports the hypothesis of rapidly changing at- reduced, both evaporation and precipitation over the ocean mospheric circulation during the DO events not only in the as well as temperatures in Greenland rapidly increase. The Northern Hemisphere but globally. Nevertheless, the fact that decrease of the sea-ice cover is also expected to cause a co- for all transitions the inferred timing difference relative to the Clim. Past, 15, 811–825, 2019 www.clim-past.net/15/811/2019/
T. Erhardt et al.: Progression of the onset of DO warming events                                                                     819

transition in Na+ is smaller than the duration of the transition       Using our ice-core data, we can only derive the relative
in that parameter indicates that the respective parts of the cli-   timing of changes in the atmospheric circulation and the
mate system co-evolved over the transition. That means that         North Atlantic surface conditions related to the DO warm-
the changes in atmospheric circulation at the DO onset were         ing. Our results cannot provide a direct constraint on the
not completely decoupled from the change in sea-ice cover           increase in AMOC which may potentially precede changes
and Greenland temperature.                                          in sea-surface conditions and atmospheric circulation. Re-
   Due to the small timing differences between the records,         cent studies using marine sediment records (e.g. Henry et al.,
it is worth noting that water isotope records from polar ice        2016) suggest a centuries-long lead of AMOC changes; how-
cores are subject to smoothing by diffusion. For the NGRIP          ever, the response time of the proxies, their limited resolution
isotope record, the diffusion length at the end of the last         and dating precision may not allow an unambiguous answer
glacial is on the order of 5–10 cm (Gkinis et al., 2014), influ-    yet. This question requires further studies, especially in light
encing the high-frequency variability. For the analysis here,       of model studies both with (Pedro et al., 2011, 2018) and
the diffusion means that the rapid increase of the δ 18 O sig-      without freshwater hosing (i.e. Zhang et al., 2014; Kleppin
nal at the DO onsets would be slightly shifted towards ear-         et al., 2015; Peltier and Vettoretti, 2014) in the North Atlantic
lier times, leading to lower apparent lags between the aerosol      that show that the temperature and precipitation response in
records and the water isotope record. Thus, the inferred lead       Greenland is synchronous to AMOC changes.
of Ca2+ over δ 18 O can be regarded as a conservative esti-
mate.
                                                                    Code and data availability. All data needed to reproduce the
                                                                    figures and results of the study are archived on PANGAEA
5   Conclusions
                                                                    (https://doi.org/10.1594/PANGAEA.896743; Erhardt et al., 2018).
                                                                       The transition points and timing differences including their un-
The multi-proxy records of the timing differences from two          certainties for all investigated GS/GI transitions are supplied in the
ice cores at the onset of the DO events allow us to investi-        Supplement.
gate the temporal progression of Northern Hemisphere en-               NGRIP δ 18 O data and the GICC05 age scale for the NGRIP and
vironmental change at the onset of the events in high tem-          NEEM ice cores are available at http://www.iceandclimate.nbi.ku.
poral resolution. Even though the inferred timing differences       dk/data/ (last access: 18 April 2019).
carry large uncertainties for single events, they are overall          The code to reproduce the analysis and all figures is avail-
consistent between the two investigated ice-core records and        able at https://github.com/terhardt/DO-progression (last access:
over all DO events indicating their robustness. The qualita-        18 April 2019) or upon request to the corresponding author.
tive agreement between the DO events allows for the com-
bination of the timing differences from the individual DO
events to estimate a better constrained succession of the en-
vironmental changes during the onset of the DO events. Both
the initial increase in snow accumulation and the reduction of
Ca2+ occur about a decade before the reduction in Na+ and
the increase in local temperature. Taken at face value, this
sequence of events suggests that the collapse of the North
Atlantic sea-ice cover may not be the initial trigger for the
DO events and indicates that synoptic and hemispheric at-
mospheric circulation changes started before the reduction of
the high-latitude sea-ice cover that ultimately coincided with
the Greenland warming. The progression of environmental
changes revealed in the Greenland aerosol records provides
a good target for climate models explicitly modelling both
water isotope and aerosol transport that aim at transiently
simulated DO events.

www.clim-past.net/15/811/2019/                                                                       Clim. Past, 15, 811–825, 2019
820 T. Erhardt et al.: Progression of the onset of DO warming events
Appendix A: Transition model
The transition between cold and warm states is described by
a linear ramp of amplitude 1y, starting at t0 , y0 lasting for a
time of 1t:
y0
ti ≤ t0
yˆi (ti ) = y0 + ti1t
−t0
1y t0 < ti < (t0 + 1t) .
y0 + 1y ti ≥ (t0 + 1t)
y in this case is the log-transformed concentrations and layer
thicknesses and non-transformed relative isotope ratios.
Each observation i of the transitions is made with additive
error i from an irregularly sampled AR(1) noise model to
account for the multi-annual variability of the proxy records
as given by
yi = yˆi + i , Figure A1. Timing uncertainty as a function of SNR for the NGRIP
datasets. The uncertainty in the onset of the transition increases with
for i > 0, with lower SNR, as defined by the amplitude of the transition over the
ti −ti−1 amplitude of the noise. Note that the linear fits are only for illustra-
p(i |i−1 , ti , ti−1 , τ, σ ) = N i−1 e− τ , σ2 , tion.
where
ti −ti−1
σ2 = σ 2 1 − e−2 τ ,
and for the first observation with
p(i=0 |τ, σ ) = N(0, σ 2 ),
where p(A | B) denotes the conditional probability of A
given B. The use of an irregularly sampled AR(1) process
enables the transparent handling of missing data or sampling
with less than annual resolution. The two parameters of the
noise process are the marginal standard deviation σ and the
auto-correlation time τ given in the same units as the data
and sampling time, respectively. Both standard deviation and
auto-correlation time of the noise process are determined
from the data alongside the timing parameters of the tran-
sition and are treated as nuisance parameters. For the proba-
bilistic inference, the following priors were used: Figure A2. Lag relative to the transition onset in Na+ vs. SNR in
the respective parameters for the NGRIP data. None of the param-
p(t0 ) = N(0.0, 50.02 ) eters show a systematic connection of the inferred leads and lags
p(1t) = Gamma(2.0, 0.02) with their SNR.
p(y0 ) = 1.0
p(1y) = N(0.0, 10.02 ) Inference was performed using an ensemble Markov
p(τ ) = Gamma(2.5, 0.15) chain Monte Carlo (MCMC) sampler (Goodman and Weare,
1 2010) implemented in the Python programming language
p(σ ) ∝ ; σ < 10, (Foreman-Mackey et al., 2013). Samplers were run for
σ
60 000 iterations using 60 ensemble members, using every
with the following distribution functions: 600th sample, resulting in 6000 posterior samples of the six
1
1
parameters determining the transition and noise model. The
2 2 2
N(µ, σ ) = p(x|µ, σ ) = √ exp − 2 (x − µ) noise model parameters were not interpreted and treated as
2π σ 2σ
nuisance parameters.
β α α−1 −βx
Gamma(α, β) = p(x|α, β) = x e , Because the model explicitly accounts for variability
0(α) around the transition model in the data, it is possible to assess
where 0 is the gamma function. the impact of the magnitude of this variability on the preci-
Clim. Past, 15, 811–825, 2019 www.clim-past.net/15/811/2019/T. Erhardt et al.: Progression of the onset of DO warming events 821 sion of the inferred timings. Intuitively, the larger the multi- annual variability in the dataset compared to the amplitude of the transition, the more uncertain the inferred timing es- timates should be. To test this, Fig. A1 shows the marginal posterior standard deviation of the inferred onset of the tran- sition as the signal-to-noise ratio (SNR), as defined by the ratio of the amplitude of the transition over the standard de- viation of the noise term. It shows that the higher the SNR, the lower the posterior standard deviation of t0 . Or, in differ- ent terms, the clearer the transition is visible, the more pre- cise the timing inference. Because the uncertainties are prop- agated to the lead/lag calculations and the combined estimate we take this into account. This becomes clear when plotting the leads/lags relative to Na+ as a function of the SNR in the respective parameters as shown in Fig. A2. The figure shows no systematic connection between SNR and inferred lags. www.clim-past.net/15/811/2019/ Clim. Past, 15, 811–825, 2019
822                                                               T. Erhardt et al.: Progression of the onset of DO warming events

Supplement. The supplement related to this article is available         References
online at: https://doi.org/10.5194/cp-15-811-2019-supplement.

Author contributions. MB, SS and HF performed CFA measure-              Adolphi, F., Bronk Ramsey, C., Erhardt, T., Edwards, R. L., Cheng,
ments in the field at NGRIP and/or NEEM. MB and SS carried out            H., Turney, C. S. M., Cooper, A., Svensson, A., Rasmussen, S.
raw data analysis. TE and HF designed the study. TE carried out the       O., Fischer, H., and Muscheler, R.: Connecting the Greenland
data analysis which was developed by TE in exchange with SOR.             ice-core and U/Th timescales via cosmogenic radionuclides: test-
All authors discussed the results and contributed to the interpreta-      ing the synchroneity of Dansgaard–Oeschger events, Clim. Past,
tion and to the manuscript, which was written by TE.                      14, 1755–1781, https://doi.org/10.5194/cp-14-1755-2018, 2018.
                                                                        Andersen, K. K., Svensson, A., Clausen, H. B., Bigler, M., Johnsen,
                                                                          S. J., Rasmussen, S. O., Röthlisberger, R., Ruth, U., Siggaard-
                                                                          Andersen, M.-L., Steffensen, J. P., Dahl-Jensen, D., and Vinther,
Competing interests. The authors declare that they have no con-
                                                                          B. M.: The Greenland Ice Core Chronology 2005, 15–42 ka. Part
flict of interest.
                                                                          1: constructing the time scale, Quaternary Sci. Rev., 25, 3246–
                                                                          3257, https://doi.org/10.1016/j.quascirev.2006.08.002, 2006.
                                                                        Asmerom, Y., Polyak, V. J., and Burns, S. J.: Variable
Acknowledgements. The Division for Climate and Envi-                      winter moisture in the southwestern United States linked
ronmental Physics, Physics Institute, University of Bern ac-              to rapid glacial climate shifts, Nat. Geosci., 3, 114–117,
knowledges the long-term financial support of ice-core re-                https://doi.org/10.1038/ngeo754, 2010.
search by the Swiss National Science Foundation (SNSF) un-              Baumgartner, M., Kindler, P., Eicher, O., Floch, G., Schilt, A.,
der project nos. 200020_172506, 20FI20_137635, 10FI21_119612,             Schwander, J., Spahni, R., Capron, E., Chappellaz, J., Leuen-
200020_159563 and 20-063333.00, as well as by the Oeschger                berger, M., Fischer, H., and Stocker, T. F.: NGRIP CH4 con-
Center for Climate Change Research. Emilie Capron was funded              centration from 120 to 10 kyr before present and its rela-
by the European Union’s Seventh Framework Programme for re-               tion to a δ 15 N temperature reconstruction from the same ice
search and innovation under the Marie Skłodowska-Curie Actions            core, Clim. Past, 10, 903–920, https://doi.org/10.5194/cp-10-
(grant agreement no. 600207). Sune Olander Rasmussen and Em-              903-2014, 2014.
ilie Capron gratefully acknowledge the Carlsberg Foundation for         Biscaye, P. E., Grousset, F. E., Revel, M., der Gaast, S., Zielin-
support to the project ChronoClimate. Florian Adolphi is supported        ski, G. A., Vaars, A., and Kukla, G.: Asian provenance of
through a grant by the Swedish Research Council (Vetenskapsrådet          glacial dust (stage 2) in the Greenland Ice Sheet Project 2 Ice
no. 2016-00218). NGRIP is directed and organized by the Depart-           Core, Summit, Greenland, J. Geophys. Res., 102, 26765–26781,
ment of Geophysics at the Niels Bohr Institute for Astronomy,             https://doi.org/10.1029/97JC01249, 1997.
Physics and Geophysics, University of Copenhagen. It is supported       Brown, N. and Galbraith, E. D.: Hosed vs. unhosed: interruptions
by funding agencies in Denmark (SNF), Belgium (FNRS-CFB),                 of the Atlantic Meridional Overturning Circulation in a global
France (IPEV and INSU/CNRS), Germany (AWI), Iceland (Ran-                 coupled model, with and without freshwater forcing, Clim. Past,
nIs), Japan (MEXT), Sweden (SPRS), Switzerland (SNF) and the              12, 1663–1679, https://doi.org/10.5194/cp-12-1663-2016, 2016.
US (US NSF, Office of Polar Programs). NEEM is directed and or-         Buizert, C., Sigl, M., Severi, M., Markle, B. R., Wettstein, J. J.,
ganized by the Centre of Ice and Climate at the Niels Bohr Institute      McConnell, J. R., Pedro, J. B., Sodemann, H., Goto-Azuma,
and US NSF, Office of Polar Programs. It is supported by fund-            K., Kawamura, K., Fujita, S., Motoyama, H., Hirabayashi, M.,
ing agencies and institutions in Belgium (FNRS-CFB and FWO),              Uemura, R., Stenni, B., Parrenin, F., He, F., Fudge, T. J., and
Canada (NRCan/GSC), China (CAS), Denmark (FIST), France                   Steig, E. J.: Abrupt ice-age shifts in southern westerly winds and
(IPEV, CNRS/INSU, CEA and ANR), Germany (AWI), Iceland                    Antarctic climate forced from the north, Nature, 563, 681–685,
(RannIs), Japan (NIPR), South Korea (KOPRI), the Netherlands              https://doi.org/10.1038/s41586-018-0727-5, 2018.
(NWO/ALW), Sweden (VR), Switzerland (SNF), the United King-             Cheng, H., Sinha, A., Wang, X., Cruz, F. W., and Edwards, R. L.:
dom (NERC) and the US (US NSF, Office of Polar Programs) and              The Global Paleomonsoon as seen through speleothem records
the EU Seventh Framework Programmes Past4Future and Waterun-              from Asia and the Americas, Clim. Dynam., 39, 1045–1062,
dertheIce. The authors also gratefully acknowledge the contribu-          https://doi.org/10.1007/s00382-012-1363-7, 2012.
tions of the countless people that facilitated and took part in both    Chiang, J. C. H., Fung, I. Y., Wu, C. H., Cai, Y., Edman,
the ice-core drilling and processing as well as the CFA melting           J. P., Liu, Y., Day, J. A., Bhattacharya, T., Mondal, Y., and
campaigns. The authors would further like to thank the reviewers          Labrousse, C. A.: Role of seasonal transitions and westerly jets
for their useful comments that helped to improve the manuscript.          in East Asian paleoclimate, Quaternary Sci. Rev., 108, 111–129,
                                                                          https://doi.org/10.1016/j.quascirev.2014.11.009, 2015.
                                                                        Dansgaard, W., Johnsen, S. J., Clausen, H. B., Dahl-Jensen, D.,
Review statement. This paper was edited by Elizabeth Thomas               Gundestrup, N. S., Hammer, C. U., Hvidberg, C. S., Steffensen,
and reviewed by Bradley Markle and one anonymous referee.                 J. P., Sveinbjörnsdottir, A. E., Jouzel, J., and Bond, G.: Evidence
                                                                          for general instability of past climate from a 250-kyr ice-core
                                                                          record, Nature, 364, 218–220, https://doi.org/10.1038/364218a0,
                                                                          1993.
                                                                        Davidson, C. I., Bergin, M. H., and Kuhns, H. D.: The Deposition
                                                                          of Particles and Gases to Ice Sheets, in: Chemical Exchange Be-

Clim. Past, 15, 811–825, 2019                                                                         www.clim-past.net/15/811/2019/
T. Erhardt et al.: Progression of the onset of DO warming events 823 tween the Atmosphere and Polar Snow, edited by: Wolff, E. W. tope Stage 3 and its relation to CH4 , Earth Planet. Sc. Lett., 243, and Bales, R. C., 275–306, Springer Berlin Heidelberg, 1996. 504–519, https://doi.org/10.1016/j.epsl.2006.01.002, 2006. Deplazes, G., Lückge, A., Peterson, L. C., Timmermann, A., Hutterli, M. A., Crueger, T., Fischer, H., Andersen, K. K., Raible, Hamann, Y., Hughen, K. A., Röhl, U., Laj, C., Cane, M. A., Sig- C. C., Stocker, T. F., Siggaard-Andersen, M.-L., McConnell, man, D. M., and Haug, G. H.: Links between tropical rainfall J. R., Bales, R. C., and Burkhart, J. F.: The influence of re- and North Atlantic climate during the last glacial period, Nat. gional circulation patterns on wet and dry mineral dust and sea Geosci., 6, 213–217, https://doi.org/10.1038/ngeo1712, 2013. salt deposition over Greenland, Clim. Dynam., 28, 635–647, Dokken, T. M., Nisancioglu, K. H., Li, C., Battisti, D. S., and Kissel, https://doi.org/10.1007/s00382-006-0211-z, 2006. C.: Dansgaard-Oeschger cycles: Interactions between ocean and Jacobel, A. W., McManus, J., Anderson, R. F., and Winckler, G.: sea ice intrinsic to the Nordic seas, Paleoceanography, 28, 491– Climate-related response of dust flux to the central equatorial Pa- 502, https://doi.org/10.1002/palo.20042, 2013. cific over the past 150 kyr, Earth Planet. Sc. Lett., 457, 160–172, Erhardt, T., Capron, E., Rasmussen, S. O., Schüpbach, S., Bigler, https://doi.org/10.1016/j.epsl.2016.09.042, 2017. M., Adolphi, F., and Fischer, H.: High resolution aerosol, layer Jensen, M. F., Nilsson, J., and Nisancioglu, K. H.: The interaction thickness and δ 18 O data around Greenland warming events between sea ice and salinity-dominated ocean circulation: impli- (10–60 ka) from NGRIP and NEEM ice cores, PANGAEA, cations for halocline stability and rapid changes of sea ice cover, https://doi.org/10.1594/PANGAEA.896743, 2018. Clim. Dynam., 47, 3301–3317, https://doi.org/10.1007/s00382- Fischer, H., Fundel, F., de Angelis, M., Federer, U., Bigler, M., 016-3027-5, 2016. Ruth, U., Twarloh, B., Wegner, A., Udisti, R., Becagli, S., Castel- Kapsner, W. R., Alley, R. B., Shuman, C. A., Anandakrishnan, S., lano, E., Morganti, A., Severi, M., Wolff, E. W., Littot, G. C., and Grootes, P. M.: Dominant influence of atmospheric circula- Röthlisberger, R., Mulvaney, R., Hutterli, M. A., Kaufmann, tion on snow accumulation in Greenland over the past 18,000 P. R., Lambert, F., Hansson, M. E., Jonsell, U., Boutron, C. F., years, Nature, 373, 52–54, https://doi.org/10.1038/373052a0, Siggaard-Andersen, M.-L., Steffensen, J. P., Barbante, C., Gas- 1995. pari, V., Gabrielli, P., and Wagenbach, D.: Reconstruction of mil- Kaufmann, P. R., Federer, U., Hutterli, M. A., Bigler, M., Schüp- lennial changes in dust emission, transport and regional sea ice bach, S., Ruth, U., Schmitt, J., and Stocker, T. F.: An Improved coverage using the deep EPICA ice cores from the Atlantic and Continuous Flow Analysis System for High-Resolution Field Indian Ocean sector of Antarctica, Earth Planetary Sc. Lett., 260, Measurements on Ice Cores, Environ. Sci. Technol., 42, 8044– 340–354, https://doi.org/10.1016/j.epsl.2007.06.014, 2007. 8050, https://doi.org/10.1021/es8007722, 2008. Fischer, H., Schüpbach, S., Gfeller, G., Bigler, M., Röthlisberger, Kindler, P., Guillevic, M., Baumgartner, M., Schwander, J., Landais, R., Erhardt, T., Stocker, T. F., Mulvaney, R., and Wolff, E. W.: A., and Leuenberger, M.: Temperature reconstruction from 10 to Millennial changes in North American wildfire and soil ac- 120 kyr b2k from the NGRIP ice core, Clim. Past, 10, 887–902, tivity over the last glacial cycle, Nat. Geosci., 8, 723–727, https://doi.org/10.5194/cp-10-887-2014, 2014. https://doi.org/10.1038/ngeo2495, 2015. Kleppin, H., Jochum, M., Otto-Bliesner, B., Shields, C. A., and Foreman-Mackey, D., Hogg, D. W., Lang, D., and Goodman, J.: Yeager, S.: Stochastic Atmospheric Forcing as a Cause of emcee: The MCMC Hammer, Publ. Astron. Soc. Pac., 125, 306– Greenland Climate Transitions, J. Climate, 28, 7741–7763, 312, https://doi.org/10.1086/670067, 2013. https://doi.org/10.1175/JCLI-D-14-00728.1, 2015. Fudge, T. J., Markle, B. R., Cuffey, K. M., Buizert, C., Taylor, K. C., Knutti, R., Flückiger, J., Stocker, T. F., and Timmermann, A.: Steig, E. J., Waddington, E. D., Conway, H., and Koutnik, M.: Strong hemispheric coupling of glacial climate through fresh- Variable relationship between accumulation and temperature in water discharge and ocean circulation, Nature, 430, 851–856, West Antarctica for the past 31,000 years, Geophys. Res. Lett., https://doi.org/10.1038/nature02786, 2004. 43, 3795–3803, https://doi.org/10.1002/2016gl068356, 2016. Levine, J. G., Yang, X., Jones, A. E., and Wolff, E. W.: Sea salt Gkinis, V., Simonsen, S. B., Buchardt, S. L., White, J. W. C., and as an ice core proxy for past sea ice extent: A process-based Vinther, B. M.: Water isotope diffusion rates from the North- model study, J. Geophys. Res.-Atmospheres, 119, 5737–6756, GRIP ice core for the last 16,000 years – Glaciological and pa- https://doi.org/10.1002/(ISSN)2169-8996, 2014. leoclimatic implications, Earth Planet. Sc. Lett., 405, 132–141, Li, C. and Born, A.: Coupled atmosphere-ice-ocean dynamics in https://doi.org/10.1016/j.epsl.2014.08.022, 2014. Dansgaard-Oeschger events, Quaternary Sci. Rev., 203, 1–20, Goodman, J. and Weare, J.: Ensemble samplers with affine https://doi.org/10.1016/j.quascirev.2018.10.031, 2019. invariance, Comm. App. Math. Com. Sc., 5, 65–80, Li, C., Battisti, D. S., Schrag, D. P., and Tziperman, E.: https://doi.org/10.2140/camcos.2010.5.65, 2010. Abrupt climate shifts in Greenland due to displacements Henry, L. G., McManus, J., Curry, W. B., Roberts, N. L., Piotrowski, of the sea ice edge, Geophys. Res. Lett., 32, L19702, A. M., and Keigwin, L. D.: North Atlantic ocean circulation and https://doi.org/10.1029/2005GL023492, 2005. abrupt climate change during the last glaciation, Science, 353, Li, C., Battisti, D. S., and Bitz, C. M.: Can North At- 470–474, https://doi.org/10.1126/science.aaf5529, 2016. lantic Sea Ice Anomalies Account for Dansgaard- Huang, J. and Jaeglé, L.: Wintertime enhancements of sea salt Oeschger Climate Signals?, J. Climate, 23, 5457–5475, aerosol in polar regions consistent with a sea ice source https://doi.org/10.1175/2010JCLI3409.1, 2010. from blowing snow, Atmos. Chem. Phys., 17, 3699–3712, Lynch-Stieglitz, J.: The Atlantic meridional overturning circulation https://doi.org/10.5194/acp-17-3699-2017, 2017. and abrupt climate change, Annu. Rev. Mar. Sci., 9, 83–104, Huber, C., Leuenberger, M., Spahni, R., Flückiger, J., Schwander, https://doi.org/10.1146/annurev-marine-010816-060415, 2017. J., Stocker, T. F., Johnsen, S. J., Landais, A., and Jouzel, J.: Iso- Markle, B. R., Steig, E. J., Buizert, C., Schoenemann, S. W., Bitz, tope calibrated Greenland temperature record over Marine Iso- C. M., Fudge, T. J., Pedro, J. B., Ding, Q., Jones, T. R., White, www.clim-past.net/15/811/2019/ Clim. Past, 15, 811–825, 2019
You can also read


