Observations and simulation of intense convection embedded in a warm conveyor belt - how ambient vertical wind shear determines the dynamical impact
←
→
Page content transcription
If your browser does not render page correctly, please read the page content below
Weather Clim. Dynam., 2, 89–110, 2021
https://doi.org/10.5194/wcd-2-89-2021
© Author(s) 2021. This work is distributed under
the Creative Commons Attribution 4.0 License.

Observations and simulation of intense convection embedded in a
warm conveyor belt – how ambient vertical wind shear
determines the dynamical impact
Annika Oertel1,2 , Michael Sprenger1 , Hanna Joos1 , Maxi Boettcher1 , Heike Konow3 , Martin Hagen4 , and
Heini Wernli1
1 Institute for Atmospheric and Climate Science, ETH Zürich, Zürich, Switzerland
2 Institute of Meteorology and Climate Research (IMK-TRO), Karlsruhe Institute of Technology (KIT), Karlsruhe, Germany
3 Meteorological Institute, University of Hamburg, Hamburg, Germany
4 Institute of Atmospheric Physics, Deutsches Zentrum für Luft- und Raumfahrt, Oberpfaffenhofen, Germany

Correspondence: Annika Oertel (annika.oertel@kit.edu)

Received: 29 September 2020 – Discussion started: 9 October 2020
Revised: 13 January 2021 – Accepted: 15 January 2021 – Published: 2 February 2021

Abstract. Warm conveyor belts (WCBs) are dynamically              trajectories. The detailed ascent behavior of the WCB tra-
important, strongly ascending and mostly stratiform cloud-        jectories reveals that very intense convection with ascent
forming airstreams in extratropical cyclones. Despite the pre-    rates of 600 hPa in 30–60 min occurs, in addition to com-
dominantly stratiform character of the WCB’s large-scale          paratively moderate convection with slower ascent veloci-
cloud band, convective clouds can be embedded in it. This         ties as reported in previous case studies. In the second part
embedded convection leads to a heterogeneously structured         of this study, a systematic Lagrangian composite analysis
cloud band with locally enhanced hydrometeor content, in-         based on online trajectories for two sub-categories of WCB-
tense surface precipitation and substantial amounts of grau-      embedded convection – moderate and intense convection – is
pel in the middle troposphere. Recent studies showed that         performed. Composites of the cloud and precipitation struc-
embedded convection forms dynamically relevant quasi-             ture confirm the large influence of embedded convection: in-
horizontal potential vorticity (PV) dipoles in the upper tro-     tense convection produces very intense local surface precip-
posphere. Thereby one pole can reach strongly negative            itation with peak values exceeding 6 mm in 15 min and large
PV values associated with inertial or symmetric instabil-         amounts of graupel of up to 2.8 g kg−1 in the middle tropo-
ity near the upper-level PV waveguide, where it can inter-        sphere (compared to 3.9 mm and 1.0 g kg−1 for the moder-
act with and modify the upper-level jet. This study analyzes      ate convective WCB sub-category). In the upper troposphere,
the characteristics of embedded convection in the WCB of          both convective WCB trajectory sub-categories form a small-
cyclone Sanchez based on WCB online trajectories from a           scale and weak PV dipole, with one pole reaching weakly
convection-permitting simulation and airborne radar obser-        negative PV values. However, for this WCB case study –
vations during the North Atlantic Waveguide and Down-             in contrast to previous case studies reporting convective PV
stream Impact Experiment (NAWDEX) field campaign (in-             dipoles in the WCB ascent region with the negative PV pole
tense observation periods, IOPs, 10 and 11). In the first part,   near the upper-level jet – the negative PV pole is located east
we present the radar reflectivity structure of the WCB and        of the convective ascent region, i.e., away from the upper-
corroborate its heterogeneous cloud structure and the occur-      level jet. Moreover, the PV dipole formed by the intense con-
rence of embedded convection. Radar observations in three         vective WCB trajectories is weaker and has a smaller hori-
different sub-regions of the WCB cloud band reveal the dif-       zontal and vertical extent compared to a previous NAWDEX
fering intensity of its embedded convection, which is qual-       case study of WCB-embedded convection, despite faster as-
itatively confirmed by the ascent rates of the online WCB         cent rates in this case. The absence of a strong upper-level jet

Published by Copernicus Publications on behalf of the European Geosciences Union.
90                                     A. Oertel et al.: Observations and simulation of intense WCB-embedded convection

and the weak vertical shear of the ambient wind in cyclone          2016; Oertel et al., 2019). Compared to deep convective
Sanchez are accountable for the weak diabatic PV modifica-          storms, where reflectivities exceed 40–50 dBZ in the upper
tion in the upper troposphere. This implies that the strength       troposphere and updrafts exceed 10–15 m s−1 (e.g., Carbone,
of embedded convection alone is not a reliable measure for          1982; Miller et al., 1988; Steiner et al., 1995), the ascent
the effect of embedded convection on upper-level PV mod-            within embedded convection was reported to be slower with
ification and its impact on the upper-level jet. Instead, the       1–5 m s−1 with radar reflectivities reaching approximately
profile of vertical wind shear and the alignment of embedded        20–30 dBZ (Crespo and Posselt, 2016; Oertel et al., 2019;
convection with a strong upper-level jet play a key role for the    Binder et al., 2020; Gehring et al., 2020; Blanchard et al.,
formation of coherent negative PV features near the jet. Fi-        2020).
nally, these results highlight the large case-to-case variability      It is well known that WCBs are dynamically relevant
of embedded convection not only in terms of frequency and           airstreams in extratropical cyclones that can modify the
intensity of embedded convection in WCBs but also in terms          larger-scale flow evolution during their ascent from the
of its dynamical implications.                                      boundary layer into the upper troposphere (e.g., Grams et al.,
                                                                    2011; Binder et al., 2016; Joos and Forbes, 2016; Rodwell
                                                                    et al., 2017). Their impact on the upper-tropospheric flow can
                                                                    be conveniently analyzed with the potential vorticity (PV)
1    Introduction                                                   framework (Hoskins et al., 1985) because the intense cloud
                                                                    diabatic processes during their deep ascent distinctly mod-
Convective storms form an important part of the climate sys-        ify the PV distribution, typically leading to a wide region of
tem (Houze, 1973) and still constitute one of the major ob-         low-PV air in the upper tropospheric ridge (e.g., Wernli and
stacles for the improvement of weather and climate predic-          Davies, 1997; Pomroy and Thorpe, 2000; Madonna et al.,
tions (e.g., Ban et al., 2014; Sherwood et al., 2014; Holloway      2014; Methven, 2015). Harvey et al. (2020) and Oertel et al.
et al., 2014). In contrast to the well-studied so-called iso-       (2020) showed that smaller-scale regions of strongly en-
lated and often tropical convection, convective clouds in the       hanced diabatic heating, such as from convective ascent,
mid-latitudes can be an integral part of larger-scale weather       embedded in this large-scale WCB ascent region can form
systems. In the extratropical storm track region, convective        quasi-horizontal upper-level PV dipoles with a positive PV
clouds can be embedded within larger-scale cloud bands of           pole to the east towards the ridge, and a region of negative
extratropical cyclones (e.g., Browning et al., 1973; Brown-         PV to the west near the upper-level PV waveguide. The latter
ing and Roberts, 1999; Neiman et al., 1993; Naud et al.,            can be relevant for the upper-level jet structure and the larger-
2015; Flaounas et al., 2016), resulting in mesoscale variabil-      scale flow evolution. The smaller-scale and narrow regions
ity of the cloud and precipitation structure. Recent studies        of increased hydrometeor production associated with the lo-
also corroborated the occurrence of convection embedded             cally confined regions of embedded convective ascent lead
in the warm conveyor belt (WCB) airstream (Binder, 2016;            to strong horizontal diabatic heating gradients (∇h θ̇ ), which
Crespo and Posselt, 2016; Rasp et al., 2016; Flaounas et al.,       are substantially stronger than for a purely slantwise ascend-
2016, 2018; Oertel et al., 2019, 2020; Blanchard et al., 2020)      ing WCB that forms an extended region of moderate heat-
as originally proposed by Neiman et al. (1993) in their so-         ing. This subsequently influences the resulting PV signature
called “escalator-elevator” concept. In the classical perspec-      (Hoskins et al., 1985):
tive, the WCB (e.g., Browning, 1990; Madonna et al., 2014)
is described as a gradually ascending and mostly stratiform-
cloud-forming airstream in extratropical cyclones. Its slant-       D      1           1           ∂ θ̇
                                                                       PV = ω · ∇ θ̇ =     (f + ζ ) + ωh · ∇h θ̇ ,               (1)
wise ascending motion has been referred to as “escalator”-          Dt     ρ           ρ           ∂z
like ascent. In contrast, the phases of rapid convective ascent
                                                                    where PV is defined as (Ertel, 1942)
embedded within this large-scale airstream were referred to
as the “elevator”.                                                         1
   The convective activity can be directly embedded within          PV =     ω · ∇θ                                              (2)
                                                                           ρ
the large-scale WCB cloud band and is characterized by
a locally denser cloud with enhanced hydrometeor con-               and ρ is density, θ is potential temperature, θ̇ represents la-
tent and enhanced surface precipitation intensity (Oertel           tent heating or cooling, and ω is 3D absolute vorticity defined
et al., 2019, 2020). From an observational perspective, WCB-        as
embedded convection is typically “hidden” within the large-
scale cloud band of the WCB. In radar observations it has
been identified through increased horizontal heterogeneity of       ω = ∇ × u + 2 = ξ i + ηj + (f + ζ )k.                       (3)
the radar reflectivity, the absence of a well-defined bright
band and the occurrence of narrow plumes of enhanced                   Thereby, u is the 3D wind vector,  is the vector of earth
radar reflectivity (Neiman et al., 1993; Crespo and Posselt,        rotation, ξ and η are the horizontal vorticity components in

Weather Clim. Dynam., 2, 89–110, 2021                                                    https://doi.org/10.5194/wcd-2-89-2021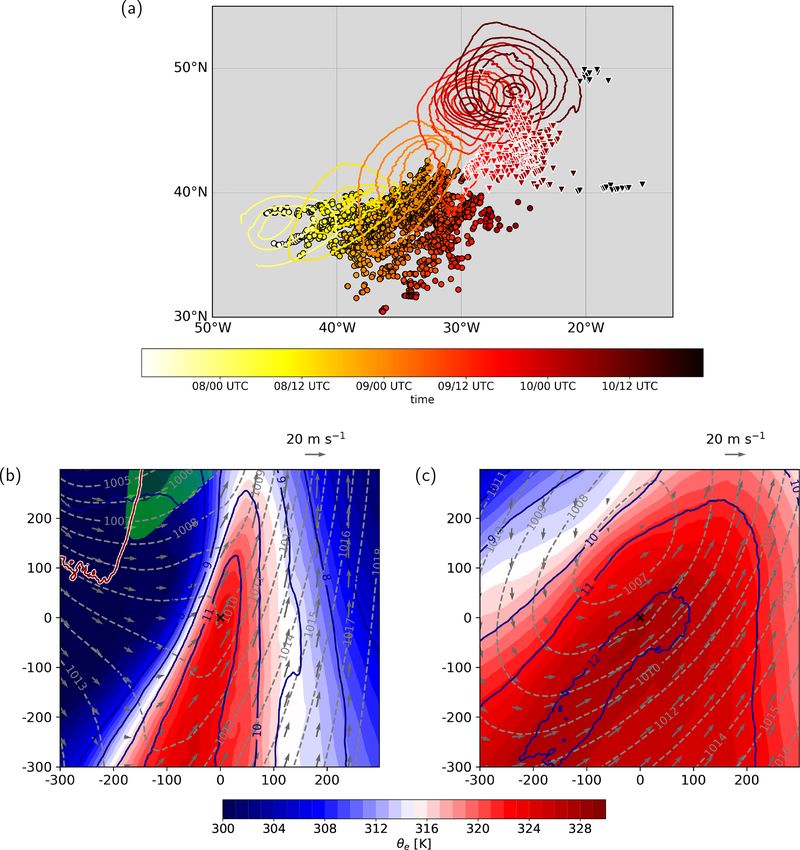
A. Oertel et al.: Observations and simulation of intense WCB-embedded convection                                                   91

x and y directions, f is the Coriolis parameter, f + ζ is the     with an accelerated upper-level jet. Hence, in certain synoptic
absolute vertical vorticity, and ωh denotes the horizontal vor-   situations, the dynamically unstable1 region of convectively
ticity (ωh = ξ i + ηj).                                           formed negative PV and its associated anticyclonic absolute
   Scale analysis shows that the vertical components of           vertical vorticity can become relevant as it interacts with and
Eq. (1) (first term) are dominant on large scales (such as        modifies the upper-level PV waveguide (Harvey et al., 2020;
WCB ascent with length scales of the order of 106 m, where        Oertel et al., 2020).
Ro  1, with the Rossby number Ro = fU·L ), whereas for              Although recent case studies have corroborated the pres-
smaller length scales such as convection (Ro > 1) the hori-       ence of embedded convection in WCBs (Rasp et al., 2016;
zontal components (second term in Eq. 1) become increas-          Crespo and Posselt, 2016; Flaounas et al., 2016, 2018; Oertel
ingly important (Haynes and McIntyre, 1987; Martínez-             et al., 2019), several major issues are still uncertain: (i) where
Alvarado et al., 2016; Harvey et al., 2020). The latter also      and how often is convection generally embedded in the WCB
applies if the length scale of diabatic heating occurs on a       ascent region? (ii) How variable is the strength of embedded
smaller spatial scale than the large-scale flow, as for exam-     convection in WCBs? (iii) Does WCB-embedded convection
ple for localized heating embedded in the large-scale WCB         consistently form coherent PV dipoles with the negative pole
ascent (Harvey et al., 2020). Idealized simulations (Chagnon      in the vicinity of the upper-level jet (as shown in the previous
and Gray, 2009) show a gradual tilt from a vertically oriented    case study by Oertel et al., 2020)?
PV dipole – where (f + ζ ) ∂∂zθ̇ dominates – to a horizontally       While the first point requires a climatological analysis of
oriented PV dipole – where ωh · ∇h θ̇ becomes increasingly        embedded convection, here we specifically address the vari-
important – with a decrease in the scale of the system and an     able strength and dynamical signatures of embedded convec-
increase in the environmental wind shear.                         tion in a specific WCB. The aim of this detailed WCB case
   As a consequence, the typical large-scale and slantwise        study is two-fold: on the one hand, we corroborate the con-
WCB ascent forms predominantly a vertical PV dipole               cept of embedded convection in WCBs and identify WCB-
(Eq. 1, first term) with increased low-level PV and a             embedded convection with differing strengths based on rare
widespread region of low-PV air in the upper troposphere          airborne radar observations of a WCB and online trajecto-
(e.g., Wernli and Davies, 1997; Joos and Wernli, 2012;            ries in a convection-permitting simulation. On the other hand,
Madonna et al., 2014). In contrast, convection in a verti-        we systematically analyze the characteristics and the PV sig-
cally sheared environment forms quasi-horizontal mid-level        nature associated with (i) intense and (ii) moderate WCB-
to upper-level PV dipoles that are centered around the con-       embedded convection. Therefore, we investigate the WCB
vective updraft with the negative PV pole to the left of the      associated with the surface cyclone and upper-level PV cutoff
vertical wind shear vector and the positive PV pole to the        Sanchez that occurred during the North Atlantic Waveguide
right of the vertical wind shear vector (Eq. 1, second term).     and Downstream Impact Experiment (NAWDEX, Schäfler
The formation of such quasi-horizontal PV dipole struc-           et al., 2018) field campaign.
tures have been found in idealized simulations of isolated           Specifically, we address the following questions:
cumulus-scale convection (Chagnon and Gray, 2009), in case
                                                                    1. What do airborne radar observations of the WCB cloud
studies of mesoscale convective systems (Davis and Weis-
                                                                       band in cyclone Sanchez reveal about the strength of
man, 1994; Chagnon and Gray, 2009; Hitchman and Rowe,
                                                                       embedded convective activity (Sect. 4)?
2017; Clarke et al., 2019), in mid-latitude convective up-
drafts with varying large-scale flow conditions (Weijenborg
                                                                    2. What are the (thermodynamic) characteristics associ-
et al., 2015, 2017; Müller et al., 2020), and embedded in the
                                                                       ated with WCB-embedded convection in this case study
baroclinic WCB ascent region (Harvey et al., 2020; Oertel
                                                                       (Sect. 5.3 and 5.4)?
et al., 2020). These PV anomalies can reach a magnitude of
±10 PVU and hence exceed the typical range of synoptic-             3. How important is the strength of WCB-embedded
scale PV.                                                              convection for the resulting upper-level PV modifica-
   The convective-scale PV anomalies are dynamically rel-              tion compared to characteristics of the ambient flow
evant as they are associated with mesoscale circulation                (Sect. 5.5 and 5.6)?
anomalies (Oertel et al., 2020; Oertel and Schemm, 2020)
and can interact with the larger-scale flow (Clarke et al.,         This study is structured in the following way: after intro-
2019; Harvey et al., 2020; Oertel et al., 2020). Oertel et al.    ducing the data and methodology (Sect. 2) and presenting the
(2020) and Harvey et al. (2020) showed that convective ac-        evolution of the WCB and its embedded convection (Sect. 3),
tivity and narrow bands of strong latent heating embedded in
the baroclinic region ahead of an upper-level trough can form        1 Negative PV values in the Northern Hemisphere are related to
elongated bands of negative PV at the jet-facing side of the      hydrostatic, inertial or symmetric instability (e.g., Hoskins, 2015)
heating region. These negative PV bands strengthen the isen-      and have been associated with mesoscale circulations (e.g., Ben-
tropic PV gradient across the tropopause and are associated       netts and Hoskins, 1979; Schultz and Schumacher, 1999; Volonté
                                                                  et al., 2020).

https://doi.org/10.5194/wcd-2-89-2021                                                 Weather Clim. Dynam., 2, 89–110, 2021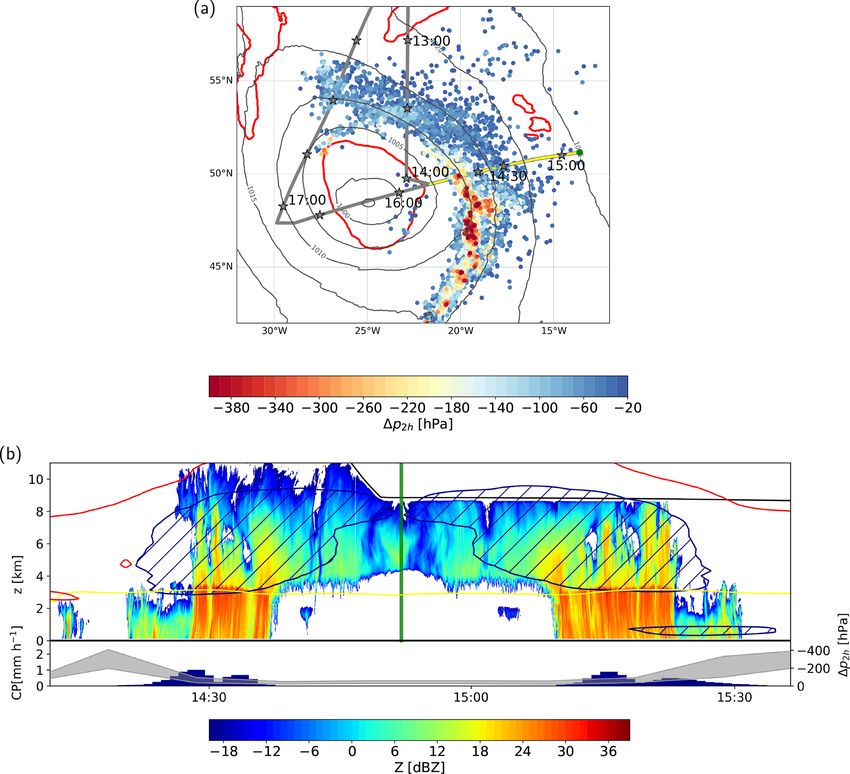
92                                      A. Oertel et al.: Observations and simulation of intense WCB-embedded convection

the first part of the results (Sect. 4) shows the radar-based per-   grated Forecasting System (IFS) of the European Centre for
spective of the WCB cloud band and qualitatively compares            Medium-Range Weather Forecasts (ECMWF), which is run
the observations with online trajectories from a convection-         with a spatial resolution of approximately 9 km with 137 ver-
permitting simulation. In the second part (Sect. 5), we per-         tical hybrid pressure-sigma levels – operational model ver-
form a 3D Lagrangian composite analysis to investigate the           sion in October 2016 (cycl 41r2, ECMWF, 2016) – and in-
PV modification by two categories of convective WCB tra-             cludes parameterized shallow and deep convection (Tiedtke,
jectories – intensely and more moderately ascending con-             1989; Bechtold et al., 2008, 2014). The trajectories are
vective WCB trajectories. Throughout this study, results are         computed with the Lagrangian analysis tool LAGRANTO
compared with cyclone Vladiana, a previous case study of             (Wernli and Davies, 1997; Sprenger and Wernli, 2015) from
WCB-embedded convection, which also occurred over the                1-hourly 3D wind fields that are interpolated to a regular 0.5◦
North Atlantic during the NAWDEX field campaign 2 weeks              grid and combine 3-hourly analyses with operational short-
earlier (Oertel et al., 2020).                                       term forecasts in between. To identify the WCB, trajectories
                                                                     were started globally every hour and every 80 km in the hor-
                                                                     izontal on 14 vertical levels (every 25 hPa between 1025 and
2     Data                                                           700 hPa) similar to the method applied in Madonna et al.
                                                                     (2014). WCB trajectories are subsequently selected as tra-
2.1    Airborne radar observations
                                                                     jectories with ascent rates of at least 600 hPa in 48 h (e.g.,
The investigated cyclone Sanchez occurred in October 2016            Madonna et al., 2014).
during the NAWDEX field campaign (IOPs 10 and 11,
Schäfler et al., 2018). During this campaign the German              2.3   Convection-permitting simulation and online WCB
research aircraft HALO (High Altitude and LOng Range                       trajectories
Research Aircraft) observed the cloud structure of the cy-
clone and its associated WCB twice on two consecutive days.
The research aircraft carries the HALO Microwave Pack-               To simulate the WCB and its embedded convection, we use
age (HAMP), which includes the high-sensitivity cloud radar          the fully elastic nonhydrostatic limited-area model COSMO
MIRA-36 (Melchiona et al., 2008; Mech et al., 2014). The             (Consortium for Small-scale Modeling; Baldauf et al., 2011;
downward-pointing Doppler radar operates at a frequency              Doms and Baldauf, 2018). The domain is centered in the
of 35.5 GHz and reaches an expected airborne sensitivity of          eastern North Atlantic and extends from about 55◦ W to 5◦ E
−38 dBZ at 5 km distance (Mech et al., 2014), which re-              and 30 to 65◦ N (e.g., Fig. 1j). The simulation is run in
duces to ≈ −30 dBZ at 13 km distance (Konow et al., 2019).           convection-permitting mode with a horizontal grid-spacing
The measured along-flight radar reflectivity Z has been post-        of 0.02◦ (∼2.2 km) and with 60 vertical levels. We employed
processed, offset-corrected and corrected for aircraft attitude      a one-moment six-category cloud microphysics scheme in-
(Ewald et al., 2019; Konow et al., 2019) and is obtained from        cluding prognostic water vapor (qv ), liquid (LWC) and ice
Konow et al. (2018).                                                 (IWC) cloud water content, rain (RWC), snow (SWC) and
   To characterize the large-scale cloud band of the WCB             graupel (GWC), which is important for the explicit sim-
and its embedded convection we analyze the radar reflectiv-          ulation of deep convection (Baldauf et al., 2011). While
ity structure where the HALO flight track intersects the WCB         deep convection is treated explicitly at 2.2 km (e.g., Ban
cloud band. The location of WCB air parcels is determined            et al., 2014), we applied the reduced Tiedtke scheme for
by the operational analyses from the ECMWF (see Sect. 2.2).          shallow convection (Tiedtke, 1989; Baldauf et al., 2011).
The radar reflectivity structure of convective clouds is rela-       3D COSMO fields were output every 15 min, which al-
tively heterogeneous compared to homogeneous stratiform              lows the large temporal and spatial variability of embedded
clouds (e.g., Steiner et al., 1995) and often appears as con-        convection to be captured. The simulation is initialized at
fined towers (Hogan et al., 2002; Murphy et al., 2017).              00:00 UTC on 7 October 2016 and runs for 106 h with initial
Here, we visually identify convective regions, where narrow          and lateral boundary conditions from the ECMWF analyses
plumes of increased values of Z rise above the 0 ◦ C isotherm        with a horizontal resolution of 0.1◦ every 6 h.
(see Hogan et al., 2002; Murphy et al., 2017; Oertel et al.,            The detailed WCB ascent behavior is analyzed with on-
2019). Further applied indications for convective activity are       line trajectories computed during the COSMO simulation
locally enhanced radar reflectivity, a broken cloud top, spa-        (Miltenberger et al., 2013, 2014), which are used to identify
tially heterogeneous cloud top height and the absence of a           phases of embedded convective ascent in the WCB ascent re-
pronounced radar bright band.                                        gion (Rasp et al., 2016; Oertel et al., 2019, 2020). The online
                                                                     trajectories are started every 2 h during the first 96 h of the
2.2    Offline WCB trajectories from ECMWF analyses                  simulation from a predefined starting region (which is de-
                                                                     termined based on the offline WCB trajectory positions) at
The large-scale WCB ascent region is identified with of-             seven vertical levels (250, 500, 750, 1000, 1500, 2000 and
fline trajectories from the operational analyses from the Inte-      2500 m a.s.l.).

Weather Clim. Dynam., 2, 89–110, 2021                                                     https://doi.org/10.5194/wcd-2-89-2021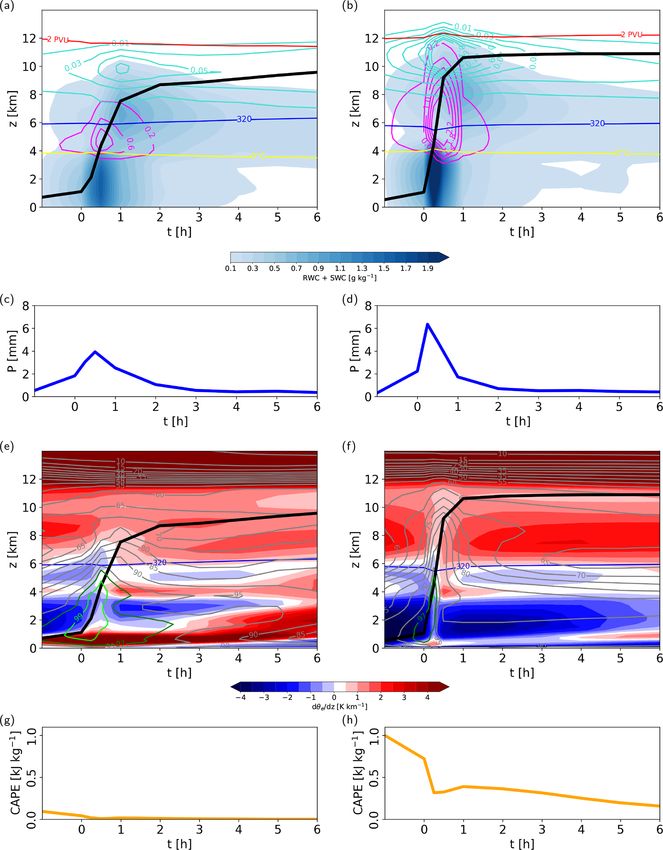
A. Oertel et al.: Observations and simulation of intense WCB-embedded convection 93
The local strength of WCB trajectory ascent is quanti- paratively large root mean square error and ensemble spread
fied through the centered 2 h net pressure change 1p2 h (t) = of 500 hPa geopotential (Schindler et al., 2020). Uncertainty
p(t + 1 h) − p(t − 1 h) along the online WCB trajectories, in the PV cutoff position was associated with a misrepresen-
which is calculated for all trajectories that exceed an ascent tation of the heavy precipitation event that occurred down-
rate of 600 hPa in 48 h. WCB ascent phases have previously stream over southern France (Binder et al., 2020).
been considered as convective if 1p2 h < −320 hPa (2 h)−1
(Rasp et al., 2016; Oertel et al., 2019). More extreme values 3.2 WCB ascent and cloud structure
of 1p2 h < −600 hPa (2 h)−1 can, however, also be embed-
ded in the WCB ascent region (Rasp et al., 2016; Oertel et al., During its life cycle, the cyclone is associated with a promi-
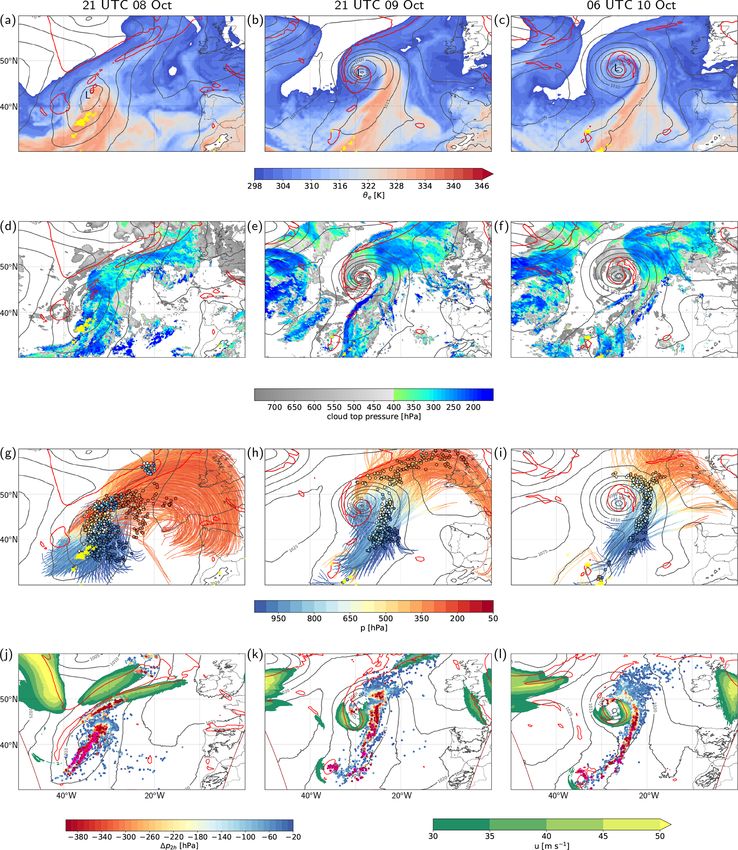
2019, 2020). nent WCB (Fig. 1g–i). After the interaction with the upper-
level trough and developing PV streamer at approximately
45◦ N, the WCB trajectories ascend poleward and form a
3 Evolution of the WCB and its embedded convection pronounced anticyclonic branch that reaches 60◦ N (Fig. 1g,
h). The WCB ascends primarily in two regions, in a narrow
3.1 Synoptic situation band ahead of the surface cold front and above the warm
frontal surface, and forms a pronounced cloud band with
The surface cyclone that was later associated with the upper- cloud tops exceeding 200 hPa (Fig. 1d–f). The large-scale
level PV cutoff Sanchez has formed several days before the cloud band strongly associated with warm frontal WCB as-
research flights on 9 and 10 October 2016. The genesis re- cent covers large parts of the upper-level ridge (Fig. 1d, e)
gion south of 40◦ N is situated in a warm and moist envi- and wraps cyclonically around the cyclone center during the
ronment where the equivalent potential temperature (θe ) at PV cutoff formation (Fig. 1e). Both cold and warm frontal
850 hPa exceeds 335 K and is located south of the stronger, cloud bands are characterized by high clouds with heteroge-
relatively zonal polar jet with 60 m s−1 at 60◦ N. In the early neously structured cloud tops (Fig. 1d–f). In particular, the
phase, the surface cyclone remains quasi-stationary below an cold frontal clouds form a narrow vertically extended band
upper-level PV anomaly and west of a surface anticyclone with cloud tops exceeding 150–200 hPa (Fig. 1e, f). South of
and only travels slowly eastward and northward across the 40◦ N, deep clouds with very high cloud tops coincide with
North Atlantic (Oertel, 2019, Fig. 5.2). lightning observations from the World Wide Lightning Lo-
Eventually, on 8 October the surface cyclone propagates cation Network (WWLLN; Abarca et al., 2010) indicating
poleward influenced by the steering flow of the anticyclone that deep convective clouds are embedded in the extended
located to its east and the upper-level trough that approaches WCB cloud band (Fig. 1a, b). This convective character of
the cyclone from the northwest (Fig. 1a, d). During the pole- the cloud band is particularly pronounced in the early phase
ward propagation the surface cyclone intensifies and the cold of the WCB (e.g., Fig. 1d).
and warm fronts strengthen in hand with the intensification
of the cyclone (Fig. 1b, c). A first PV streamer breakup 3.3 Evolution of embedded convection
occurs early on 9 October (see Schäfler et al., 2018), but
the stratospheric PV cutoff does not interact with the sur- The position of the upper-level trough (cf. Fig. 1a, j), its thin-
face cyclone and propagates equatorward. The key interac- ning and the PV streamer development (cf. Fig. 1b, k) as well
tion between the surface cyclone and an upper-level PV cut- as the PV cutoff formation are well captured by the COSMO
off, which is clearly visible at 320 K, occurs later on 9 Oc- simulation (cf. Fig. 1c, l). Moreover, the WCB ascent region
tober at 45◦ N during the second PV streamer roll-up and of the COSMO simulation (Fig. 1j–l) agrees with the WCB
cutoff formation. Then, the PV cutoff and the surface cy- ascent region of the ECMWF WCB trajectories (Fig. 1g–i)
clone lock phases, leading to rapid intensification of the sur- and coincides with the large-scale cloud band (Fig. 1d–f).
face cyclone (Fig. 1b, c). During this intensification the sur- To investigate the WCB ascent behavior, the 2 h ascent
face pressure drops by 15 hPa within 15 h to a minimum of rates 1p2 h along online trajectories are shown in Fig. 1j–l.
985 hPa. The surface cyclone and the upper-level PV cutoff Slantwise and stratiform cloud-forming WCB ascent is typ-
align barotropically (Fig. 1b, c) and propagate eastward to- ically characterized by moderate 1p2 h values of approxi-
wards southern Europe (not shown), where the PV cutoff and mately −50 to −300 hPa, while embedded convective as-
associated WCB lead to high-impact weather across southern cent phases reach 1p2 h values of −320 to −400 hPa and
France, including heavy precipitation, flooding and strong can even exceed −600 hPa (Rasp et al., 2016; Oertel et al.,
winds (Schäfler et al., 2018; Binder et al., 2020). Schäfler 2019). For cyclone Sanchez, such convective ascent phases
et al. (2018) and Oertel (2019, Chapter 5) provide a more de- are frequently embedded within the overall slantwise WCB
tailed description of the synoptic situation and the evolution ascent region (Fig. 1j–l). In agreement with the cloud struc-
of the surface cyclone and associated upper-level PV cut- ture and lightning observations (Fig. 1d), the most intense
off. During this period (8–11 October) the forecast quality embedded convection (1p2 h < −600 hPa) occurs frequently
in the North Atlantic region was relatively low with a com- in the early phase before the PV cutoff formation near the
https://doi.org/10.5194/wcd-2-89-2021 Weather Clim. Dynam., 2, 89–110, 2021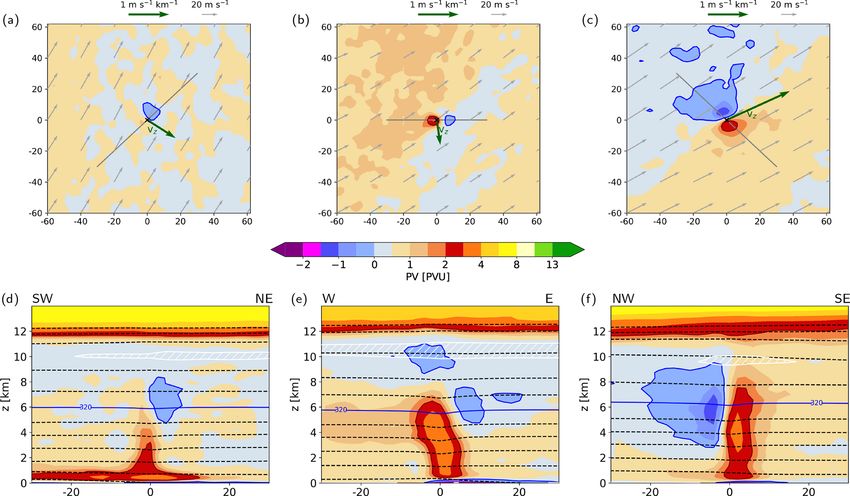
94                                       A. Oertel et al.: Observations and simulation of intense WCB-embedded convection

Figure 1. Overview of the surface cyclone and PV cutoff Sanchez: (a–c) sea level pressure (SLP, grey contours, every 5 hPa), 2 PVU at 320 K
(red) and equivalent potential temperature (θe ) at 850 hPa (colors, in K) from the ECMWF dataset, and lightning observations (yellow) at
(from left to right) 21:00 UTC on 8 October 2016, 21:00 UTC on 9 October 2016 and 06:00 UTC on 10 October 2016; (d–f) as (a–c) but
for satellite-derived cloud top pressure (colors, in hPa), with data from Meteosat Second Generation Satellites (EUMETSAT; Schmetz et al.,
2002); (g–i) as (a–c) but for WCB trajectories (colored according to pressure) from the ECMWF dataset started 18 h before the times shown
in (a–c) and WCB trajectory positions (circles colored according to pressure) for the times shown in (a–c); (j–l) centered 2 h pressure change
(1p2 h , colored circles, in hPa) along ascending WCB trajectories from the convection-resolving COSMO simulation, 2 PVU (red) contour
and jet (colors, in m s−1 ) at 320 K, and SLP (grey contours, every 5 hPa) from the COSMO simulation for the same times as shown above.

Weather Clim. Dynam., 2, 89–110, 2021                                                           https://doi.org/10.5194/wcd-2-89-2021
A. Oertel et al.: Observations and simulation of intense WCB-embedded convection 95
cyclone center and at the cold front (Fig. 1j, magenta out- tor across the warm front near the cyclone center (Fig. 2a).
line). After the northward propagation of the cyclone, these Before turning back and traversing the PV streamer a second
intense convective ascent phases with 1p2 h < −600 hPa be- time from east to west, thereby crossing the front, HALO ob-
come scarcer, but 1p2 h values still remain below −400 hPa served the WCB cloud band between 13:20 and 14:00 UTC
(Fig. 1k, l). (Fig. 2a, yellow line). For the second observation of the WCB
During the PV streamer roll-up and cutoff formation and cloud band on 9 October, HALO traversed the large-scale
simultaneous deepening of the surface cyclone, the ascend- cloud band from west to east at 16:00 UTC north of 50◦ N
ing WCB air parcels aggregate mainly in two banded regions, (Fig. 2a, violet line).
ahead of the cold front and at the warm front, with 1p2 h Stratiform cloud band related to slantwise WCB ascent.
values that vary between −25 hPa and −400 to −600 hPa at The observation of the WCB cloud band in the northern part
the cold front (Fig. 1k, l). Convective ascent with 1p2 h < of the WCB outflow at 16:00 UTC emphasizes its predom-
−320 hPa occurs ahead of the surface cold front and near the inantly stratiform character (Fig. 2b), which coincides with
warm front northeast of the cyclone center and is directly a region of comparatively slowly ascending WCB trajecto-
embedded in the region of slower slantwise WCB ascent. ries with 1p2 h in the range from −25 to −50 hPa (Fig. 2a,
Although convective ascent phases with 1p2 h < −320 hPa violet line and b, grey shading). The large-scale cloud band,
are embedded in the WCB ascent region at both the cold extending to about 9 km height, is characterized by a rela-
and warm front, the warm-frontal convective WCB ascent tively homogeneous radar reflectivity, a closed upper-level
is generally more moderate with 1p2 h values of up to only cloud top and a well-defined bright band at 2 km height. This
−350 hPa, in contrast to the intense cold frontal convection extended cloud band is associated with WCB ascent in the
with 1p2 h values in the range of −400 to −600 hPa. mid-troposphere to upper troposphere between 4 and 9 km
In summary, convective activity identified from COSMO height. The mostly stratiform character of this cloud band
online trajectories is frequently embedded in the WCB of cy- is confirmed by the IFS dataset, which produces hardly any
clone Sanchez at the cold and warm fronts. The embedded convective precipitation along the flight track (Fig. 2b, bot-
convective ascent phases show substantial variability in in- tom panel), but moderate large-scale precipitation of up to
tensity, whereby the most intense convective ascent occurs 2.5 mm h−1 (not shown).
near the cyclone center and ahead of the cold front primar- Convective plumes associated with WCB ascent. The
ily in the early phase and south of 45◦ N. This allows for an WCB cloud band further south at 48◦ N near the cyclone cen-
investigation of the effect of intense vs. moderate embedded ter (Fig. 2c) differs substantially from the stratiform cloud
convection on surface precipitation and upper-level PV mod- structure observed in the northern part of the WCB cloud
ification. This will follow in Sect. 5, after a detailed analysis band (Fig. 2b). The radar reflectivity Z in this region is
of airborne radar observations in the next section. very heterogeneous with spatially confined narrow convec-
tive plumes that extend from the boundary layer to 6–8 km
height and locally exceed the cloud top height in their di-
4 Radar reflectivity structure of the WCB rect surroundings, which accentuates the convective charac-
ter (Fig. 2c). Due to these vertically extended narrow con-
During the research flights on 9 and 10 October, the HALO vective towers, the cloud top is heterogeneous and cloud
aircraft observed the WCB cloud band several times. The top height locally varies between 5–8 km. The radar reflec-
different flight legs captured different stages of the WCB, tivity Z within the convective plumes amounts to approxi-
including slantwise and stratiform cloud-forming regions as mately 25 dBZ, with values ranging from 20–25 dBZ even
well as two convective regions with 1p2 h values ranging in the upper troposphere several kilometers above the melt-
from −25 hPa in the stratiform regions to −400 hPa in the ing layer. Hence, although Z does not exceed 25 dBZ, the
convective regions near the flight track (Figs. 2a and 3a). embedded convective updrafts can be clearly identified as in-
As the southernmost flight legs of HALO were located at dividual narrow plumes, which directly coincide with WCB
around 47◦ N, the most intense convective regions with 1p2 h air masses between 1 and 6 km height. This qualitatively
< −600 hPa (Sect. 3.3 and Fig. 1j) were not captured. The confirms results from previous studies (Crespo and Posselt,
differing WCB ascent behavior seen in 1p2 h values is also 2016; Oertel et al., 2019; Blanchard et al., 2020), although
reflected in the radar observations. In the following, three absolute values of radar reflectivity are difficult to com-
contrasting radar reflectivity cross sections of the extended pare since in strongly precipitating regions attenuation ef-
WCB cloud band are discussed, whereby the large-scale fects through Mie scattering have to be considered at shorter
WCB ascent region is identified through offline trajectories wavelengths (e.g., Ewald et al., 2019). This affects systems
from the ECMWF analyses. like the 94 GHz CloudSat radar (analyzed by Crespo and
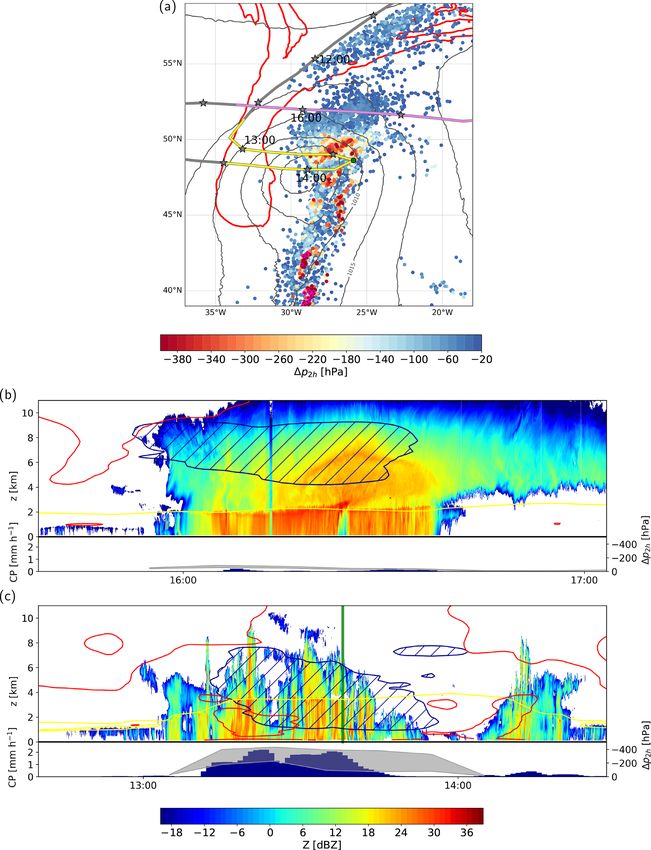
The first observation of the WCB cloud band on 9 Oc- Posselt, 2016) and the 95 GHz RASTA radar (analyzed by
tober took place from 13:00 to 14:00 UTC at around 48◦ N Blanchard et al., 2020) more strongly than the MIRA-36 used
(Fig. 2a). At 13:00 UTC the HALO crossed the PV streamer here, which uses a slightly larger wavelength.
from west to east and subsequently entered the warm sec-
https://doi.org/10.5194/wcd-2-89-2021 Weather Clim. Dynam., 2, 89–110, 2021
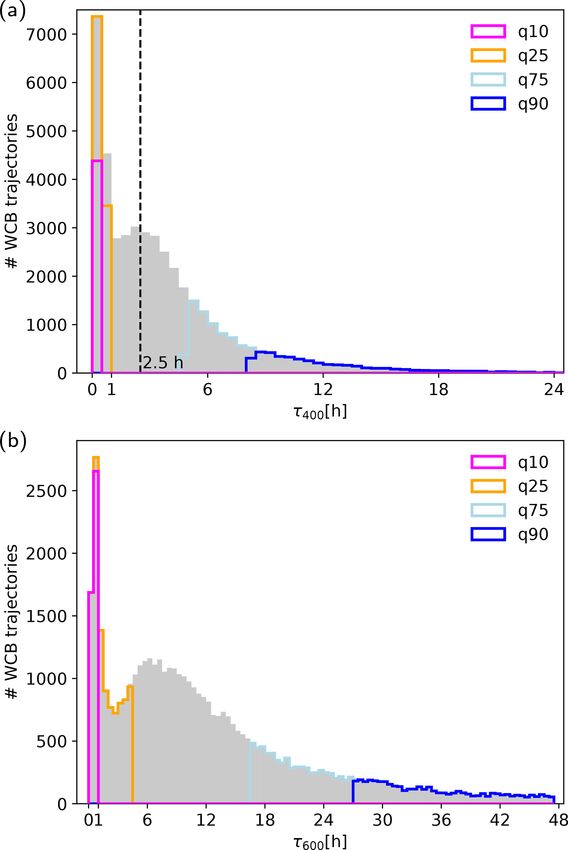
96                                    A. Oertel et al.: Observations and simulation of intense WCB-embedded convection

   Near the observed convective plumes, COSMO WCB                 close to the cyclone center, at a distance of about 300 km
trajectories frequently perform a convective ascent with          from the stratiform region. Moreover, the various degrees
1p2 h < −400 hPa (Fig. 2a, yellow line and c, grey shading).      of heterogeneity of the radar reflectivity structure – which
These phases of convective WCB ascent aggregate north-            reflect the strength of embedded ascent phases – illustrate
east of the cyclone center and are directly embedded in           the almost continuous transformation from the slantwise to
a region of slantwise WCB ascent with 1p2 h values be-            the convective WCB ascent regime (see Oertel et al., 2019).
tween −50 and −150 hPa. Near the flight track, additional         Hence, the radar observations emphasize the diverse repre-
regions of convective WCB ascent with 1p2 h < −320 hPa            sentation and manifold character of the WCB cloud band in-
occur near the warm and cold fronts. The convective char-         cluding its embedded convection, thereby corroborating its
acter of the WCB cloud band is corroborated by the pro-           heterogeneity.
duction of substantial convective precipitation by the IFS pa-       The comparison between the airborne radar observations
rameterization scheme (Fig. 2c, bottom panel). The compar-        and the online trajectories from the convection-permitting
ison between the observations from both flight legs empha-        simulation shows that qualitatively the COSMO online tra-
sizes the diverse cloud structure associated with the WCB         jectories cannot only successfully identify regions of embed-
that can range from a homogeneous, large-scale, closed-top        ded convection in the WCB ascent region but can also differ-
cloud band (Fig. 2b) to a heterogeneously structured cloud        entiate between different degrees of the strength of embed-
with embedded convective plumes and a broken cloud top            ded convection. In summary, regions with stronger convec-
(Fig. 2c).                                                        tive updrafts include well-defined individual plumes of in-
   Weaker convection embedded in extended WCB cloud               creased Z and are characterized by large spatial heterogene-
band. The flight on 10 October sampled the WCB ascent             ity of Z. These regions also coincide with abundant convec-
and outflow region twice during two subsequent west–east          tive WCB ascent in the COSMO simulation with 1p2 h <
traverses (Fig. 3a, yellow line) and provides another ex-         −400 hPa. Weaker embedded convection, however, stands
ample of embedded convection in the WCB ascent region             out less against the large-scale stratiform cloud band but can
(Fig. 3b). Near the flight track, WCB air parcels ascend with     nevertheless be identified by enhanced heterogeneity and less
1p2 h values between −250 and −320 hPa with few WCB               coherent, vertically extended regions of increased Z. In the
air parcels with 1p2 h below −320 hPa (Fig. 3a and b, grey        COSMO simulations, this weaker embedded convection can
shading). These ascent rates are faster than a purely slantwise   be identified through intermediate 1p2 h values, which are
ascending WCB trajectory (1p2 h ≈ −50 hPa; Fig. 2b), but          substantially larger than for a pure slantwise ascent, but still
the convective WCB ascent phases are slightly slower and          slower than the stronger convective updrafts observed near
less frequent than the extended region of convective WCB          the cyclone center. In the following, we extend the analy-
ascent near the cyclone center on 9 October (Fig. 2c). In the     sis of embedded convection beyond the region where HALO
radar observations the convective plumes at around 14:30 and      observed the WCB cloud band; i.e., we also include very
15:15 UTC, which also approximately coincide with param-          intense convection in the early phase of the cyclone with
eterized convective precipitation and small 1p2 h values, are     1p2 h < −600 hPa (Fig. 1j).
less well defined and stand out less (Fig. 3b) compared to the
extended region with embedded convection near the cyclone
center (Fig. 2c). Moreover, the regions of faster WCB ascent,     5   Characteristics of intense vs. moderate
characterized by narrow locally confined regions of enhanced          WCB-embedded convection
radar reflectivity, are directly embedded in the larger-scale
vertically elevated cloud band with stratiform characteris-       Radar observations and online WCB trajectories showed
tics, such as regions of homogeneous radar reflectivity and       the frequent occurrence of convection with differing ascent
a bright band which is visible in most regions. Nevertheless,     speeds embedded in the WCB of cyclone Sanchez. In the fol-
the large-scale WCB cloud band is more heterogeneous than         lowing, we systematically compare characteristics of intense
the stratiform cloud band in the northern part of the WCB         vs. moderate WCB-embedded convection in the COSMO
(Fig. 2b) and includes confined plumes of locally increased       simulation. In addition to 1p2 h , we now use two alterna-
radar reflectivity that extend up to 6–8 km height, which indi-   tive measures to describe the WCB trajectory ascent speed in
cates the occurrence of locally faster WCB ascent associated      the entire cyclone, which allow for a more detailed distinc-
with embedded convective activity.                                tion of the intensity of convection and are particularly useful
   The comparison of the radar reflectivity cross sections        for comparison of ascent speed with other studies (e.g., Car-
from the first (Fig. 2b, c) and the second flight (Fig. 3b) il-   bone, 1982; Flaounas et al., 2016; Oertel et al., 2019; Oertel,
lustrates the large spatial and temporal heterogeneity of the     2019; Blanchard et al., 2020). These are the minimum times
WCB cloud band. On the one hand, the extended and dense           required for an ascent of 400 and 600 hPa (τ400 and τ600 ), re-
WCB cloud band has a stratiform character associated with         spectively, and ascent speed (ω, in Pa s−1 and w, in m s−1 )
primarily slantwise WCB ascent. On the other hand, it in-         averaged over these 400 and 600 hPa segments. τ400 and τ600
cludes embedded convection in the WCB ascent region very          values demonstrate the large variability of ascent rates for the

Weather Clim. Dynam., 2, 89–110, 2021                                                  https://doi.org/10.5194/wcd-2-89-2021
A. Oertel et al.: Observations and simulation of intense WCB-embedded convection                                                        97

Figure 2. (a) HALO flight track (grey) on 9 October 2016 including 2 h pressure changes (1p2 h , colored points) of COSMO WCB tra-
jectories centered at 13:30 UTC, SLP (grey contours, every 5 hPa) and 2 PVU at 320 K (red). COSMO WCB air parcels ascending more
than 600 hPa in 2 h are shown by magenta encircled dots. The grey asterisks indicate the position of the aircraft every 30 min. Violet and
yellow parts of the flight track denote the cross sections shown in (b, c) from 15:40 to 17:00 UTC and from 12:40 to 14:30 UTC, respec-
tively. (b, c) Radar reflectivity factor Z (in dBZ) along (b) the violet segment and (c) the yellow segment in (a) including WCB mask from
ECMWF WCB trajectories (dark blue contour and hatching), the 0◦ C isotherm (yellow) and the 2 PVU contour (red). The bottom panels
show ECMWF convective precipitation (CP, in mm h−1 ) along the flight track (blue bars) and range of 25 % fastest 2 h ascent phases of
COSMO WCB air parcels (i.e., 25 % smallest 1p2 h values) shown in (a) within a radius of 75 km around the aircraft position (in hPa, grey
shading). The green line in (c) at 13:40 UTC marks the aircraft turning point east of the cyclone center and is marked as green dot in (a).

https://doi.org/10.5194/wcd-2-89-2021                                                       Weather Clim. Dynam., 2, 89–110, 2021
98                                     A. Oertel et al.: Observations and simulation of intense WCB-embedded convection

Figure 3. (a) As Fig. 2a but on 10 October 2016 with COSMO online trajectories centered at 15:00 UTC. The cross section shown in (b) is
marked in yellow (14:10–15:40 UTC). (b) As Fig. 2b but on 10 October from 14:10–15:40 UTC. Also shown is the aircraft height (black).
The green line at 14:50 UTC marks the eastern aircraft turning point and is marked as green dot in (a).

WCB and its embedded convection ranging from below 1 h to             10 km) and also exceeds the previously reported ascent ve-
more than 24 h (Fig. 4). The frequency distributions for τ400         locities of WCB-embedded convection (ranging between 1–
(Fig. 4a) and τ600 (Fig. 4b) are bimodal with a first local max-      17 Pa s−1 , e.g., Flaounas et al., 2016; Rasp et al., 2016; Oertel
imum at short durations of about 30 min and 1 h, respectively,        et al., 2019, 2020; Blanchard et al., 2020). The ascent veloc-
and a second maximum at 2.5 and 6 h, respectively. Interest-          ities indicate that faster and even more intense convection –
ingly, the second maximum of τ400 of 2.5 h corresponds to             with ascent velocities that are similar to deep convective as-
a previously used threshold for embedded convection (Rasp             cent at squall lines (Rasp et al., 2016) – can also be embedded
et al., 2016; Oertel et al., 2019) separating the slantwise from      in WCBs.
the convective WCB ascent regime. The 10 % lowest τ400
and τ600 values for all WCB trajectories are below 20 min             5.1   Lagrangian composite analysis
and 1 h, respectively. This left tail of the distribution shows
that embedded convective WCB ascents with averaged ω of               In the following, we perform a 3D Lagrangian composite
approximately 17–33 Pa s−1 (corresponding to τ400 = 20 min            analysis following the method of Oertel et al. (2020) to com-
and τ600 = 1 h) occur quite often in this cyclone. In terms           pare the characteristics and signatures of relatively moder-
of w, the ascent velocity of embedded convection amounts              ate and intense convection embedded in the WCB of cyclone
to approximately 3–5 m s−1 . This is about 2 orders of mag-           Sanchez (Fig. 5). During the evolution of the surface cyclone,
nitude faster than a hypothetical purely slantwise ascending          both the upper-level flow structure changes and the strength
WCB trajectory with w = 0.06 m s−1 (ω = 0.3 Pa s−1 ; assum-           of convective WCB ascent differs (see Sect. 3.3). In par-
ing a continuous 48 h ascent of 600 hPa or approximately              ticular, embedded convection in the early phase (Fig. 1j) is

Weather Clim. Dynam., 2, 89–110, 2021                                                       https://doi.org/10.5194/wcd-2-89-2021
A. Oertel et al.: Observations and simulation of intense WCB-embedded convection 99
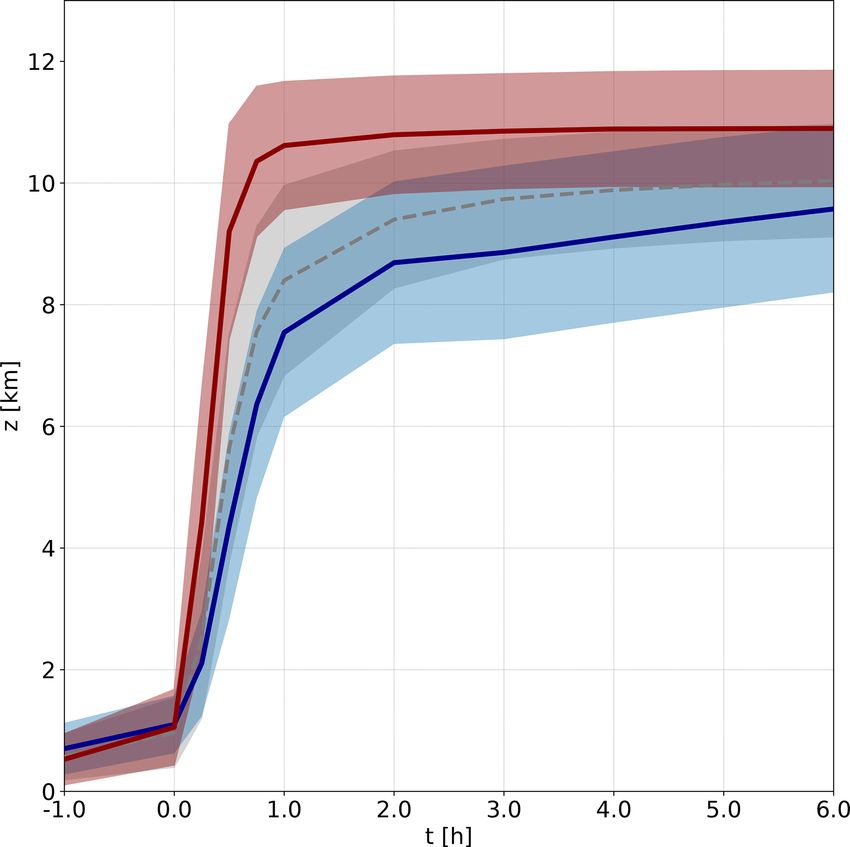
Figure 5. Mean ascent (solid lines; shading shows mean ± stan-
dard deviation) of selected moderate convective (blue) and intense
convective (red) WCB trajectories of cyclone Sanchez that are used
for the composite analysis. For comparison, the ascent of embed-
ded convective WCB trajectories of cyclone Vladiana investigated
by Oertel et al. (2020) is also shown (grey).
Figure 4. Histogram of the duration of the fastest (a) 400 hPa as-
5.2 Trajectory selection and ascent region
cent phases (τ400 ) and (b) 600 hPa ascent phases (τ600 ) embedded
in all WCB trajectories of cyclone Sanchez. The 10th, 25th, 75th Intense convective WCB trajectories. The selected intense
and 90th percentiles are colored in magenta, orange, light blue and convective WCB trajectories ascend through the entire tro-
blue, respectively. The dashed line at τ400 = 2.5 h in (a) indicates posphere in less than 1 h (Fig. 5). On average, these trajecto-
a previously used threshold for WCB-embedded convection (Rasp ries ascend from 1 to 9 km height in only 30 min and reach
et al., 2016; Oertel et al., 2019). Note the different axes’ dimensions their final outflow level at 11 km height within 1 h. Their τ400
in (a) and (b). and τ600 values amount to 20 min and 1 h, respectively (cor-
responding to the 10th percentile of all τ400 and τ600 val-
ues for cyclone Sanchez). This translates to averaged 400
much more intense than in the later phase (Fig. 1k,l). How-
and 600 hPa ascent velocities of 33 and 17 Pa s−1 , respec-
ever, the compositing technique requires a coherent trajec-
tively, i.e., this sub-category represents intense deep convec-
tory ascent from the lower to the upper troposphere and a
tion with clearly faster ascent velocities compared to WCB-
similar synoptic-scale flow situation to not smear out the sig-
embedded convection of cyclone Vladiana, which occurred
nals. Hence, we compare two sub-categories of convective
2 weeks earlier in September 2016 (Oertel et al., 2020). In
WCB trajectories that ascend coherently in two sub-regions
particular, the sub-category also includes convective WCB
of the WCB: (i) very rapidly ascending, intense convective
trajectories with the shortest τ600 of only 30 min, i.e., the
WCB trajectories, and (ii) moderately ascending (but still)
WCB trajectories traverse the entire 600 hPa layer from the
convective WCB trajectories (Fig. 5). In the following, the
boundary layer into the upper troposphere with an average
selection criteria for both convective WCB sub-categories are
ascent rate of 33 Pa s−1 (6 m s−1 ). Approximately 2000 tra-
described in more detail.
jectories fall in the category of intense convective WCB tra-
jectories. The intense convective WCB trajectories ascend
from 7–9 October predominantly between 35–40◦ N (on av-
erage at 38◦ ±2.0◦ ; Fig. 6a, black outlined circles) at a sub-
stantial distance from the upper-level jet, as during this early
stage of the cyclone, the WCB-embedded intense convection
https://doi.org/10.5194/wcd-2-89-2021 Weather Clim. Dynam., 2, 89–110, 2021100 A. Oertel et al.: Observations and simulation of intense WCB-embedded convection
occurs further south and also closer to the cyclone center cloud with enhanced rain and snow production along the as-
(Fig. 1j). cent (Fig. 7a, b), whereby the hydrometeor formation for the
Moderate convective WCB trajectories. The trajectories in intense convective WCB trajectories is substantially larger
the moderate convective WCB sub-category are spatially and than for the moderate convective WCB trajectories. In the
temporally separated from the intense convective WCB tra- mid-troposphere, between 4–7 km height, the convective as-
jectories (Fig. 6a). They ascend north of 40◦ N (on average at cent allows for the formation of large amounts of grau-
43◦ ±1.8◦ ) between 12:00 UTC on 9 October and 12:00 UTC pel. Due to the stronger updrafts of the intense convective
on 11 October during the PV cutoff phase (Fig. 6a, white out- WCB trajectories, the graupel production even extends to
lined triangles). During this time period convective WCB as- 11 km height (Fig. 7b). The maximum graupel water con-
cent is overall slower than in the early phase of the cyclone tent (GWC) in the mid-troposphere at approximately 320 K
(Fig. 1j–l). Hence, the moderate convective WCB trajectories exceeds 2.8 g kg−1 and is more than twice the maximum
are characterized by a slower ascent (Fig. 5), whereby the tra- GWC produced by the moderate convective WCB trajecto-
jectories perform an initial convective 400 hPa deep ascent ries with GWC of 1.0 g kg−1 . Both sub-categories of embed-
from 1 km to approximately 8 km height within less than 1 h ded convection form a localized vertically extended dense
(corresponding to the 25th percentile of all τ400 values for cy- cloud with elevated cloud top. Thereby, the ice water content
clone Sanchez) with an average ascent velocity of 11 Pa s−1 peaks directly above the mean trajectory position, forming a
(Fig. 5). In the next 2–3 h, their cross-isentropic ascent ve- dense cirrus shield, which is particularly dense for the intense
locity is reduced and they finish their full 600 hPa ascent at convective WCB sub-category with IWC>0.1 g kg−1 com-
10 km height in less than 9 h (corresponding to the median pared to IWC ' 0.05 g kg−1 for the moderate convective sub-
of all τ600 values for cyclone Sanchez), which amounts to category. Once the WCB trajectories are located in the up-
an averaged ascent velocity of 2 Pa s−1 . Compared to WCB- per troposphere they remain inside a cirrus cloud for at least
embedded convection of cyclone Vladiana (Oertel et al., the next 6 h. In agreement with the large hydrometeor pro-
2020), the ascent of the moderate convective WCB trajec- duction, the surface precipitation peaks during the strongest
tories is slightly slower (Fig. 5). In total, approximately 1000 WCB ascent phase. The moderate convective WCB trajec-
WCB trajectories are selected for this sub-category. tories reach a maximum of 3.9 mm of 15 min accumulated
For the composite analysis the selected WCB trajectories surface precipitation (Fig. 7c), while for the intense convec-
from both sub-categories are centered relative to the start of tive WCB trajectories, the maximum value exceeds 6 mm
their fastest embedded 400 hPa ascent phase in the lower tro- (Fig. 7d).
posphere. Subsequently, three types of composites are pro- The formation of a locally dense cloud with enhanced
duced for both convective WCB sub-categories: composites hydrometeor content, the presence of graupel in the mid-
of (i) horizontal and (ii) vertical cross sections centered at troposphere and locally increased surface precipitation un-
the trajectories’ geographical position, and (iii) composites derlines the convective character of the selected WCB tra-
of vertical profiles along the trajectories, i.e., time–height jectories for both sub-categories. These characteristics are
sections along the flow. comparable with the previous case study of WCB-embedded
A horizontal cross-section composite of low-level θe il- convection in cyclone Vladiana (Oertel et al., 2020), where
lustrates the ascent region of the moderate convective WCB the vertically extended dense cloud was accompanied by a
trajectories ahead of the cold front southeast of the cyclone local precipitation peak of 4.5 mm of 15 min accumulated
center (Fig. 6b). The edge of the upper-level trough (PV cut- surface precipitation and substantial graupel production in
off) and the associated weak upper-level jet are located at the embedded convective updraft. The differences between
approximately 200 km distance northwest of the initial tra- both WCB sub-categories emphasizes that – similarly to the
jectory ascent region (Fig. 6b). In contrast, the ascent of the observed differences between both convective radar reflec-
intense convective WCB trajectories is located closer to the tivity cross sections (see Figs. 2c and 3b) – the intensity
cyclone center compared to the moderate convective WCB of WCB-embedded convection can vary substantially within
trajectories (Fig. 6c). They ascend ahead of the cold front one WCB. This varying strength has a direct impact on the
only about 150 km south of the cyclone center. When these local cloud structure, the hydrometeor content, and the sur-
intense convective WCB trajectories start their ascent south face precipitation (Table 1).
of 40◦ N before 10 October, the upper-level trough and ac-
companying polar jet are located much further north at ap- 5.4 Thermodynamic properties
proximately 50◦ N (Fig. 1j).
Both sub-categories of convective WCB trajectories origi-
5.3 Cloud and precipitation structure nate from an almost saturated (Fig. 7e, f), warm and moist
region in the lower troposphere (Fig. 6b, c). The inflow re-
The cloud and precipitation structure associated with the se- gion is characterized by a deep layer of strong potential insta-
lected WCB trajectories corroborates their convective char- bility with vertical θe gradients between −2 and −4 K km−1
acter (Fig. 7a–d). The initial fast ascent forms a locally dense prior to the start of the convective ascent (Fig. 7e, f). The
Weather Clim. Dynam., 2, 89–110, 2021 https://doi.org/10.5194/wcd-2-89-2021A. Oertel et al.: Observations and simulation of intense WCB-embedded convection 101
Figure 6. (a) Location of moderate convective (white outlined triangles) and intense convective (black outlined circles) WCB trajectories
at the start of the fastest 400 hPa ascent phase. Colors indicate the time of the WCB air parcel position (from 7 to 10 October 2016). Also
shown is the evolution of SLP (lines are colored according to the selected times every 12 h from 00:00 UTC on 8 October to 12:00 UTC
on 10 October). (b, c) Horizontal cross-section composites of equivalent potential temperature (θe , colors, in K), specific humidity (blue
contours, every 1 g kg−1 ) and wind vectors at 900 hPa (arrows) for (b) moderate convective and (c) intense convective WCB trajectories at
the start of the fastest 400 hPa ascent. In (b) the upper-level jet (green colors, at 30 and 33 m s−1 ) and the 2 PVU contour at 320 K (white–red
line) are also shown. The axes’ dimensions denote the distance from the WCB air parcel locations marked as “×” (in km).
higher initial θe of 337 K and the presence of stronger po- erate convective WCB trajectories ascend in a region char-
tential instability for the intense convective WCB trajecto- acterized by very low values of CAPE (Fig. 7g). The ab-
ries enable their larger cross-isentropic ascent from 299 to sence of high CAPE values during convective WCB ascent
336 K (11 km) in only 1 h (in agreement with their initial agrees with the previous WCB case study in cyclone Vladi-
θe ) and their faster ascent velocity compared to the moder- ana, where the WCB inflow and ascent region were charac-
ate convective WCB trajectories with an initial θe of 332 K terized by comparatively low values of CAPE but substan-
and a corresponding reduced outflow level at on average tial large-scale forcing for ascent (Oertel et al., 2019; Oertel,
330 K (9 km) after 6 h. Thus, the intense convective WCB 2019, Fig. 4.3c).
trajectories do not only reach their final height substantially
faster, but their isentropic outflow level is also approximately 5.5 PV structure
6 K higher than the outflow level of the moderate convective
WCB trajectories. In contrast to the intense convective WCB
To find the characteristic upper-level PV dipole structure of
trajectories, which are associated with the presence of high
WCB-embedded convection (e.g., Oertel et al., 2020), hori-
convective available potential energy (CAPE) values of on
zontal composites centered around the convective ascent are
average 1000 J kg−1 prior to their ascent (Fig. 7h), the mod-
considered (Fig. 8a, b). These composites are evaluated at
https://doi.org/10.5194/wcd-2-89-2021 Weather Clim. Dynam., 2, 89–110, 2021You can also read