THE MAKING AND UNMAKING OF OPPORTUNITY: EDUCATIONAL MOBILITY IN 20TH CENTURY-DENMARK - KRISTIAN B. KARLSON RASMUS LANDERSØ
←
→
Page content transcription
If your browser does not render page correctly, please read the page content below
THE MAKING AND UNMAKING
OF OPPORTUNITY:
EDUCATIONAL MOBILITY IN
20TH CENTURY-DENMARK

KRISTIAN B. KARLSON   RASMUS LANDERSØ

STUDY PAPER 158                         FEBRUARY 2021
The Making and Unmaking of Opportunity:
Educational Mobility in 20th Century-Denmark
Study Paper No. 158

Published by:
© The ROCKWOOL Foundation Research Unit

Address:
The ROCKWOOL Foundation Research Unit
Ny Kongensgade 6
1472 Copenhagen, Denmark

Telephone +45 33 34 48 00
E-mail: kontakt@rff.dk
https://www.rockwoolfonden.dk/en

February 2021
The Making and Unmaking of Opportunity:
           Educational Mobility in 20th Century-Denmark

                        Kristian B. Karlson+                   Rasmus Landersø†
                                            February 17, 2021

                                                   Abstract

      We study intergenerational educational mobility in Denmark over the 20th century during
      which the comprehensive Danish welfare state was rolled out. While mobility initially was
      low, schooling reforms benefiting children from disadvantaged backgrounds led to dramatic
      increases in mobility for cohorts born between 1940 and 1960. However, the college expansion
      affecting cohorts born from 1970 onward has mainly benefited children from affluent back-
      grounds, resulting in rapidly declining mobility. Comparisons to educational mobility trends
      in the U.S. reveal that the two countries converge in mobility levels for the most recent cohorts
      despite the dramatically different welfare policies in place.

JEL: H0, I0, J0
Keywords: educational mobility, inequality, schooling reforms, skills

∗
   We are indebted to generous feedback from many, especially Jesper Birkelund, Richard Breen, Steven Durlauf,
Gøsta Esping-Andersen, James J. Heckman, Anders Hjorth-Trolle, Erik Lykke Mortensen, Helena Skyt Nielsen,
Hans Henrik Sievertsen, and seminar participants at the ASA conference 2020, the Copenhagen Education Network,
the Life-cycle working group at the University of Chicago, the University of Copenhagen, and the 5th IZA Workshop:
The Economics of Education. We thank educational historians Jakob Linnet Schmidt, Ning de Coninck-Smith, and
Signe Holm-Larsen for assistance with coding education degrees during the early 20th century. We also thank M.
Osler, K. Christensen, D. Molbo, E. L. Mortensen, and T. I. A. Sørensen who established the Danish Constriction
Database at the University of Copenhagen, Department of Public Health.
+
  : Department of Sociology, University of Copenhagen, kbk@soc.ku.dk
†
  : ROCKWOOL Foundation Research Unit, Ny Kongensgade 6, DK-1472, Copenhagen, +45 20704429, rl@rff.dk
1 Introduction
The causes and consequences of inequality in schooling constitute key concerns in current political
debates. In this context, Denmark is often highlighted as a model example, as it provides a wide
range of universal public programs with the purpose of promoting, among other things, equal access
to education and social mobility (e.g., Björklund and Salvanes, 2011; Black and Devereux, 2011;
Corak, 2013; Roemer and Tranmoy, 2015). But to which extent does a country’s level of inequality
in schooling depend on its welfare policies?
To address this question, this paper analyzes total population register data supplemented by
historical survey data to trace educational attainment and mobility for cohorts born over the course
of the 20th century in Denmark during which today’s comprehensive Danish welfare state materi-
alized with, for example, universal high-quality childcare, access to (free) colleges and universities,
and generous public education support. We contrast these changes in Denmark to the correspond-
ing ones in the U.S., which in terms of key welfare policies has taken a route very different from
Denmark.1
Fig. 1 summarizes the key finding of the paper by contrasting educational mobility estimates
and education levels for Denmark to those in the U.S. across the 20th century. Fig. 1a shows the
estimates from linear regressions of children’s years of schooling on parents’ years of schooling for
cohorts born in 1911 through 1985 in the two countries. Educational mobility changed dramatically
over the century in Denmark compared to the U.S. where overall mobility levels have been relatively
stable. Although Denmark was characterized by very low levels of educational mobility early in
1
For example, public expenses and income transfers relative to GDP were approximately 21% in Denmark and
15% in the U.S. in 1958. In 1990 the corresponding fractions were around 48% and 25%, respectively (Statistics
Denmark, 2001; White House Office of Management and Budget, 2020)
1the century (a coefficient of almost 0.6), in tandem with major schooling reforms, educational
mobility increased dramatically over a 25-year period (to a coefficient of roughly 0.3), substantially
surpassing mobility levels in the U.S. However, among Danes born in the 1970s and 1980s, mobility
has declined rapidly, and for the youngest cohorts born in the mid-1980s, the estimates are similar
to those reported for the U.S. at 0.45.2 As Fig. 1b shows, we see a very similar development when we
instead of regression coefficients consider absolute upward educational mobility (defined as children
having more years of schooling than their parents).
What explains this convergence between the two countries for the most recent cohorts? Den-
mark and the U.S. have not become more alike in terms of policies associated with equality of
opportunity—if anything the opposite is true. Nonetheless, despite these pronounced policy differ-
ences, educational mobility show very similar rates in the two countries today.
The only area in which the two countries have become more alike is education levels. Figs.
1c and 1d present for each country trends in average years of schooling among children and their
parents, for children born from 1955 onward. Fig. 1c shows that in Denmark, average years of
schooling increased from a level below 12 years for children and below 10 years for parents to
almost 14 years and 12 years, respectively. In contrast, in the U.S. the large educational expansion
took place earlier in the 20th century (Goldin, 1998; Goldin and Katz, 1999). As Fig. 1c shows,
average years of schooling in the U.S. changed much less and were far higher than in Denmark until
the most recent cohorts. Thus, mobility estimates for the two countries are by no means comparing
like with like until, possibly, for cohorts born during the 1980s.
Moreover, not only are the overall changes in education levels between generations central to
estimated educational mobility but so are the parts of the distributions that drive these changes. We
2
The results we report for the U.S. correspond to those reported by Cameron and Heckman (1998), Hilger (2017)
and Hout and Janus (2011).
2show that, on the one hand, the increase in educational mobility in Denmark among the cohorts born
in the 1940s, 1950s, and 1960s is rooted in a substantial expansion at the bottom of the schooling
distribution following major schooling reforms coupled with stagnating college completion rates.
On the other hand, the declining mobility experienced by the youngest cohorts born in the 1970s
and 1980s is associated with stagnating high school completion rates and increasing college and
university completion rates—increases that are mainly driven by children born to well-educated
parents.
Our study contributes to the literature studying differences in social mobility among countries,
regions within countries, or across birth cohorts (e.g., Breen and Jonsson, 2005; Chetty et al.,
2018, 2014; Corak, 2013; Erikson and Goldthorpe, 2002; Guell et al., 2018; Hertz et al., 2008).
Our key finding of recent convergence in educational mobility between Denmark and the U.S.
suggests that geographical or temporal differences in social mobility need not reflect fundamental
differences in welfare policies. Furthermore, using full population conscription records, we show that
the association between parental schooling and income, and children’s cognitive skills is virtually
constant from cohorts born in the 1950s through those born in the 1980s in Denmark, the latter
cohort being exposed to universal high-quality childcare, increased access to (free) colleges and
universities, and generous public education support.3 Our results instead point to that overall
changes in the distribution of schooling (as produced by educational expansion) may be a central
driver of changes in educational mobility. Thus our study also contributes to the literature focused
on education expansion (e.g., Goldin, 1998; Goldin and Katz, 1999) and to studies of schooling
reforms such as Black et al. (2005); Lundborg et al. (2014); Meghir and Palme (2005) by investigating
3
In contrast, parental background—via the influence on children’s education—has become increasingly important
for outcomes such as employment and income, family formation, and crime.
34
how schooling reforms and education expansion shape intergenerational mobility
The paper proceeds as follows: Section 2 describes the data, provides a brief institutional back-
ground, and reports key descriptive results on education levels across the 20th century. Section 3
examines the trends in educational mobility in two steps. In the first step, we study the marked
increases in educational mobility experienced by cohorts born from 1940–1960 with particular focus
on the impact of schooling reforms from the late 1950s to the early 1970s. In the second step, we
examine how and why educational mobility has decreased among cohorts born in the 1970s and
1980s. Section 4 exploits data on conscription records spanning more than 50 years to examine how
the associations between children’s cognitive skills, their education, and parental background have
changed over the second half of the 20th century. This section also provides additional analyses
pointing to a growing importance of noncognitive skills in education-based inequalities. In Section
5, we conclude the paper.
2 Background and data
2.1 Data
We base our analyses on two data sources. The first source is the total population register data for
cohorts born from 1921 through 1988 in Denmark.5 Our starting point is the demographic register
4
Contributions to the literature on education expansions also include Currie and Moretti (2003), Oreopoulos et al.
(2003), Chevalier (2004), and Piopiunik (2014) studying college openings, changes minimum school leaving ages /
compulsory schooling in the U.S., the U.K., and Germany on children’s outcomes. A separate line of research has
studied the impact of schooling reforms on outcomes such as earnings of the generation affected: Bhuller et al. (2017)
uses changes in compulsory schooling in Norway to estimate the effect of education on lifetime earnings. Oreopoulos
(2006) compares the effects of U.K. and U.S. reforms, and Pischke and von Wachter (2008) study German reforms.
5
We consequently omit immigrants from our analyses. Cohorts born 1957–1985 in Fig. 1a, and all of Figs. 1b,
3–13, and Panel B in Table 1 are based on register data. Cohorts born before 1957 in Fig. 1a, Panel A in Table 1,
and Table 2 are based on survey data.
4in which we obtain date and parish of birth, allowing us to analyze differences in education across
place of birth for the entire population born throughout most of the 20th century.6 For cohorts
born from 1956 onward, we use the link to their parents in the register data (information on parents
is not included in the register data for cohorts born before 1956). We subsequently link these data
to the education register, which is available from 1981 through 2017, providing us with information
on the final completed educational degree and years of completed schooling.
To study the earnings-schooling associations across time, we also include wage earnings from
the 1980–2018 income registers. We measure wage earnings as the average from ages 32–36. We use
this age range for income to proxy lifetime earnings (Nybom and Stuhler, 2016). Expanding the
age range in either direction would reduce the number of cohorts for which we are able to measure
wage earnings, thereby eroding the purpose of using earnings data. We also link the data to the
demographic registers, which contain information on marital status, and to the crime registers to
measure youth crime (defined as a criminal charge from age 15 to 17).
We merge the register data with conscription records that include cognitive test scores for all men
born in 1940–1988, excepting the 1959–1969 period for whom records are unavailable.7 A unique
feature of the conscription test is that all cohorts were administered the exact same test. However,
as a result of administrative processing errors in the past, the full-range test scores have been lost
for cohorts born in 1970–1986. Thus, for these cohorts, we have available only a dichotomized
6
As the register data are first available in 1980, our data is based on persons surviving to 1980. We do not explore
variation in education for cohorts born earlier than 1921, as mortality rates increase rapidly after age 60.
7
The conscription records come from three different sources: the historical conscription register for cohorts born
in 1940–1958 (The Danish Conscription Database at the Department of Public Health, University of Copenhagen)
(Christensen et al., 2015), the register for cohorts born 1970–1986, and the register for cohorts born after 1987.
The test is composed of four types of tasks related to logical reasoning: a matrix test (based on letters), number
sequences, spatial relations (based on figures), and word relations (Kousgaard, 2015). The conscription test score is
highly correlated with the The Wechsler Adult Intelligence Scale (with a correlation of 0.82 Mortensen et al., 1989).
5version of the original test that sorts individuals into normal- and low-intelligence groups.8
The conscription data from cohorts born 1970 onward also contain information from the health
assessment across four domains (physical performance, upper extremities, lower extremities, and
mental health), which we (1) define as 0 to 4 counting the number of domains in which health is
assessed as normal and (2) use for assessing whether health in each of the four domains is assessed
as very problematic (coded 1 for very problematic and 0 for otherwise). Appendix B describes the
coding and data sources of the Danish data in detail. Appendix C describes the U.S. data.
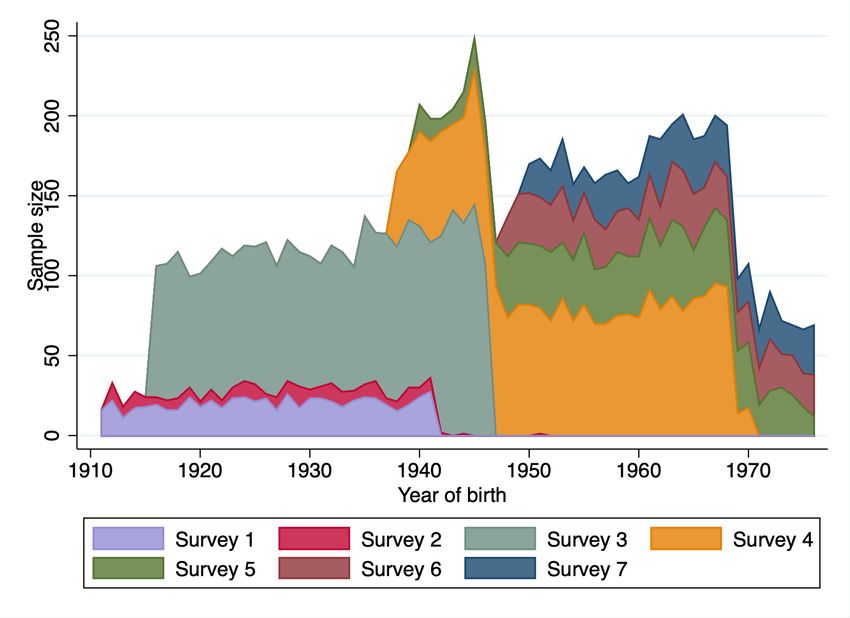
Fig. A.1 presents data coverage by year of birth, and Table A.1 presents summary statistics for
outcomes considered in the paper other than education. Fig. A.2a presents the register data sample
size by birth cohort. The solid line presents the total sample size and the dashed line presents the
sample size for the conscription data. Cohort sizes vary from 42,000 to 82,000. For selected cohorts,
Fig. A.2b shows the sample size by birth cohort and whether birth was registered in an urban or
rural area. All sample sizes in the analyses based on register data exceed 10,000 individuals.
The second data source is based on nationally representative surveys. The primary set of surveys
were conducted between 1970 and 2010. They allow us to trace educational mobility further back
than possible with the register data. In all of these (seven) surveys, respondents provide information
about their own and their father’s schooling, and their region of birth. The pooled data comprise
8,650 respondents born in 1911 through 1976. In addition, we use information from two longitudinal
surveys of cohorts born in 1954 and 1995, respectively (the Danish Longitudinal Study of Youth
born in 1954 and the Danish Longitudinal Study of Children born in 1995). We use these surveys
8
Table B.3 maps the cognitive test scores to the IQ scale. A test score below 36 corresponds to an IQ below 90.
As the 1988-cohort is the first cohort after the 1958-cohort for which the data include the full-range test scores, we
use this cohort to test the robustness of the trends identified using the dummy category from 1970 to 1986, even
though we have to measure education for the 1988-cohort at age 29, as the most recent year of education information
is 2017.
6because they include identical measures of children’s cognitive and noncognitive skills in adolescence.
Measuring education Most of our analyses are based on years of schooling. This measure
facilitates a comparison of educational levels and mobility throughout a century during which the
educational system was reformed, degrees disappeared, and new ones emerged. As the increase
in educational attainment for cohorts born from the mid-1960s onward relates to transitions into
academic high school, college, and university, we additionally examine how the transitions and
sorting between those levels change over time. We also present results using categorical schooling
measures and alternative estimation strategies (e.g., polychoric correlations, proportional reductions
in entropies, log-multiplicative layer effect models). The results are very similar to those based on
years of schooling and highlight the robustness of our conclusions. We measure years of schooling
in terms of the highest degree completed at age 30. We convert this highest degree into years of
completed schooling using the minimum number of years it takes to complete the degree (e.g., today
a 3-year college degree takes 9 + 3 + 3 = 15 years to complete as compulsory schooling lasts 9
years, academic high school 3 years, and college 3 years).9 Parents’ years of schooling are defined in
the same way.10 In some of the surveys, schooling is reported in levels and degrees, not in years of
schooling. For these reports, we assign each educational category the associated years of schooling
when the respondents (and their parents) completed their education.
9
Fig. B.3 compares the main results using education measured at age 30 and 32 and shows no substantial dif-
ferences. Estimates increase slightly (i.e. estimated mobility decreases) when education is measured at age 32, as a
small additional fraction completes tertiary educations during the two extra years from age 30 to 32.
10
We measure parents’ education in 1981, which is the first available year, until the cohort born in 1977 for whom
we measure parents’ education the year the child turns five. We define parents’ years of schooling as the average
between the two, except in Fig. 1b (to align the Danish data with the U.S.) and when we use estimation strategies
based on education degrees for which we define it as the parent with the highest completed education.
72.2 The Danish education system at a glance
Fig. 2 provides a stylized illustration of the Danish education system. Before a schooling reform in
1972 increased the years of compulsory schooling from 7 to 9, students had to decide whether to leave
school after 7 years (primary schooling), complete 9 years of schooling (lower secondary schooling),
or complete a vocational apprenticeship-based degree. After the 1972 reform, the dashed lines in the
figure disappear from the opportunity set, and students had to decide whether to leave school after
9 years of schooling (lower secondary schooling) or continue to upper secondary education, which
consists of either an academic high-school track (the Gymnasium) or a vocational apprenticeship-
based track.11 Completing the academic high-school track makes students eligible for enrolling in
tertiary education (college or university).12 As we later report, changes in educational mobility
during the 20th century are driven by the horizontal path in Fig. 2 with the expansion from 7 to
9 years of schooling, and the further expansion of academic high school, college, and university
education in more recent times.13
While the 1972 schooling reform formally increased the years of compulsory schooling, it merely
followed a more fundamental and consequential schooling reform from 1958. Before the 1958 reform,
the Danish educational system was divided into a rural and urban school system.14 . In the rural
11
This 1972 reform corresponds to the Norwegian and Swedish schooling reforms studied in, for example, Black
et al. (2005); Meghir and Palme (2005). However, the Norwegian and Swedish counterparts were introduced in the
1960s and gradually rolled out across regions, whereas the Danish reform was introduced later and implemented
nationally at a single point in time.
12
College-level education in Denmark consists of two branches: semi-professional degrees such as teaching or
nursing of 3–4 years duration, and bachelor degrees that feed directly into master’s programs of 5–6 years duration.
13
One of the most striking features of the Danish education system is the absence of direct financial costs for
parents. While education has been “free” throughout the period studied, strong selectivity bias into who had the
opportunity to go beyond 7 or 9 years of schooling was a barrier until cohorts born during the mid-1960s. As we show
below, it is only for later cohorts that tertiary education becomes prevalent. Moreover, public education support was
introduced in 1970 but was substantially expanded only later, in particular in 1988 (studied in Nielsen et al., 2010).
14
During the 20th century, six reforms of primary and lower secondary schooling were implemented. Appendix
B.1 provides details of all six reforms.
8school system, children had very few opportunities for continuing into lower and upper secondary
education after completing primary school. Schools in rural areas only provided primary schooling
from grades 1 through 7, with substantially fewer school days per year, and fewer grade levels
(e.g., a grade for “young children” and another for “old children”).15 The 1958 reform abolished
the rural school system, and rural municipalities (the local administrative units in Denmark) were
now required to offer schooling at least through grade 9. Thus, all children in rural Denmark now
had—for the first time—the opportunity to attend schooling beyond the minimum required 7 years.
All schools also became obligated to supply all relevant grade-levels, and all children should attend
school for the same number of days. The reform was also supplemented by a large increase in public
school funding, particularly in rural areas.16 As we report below, the 1958 report had major impacts
on both average educational attainment and educational mobility.
2.3 Trends in schooling levels
Fig. 3 shows average years of completed schooling by birth year for persons born in 1921–1987, based
on the administrative registers. Fig. 3a shows highest completed levels of education and average
years of schooling, Fig. 3b shows the proportion who completed a specific degree or higher, and
Fig. 3c shows the year-by-year change in the various educational levels (i.e., the slope in Fig. 3b)
As Fig. 3 illustrates, although average years of schooling increases almost linearly during this
period, the trend is driven by educational expansions at different discrete schooling levels. For
those born in the 1921–1957 period, the downward trend in the share with no more than 7 years
15
The institutional setup of the schooling system before 1958 reflects the the country’s strong dependence on the
agricultural sector—a dependence that continued well into the 20th century. For example, 50% of adult men worked
in farming in 1911, and in 1948 more than 25% of the workforce were employed in the agricultural sector. Children
also contributed to the agricultural workforce; 20% of family breadwinners in farm households in 1911 were children
aged 10-15 (Statistics Denmark, 2001, 2015).
16
See Appendix B.1 and Bingley and Martinello (2017).
9of schooling dominates. While 60% of the 1921 birth cohort completed no more than 7 years of
schooling, 40% of the 1941 cohort and only 4%-5% of the 1956 cohort did so (the 1956 cohort is the
last cohort not affected by the 1972 reform that increased the minimum required years of schooling
from 7 to 9). The share completing high school increased modestly for those born during the first
half of the 20th century (10 percentage points for the 1921–1940 cohorts), and more rapidly for
those born in 1950–1965 (30 percentage points). Cohorts born in 1965–1987 experienced significant
expansion at the college and university levels. While roughly 10% of the 1965 cohort obtained a
college degree as their highest completed education, slightly more than 20% of the 1987 cohort
obtained such degree. Similarly, whereas only 5% of the 1965 cohort completed a university degree,
this fraction increased to almost 20% in the 1987 cohort.
In other words, the education expansion has occurred in different parts of the distribution over
the century. Figs. 3b and 3c show that the lower tail—completing at least 9 years of schooling—
changed drastically until cohorts born in the mid-1950s. The figure further shows that the fraction
completing high school increased throughout the century, but the increase became more rapid
among those born after WWII, only to slow down in the two most recent decades of cohorts. The
proportion with a college or university degree is almost constant throughout the first two-thirds of
the century, and only increases for cohorts born from 1965 onward.17 While the uptake in all major
fields at the university level has increased, the expansion has been most pronounced for degrees
within the humanities (which increased from 7% of university degrees in the 1965 cohort to around
25% two decades later).
17
As a comparison, we plot the corresponding marginal schooling distribution for the U.S. in Fig. A.3. The figure
shows that average years of schooling increased rapidly and linearly from 1913 through 1950. From 1950 through
1984, however, the annual growth rate in years of schooling declined significantly. Rapid growth from 1913 through
1950 was driven by, on the one hand, a decline among those with less than a high school degree (i.e., less than
12 years of schooling) and, on the other hand, an increase among those with at least some college. This evolution
corresponds to education trends presented in, for example, Goldin and Katz (2007).
10To supplement the reported trends in schooling, Fig. A.4 illustrates the development in mean
cognitive test scores in cohorts born 1940–1988 using the conscription records. It shows that, while
mean cognitive test scores (among men) increased until those born in the late 1960s when progress
gradually halted, they have remained stable from the 1975 cohort onward.
3 Educational mobility
We divide the analysis of trends in educational mobility into two subsections. In the first, we
analyze the dramatic increase in educational mobility among those born in the late 1940s through
the mid-1960s. The second subsection analyzes the declines in educational mobility for those born
during the 1970s and 1980s.18
3.1 Toward higher educational mobility
At the turn of the 20th century, Denmark had two separate school systems: the rural and the
urban system. As described in Section 2, children living in rural areas had much poorer access to
education than those living in urban areas. Fig. 4 illustrates how dramatically the 1958 reform
impacted schooling levels in Denmark. Fig. 4a shows the proportion with no more than 7 years of
schooling by rural–urban origin for cohorts born in 1921–1965. Among cohorts born in 1921–1941,
children from both urban and rural areas gradually became less likely to obtain only 7 years of
schooling. However, starting from the birth cohort of 1942—the first cohort affected by the 1958
18
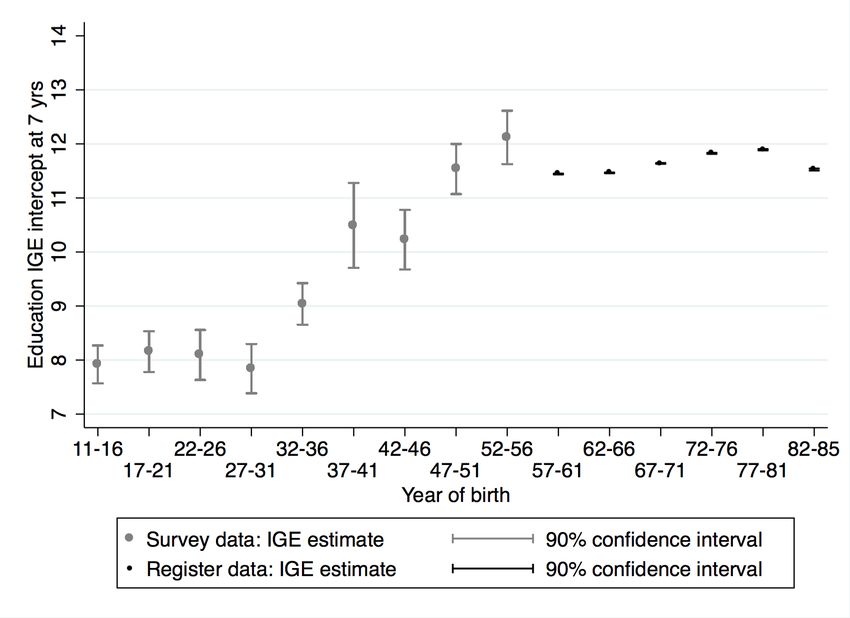
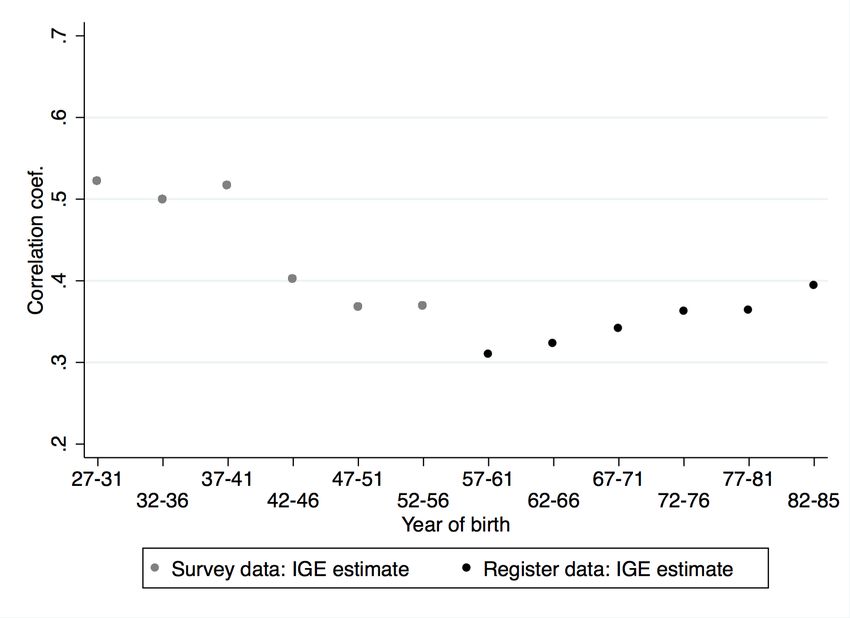
Fig. A.5 shows the regression intercepts and correlation coefficients corresponding to the estimates reported in
Fig. 1. To show that the different trends in estimated educational mobility is not an artifact of changing data source
for cohorts born before and after 1956, in Fig. A.6 we present estimates for Denmark based on survey data only
extending the cohorts to all available cohorts born in 1911–1976. The trend for those born in 1956–1976 is virtually
identical, suggesting that differences in underlying data sources do not drive our results. In addition, Fig. A.7 shows
that the trends do not arise from changing nonlinearities across parents’ years of schooling.
11reform—the rural–urban gap at this schooling margin was virtually closed in approximately 15
years. Figs. 4c and 4d show similar trends in average years of schooling. For those born before
1942, the gap was stable at around 1 year of schooling, but 15 years later the gap was less than
one-fifth of a year (which was due to differences in the prevalence of college and university degrees,
not shown here).
We next illustrate the 1958 reform’s impact on the rural–urban gap in cognitive skills using the
conscription records. Figs. 4e and 4f show average cognitive test scores by rural–urban origin and
birth year. For the 1940 cohort, we find a substantial rural–urban gap in the skill distribution.
However, for the 1958 cohort, the rural–urban gap has been reduced by around 75%, suggesting
that the impact of the 1958 reform not only equalized formal schooling but also cognitive skill levels
among regions in Denmark.19
The 1972 reform formally changed the years of compulsory schooling from 7 to 9. While this
reform corresponds to the reforms in Norway and Sweden studied in Black et al. (2005); Lundborg
et al. (2014); Meghir and Palme (2005) among others, the Swedish and Norwegian reforms were
rolled out somewhat earlier during the late 1950s and 1960s. As a result of the strong downward
trend in the proportion completing only 7 years of schooling in Denmark, around 95% of a cohort
already completed more than 7 years of schooling on the eve of the 1972 reform (which affected the
19
This result follows e.g., Brinch and Galloway (2012) and Banks and Mazzonna (2012) who find that compulsory
schooling reforms increase cognitive test scores in Norway and England, respectively. Furthermore, Fig. A.8 shows
cognitive test score distributions by rural–urban origin for birth cohorts 1940 and 1958. The distribution in 1940 for
children from rural areas is right-skewed and significantly shifted to the left compared to the distribution for children
from urban areas, whereas the 1958 distributions only show a smaller rural–urban gap.
12second half of the 1957 cohort onward).20, 21
Fig. 5 illustrates how the 1972 reform affected education outcomes. As previously described,
the 1972 reform followed a long upward trend in completed education driven by rising completion
of lower secondary schooling. As the figure shows, before enactment of the reform around 95%
completed at least 8 years of schooling and almost 90% completed 9 years of schooling. The reform
led to a discrete jump in education levels with the result that virtually all completed more than 7
years of schooling and around 95% completed at least 9 years. Moreover, the reform also led to a
22
discrete reduction in the standard deviation of years of schooling (cf. Fig. 5d).
To formally test how educational expansion at the bottom of the schooling distribution affected
overall mobility levels, we report by year of birth estimates from linear regressions of children’s
years of schooling on parents’ years of schooling (henceforth labeled the education IGE) and the
corresponding correlations (labeled education correlation):
C P C P
Ei,t =αt + βt Ei,t + ui,t and corr(Ei,t , Ei,t ) (1)
20
Similarly, Oreopoulos (2006) shows that two consecutive compulsory schooling laws in the U.K. had a different
impact; the first resulted in a strong increase in schooling enrollment while the second only had minor impact as it
coincided with an existing trend.
21
While the reform’s main impact affected the 1957 cohort, the reform was not completely binding until the 1959
cohort as some had dropped out at the time of its enactment—these children were not forced to go back to school.
Appendix B.1 describes the reform in detail.
22
To further examine the differential impact of the two reforms (in 1958 and 1972), Fig. A.9 presents the cumulative
distributions of cognitive test scores for birth cohorts 1940, 1941 (the two last cohorts not affected by the 1958 reform),
1942 (the first cohort affected by the 1958 reform), 1956 (the last cohort not affected by the 1972 reform), and 1957
and 1958 (the first two cohorts affected by the 1972 reform). While we see no differences between the distributions
of the 1940 and 1941 cohorts, the 1942 cohort’s distribution is clearly shifted upward. As the difference between
the 1942 and 1956 cohorts shows, the following decade saw a further increase in cognitive skills. However, as the
pronounced overlap in test score distributions of the 1956, 1957, and 1958 cohorts indicate, the compulsory schooling
reform of 1972 did not appear to increase cognitive skills.
13C P
where Ei,t are children’s years of schooling and Ei,t are parents’ years of schooling. Panel A of
Table 1 shows educational mobility estimates for the cohorts not affected by the 1958 reform (those
born in 1932–1941) and the first 10 cohorts after the reform (cohorts born in 1942–1951). Panel
B of Table 1 similarly shows estimates for the last cohort not affected by the 1972 reform (1956
cohort) and the first cohort affected by the reform (1958 cohort). The table presents estimates for
the entire country and by rural–urban origin. Panel A shows that mobility increased significantly
around the 1958 reform. This result holds irrespective of whether we examine the education IGE or
education correlation. Panel A also shows that cohorts born before 1942 in rural areas experienced
less mobility with an education IGE estimate of 0.58 compared to those born in urban areas with an
estimate of 0.48. However, among those born after 1942, the rural–urban gap completely disappears.
Thus, while educational mobility for those who grew up in urban areas remains roughly constant
over the entire period, mobility increases significantly for those born in rural areas. Panel B shows
equivalent estimates for the 1972 reform. However, the compulsory schooling reform of 1972 affected
only a small fraction of children, with its largest impact affecting the variance in years of schooling
(cf. Fig. 5d). As a consequence, Panel B shows that the 1972 reform is associated with only a minor
decline in the education IGE and no changes to the education correlation.
3.2 Toward lower educational mobility
To visualize the extent of the reversal from high levels of mobility toward lower levels seen in Fig. 1a,
Fig. 6 plots by year the education IGE and education correlation for those born in 1956–1987. The
figure shows that the 1956–1958 cohorts experienced the lowest education correlation in our entire
data set of cohorts born throughout the 20th century. Beginning with the 1958 cohort, the education
correlation increases gradually. The figure also shows that the education IGEs continue to decline
14beyond the correlation low-point into the mid-1960s (the discrepancy in trends in the 1960s is driven
by declining variance in years of schooling; see Fig. 5d). The result was unprecedented levels of
educational mobility.
Yet, Fig. 6 also documents stark increases in the education IGE and education correlation for
cohorts born in the mid-1960s through the mid-1980s. This trend is remarkable in light of the
welfare policies that were rolled out during this period. These are the cohorts who were the first to
have access to state-provided childcare early in life (introduced during the late 1960s through the
early 1970s), who benefited from generous income redistribution via progressive taxation and social
transfers, and who faced no direct financial costs for education at all levels. All of these factors are
often emphasized as being central parts of the Scandinavian welfare regime, and have been shown
to increase educational attainment (e.g., Havnes and Mogstad, 2011; Nielsen et al., 2010).23 Our
findings do not imply that policies such as universal childcare did not have positive effects for those
from the lowest socioeconomic backgrounds as found in earlier studies. By way of contrast, it shows
the potent impact of the overall changes to the educational distribution at this point in time.
To test the robustness of the declining educational mobility finding, we conduct a range of sup-
plementary analyses based on categorical measures of education and different ways of summarizing
23
The decreasing mobility trend is perfectly mirrored in changing schooling dispersion. Fig. A.10a shows the
standard deviation in years of schooling for cohorts born in 1921–1985. Danes born in 1942 (i.e., those affected by
the 1958-reform) through 1957 (i.e., those affected by the 1972 compulsory schooling reform) experienced a very
large decline in educational inequality, and this decline continued at a lower rate for those born in the mid 1960s.
However, for cohorts born in 1965–1984, inequality began increasing. Fig. A.10b provides another way of illustrating
this finding by plotting the average years of schooling for the bottom and top 30% of the schooling distribution by
birth year. The figure shows a similar rapid decline in inequality caused by the 1958 reform, reaching an all-time
low in the mid-1960s, from where it begins increasing again through the mid-1980s.
1524
the overall parent-child schooling association using the categorical data. These analyses all show
that our finding in Fig. 6 is highly robust to alternative ways of measuring both education and
educational mobility, suggesting that all evidence points to that mobility decreased substantially
for Danes born after the mid-1960s. To further examine this decline, we first show how transitions
from high school into higher education change drastically for cohorts born in the mid-1960s when
the upper-tail expansion of the education distribution begins. We then turn to the long-run growth
of college and university degrees and how these changes are related to parental schooling.
Changing transitions into higher education
As a first step in further analyzing the reversal in the mobility trend for cohorts born after the mid-
1960s, Fig. 7 plots by birth year the percentages transitioning to academic high school, to college
after academic high-school completion, and to university after college completion, for cohorts born in
1921–1987.25 The transition probabilities are calculated conditional on being eligible for enrollment
24
In Fig. A.11a, we show trends over the century using Kruskal-Goodman’s gamma coefficient, a nonparametric
correlation coefficient for ordinal variables, the polychoric correlation coefficient (which takes schooling as an ordinal
measure of an underlying normally distributed latent variable), and taking education distributions as an ordinal
measure of underlying skills (as in Fletcher and Han, 2019). In Fig. A.11b, we report Theil’s J (information theory
multigroup index) estimates by birth year for cohorts born in 1957–1988 estimates (Reardon and Firebaugh, 2002).
The index compares the average conditional entropy of children’s schooling given parents’ schooling to the uncon-
ditional entropy of children’s schooling, and can thus be considered a measure similar to the R-squared in linear
regression (Theil, 1973, p. 173). We estimate this index using a highly granular measure of education for both
parents and children. Fig. A.11b shows the estimated index both for dissaggregate education degrees (around 1,000
categories in total) and for the aggregate degrees (20 categories in total). We find a clear upward trend in coeffi-
cients over time. Fig. A.11c also replicates the overall finding using the log-multiplicative layer-effect (unidiff) model
(Erikson and Goldthorpe, 2002), which summarizes how the overall origin–destination (parent–child) association in
a cross-tabulation of education levels changes over time relative to an index period.
25
As completing academic high school is a prerequisite for college enrollment, this next section specifically examines
the completion of this academic track and not the completion of all types of high school (which would include also
analyzing the vocational track). Several studies have examined the importance of transition probabilities in shaping
overall education trends in the U.S., such as documenting an increasing share (of males) graduate with a GED instead
of a formal high school degree (Heckman and LaFontaine, 2010), a substantial drop in college graduation rates for
men, which is matched by an increase for women (Card and Lemieux, 2001) and decreasing college graduation rates
conditional on college enrollment (Bound et al., 2010)
16as illustrated in the stylized model of the Danish educational system in Fig. 2: completion of 9th
grade is required for enrolling in academic high school, completion of academic high school is required
for enrolling in college, and college completion is required for university enrollment. The figure
shows that only around 20% of those completing the 9th grade went on to complete academic high
school until the 1940 cohort. For those born in 1940–1965, the conditional probability of completing
academic high school doubled. As the proportion of eligible persons in the cohort completing at least
9 years of schooling increased from around 60% to 100%, this implied that overall (unconditional)
academic high-school completion increased from approximately 15% to 40%. Yet, as the figure
also shows, completing a college degree conditional on completing an academic high-school degree
dropped dramatically, as only around 15% of the additional high school graduates went on to higher
education. For the 1950 cohort, 80% of those completing academic high school completed college
afterward—for cohorts born in the early 1960s, this fraction had dropped to around 40%.
Nevertheless, similar to the trend in overall mobility estimates, the cohorts born during the
mid-1960s mark a turning point. Academic high-school completion increases from less than 40%
for cohorts born in the mid-1960s to almost 60% for cohorts born in the mid-1980s. Furthermore,
the probability of completing college conditional on graduating from the academic high-school track
increases from around 40% to 70% over just 20–25 years. And while the probability of completing
university conditional on college completion stagnates until the cohorts born in the mid-1970s, the
transition probability increases from around 33% to almost 50% for the 10 youngest cohorts. Thus,
within a relatively short period, transitions into higher education increase dramatically. Fig. A.12
contrasts the transition probability from high school to college for Denmark with that in the U.S.
across the 20th century. In line with the evidence presented earlier the paper, the differences
between the two countries for cohorts born early in the 20th century reverse for cohorts born in the
17middle of the 20th century followed by a convergence for the most recent cohorts.
College and university completion by family background
As a second step in analyzing the reversing mobility trend—which began among those born in
the mid-1960s—we link the changes to higher education completion rates in Fig. 7 to parents’
education. Fig. 8a shows the correlation between educational transitions (to high school overall,
to the academic high-school track, to college, and to university) and parents’ years of schooling
among those born in 1956–1987. Fig. 8b shows the same trends in the correlation coefficients as
in Fig. 8a with the coefficients being indexed relative to those reported for the 1960 cohort. The
figures show pronounced differences in the correlations between children’s education and parents’
years of schooling during the period in question. Although the correlation between high school
completion and parental schooling is roughly constant throughout the cohort window, parents’
education correlates increasingly with children’s higher education attainment. Parents’ education
becomes increasingly predictive of children completing college and university degrees for cohorts
born after the 1960s. Indeed, over the course of 30 years, the correlation between completing a
university degree and parents’ years of schooling increases by around 50%. This pattern suggests
that children of highly educated parents have benefited more than children of low-educated parents
from the college and university expansion.
Fig. 8c focuses on the transitions from high school to college and university. The figure presents
the correlation between parents’ years of schooling and the conditional probabilities of college com-
pletion and university completion. Fig. 8d shows the same figures with the correlations indexed
relative to the 1965 cohort. The figures show that the transition probabilities increase by 30–40%
over the roughly 20 cohorts in question. Thus, a substantial part of the education expansion appears
18to be driven by an increased propensity to transition from lower to higher levels of education, a
change that has been most pronounced for children born to highly educated parents.26
Fig. A.13 graphs college and university completion rates across parents’ education by birth year
and field of study. The figure shows that increasing college completion rates for cohorts born in the
mid-1960s onward are driven by increases in teacher and pedagogical degrees, and college degrees
within the humanities and social sciences. However, increasing gaps across parental education are
seen only for the latter type of education. For university completion, degrees in humanities and
social sciences increased by around 400% from the cohorts born in the mid-1960s to those born in
the mid-1980s—an increase almost exclusively driven by children born to well-educated parents.27
We next examine how much of the decrease in educational mobility for cohorts born between
the mid-1960s and the mid-1980s that can be attributed to the differential changes to transition
probabilities between education levels. Educational attainment can be expressed as a series of
sequential decisions (as shown in Boudon, 1974; Cameron and Heckman, 1998; Mare, 1980, 1981),
which, by the Law of Iterated Expectations, makes the probability of completing education level
Qj
j equal to p(Ej = 1) = k=1 p(Ek = 1|Ek−1 = 1). Children’s average years of schooling E(Y ) is
then a product of (conditional) education transition probabilities multiplied by the average years
26
As shown in Cameron and Heckman (1998), an unadjusted analysis of transition probabilities is subject to sample
selection bias among different schooling levels. However, 8a shows that the correlation between academic high-school
completion and parents’ education is almost constant across the period in question. Therefore, sample selection bias
in this dimension is not likely to affect our results. In Section 4, we analyze changes to skill-based selection across
the educational transition points.
27
For cohorts born in the mid-1980s, children whose parents are in the lowest tertile of years of schooling make
up 8%, 13%, and 13% of degrees within the medical sciences, technical degrees and natural sciences, and humanities
and social sciences, respectively. In comparison, children whose parents belong in the top tertile of years of schooling
comprise 75%, 62%, and 63% of the three categories.
19of schooling associated with each education level from the lowest j = 0 to the highest j = J:
E(Y ) =
E(Y |E0 = 1) + p(E1 = 1|E0 = 1)[E(Y |E1 = 1) − E(Y |E0 = 1)] + ...+ (2)
J
Y
p(Ek = 1|Ek−1 = 1) [E(Y |EJ = 1) − E(Y |EJ−1 = 1)]
k=1
Fig. 9 presents the results of four simulations using the decomposition of years of schooling by dif-
ferent transition probabilities across parental education levels. The solid line presents the observed
education IGE as a benchmark. The four other lines present the education IGEs (1) if the transition
into academic high school had been fixed to the pattern in the 1969 cohort, (2) if the transition from
academic high school to college had been fixed to that in the 1969 cohort, (3) if the transition from
college to university had been fixed to that in the 1969 cohort, and (4) if all the aforementioned
transition probabilities were fixed to the pattern in the 1969 cohort.
As depicted in Fig. 9, the transition into academic high school and the transition from college to
university account for only a small portion of the increased education IGE. Results for the former are
a consequence of the correlation between academic high-school completion and parents’ education
being almost unchanged across the period in question (see Fig. 8), whereas results for the latter
are a consequence of the relative small proportion of a cohort completing a university degree (i.e.,
the transition into university has become more selective but it affects only a small percentage of
a cohort). The figure shows that the lion’s share of the decline in educational mobility is caused
by college becoming more selective based on family background over time. Had the selection into
college by parental background remained as observed for the 1969 cohort, the education IGE for
the 1987 cohort would be 0.41 instead of 0.48. If all transition probabilities collectively had not
20changed since 1969 cohort, then the education IGE would have reached a level just above 0.35.
4 Education, skills, and life-course inequalities
Our analyses show that changes to educational mobility levels in Denmark are strongly related to
educational expansion. However, given the dramatic changes to the distribution of schooling, we
turn to examining changes in the underlying components of education over time.
During the period in question, Denmark has not only seen dramatic changes in schooling levels
but also dramatic expansions of welfare policies relating to transfers, health care, day care, and
education support among others. As a first step, we therefore ask to which extent the association
between family background and cognitive skills has changed. Fig. 10 shows cognitive test score
ranks by parental income ranks for the 1958 and 1988 cohorts, respectively. The associations for
the two cohorts born 30 years apart (and on different sides of a massive welfare expansion) are
strikingly similar. The figure also shows the association between child cognitive test scores and
parents’ income for the U.S. using the child supplement of the NLSY79, which comprises children
born from the late 1970s to the 1990s. We do not find any striking differences between the two
countries. Thus, Fig. 10 suggests that the association between family background cognitive skills,
a core aspect of human capital formation, is unchanged across the massive welfare expansion in
Denmark, and is even similar to the corresponding association in the U.S.28
However, the constancy in skill inequalities coupled with the increasing association between
parents’ and children’s schooling among the youngest cohorts in Denmark begs the question of how
the association between skills and schooling have changed over time. We address this question in
28
In addition, as shown in Table A.3, the association between parents’ schooling and children’s language test scores
in grades 2 and 8 for cohorts born around 2000 is similar in Denmark and the U.S. (Hjorth-Trolle and Holm, 2021).
21two steps. First, in Section 4.1 we examine whether selection into different education levels proxies
the same type of skills today as it did half a century ago in Denmark. Second, in Section 4.2 we
describe the changes in how predictive education is of a broader set of life-course outcomes such as
earnings, employment, marriage, health, and crime.
4.1 The relationship between education and skills
Fig. 11 plots by birth year the correlation between children’s cognitive test scores and years of
schooling. As Fig. 11a shows, the correlation declines dramatically for cohorts born in 1940–1958.
This result holds irrespective of whether we consider the full range of the test score or the test
score dummy (the latter covering a broader range of birth cohorts). However, as Fig. 11b shows,
the correlation coefficients among the younger cohorts—who have been affected by the expansion
of college and university education—have not reversed back toward the levels of older cohorts. In
contrast, the correlation appears stable for the younger cohorts.
While Fig. 11 clearly shows a disconnect between overall years of schooling and cognitive skills,
our previous findings (related to changing transition probabilities from lower secondary school to
high school and from high school to college) raise the question of whether the declinng association
between cognitive skills and years of schooling is observed at all educational transitions. Fig. 12
presents the correlation between cognitive test scores and highest level of education by birth year.
Fig. 12a presents the associations for years of schooling (as in Fig. 11) for reference, and for high
school, college, and university completion separately. As the figure shows, correlations decline
until those born in the late 1950s, after which the correlation coefficient is virtually constant.
However, as Figs. 12b–d show, the decline is mainly driven by a drop in the association between
cognitive skills and completion of lower secondary schooling (grade 9). While Fig. 12b shows a
22drop in the correlation, Fig. 12c, which focuses on high school completion given completion of 9
years of schooling, presents a very different picture: Cohorts born in 1940–1958 start out at a
much lower level when considering the correlation between academic high-school completion given
9th grade completion and cognitive skills. Also, the correlation initially increases slightly and
subsequently declines. Furthermore, the association between college completion given academic
high-school completion and cognitive test scores (12d) is low at around 0–0.1 and almost constant
across the period (perhaps mildly increasing for the most recent cohorts). These findings suggest
that selection based on cognitive skills into different education levels changes substantially over time
as the educational system expands at different levels.29 Thus, differences in educational attainment
for the most recent cohorts do not reflect the same cognitive skill gaps as for the cohorts born, say,
during the 1940s.
Non-cognitive skills are also important for educational attainment (Almlund et al., 2011). While
the conscription data allow us to study the cognitive skills of cohorts born almost 50 years apart,
comparable measures of non-cognitive skills are not available in the register data. However, two
Danish longitudinal surveys of the 1954 and 1995 cohorts enable us to analyze the development using
measures of non-cognitive skills. Both are nationally representative surveys that include identical
measures; the same cognitive test score measured at ages 14–15 (a verbal intelligence test) and the
Rosenberg self-esteem scale (Rosenberg, 1965) measured at around age 20.30 Table 2 shows the
estimated coefficients from regressions of schooling outcomes on cognitive and non-cognitive test
29
Fig. A.14 examines how education expansions across different educational transition points are related to selection
on cognitive skills in different parts of the skill distribution. The figure shows that educational expansion was driven
by children with low-level cognitive skills until the late 1950s. Yet, from the 1970s onward the education expansion
instead involves increasing levels of positive selection where education has expanded mostly for individuals with
high-level cognitive skills.
30
Section B.5 describes data construction. As the 1995 cohort has not yet reached an age where we can measure
both college and university completion, we instead define college completion as having completed a college degree
(or higher) or being enrolled in college or university.
23scores separately for the two surveys. Whereas Panels A and B present coefficients for the 1954 and
1995 cohorts respectively, Panel C shows changes in the coefficients (Panel B minus A).
Column 1 in Table 2 shows that the coefficient of cognitive skills on academic high-school
completion decreases between the two surveys, suggesting that selection by cognitive skills at this
transition point has become weaker over time. Comparing the estimates for cognitive skills in
columns 1, 2, and 3, we find that cognitive skills in both cohorts are significantly associated with
academic high-school and college completion, but most of the association between college education
and cognitive skills is explained by the preceding academic high-school margin. In addition, while
the importance of cognitive skills has decreased at the high school margin (column 1), it has
increased slightly at the college margin (column 3). These overall patterns corroborate the findings
based on the conscription registers reported in Fig. 12.
Table 2 also shows that our non-cognitive measure, self-esteem, is more predictive of educational
attainment in the 1995 cohort than in the 1954 cohort.31 While there is no association in the
1954 cohort, self-esteem is significantly associated with both high school and college completion
in the 1995 cohort. This finding suggests that the declining relationship between cognitive skills
and academic high-school completion appears to have been replaced by a growing selection based
on non-cognitive skills, thus mirroring U.S. findings with respect to high school drop outs, GED
recipients, and high school graduates for whom non-cognitive skills also play an important role in
selection (e.g. Heckman et al., 2011).
Considered together, Fig. 12 and Table 2 show that the importance of skills for selection into
education changes over time and across education levels. This finding suggests that the intergenera-
31
Similarly, Blanden et al. (2007) find that non-cognitive skills play a greater role in mediating intergenerational
income mobility for more recent cohorts in the U.K., and Edin et al. (2018) find an increasing return to non-cognitive
skills in Sweden in recent decades. In addition, Castex and Dechter (2014) find that wage earnings returns to cognitive
skills are constant throughout the period in question in the U.S.
24You can also read