Single-cell atlas reveals meningeal leukocyte heterogeneity in the developing mouse brain
←
→
Page content transcription
If your browser does not render page correctly, please read the page content below
Downloaded from genesdev.cshlp.org on October 14, 2021 - Published by Cold Spring Harbor Laboratory Press

RESOURCE/METHODOLOGY

Single-cell atlas reveals meningeal
leukocyte heterogeneity in the developing
mouse brain
Aura Zelco,1 Vanja Börjesson,2 Jurrian K. de Kanter,3 Cristina Lebrero-Fernandez,4
Volker M. Lauschke,5,6 Eridan Rocha-Ferreira,7 Gisela Nilsson,1 Syam Nair,7 Pernilla Svedin,1
Mats Bemark,4 Henrik Hagberg,7 Carina Mallard,1 Frank C.P. Holstege,3 and Xiaoyang Wang1,7,8
1
 Centre of Perinatal Medicine and Health, Institute of Neuroscience and Physiology, Department of Physiology, Sahlgrenska
Academy, University of Gothenburg, Gothenburg 40530, Sweden; 2Bioinformatics Core Facility, Sahlgrenska Academy, University
of Gothenburg, Gothenburg 413 90, Sweden; 3Princess Máxima Center for Pediatric Oncology, 3584 CS Utrecht, The Netherlands;
4
 Department of Microbiology and Immunology, Sahlgrenska Academy, University of Gothenburg, Gothenburg 40530, Sweden;
5
 Department of Physiology and Pharmacology, Karolinska Institute, Stockholm 17177, Sweden; 6Dr. Margarete Fischer-Bosch
Institute of Clinical Pharmacology, Stuttgart 70 376, Germany; 7Centre of Perinatal Medicine and Health, Institute of Clinical
Sciences, Department of Obstetrics and Gynecology, Sahlgrenska Academy, Gothenburg University, Gothenburg 40530, Sweden;
8
 Henan Key Laboratory of Child Brain Injury, Institute of Neuroscience, Third Affiliated Hospital of Zhengzhou University,
Zhengzhou 450052, China

The meninges are important for brain development and pathology. Using single-cell RNA sequencing, we have
generated the first comprehensive transcriptional atlas of neonatal mouse meningeal leukocytes under normal
conditions and after perinatal brain injury. We identified almost all known leukocyte subtypes and found differences
between neonatal and adult border-associated macrophages, thus highlighting that neonatal border-associated
macrophages are functionally immature with regards to immune responses compared with their adult counterparts.
We also identified novel meningeal microglia-like cell populations that may participate in white matter develop-
ment. Early after the hypoxic–ischemic insult, neutrophil numbers increased and they exhibited increased granu-
lopoiesis, suggesting that the meninges are an important site of immune cell expansion with implications for the
initiation of inflammatory cascades after neonatal brain injury. Our study provides a single-cell resolution view of
the importance of meningeal leukocytes at the early stage of development in health and disease.
[Keywords: preterm brain injury; neonatal mouse; meningeal leukocytes; single-cell RNA sequencing]
Supplemental material is available for this article.
Received December 17, 2020; revised version accepted June 28, 2021.

The meninges are part of the central nervous system                         the development of meningeal fibroblast diversity and
(CNS) and consist of a triple-layer barrier divided into                    function have been studied (DeSisto et al. 2020).
the dura, arachnoid, and pia mater. These membranes pro-                      The first postnatal week in rodents is characterized by
tect from potential threats coming from the periphery that                  rapid development of the CNS, similar to development
might affect the brain parenchyma. Recent studies have                      in humans during late pregnancy and the perinatal period.
revealed the role of meningeal resident and infiltrating                    Postnatal days (PND) 2–7 in mice correspond to gestation-
immune cells in response to different stimuli under phys-                   al weeks 23–32 in humans (Mallard and Vexler 2015), a
iological conditions and in brain pathologies (Mrdjen et al.                stage with the greatest vulnerability to white matter dam-
2018; Van Hove et al. 2019; Utz et al. 2020). However, lit-                 age, which is one of the most common types of injury in
tle is known about the role of neonatal meningeal im-                       preterm infants (Back 2017; Volpe 2019). This is because
mune cells in CNS development and pathology, though                         premyelinating oligodendrocytes at this developmental
                                                                            stage are most abundant, and they are highly susceptible
Corresponding authors: xiaoyang.wang@fysiologi.gu.se,
aura.zelco@gmail.com
Article published online ahead of print. Article and publication date are   © 2021 Zelco et al. This article, published in Genes & Development, is
online at http://www.genesdev.org/cgi/doi/10.1101/gad.348190.120. Arti-     available under a Creative Commons License (Attribution-NonCommer-
cle freely available online through the Genes & Development Open Access     cial 4.0 International), as described at http://creativecommons.org/licens-
option.                                                                     es/by-nc/4.0/.

                  GENES & DEVELOPMENT 35:1–18 Published by Cold Spring Harbor Laboratory Press; ISSN 0890-9369/21; www.genesdev.org                  1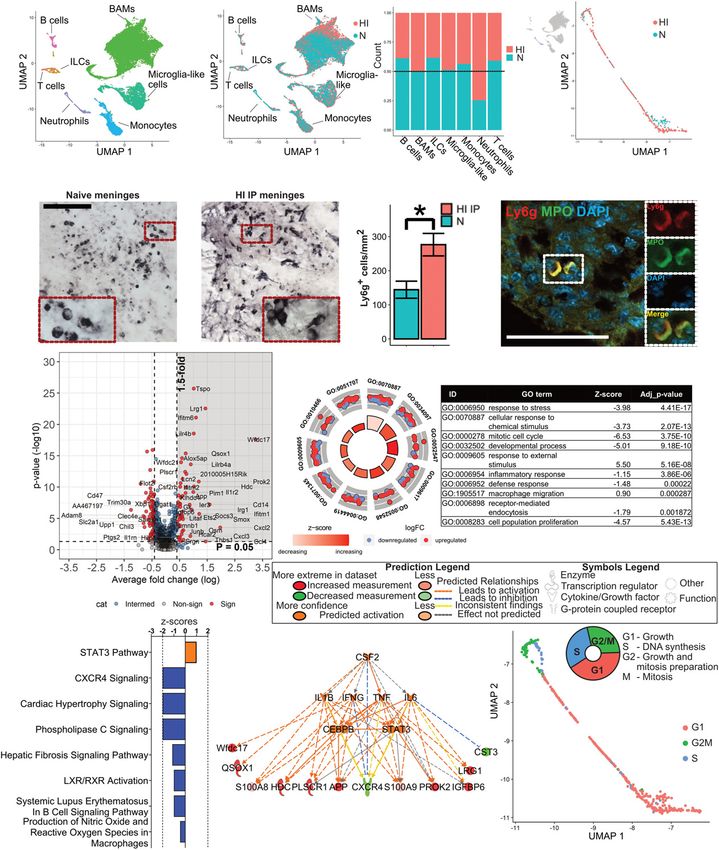
Downloaded from genesdev.cshlp.org on October 14, 2021 - Published by Cold Spring Harbor Laboratory Press

Zelco et al.

to insults (Back et al. 2001). Preterm brain injuries, such as      responding cell types, which agreed with the manual an-
encephalopathy of prematurity, can lead to cognitive and            notation (Fig. 1F,G; Supplemental Data 1). All cell
motor disabilities. There is still no effective treatment for       clusters expressed varying levels of Ptprc, the gene encod-
these conditions, although therapeutic approaches such              ing CD45 (Fig. 1G), confirming that the leukocyte prepara-
as erythropoietin have been tested (Song et al. 2016; Juul          tions were not contaminated with other neural cells.
et al. 2020). The pathogenesis of preterm brain injury is
complex, and we and others have shown that immune
                                                                    BAMs, microglia-like cells, and monocytes are distinct
cells play key roles in the development of brain injury
                                                                    yet intertwined cell populations
(Zhang et al. 2017; Albertsson et al. 2018; Herz et al.
2018; Nazmi et al. 2018). After insult in the neonatal              A recent study characterized BAMs during embryonic de-
brain, γδT cells have a detrimental effect by enhancing             velopment (Utz et al. 2020), where BAMs were defined by
brain damage, more so than conventional T and B cells               the expression of Mrc1 (CD206), Lyve1, Ms4a7, and Pf4.
(Zhang et al. 2017; Albertsson et al. 2018; Nazmi et al.            Similar to BAMs from embryonic mouse meninges, the
2018), which differs from the adult brain where both γδT            neonatal mouse meningeal BAM cluster expressed the
cells (Shichita et al. 2009) and conventional T cells (Yil-         typical signature markers Mrc1, Lyve1, Ms4a7, and Pf4
maz et al. 2006; Hurn et al. 2007) play important roles in          (Fig. 2A–D). All four markers were mainly expressed in
ischemic injury. The γδT cells tend to concentrate in               the BAM cluster, with some microglia-like cells positive
the meninges after brain injury (Albertsson et al. 2018;            for Mrc1 or Lyve1 (Fig. 2A,B, Supplemental Fig. S2A,B).
Alves de Lima et al. 2020) similar to innate lymphoid cells         Therefore, BAMs in the neonatal meninges shared the sig-
(ILCs) (Gadani et al. 2017; Zelco et al. 2020). However, we         nature genes common to BAM populations in the embry-
still know little about the immune landscape of the me-             onic mouse. By immunofluorescence staining of markers
ninges in newborns, including whether or not the menin-             for BAMs (CD206 and Lyve1) and microglia (Iba-1), we in-
ges represent an important site harbouring immune cells             deed confirmed that the majority of macrophages were
that take part in the inflammatory response and contrib-            BAMs (CD206+/Iba-1+/Lyve1+) in the neonatal meninges,
ute to injury processes after insult to the developing brain.       while microglia-like cells (CD206–/Iba-1+/Lyve1+) were
   The purpose of this study was to reveal the heterogene-          also present (Fig. 2E).
ity and transcriptomic signature of resident leukocyte                 The BAM cluster comprised several subclusters
populations in the neonatal mouse meninges using drop-              (Fig. 2F). To explore this further, we compared the neona-
let-based single-cell RNA sequencing (scRNA-seq). We                tal meningeal BAMs with the existing BAM database gen-
also investigated the acute effect of hypoxia–ischemia              erated from adult mouse meninges (Van Hove et al. 2019),
(HI)-induced preterm brain injury on the meningeal leuko-           in which the meningeal BAM population was subdivided
cyte composition and the dynamics of single cell expres-            based on the expression level of signature genes. We also
sion signatures.                                                    included the monocyte clusters to determine whether
                                                                    this was a population distinct from BAMs as previously
                                                                    described (Van Hove et al. 2019). We aggregated the data
Results                                                             from the neonatal meningeal BAMs and monocyte clus-
                                                                    ters with the adult mouse meningeal BAM and monocyte
The neonatal mouse meningeal leukocyte population
                                                                    data set (Van Hove et al. 2019) obtained from enriched
is heterogeneous
                                                                    subdural (SD) and dural (D) meninges, which are the ana-
To study resident and infiltrating leukocytes in the neona-         tomical structures most similar to the meninges used in
tal meninges, we sorted meningeal leukocytes expressing             the current study. Neonatal meningeal BAMs mainly
intermediate and high levels of CD45 (CD45int+high) from            overlapped with SD-BAMs from the adults, while overall
PND4 naïve and HI pups 6 h after the insult and performed           very few D-BAMs were present (Fig. 2G). However, SD-
scRNA-seq (Fig. 1A; Supplemental Fig. S1). To identify the          BAMs, D-BAMs, and their subtypes D2 or D3, as found
cell populations, we used both a manual method with Cell-           in the adult meningeal BAMs, did not segregate when an-
Marker in Seurat and an automatic annotation using CHE-             alyzing the neonatal BAM population alone (Fig. 2H–J;
TAH (characterization of cell types aided by hierarchical           Supplemental Fig. S2D–G). These results are in accor-
clustering) (Fig. 1B,C; Supplemental Data 1; de Kanter              dance with previous findings (Mrdjen et al. 2018; Van
et al. 2019). Stratification by markers for immune and neu-         Hove et al. 2019), indicating that BAM heterogeneity is
ral cell populations identified seven clusters: border-associ-      very low at birth and increases with age and that neonatal
ated macrophages (BAMs), microglia-like cells, monocytes,           BAMs mainly express low levels of MHCII (MHCII low)
neutrophils, T cells, ILCs, and B cells (Fig. 1B,C). We cross-      (Supplemental Fig. S2F). The neonatal and adult mono-
examined the two annotation methods and confirmed the               cyte populations overlapped quite well, as expected, al-
consistency between annotations (Fig. 1D).                          though they still showed some differences, especially in
   BAMs appeared as the main cluster (15,583 cells), fol-           subcluster 2 (Fig. 2G; Supplemental Fig. S3A). Additional-
lowed by microglia-like cells (2822 cells) and monocytes            ly, we observed that the neonatal meningeal monocyte
(2012 cells), while neutrophils, T cells, B cells, and ILC          cluster expressed signature genes typical for adult D2
clusters were much smaller (401, 201, 304, and 240 cells,           and D3 BAMs (Fig. 2I,J). These results, together with the
respectively) (Fig. 1E; Supplemental Tables S1, S2). Each           vicinity of adult monocyte subcluster 2 and D-BAMs,
cluster expressed highly specific marker genes for the cor-         may indicate that at least part of the adult D-BAMs might

2       GENES & DEVELOPMENT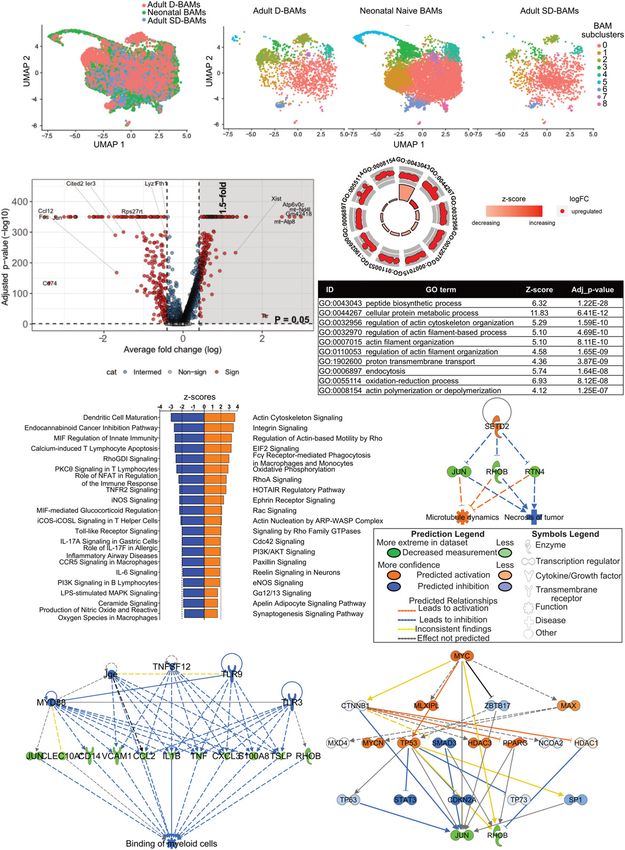
Downloaded from genesdev.cshlp.org on October 14, 2021 - Published by Cold Spring Harbor Laboratory Press

                                                                                          Neonatal mouse meningeal leukocyte heterogeneity

     A

     B                               C                                              D

     E                           F

     G

Figure 1. The meningeal leukocyte population is composed of several subtypes of immune cells with typical signature marker genes. (A)
Dissection of the meninges from PND4 naïve mice and at 6 h after HI, and the schematic overview of the 10X Chromium scRNA-seq
procedure (created with Biorender.com). (B,C ) Uniform manifold approximation and projection (UMAP) plot generated using Seurat (B)
or CHETAH (C). Confidence score >0.1. (D) Overlay of CHETAH annotations in the Seurat UMAP. (E) Numbers expressed as percentages
of each cell population among the total neonatal meningeal leukocytes. (F ) Heat map showing the signature gene expression for each clus-
ter identified in B. (G) UMAP showing the expression of some signature genes present in the heat map.

have a monocyte origin instead of maturing from macro-                 cluster 2 might be one of the sources that gives the
phages, as suggested previously (Van Hove et al. 2019;                 mixed ontogeny of the adult dural BAMs as previously ob-
Utz et al. 2020). Trajectory analysis including the neona-             served (Van Hove et al. 2019).
tal meningeal BAMs and monocyte clusters (subclusters                    BAMs, monocytes, and microglia-like cells share sever-
1 and 2) as well as the corresponding adult dural BAMs                 al common markers and are usually difficult to dis-
and monocyte clusters confirmed that, overall, the neona-              tinguish unambiguously, so we conducted a trajectory
tal clusters tracked well with their adult counterparts,               analysis to identify whether and in what way neonatal
both for BAMs and monocytes (Fig. 2K). Interestingly,                  meningeal BAMs, microglia-like cells, and monocyte
neonatal and adult monocyte subclusters 2 were shown                   cell clusters were related to each other. To test whether
to be intermediate populations between monocyte sub-                   we could discern the different subclusters as well as
cluster 1 and BAMs. This indicates that monocyte sub-                  microglia-like cells and monocytes, we included all

                                                                                                         GENES & DEVELOPMENT            3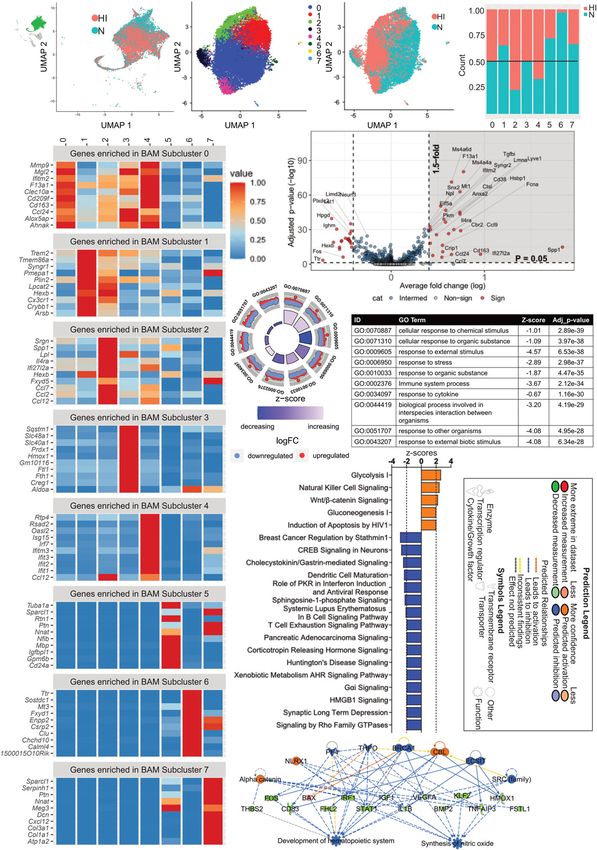
Downloaded from genesdev.cshlp.org on October 14, 2021 - Published by Cold Spring Harbor Laboratory Press

Zelco et al.

               A                                  B                        C                            D

               E

               F              G

               H                           I                          J                             K

               L                                 M                                              N

Figure 2. Gene expression and characterization of neonatal BAMs compared with embryonic and adult BAMs, monocytes, and micro-
glia-like cells. (A–D) Gene expression of Mrc1 (A), Lyve1 (B), Ms4a7 (C), and Pf4 (D), which are typical BAM markers. (E) Immunofluores-
cent staining of BAMs (CD206+/Lyve1+/Iba-1+, star) and microglia-like cells (CD206−Lyve1+/Iba-1+, arrowhead) in naïve meninges at
PND4. Scale bar, 100 µm. (F ) Subclustering of BAMs in Seurat. (G) Comparison of neonatal BAMs and monocytes with BAMs and mono-
cytes from adult SD and D meninges. The left UMAP shows the neonatal BAMs and monocytes with SD-BAMs and D-BAMs overlaid,
while the right plots are the split view of the same UMAP based on the source of the cells. (H–J) Signature gene expressions that are typical
of adult SD-BAMs (Ccr1, Lyve1, Ednrb, Colec12, Prps2, Ptgds, P2rx7, and Egfl7; H), adult D-BAMs subtype 2 (Irf7, Crip1, and Ccl9; I), and
adult D-BAMs subtype 3 (Clec4b1, Ccr2, Vim, Lsp1, and Lgals3; J) in the neonatal data set. (K) SCORPIUS trajectory analysis to study the
relationships among neonatal BAMs and monocytes (divided as subclusters 1 and 2) and the corresponding adult subclusters from the
dural data set. (L) UMAP plot showing microglia-like cells, monocytes, and subclusters of BAMs. (M) SCORPIUS trajectory analysis show-
ing the relationship between BAM subclusters, microglia-like cells, and monocytes. (N) New BAM subclustering after trajectory analysis.

4       GENES & DEVELOPMENT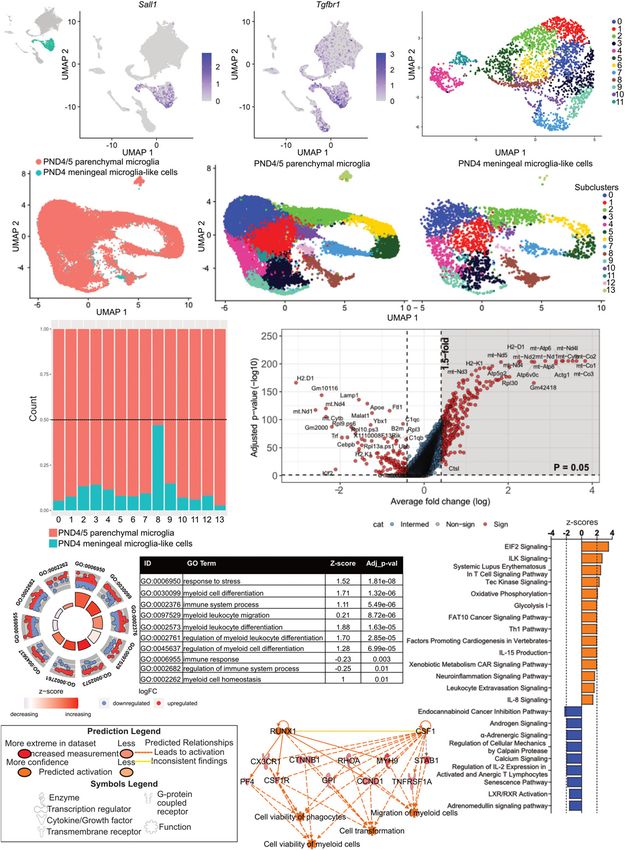
Downloaded from genesdev.cshlp.org on October 14, 2021 - Published by Cold Spring Harbor Laboratory Press

                                                                                    Neonatal mouse meningeal leukocyte heterogeneity

apparent subclusters of BAMs (Fig. 2L). SCORPIUS analy-            Neonatal meningeal monocytes show different immune
sis showed that neonatal meningeal monocytes, micro-               responses compared with their adult counterparts
glia-like cells, and BAMs were three distinct populations
                                                                   Next, we investigated differences between adult and neo-
and that BAMs were in the middle of the other two popu-
                                                                   natal meningeal monocytes (Fig. 2G), specifically studying
lations in terms of gene expression (Fig. 2M), although a
                                                                   the developmental changes between these two popula-
few cells showing intermediate gene expression between
                                                                   tions. We found a different distribution of cells in neonatal
BAMs and microglia-like cells were also observed. To
                                                                   versus adult monocytes (Supplemental Fig. S3A). There
note, we did not observe obvious differences between
                                                                   were 584 differentially expressed genes between neonatal
the subclusters of BAMs (Fig. 2M,N). Therefore, there is
                                                                   and adult meningeal monocytes (Supplemental Fig. S3B;
a population of BAMs in the neonatal mouse meninges
                                                                   Supplemental Tables S5, S6), and the GO term enrichment
that has a similar gene signature compared with adult
                                                                   analysis showed an up-regulation of immune-related pro-
SD-BAMs. Additionally, the neonatal meningeal BAM
                                                                   cesses in neonatal monocytes compared with adult mono-
population was distinct from monocytes and microglia-
                                                                   cytes (Supplemental Fig. S3C; Supplemental Data 3). IPA
like cells, although some cells may be an intermediate
                                                                   confirmed these results, showing an up-regulation of im-
subpopulation between BAMs and microglia-like cells,
                                                                   mune signaling and cytoskeleton pathways, such as leuko-
and to a lesser extent between BAMs and monocytes, hav-
                                                                   cyte extravasation and integrin signaling (Supplemental
ing gene expression properties of both cell types
                                                                   Fig. S3D). Eif2 signaling was among the down-regulated
                                                                   pathways, and when this pathway is defective cells be-
Neonatal BAMs show cytoskeleton and immune                         come more susceptible to bacterial invasion (Shrestha
response-related developmental changes compared                    et al. 2012). Thus, these analyses suggest that neonatal
with adult BAMs                                                    meningeal monocytes, although having increased im-
                                                                   mune-related processes compared with adults, may still
Once we established the presence of a BAM cluster com-
                                                                   be more susceptible to bacterial invasion.
prising a distinctly separate cell population, we character-
ized those cells in more depth to highlight potential
developmental differences between neonatal BAMs and
                                                                   The neonatal meningeal microglia-like cell population
adult BAMs from the literature (Fig. 3A; Van Hove et al.
                                                                   shows different regulation of the immune response and
2019). There were >600 differentially expressed genes be-
                                                                   distinct features compared with parenchymal microglia
tween neonatal naive BAMs and adult BAMs (SD-BAMs
and D-BAMs) (Supplemental Data 2). The top 20 up-regu-             As previously established, microglia-like cells formed a
lated genes were involved in ATP production in mitochon-           distinct cluster from BAMs. Sall1, a microglia-specific
dria (mt-Atp8 and Atp5g3) and cell growth (Lyve1 and               gene, was observed in the microglia-like cell populations
Igfbp4) (Supplemental Table S3), while the most down-reg-          but not in BAMs (Fig. 4A; Supplemental Fig. S2H). Also,
ulated genes were related to attraction to monocytes and           Tgfbr1, which is necessary for microglial development
basophils (Ccl2), antigen binding (H2-Ab1 and H2-Aa),              (Utz et al. 2020), was expressed predominantly in micro-
and antigen-presenting cell response (Cd74) (Supplemen-            glia-like cells (Fig. 4B). Microglia-like cells also expressed
tal Table S4). Significant gene ontology (GO)-enriched bio-        Aif-1 (Iba-1), Itgam (Cd11b), and Itgb2 (Cd18) (Supplemen-
logical processes included metabolism, actin cytoskeleton          tal Fig. S2I–K). Iba-1 is a typical microglial marker, while
organization, and oxidoreductase activity (Fig. 3C; Supple-        the integrins Cd11b and Cd18 form complement receptor
mental Data 3). These findings were further confirmed by           3, which is expressed exclusively by microglia (Akiyama
ingenuity pathway analysis (IPA), with cytoskeleton-relat-         and McGeer 1990; Stephan et al. 2012) and is involved in
ed signaling, the Eif2 signaling pathway, and oxidoreduc-          synaptic phagocytosis by microglia (Stevens et al. 2007;
tase activity among the top 20 up-regulated canonical              Schafer et al. 2012). Therefore, the meningeal microglial-
pathways, while signaling pathways related to inflamma-            like cells observed may retain typical functions of paren-
tion and immune responses were dominant within the                 chymal microglia.
top 20 down-regulated canonical pathways (Fig. 3D). In ad-            The microglia-like cell population could be reclustered
dition, Setd2 was predicted to be the regulator of microtu-        into several subpopulations (Fig. 4C). To identify features
bule dynamics and necrosis through down-regulation of              of subpopulations and to confirm that these cells were
the Jun, Rhob, and Rtn4 genes (Fig. 3E). The down-regula-          not contaminants from the parenchymal microglia, we ag-
tion of Jun and Rhob, along with other genes, was also pre-        gregated and compared neonatal meningeal microglia-like
dicted to result in down-regulation of immune response             cells with parenchymal microglia from PND4/5 mice
processes (for example, the binding of myeloid cells),             (Hammond et al. 2019), the same age as the mice used in
with the proto-oncogene Myc being among the main up-               the current study. The two data sets overlapped to a large
stream regulators affecting Jun and Rhob expression (Fig.          extent, and all 14 subclusters from the aggregated data
3F–G). Overall, BAMs in neonatal mice showed up-regula-            could be found in both data sets separately (Fig. 4C,D).
tion of cytoskeleton-related signaling and cellular respira-       Hammond et al. (2019) identified a total of five subpopula-
tion compared with adult mice, while other functional              tions of microglia highly specific for this age, characterized
processes that are characteristic of mature macrophages,           by the expression of several markers. Four out of the five
such as the recruitment of cells and immune response ac-           main parenchyma microglia subclusters in the PND4/5
tivity, were down-regulated compared with adult mice.              mouse brain were found in the aggregated data set, as

                                                                                                   GENES & DEVELOPMENT            5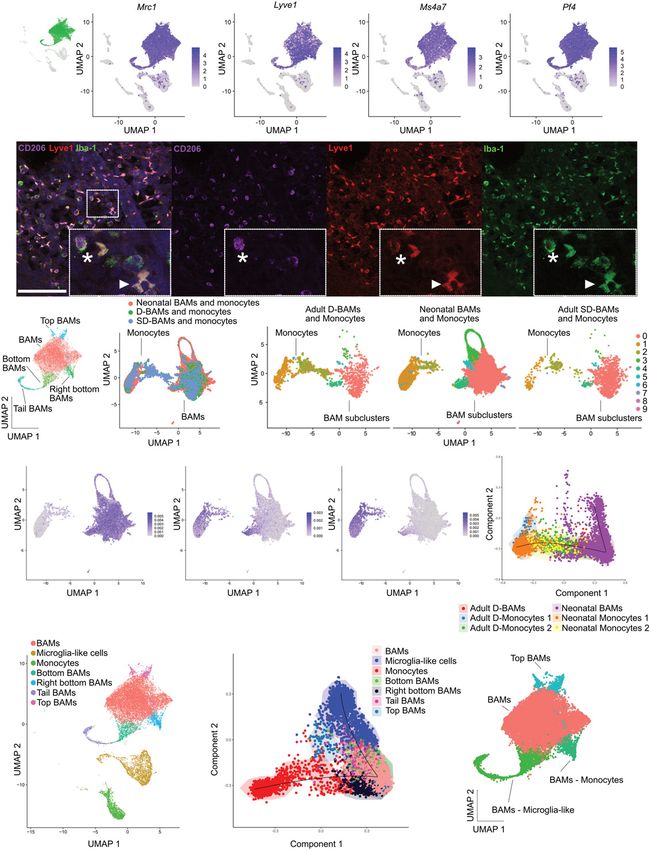
Downloaded from genesdev.cshlp.org on October 14, 2021 - Published by Cold Spring Harbor Laboratory Press

             A

            B                                                           C

             D                                                                        E

             F                                                            G

Figure 3. Neonatal BAMs have increased gene expression for cytoskeleton processes, while immune response is down-regulated com-
pared with adults. (A) UMAP of neonatal naïve BAMs and the overlap with adult SD-BAMs and D-BAMs. The left UMAP is the overlay
from the SD-BAMs and D-BAMs, while the right UMAP shows the split of SD-BAMs and D-BAMs in the neonatal BAM cluster. (B) Vol-
cano plot for differentially expressed genes between neonatal and adult BAMs, with genes highlighted in the gray area having fold change
>1.5 and P < 0.05 in the neonatal BAMs compared with adult BAMs. (C ) GOPlot representation of relevant GO terms from the gProfiler
analysis, with the table abbreviations below. The outer circle represents how many genes are up-regulated or down-regulated in the GO
term. The inner circle has a double function: The height of the bar indicates the negative log10 adjusted P-value (the taller, the more sig-
nificant), and the color of the bar represents the z-score. (D–G) IPA canonical pathways analysis. (D) z-score > 1.5, P < 0.05 for all. Regulator
analyses for Setd2 (E) and other genes involved in binding of myeloid cells (F ). (G) Upstream regulator analysis showing the effects of Myc
activation.

6      GENES & DEVELOPMENT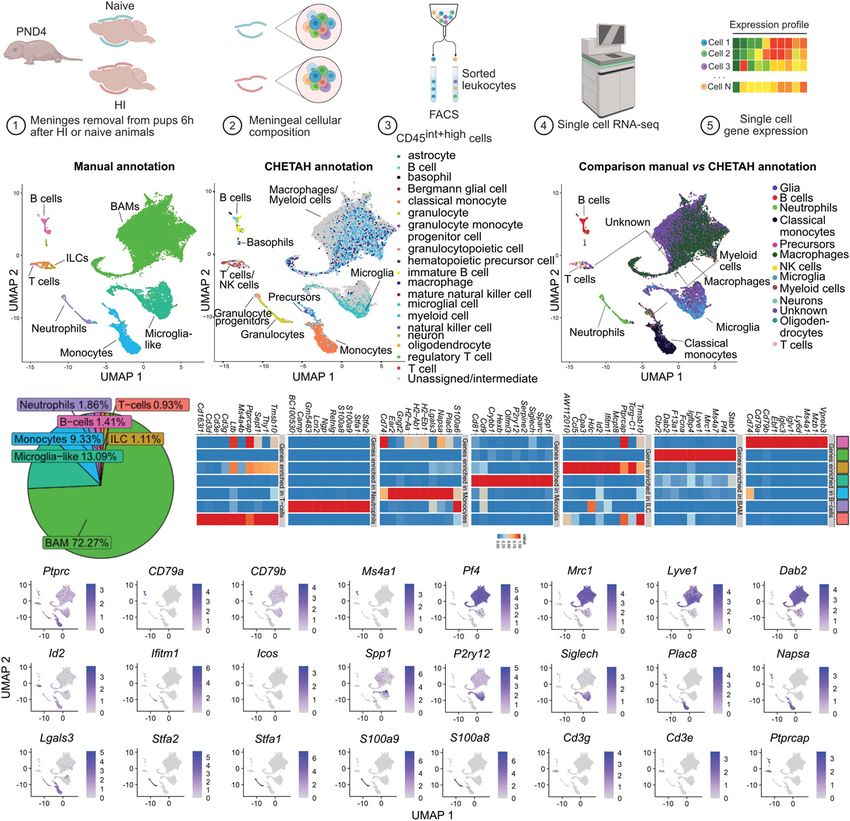
Downloaded from genesdev.cshlp.org on October 14, 2021 - Published by Cold Spring Harbor Laboratory Press

            A                                             B                                  C

            D                                      E

            F                                                 G

            H                                                                                 I

                                                              J

Figure 4. Meningeal microglia-like cells show different frequencies of subpopulations compared with parenchymal microglia. (A,B)
UMAP plots showing gene expression of Sall1 (A) and Tgfbr1 (B). (C ) UMAP plots showing the initial meningeal microglia-like cell sub-
populations. (D,E) UMAP plots showing the aggregation analysis results of the meningeal microglia-like cells with parenchymal microglia
from PND4/5 mice (Hammond et al. 2019) as the overlap of two data sets shown in D and the 14 subclusters found in both data sets (pa-
renchymal microglia on the left and meningeal microglia-like cells on the right) shown in E. (F) Frequency bar chart showing the propor-
tion of the microglia subclusters in the meningeal and parenchymal data set. (G,H) Differentially expressed gene analysis for aggregation
subcluster 8 comparing meningeal and parenchyma cells, presented as a volcano plot (G) and GOPlot representation of relevant GO terms
from the gProfiler analysis (H). The outer circle represents how many genes are up-regulated or down-regulated in the GO term. The inner
circle has a double function: The height of the bar indicates the negative log10 adjusted P-value (the taller, the more significant), and the
color of the bar represents the z-score. (I,J) IPA canonical pathways analysis (z-score > 1.5, P < 0.05 for all; I ) and predicted regulators (J) for
the same comparison.

                                                                                                                  GENES & DEVELOPMENT              7
Downloaded from genesdev.cshlp.org on October 14, 2021 - Published by Cold Spring Harbor Laboratory Press

Zelco et al.

confirmed by the expression of various subcluster signa-            ter 8 specifically expressed these markers (Supplemental
ture genes such as Rrm2 (Hammond 2a), Ube2c (Ham-                   Figs. S2A–C, S4A,B). It has been previously reported that
mond 2b), Cenpa (Hammond 2c), and Spp1 (Hammond 4)                  at embryonic day (E) 14.5 there is a parenchymal micro-
(Supplemental Fig. S2L–Q). Arg1, a marker for the fifth             glial population that shows BAM features (Hammond
subcluster (Hammond 1), could not be used to define a spe-          et al. 2019). This E14.5 subcluster (subcluster 6 at E14.5
cific subpopulation (Supplemental Fig. S2L). These find-            in Hammond et al.) featured an expression signature in-
ings were further confirmed when we performed a gene                cluding Ms4a7, Ccr1, and Ms46c, genes that were also pre-
marker analysis to look for potential markers for each sub-         dominantly expressed in subcluster 8 (Supplemental Fig.
cluster in the aggregated data set (Supplemental Fig. S4).          S2R,S). This may indicate that the neonatal meningeal
The resulting heat map (Supplemental Fig. S4A) showed               microglia-like population identified in the current study
that typical gene markers could be found for most of the            represents a distinct kind of microglia-like cell population
subclusters. In some of them, such as subcluster 8, the ex-         with BAM features that is present in the meninges at a lat-
pression of the marker genes was very distinct, with some           er age than previously found in the parenchyma.
of the genes also belonging to the typical BAM signature               We thus focused on meningeal subcluster 8 for its dis-
genes (Supplemental Fig. S4A,B). Furthermore, subclus-              tinct features and on subcluster 3 due to its similarity to
ters 3 and 9 showed similar expression of marker genes              the main parenchyma Spp1-enriched microglia subcluster
such as Spp1, Gpnmb, Igf1, and Lgals3 (Supplemental                 found in PND4/5 mice. Among the most significantly up-
Fig. S4A,B), suggesting that these two subclusters, espe-           regulated genes in subcluster 8 were Pf4 and Dab2, which
cially subcluster 3, were similar to the main parenchymal           are involved in chemoattraction and adhesion processes
microglia subcluster 4 at PND4/5 as suggested by Ham-               (Supplemental Fig. S4; Supplemental Table S8). Similarly,
mond et al. (2019) (Supplemental Fig. S2P,Q).                       subcluster 8 was highly enriched in genes related to im-
   Examination of the frequencies of the two data sets in           mune response, defense response, and stress response
each subpopulation showed that subcluster 8 was the                 (Fig. 5B; Supplemental Data 3). These results were con-
major meningeal microglia-like cell subcluster (with                firmed by IPA (Fig. 5C,D), and among the top up-regulated
gene expression signatures that were distinct from the pa-          pathways we observed IL-8 signaling, which is involved in
renchymal microglia) (Fig. 4F; Supplemental Fig. S2L–P),            the immune response in microglial cells (Flynn et al.
indicating that the microglia-like cells obtained in the cur-       2003). Several immune-related functions like chemotaxis
rent study were not contaminants from the brain                     and immune response of phagocytes and activation of my-
parenchyma.                                                         eloid cells were predicted to be up-regulated by IFN-γ,
   We then further explored the differences between men-            which is known to boost immune response and metabo-
ingeal and parenchymal microglia focusing on subcluster             lism in microglia (Fig. 5D; Ritprajak and Azuma 2015;
8. There were 486 differently expressed genes between               Kroczynska et al. 2016; Baik et al. 2019).
the two data sets (Fig. 4G; Supplemental Data 2), and these            In subcluster 3, the top 20 up-regulated genes were
were mainly involved in metabolic processes, such as mi-            mostly involved in immune response such as Spp1,
tochondrial and ribosomal genes (Supplemental Table S7).            Lgals3, and Csf1, as well as genes with metabolic func-
In addition, GO term enrichment showed increased                    tions like Lpl and Pgam1 (Supplemental Table S9). GO
expression of genes involved in biological processes such           term enrichment showed that biological processes related
as myeloid cell differentiation, homeostasis, and stress            to iron transport, leukocyte chemotaxis, and myeloid
response (Fig. 4H; Supplemental Data 3). Using IPA, in-             leukocyte migration were enriched, in contrast to cell pro-
creased metabolism (glycolysis and oxidative phosphory-             liferation and defense response processes (Fig. 5E; Supple-
lation), immune-related pathways (Th1 pathway) (Fig. 4I),           mental Data 3). IPA predicted that subcluster 3 had up-
and regulators involved in cell viability and migration of          regulated glycolysis and gluconeogenesis, while im-
immune cells (Runx1 and Csf1) (Fig. 4J) were found.                 mune-related pathways were down-regulated (Fig. 5F).
Runx1 is a key regulator of myeloid cell proliferation and             Furthermore, developmental white matter-associated
differentiation (Zusso et al. 2012), while Csf1 is fundamen-        genes (Itgax, Igf1, Spp1, Cxcl12, Gpnmb, Dkk2, Cd28,
tal for microglial maintenance in the white matter (Easley-         Csf1, Fabp5, Ccl5, and C1qa) and disease-associated genes
Neal et al. 2019). Therefore, meningeal subcluster 8                (Itgax, Apoe, Axl, Trem2, Lpl, Cst7, Csf1, Cd9, Ccl6, and
seemed to be more involved in myeloid cell differentiation          Timp2) (Lloyd and Miron 2019) were mostly expressed in
compared with the parenchymal counterpart and may also              subcluster 3, similar to the major parenchymal microglia
be involved in white matter development.                            at PND4/5 and PND7 (Hammond et al. 2019; Li et al.
   To obtain a more comprehensive overview of the func-             2019), suggesting that a minor part of the meningeal
tions of the different meningeal microglia-like cell sub-           microglia-like cells might not only be involved in im-
clusters, we next performed a comparative analysis                  mune cell responses, but also support oligodendrocyte
where the gene expression signature of each subcluster              and white matter development (Fig. 5G,H).
was compared with all others using the same annotation                 Overall, the other microglia-like cell subclusters
used for identifying the subpopulations in the aggregation          showed differential regulation of biological processes
analysis (Fig. 5A; Supplemental Data 4). Some microglia-            such as immune response, cell cycle, metabolic, and neu-
like cells expressed typical BAM markers such as Mrc1               ronal functions when the differentially expressed genes
and Lyve1 and general signature genes for MHCII low                 were analyzed for GO term enrichment (Supplemental
BAMs, and after reclustering we again found that subclus-           Fig. S5–S7; Supplemental Data 3). Subcluster 0 showed a

8       GENES & DEVELOPMENT
Downloaded from genesdev.cshlp.org on October 14, 2021 - Published by Cold Spring Harbor Laboratory Press
A B
C D
E F
G H
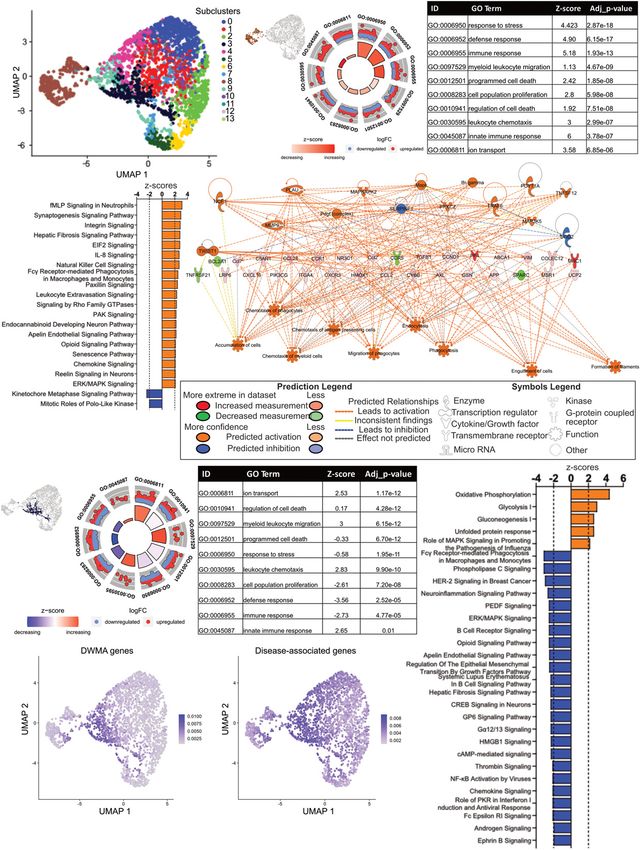
Figure 5. Microglia-like cells show different immune response regulation, but similar cell cycle enrichment, among different subclus-
ters. (A) UMAP plot representing the meningeal subclusters, with the annotation based on the aggregation analysis. (B–D) Differentially
expressed genes for subcluster 8, including GO term analysis using gProfiler (B), canonical pathway analysis (C ), and predicted upstream
regulator analysis (D) using IPA. (E,F ) The differentially expressed gene analysis of subcluster 3 for GO terms using gProfiler (E) and ca-
nonical pathway analysis using IPA (F ). (G,H) The gene expression pattern for white matter-associated genes (G) and disease-associated
genes (H) in the microglia-like population. (E,H) For the GO term analysis, the inner circle has a double function: The height of the bar
indicates the negative log10 adjusted P-value (the taller, the more significant), and the color of the bar represents the z-score. (F,I ) For the
IPA analysis, only the pathways with z-score >1.5 are shown. (DWMA) Developmental white matter-associated.
GENES & DEVELOPMENT 9Downloaded from genesdev.cshlp.org on October 14, 2021 - Published by Cold Spring Harbor Laboratory Press
Zelco et al.
reduced biological function in immune response, while bers (Supplemental Fig. S8F,G). Interestingly, we identi-
for subclusters 10, 11, and 12 immune-related processes fied an unknown fourth subset of ILCs (57 cells) that
were enriched. These results reveal the considerable het- expressed Gata3 at a low level (Supplemental Fig. S8G).
erogeneity regarding immune response, indicating that T cells (201 cells) (Supplemental Fig. S9A) were com-
some subclusters of microglia-like cells may have major posed of γδT cells (subcluster 1, 62 cells), αβT cells mainly
biological functions other than taking part in the immune expressing Cd4 and TCRβ (subcluster 0, 118 cells), and a
response, or perhaps a different rate of maturation of such small subcluster 2 with likely a mix of T cells (21 cells)
functions for meningeal microglia-like cells. Another ex- (Supplemental Fig. S9B). γδT cells showed high expression
ample of regulation of biological processes is cell cycle levels of Tcrγ-V6 and Tcrγ-C1 as well as Th-17-like fea-
regulation, and subclusters 5, 6, and 7 had increased ex- tures (Supplemental Fig. S9B), which agreed with previous
pression of cell cycle-related genes, suggesting that they findings (Ribeiro et al. 2019). We also found some prolifer-
are probably actively dividing cells and thus more imma- ating T cells, as shown by the expression of cell cycle
ture, while similar processes were decreased in subclus- genes (Supplemental Fig. S9C). To define the clonality of
ters 1 and 4, perhaps indicating that they are cells with T- and B-cell receptors, we paired gene expression with
less proliferation potential. Subcluster 9 showed an en- immune profiling analysis. We detected Tcrα and Tcrβ,
richment in metabolic processes (Supplemental Fig. but could not see any specific clone (Supplemental
S6D), similar to subcluster 3 (Fig. 5F), further confirming Fig. S9D–F) likely due to the low number of cells.
that these two subclusters have a similar biological func- In addition, we observed a population of B cells (304
tion profile as the main parenchymal microglia subcluster cells) (Supplemental Fig. S10A) with typical marker gene
4 at PND4/5 as suggested by in Hammond et al. (2019) In expression (Supplemental Fig. S10B), among which 6%
addition, subcluster 2 also showed enriched proliferative (21 cells) were identified as B1a cells using markers from
processes as seen previously for microglia in the first 2 a previous report (Tanabe and Yamashita 2018). Overall,
wk of life (Nikodemova et al. 2015), and subcluster 13 the B-cell subclusters did not align with any of the known
seems to be involved in neurogenesis and nervous system subtypes of mature B cells. Intriguingly, some B cells ex-
development. Taken together, these results demonstrate hibited high expression of Mki67 (Supplemental Fig.
the extensive heterogeneity and developmental trajecto- S10B) and seemed to be proliferating (Supplemental Fig.
ries of the different meningeal microglia-like cell popula- S10C) but lacked Aicda, which is associated with the acti-
tions during maturation. vation of mature B cells and germinal centre formation.
Others have recently presented similar data from the spi-
nal cord and brain meninges of adult mice, and they sug-
Neutrophils, ILCs, T cells, and B cells are a minor fraction
gested that the CNS may act as a lymphopoietic niche
of the resident meningeal leukocytes in neonatal mice
(Brioschi et al. 2021; Cohen et al. 2021). The fact that we
We identified neutrophils, ILCs, T cells, and B cells in the found proliferating B cells in early neonatal mouse menin-
neonatal mouse meninges, which agreed with previous ges support this notion. The presence of early developing B
findings (Albertsson et al. 2018; Nazmi et al. 2018; Zelco cells may allow for counterselection of cells that are reac-
et al. 2020). These clusters were much smaller than BAM tive against brain antigens, contribute to CNS deve-
and microglia-like cell populations and contained only a lopment, and take part in disease pathology. Immune
few hundred cells (Fig. 1A,E; Supplemental Table S2). profiling analysis showed that B cells expressed immuno-
Neutrophil populations are heterogeneous, with subdi- globulin-L (Ig-L), Ig-K, and Ig-H, but no specific pattern of
visions based on the maturation state, which is strictly Ig expression was observed. Microglia-like cells also ex-
connected to the tissue in which they are found, with im- pressed Ig-H, confirming that microglia are capable of
mature neutrophils typically found in the bone marrow, forming phagocyte complexes of IgG and Staphylococcus
while mature cells can be found in peripheral blood and aureus through Fc receptors (Supplemental Fig. S10D–G;
other tissues. These two subpopulations have been de- Quan et al. 2009).
fined as stage I and stage II of differentiation (Giladi
et al. 2018). Among others, typical genes for stage I neutro-
Neutrophils were the most affected population
phils are S100a8 and S100a9, which were found among
at 6 h after HI
the signature genes for this cluster (Fig. 1F) and were ho-
mogeneously expressed at high levels in almost the entire We next investigated whether any of the meningeal leuko-
neutrophil population (Supplemental Fig. S8A,B). Other cyte populations were affected 6 h after HI (Fig. 6B–D). The
genes for immature neutrophils, such as Lrg1 and Plscr1, neutrophil cluster was the only population to be affected
were only expressed in a portion of the cells in this cluster by HI both in terms of cell frequency—with a threefold-in-
(Supplemental Fig. S8C,D) indicating that neonatal men- crease—and in terms of gene expression (Fig. 6C,D; Sup-
ingeal neutrophils share both similarities and differences plemental Data 5). Immunohistochemical staining of
with peripheral immature neutrophils. neutrophils using lymphocyte antigen 6 complex locus
To analyze T cells and ILCs, we defined T cells as G6D (Ly6g) confirmed an increase in neutrophil density
CD3e + and ILCs as CD3e − (Supplemental Fig. S8E). The in the meninges 6 h after HI compared with naïve menin-
ILC population was mainly composed of ILC2 (Gata3 hi, ges, which was confirmed to be a neutrophil marker
84 cells) and ILC3 (Rorc hi, 74 cells) subtypes, while as it was coexpressed with myeloperoxidase (MPO), a
ILC1s (Tbx21 hi, 25 cells) were only present in small num- classic neutrophil marker (Fig. 6E–G). Among the top 20
10 GENES & DEVELOPMENTDownloaded from genesdev.cshlp.org on October 14, 2021 - Published by Cold Spring Harbor Laboratory Press
Neonatal mouse meningeal leukocyte heterogeneity
A B C D
E F G
H I
J K L
Figure 6. Neutrophils are increased at 6 h after HI. (A–C ) The cell frequency changes in each cluster of cells between naïve and HI an-
imals, shown as UMAP representing all clusters (A), in HI or naïve samples (B), and as a stacked bar chart (C ). (D) Representation of HI and
naïve neutrophils. (E,F ) Immunohistochemistry staining of Ly6g+ neutrophils (scale bar, 100 µm; E), and the density of Ly6g+ neutrophils
in meninges of naïve and HI mice (F). (G) Immunofluorescent double staining shows Ly6g+MPO+ neutrophils in the mouse meninges.
Scale bar, 50 µm. (H) Volcano plot presenting differentially expressed genes between HI versus naïve mice. Genes in the gray area have
fold change >1.5 and P < 0.05. (I ) GO term analysis using gProfiler. The inner circle has a double function: The height of the bar indicates
the negative log10 adjusted P-value (the taller, the more significant), and the color of the bar represents the z-score. (J,K) IPA of canonical
pathways (J) and predicted upstream regulator analysis (K ). (L) Seurat cell cycle analysis for the neutrophil cluster. (IP) Ipsilateral. (∗ ) P <
0.05 (unpaired t-test).
GENES & DEVELOPMENT 11Downloaded from genesdev.cshlp.org on October 14, 2021 - Published by Cold Spring Harbor Laboratory Press
Zelco et al.
significantly up-regulated genes (Fig. 6H; Supplemental blood cells and engulfment of phagocytoses, while axon
Table S10) we found Tspo, which is involved in neutro- genesis, cell outgrowth, growth of neurites, and prolifera-
phil inflammatory response (Kupa et al. 2017). Fur- tion of neuronal cells were all down-regulated. Several reg-
thermore, we identified Lrg1 and Plscr1, genes with ulators were predicted to trigger the up-regulation and
essential roles in neutrophil maturation, inflammatory down-regulation of many genes, therefore increasing im-
responses, and granulocyte expansion (Frasch et al. mune response, binding, and activation of leukocytes
2004; Chen et al. 2011; Druhan et al. 2017). The in- and phagocytes (Supplemental Fig. S11E). Among the reg-
creased neutrophil frequency could thus be explained ulators, we identified Arg1, which is predicted to lead to
by the up-regulation of Plscr1 after HI. Further analysis the down-regulation of processes like neuritogenesis,
revealed enriched biological processes such as increased sprouting, and branching of cells through Igf1 and other
cellular response to chemical stimulus and response to genes (Supplemental Fig. S11F).
cytokines (Fig. 6I; Supplemental Data 3). IPA confirmed The uniform manifold approximation and projection
these results with a positive z-score for the Stat3 path- (UMAP) plot indicated differences between HI and naïve
way (Fig. 6J), which is involved in emergency granulopoi- BAMs (Fig. 7A). Therefore, we performed a detailed analy-
esis and triggers increased numbers of neutrophils by sis of the differences between HI and naïve BAM subclus-
release from the bone marrow. Cxcr4 and phospholipase ters (Fig. 7B,C). Indeed, the frequency analysis for all 8
C signaling were down-regulated after HI (Fig. 6J). Csf2 subclusters of BAMs showed increased frequencies of sub-
was also predicted to be one of the upstream regulators, clusters 2 and 4 and decreased frequencies of subclusters
directly and indirectly affecting the expression of some of 1, 5, 6, and 7 after HI, though many comparisons resulted
the top 20 genes, for example, through Stat3 and Cebpb in low numbers of either differentially expressed genes
(Fig. 6K). These results indicate that the increased neu- (Supplemental Data 5) or cells (subcluster 6) (Fig. 7D).
trophil frequency at this time point after HI might be Gene marker analyses showed that the BAM subclusters
due to increased cell division and not to infiltration of that were decreased after HI (1, 5, 6, and 7) were character-
these cells from the blood. ized by the expression of genes involved in neuronal devel-
To further confirm these results, we analyzed genes in- opment and cell migration, while immune response-
volved in the cell cycle. We scored the neutrophils based related processes were diminished (Fig. 7E; Supplemental
on cell cycle marker genes and classified them in terms Figs. S12, S13; Supplemental Data 3, 6), indicating their
of cell cycle phase as S, G1, or G2M (Fig. 6L). Most neutro- possible role in CNS development rather than in immune
phils were in G1 phase, where the cell synthesizes mRNA response. The HI insult disrupts mitochondrial respira-
and proteins in preparation for mitosis. Of note, the major- tion and can lead to impaired brain development (Gopa-
ity of the neutrophils in G1 were those belonging to HI gondanahalli et al. 2016), thus making it plausible that
samples, implying that the insult stimulated neutrophil these BAM subclusters, especially subcluster 6, are more
division and growth at 6 h after HI. vulnerable and easily affected by the HI insult. Together
In summary, at this early time HI triggers a signaling this may indicate that HI insult affects the immature
cascade that induces neutrophil expansion as part of the brain not only by directly causing neuronal cell death,
inflammatory process in response to tissue injury in the but also by impacting on brain development indirectly
brain parenchyma, potentially through mechanisms by influencing the activity of meningeal BAMs in metab-
such as emergency granulopoiesis. olism, cell proliferation, and neuron development. In con-
trast, BAM subclusters 2 and 4, which were increased the
most after HI, were strongly enriched in immune-related
BAMs and monocytes showed changes at 6 h after HI
biological processes, with subcluster 2 also showing en-
We next analyzed the BAM and monocyte response to HI. richment of cell death-related and migration-related
These populations showed differences in gene expression processes (Fig. 7E; Supplemental Figs. S12, S13; Supple-
without significant differences in cell frequency between mental Data 3).
HI and naïve samples (Supplemental Fig. S11A). A total Next, we focused on BAM subcluster 2 because this was
of 1820 differentially expressed genes were found in the subcluster most affected by HI (Fig. 7D). A total of 437
BAMs after HI, with 13 of them having a fold change differentially expressed genes were found between HI and
>1.5 (Supplemental Fig. S11B; Supplemental Table S11; naïve mice (Fig. 7F; Supplemental Table S12). GO term en-
Supplemental Data 5). The GO analysis showed down-reg- richment highlighted down-regulation of immune-related
ulation of cellular localization and up-regulation of cellu- processes in HI compared with naïve mice (Fig. 7G; Supple-
lar metabolic processes (Supplemental Fig. S11C; mental Data 3), which was confirmed by IPA (Fig. 7H,I).
Supplemental Data 3). IPA revealed up-regulation of There was also an increase in metabolic pathways similar
RhoGD1 signaling, glycolysis, and PTEN signaling and to what was seen in the total population of BAMs. Regula-
down-regulation of pathways involved in actin cytoskele- tors such as Pf4, a typical BAM gene important for chemo-
ton, IL-8 signaling, and phospholipase C signaling (Supple- attraction and cell adhesion, were predicted to down-
mental Fig. S11D). PTEN signaling mediates cellular regulate functions such as development of the hematopoi-
responses in developing neurons, and its inhibition has etic system, which is important for the immune response
been shown to be protective in cultured rat neurons under after preterm brain injury (Fig. 7I). All together, these re-
oxygen–glucose deprivation (Zhao et al. 2013). The regula- sults suggest that meningeal BAMs might contribute to
tor effect analysis suggested up-regulation of adhesion of the immune response after HI as well as the HI-
12 GENES & DEVELOPMENTDownloaded from genesdev.cshlp.org on October 14, 2021 - Published by Cold Spring Harbor Laboratory Press
Neonatal mouse meningeal leukocyte heterogeneity
A B C D
E F
G
H
I
Figure 7. BAM subcluster 2 is the most affected after HI, with down-regulation of immune response-related processes at 6 h after HI. (A)
UMAP plot showing the BAM population colored as cells from HI or naïve mice. (B–D) BAMs subclusters (B) showing as cells from naïve or
HI mice as a UMAP plot (C) or a frequency stacked bar chart (D). (E) Heat map showing the signature gene expression for each BAM sub-
cluster from B). (F,G) Differentially expressed gene analysis comparing BAM subcluster 2 in HI and naïve mice as a volcano plot (gray quad-
rant; P < 0.05 and fold change >1.5; F ), and GO term analysis (G). (H,I) IPA for canonical pathways (H) and regulators (I ) in HI versus naïve
BAMs. (G) For the GO term analysis, the inner circle has a double function: The height of the bar indicates the negative log10 adjusted P-
value (the taller, the more significant), and the color of the bar represents the z-score. (H) For the IPA canonical pathways analysis, only the
pathways with z-score > 1.5 are shown.
GENES & DEVELOPMENT 13Downloaded from genesdev.cshlp.org on October 14, 2021 - Published by Cold Spring Harbor Laboratory Press
Zelco et al.
triggered disturbances in neuronal development in the be used to identify meningeal BAMs in neonatal mice,
parenchyma. in agreement with previous reports at other developmen-
Monocyte numbers did not differ between HI and naïve tal stages (Mrdjen et al. 2018; Van Hove et al. 2019; Utz
mice (Supplemental Fig. S11G). There were 1720 differen- et al. 2020).
tially expressed genes between the two conditions, with The current study is the first to establish the develop-
16 of them having a fold change >1.5 (Supplemental Fig. mental differences between neonatal and adult meningeal
S11H; Supplemental Table S13; Supplemental Data 5). BAMs. We found increased expression of cytoskeleton-as-
Further analysis showed biological processes involved in sociated genes in neonatal BAMs compared with menin-
metabolic functions and down-regulation of immune sys- geal BAMs in adult mice, similar to what was found in
tem processes in general (Supplemental Fig. S11I; Supple- neonatal peritoneal macrophages (Winterberg et al.
mental Data 3). Interestingly, IPA instead showed specific 2015). Basic macrophage functions, like phagocytosis,
immune pathways to be activated, such as the Th17 path- are already present at the neonatal stage (Speer et al.
way (Supplemental Fig. S11J). Ccr2 and Il-5 were predicted 1988), but compared with adults neonatal BAMs had re-
to trigger the increased expression of S100a8 and Soc3, duced expression of genes related to antigen-presenting
which were among the top up-regulated genes (Supple- cell response and recruitment of cells as also shown in
mental Fig. S11K). the current study. This suggests that although some pri-
To summarize, neonatal meningeal BAMs and mono- mary functions are already present at this early stage of
cytes reacted to HI at this early stage and induced an in- life, neonatal BAMs are functionally immature and possi-
flammatory gene response, and BAMs also trigged the bly unable to generate a full immune response.
down-regulation of functions connected to the prolifera- Sall1 was used to specifically identify microglia because
tion and growth of neurons. it is not expressed by meningeal BAMs, and here we show
Regarding the other clusters, microglia-like cells did not that Sall1 expression was indeed predominant in the new-
show any obvious differences between HI and naïve mice ly identified meningeal microglia-like cell cluster at this
at the global level or for subclusters. However, we detect- developmental age. In total, our aggregation analysis of pa-
ed significant gene expression differences when analyzing renchymal microglia identified 14 subclusters of micro-
the microglial white matter and disease-associated genes glia, with subcluster 8 being a BAM-like subcluster and
(Supplemental Fig. S14). The T-cell, ILC, and B-cell popu- subcluster 3 representing the major age-identical paren-
lations were not affected by HI at this time point (Supple- chymal microglial subpopulation (Hammond et al.
mental Data 5). 2019). Analysis of differential gene expression between
meningeal and parenchymal subcluster 8 highlighted an
increase in mitochondrial and immune-related function,
Discussion indicating that this meningeal subpopulation might
quickly respond to insults. Further analyses showed that
In the current study, we have for the first time character- meningeal subcluster 8 also had high expression of genes
ized the meningeal leukocyte landscape at the single-cell such as Pf4, Dab2, and Fcna. Although Pf4 and Dab2 have
level in PND4 neonatal mice, established the develop- been reported in embryonic microglia, all three genes
mental differences between neonatal and adult meningeal were also found to be expressed in BAMs instead of micro-
BAMs, and analyzed in detail the meninges to show the glia (Van Hove et al. 2019; Utz et al. 2020), with Fcna being
early leukocyte response after neonatal HI. a specific marker for MHCII low BAMs (Van Hove et al.
We found that the majority of meningeal immune cells 2019). Indeed, we also observed low expression of MHCII
were BAMs, microglia-like cells, and monocytes, whereas genes in part of the microglia-like cell cluster, and these
other cell populations, such as neutrophils, T cells, B cells, overlapped with Mrc1 and Lyve1 in microglia-like cells.
and ILCs, were present in smaller numbers. This is in These findings indicate a possible new subtype of menin-
agreement with previous studies in which all observed geal myeloid cells that have characteristics of both micro-
cell populations were described in the meninges of mouse glia and BAMs and that express both the microglia-
embryos (Tanabe and Yamashita 2018; Utz et al. 2020), specific marker Sall1, as has been described in the choroid
neonatal mouse pups (Albertsson et al. 2018; Nazmi plexus (Van Hove et al. 2019), and BAM markers. It is un-
et al. 2018; Tanabe and Yamashita 2018; Zelco et al. likely that these cells with mixed phenotypes represent a
2020), and adult mice (Gadani et al. 2017; Mrdjen et al. transitional or developmental stage between the micro-
2018; Van Hove et al. 2019). BAMs are newly defined mac- glia and macrophages because the parenchymal microglia
rophages found in the meninges, choroid plexus, and peri- and BAMs separate early in development and can be iden-
vascular spaces of brain vessels, and only a few studies tified as two individual lineages in terms of transcription,
have characterized the meningeal BAM populations at dif- phenotype, location, and cytokine requirement (Utz et al.
ferent developmental ages (Mrdjen et al. 2018; Van Hove 2020).
et al. 2019; Utz et al. 2020). One of the challenges of study- Compared with all other meningeal subpopulations,
ing BAMs is that they share gene expression with micro- microglia-like cell subcluster 3 and 9 expressed higher lev-
glia and brain macrophages and, to a lesser extent, with els of Spp1, Lgals3, Gpnmb, and Igf1, which are markers
monocytes, as corroborated by the trajectory analyses in for the major parenchymal microglia subpopulation at
the current study. However, we confirmed that a combi- PND4/5 (Hammond et al. 2019). These Spp1-enriched
nation of markers for immunofluorescence staining can microglia mainly appear transiently in the developing
14 GENES & DEVELOPMENTDownloaded from genesdev.cshlp.org on October 14, 2021 - Published by Cold Spring Harbor Laboratory Press
Neonatal mouse meningeal leukocyte heterogeneity
white matter in early postnatal age (PND4–7) and consti- ported major differences between the HI and naïve mice
tute the major parenchymal microglial population at are robust and unlikely to be due to these experimental
PND4/5 but are barely found at any other developmental procedures.
ages (Hammond et al. 2019; Li et al. 2019). The fact that In conclusion, our findings suggest a prominent role for
this microglia-like cell subpopulation was found in the neonatal mouse meningeal leukocytes in physiological
meninges at an early postnatal age might suggest again processes and after preterm brain injury. The resident
that meningeal immune cells participate in brain develop- meningeal leukocytes are highly heterogeneous and tis-
ment. Indeed, factors such as retinoic acid released from sue-specific, and neonatal BAMs share similarities but
the meninges can influence cortical neuronal develop- also feature pronounced differences compared with their
ment (Siegenthaler et al. 2009), and a cascade of morpho- adult counterparts in terms of phenotype and function.
genic signals initiated by the meninges regulates corpus Strikingly, we identified a distinct meningeal cell popula-
callosum development (Choe et al. 2012). Also, B1a cells, tion clearly expressing the molecular signature of micro-
a subtype of B cells resident in the meninges, are involved glia but different from the parenchymal microglia.
in oligodendrocyte development through IgM–Fcα/μ R sig- These meningeal microglia-like cells may participate in
naling (Tanabe and Yamashita 2018). Further research is brain development and help maintain CNS homeostasis.
needed to determine whether Spp1-menigeal microglia- Furthermore, we highlighted the meninges as an impor-
like cells have a role in white matter development. tant site of immune cell expansion and reactivity as part
Six hours is generally considered to be the limit of the of the early immune response in the brain after injury. Fi-
therapeutic window after HI because this is when the ini- nally, the meningeal leukocytes may take part in normal
tial injury, caused mainly by the accumulation of reactive CNS development, and once affected by an insult they
oxygen species due to mitochondrial failure, becomes irre- may interrupt normal neuronal and axonal development.
versible and leads to neuronal death. Previously, we found Altogether, the present study provides novel insights into
that γδT cells and ILC2s are increased in the meninges and CNS physiology and offers an essential resource for com-
in the brain parenchyma at 6 h after HI in a preterm brain parative analyses and data exploration that facilitates a
injury mouse model (Albertsson et al. 2018; Zelco et al. deeper understanding of the functional role of the menin-
2020). In the current study, we found that most of the ges in brain development, health, and disease.
meningeal immune cell populations were not affected.
Neutrophils were the main subpopulation to be affected
by HI at 6 h, with both increased numbers and altered Materials and methods
gene expression profiles. Neutrophils are the main leuko-
cyte subtype present in the first week after birth in mice, Experimental animals
and they are early responders (within 6 h) after insult in C57/Bl6J (Charles River) mice were used for all experiments and
multiple animal models of brain injury, including in neo- were bred at the Experimental Biomedicine animal facility of the
nates. Emergency granulopoiesis is a phenomenon that University of Gothenburg. The animal room has a 12-h light–dark
causes the release of immature neutrophils from the cycle, and the mice had free access to chow (B&K) and water. All
bone marrow in order to respond to pathogens or to tissue experiments were approved by the Regional Animal Ethical Com-
damage. Cebpb, one of the upstream factors identified in mittee of Gothenburg (58/2016 and 2042/18).
the IPA, is essential for initiating emergency granulopoie-
sis by cell cycle acceleration through c-Myc (Hirai et al.
2006). The switch between regular and emergency granu- Single-cell RNA sequencing sample preparation and analysis
lopoiesis is mediated mainly through the Stat3 pathway The 10X Genomics chromium single-cell 5′ library and gel bead
(Panopoulos et al. 2006), which was identified in the IPA kit was used for high-throughput automated barcoding and li-
of canonical pathways. This is further supported by the brary construction following the manufacturer’s instructions
down-regulation of the Cxcr4 pathway and the increase (four runs, version 1, PN-1000014). The immune profiling V(D)J
in cell growth observed in cell cycle analysis. Cxcr4 has libraries were constructed using a single-cell 5′ library and gel
been shown to be involved in the retention of neutrophils gead kit and single-cell V(D)J enrichment kit (mouse T cells and
B cells). After cDNA library preparation, the samples were ana-
either in bone marrow or at the site of injury (Yamada
lyzed on a NextSeq 500/550 and MiSeq (Illumina) at the Clinical
et al. 2011; De Filippo and Rankin 2018), and increased
Genomics Gothenburg, SciLife Laboratories. Detailed methods
Csf2 expression results in a reduction of Cxcr4, similar and analysis are in the Supplemental Material. The data were
to what we observed. Increased Csf2 and decreased deposited in the Gene Expression Omnibus (GEO) database under
Cxcr4 might indicate that neutrophils that are normally accession number GSE173769.
retained in the meninges expand by emergency granulo-
poiesis after HI and are mobilized to initiate the inflam-
matory response cascade. Immunofluorescent and immunohistochemical staining
Notably, in the current study sham controls were not
After transcardiac saline perfusion, the meninges of PND4 mice
included because previous studies showed no differences were peeled off from the brain, each hemisphere separately, and
between sham and naïve controls (McRae et al. 1995). positioned on a glass slide. The staining was performed as de-
We cannot exclude the possibility that the anesthesia scribed (Zelco et al. 2020) in the Supplemental Material.
and the manipulation of the carotid artery may indeed See the Supplemental Material for additional Materials and
cause subtle changes at the gene level; however, the re- Methods.
GENES & DEVELOPMENT 15You can also read