Y-Box Binding Protein-1 Promotes Epithelial-Mesenchymal Transition in Sorafenib-Resistant Hepatocellular Carcinoma Cells - MDPI
←
→
Page content transcription
If your browser does not render page correctly, please read the page content below
International Journal of
                Molecular Sciences

Article
Y-Box Binding Protein-1 Promotes Epithelial-Mesenchymal
Transition in Sorafenib-Resistant Hepatocellular Carcinoma Cells
Li-Zhu Liao, Chih-Ta Chen, Nien-Chen Li, Liang-Chun Lin                                  , Bo-Shih Huang, Ya-Hui Chang and Lu-Ping Chow *

                                                Graduate Institute of Biochemistry and Molecular Biology, College of Medicine, National Taiwan University,
                                                Taipei 100233, Taiwan; d99442006@ntu.edu.tw (L.-Z.L.); d02442004@ntu.edu.tw (C.-T.C.);
                                                nien14lee14@gmail.com (N.-C.L.); koala30135@gmail.com (L.-C.L.); a0938548239@gmail.com (B.-S.H.);
                                                yahuichang@ntu.edu.tw (Y.-H.C.)
                                                * Correspondence: chowip@ntu.edu.tw; Tel.: +886-2-23123456 (ext. 88214); Fax: +886-2-23958814

                                                Abstract: Hepatocellular carcinoma is one of the most common cancer types worldwide. In cases
                                                of advanced-stage disease, sorafenib is considered the treatment of choice. However, resistance to
                                                sorafenib remains a major obstacle for effective clinical application. Based on integrated phospho-
                                                proteomic and The Cancer Genome Atlas (TCGA) data, we identified a transcription factor, Y-box
                                                binding protein-1 (YB-1), with elevated phosphorylation of Ser102 in sorafenib-resistant HuH-7R
                                                cells. Phosphoinositide-3-kinase (PI3K) and protein kinase B (AKT) were activated by sorafenib,
                                                which, in turn, increased the phosphorylation level of YB-1. In functional analyses, knockdown
                                                of YB-1 led to decreased cell migration and invasion in vitro. At the molecular level, inhibition
                                                of YB-1 induced suppression of zinc-finger protein SNAI1 (Snail), twist-related protein 1 (Twist1),
                                                zinc-finger E-box-binding homeobox 1 (Zeb1), matrix metalloproteinase-2 (MMP-2) and vimentin
                                                levels, implying a role of YB-1 in the epithelial-mesenchymal transition (EMT) process in HuH-7R
                                                cells. Additionally, YB-1 contributes to morphological alterations resulting from F-actin rearrange-
                                      ment through Cdc42 activation. Mutation analyses revealed that phosphorylation at S102 affects

                                                the migratory and invasive potential of HuH-7R cells. Our collective findings suggest that sorafenib
Citation: Liao, L.-Z.; Chen, C.-T.; Li,         promotes YB-1 phosphorylation through effect from the EGFR/PI3K/AKT pathway, leading to
N.-C.; Lin, L.-C.; Huang, B.-S.; Chang,         significant enhancement of hepatocellular carcinoma (HCC) cell metastasis. Elucidation of the spe-
Y.-H.; Chow, L.-P. Y-Box Binding                cific mechanisms of action of YB-1 may aid in the development of effective strategies to suppress
Protein-1 Promotes
                                                metastasis and overcome resistance.
Epithelial-Mesenchymal Transition in
Sorafenib-Resistant Hepatocellular
                                                Keywords: hepatocellular carcinoma cell; drug resistance; sorafenib; YB-1; S102 phosphorylation;
Carcinoma Cells. Int. J. Mol. Sci. 2021,
                                                epithelial-mesenchymal transition
22, 224. https://dx.doi.org/
10.3390/ijms22010224

Received: 16 October 2020
Accepted: 24 December 2020                      1. Introduction
Published: 28 December 2020                          Hepatocellular carcinoma (HCC) is the most common primary liver malignancy
                                                worldwide. The incidence rate of HCC has increased over the year, resulting in 300,000 to
Publisher’s Note: MDPI stays neu-               800,000 deaths annually [1,2]. Currently, ~40–50% patients are diagnosed at early stages
tral with regard to jurisdictional claims       and considered suitable for curative treatment, while systemic therapy is required for
in published maps and institutional             almost half of all patients with advanced-stage tumors. However, limited progress has
affiliations.                                   been made in improving the efficacy of systemic therapy for advanced HCC [3,4].
                                                     Sorafenib (Nexavar), a multikinase inhibitor, has been identified as a potent small-
                                                molecule inhibitor of Raf kinase, vascular endothelial growth factor receptor, platelet-
Copyright: © 2020 by the authors. Li-
                                                derived growth factor receptor, Kit receptor tyrosine kinase and Fms-like tyrosine kinase 3,
censee MDPI, Basel, Switzerland. This           and it is approved for the treatment of advanced HCC by the Food and Drug Admin-
article is an open access article distributed   istration. In the pivotal Sorafenib Hepatocellular Carcinoma Assessment Randomized
under the terms and conditions of the           Protocol (SHARP) study and the subsequent Asia-Pacific studies, sorafenib improved the
Creative Commons Attribution (CC BY)            median overall survival (OS) by 2–3 months in patients with advanced HCC relative to
license (https://creativecommons.org/           placebo control [5]. Despite this improvement in survival, the efficacy of sorafenib for HCC
licenses/by/4.0/).                              is modest, with an objective tumor response rate as low as 2–3% [6]. Furthermore, the

Int. J. Mol. Sci. 2021, 22, 224. https://dx.doi.org/10.3390/ijms22010224                                              https://www.mdpi.com/journal/ijms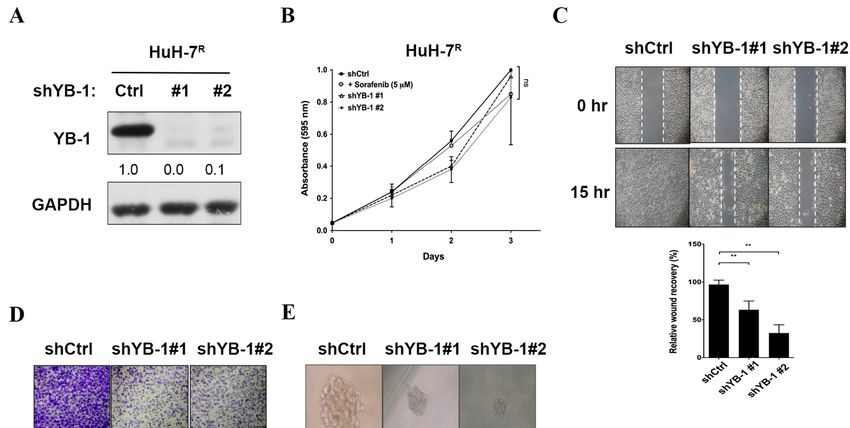
Int. J. Mol. Sci. 2021, 22, 224                                                                                           2 of 20

                                  majority of patients with HCC eventually develop progressive disease following sorafenib
                                  treatment, which presents a major obstacle to successful outcomes. Identification of the
                                  critical downstream signaling molecules involved in resistance mechanisms in tumor cells
                                  is therefore critical to develop viable options for cancer therapy.
                                        Previous studies suggest that acquired resistance results from factors that develop
                                  during sorafenib treatment. Several potential mechanisms of sorafenib resistance have been
                                  proposed to date, including epidermal growth factor receptor (EGFR) activation, c-Jun acti-
                                  vation, autophagy, protein kinase B (AKT) activation, hypoxic environment, dysregulation
                                  of apoptosis, cancer stem cell renewal and epithelial-mesenchymal transition (EMT) [7].
                                  EGFR, AKT and extracellular signal-regulated kinase (ERK) activities have been implicated
                                  in both inherent and acquired resistance to sorafenib. For example, elevated EGFR activity
                                  is reported to affect the efficacy of sorafenib [8]. Other studies have demonstrated that the
                                  phosphoinositide-3-kinase (PI3K)/AKT pathway is critical for induction of resistance to
                                  sorafenib and impairment of AKT activity contributes to increased sensitivity to sorafenib
                                  of HCC cells [9]. Downregulation of p-ERK is additionally associated with sorafenib
                                  resistance of HCC [10,11]. Enhanced metastasis of HCC cells with acquired sorafenib
                                  resistance has been documented [12]. Furthermore, a number of studies suggest that EMT
                                  is involved in shorter disease-free survival as well as chemoresistance in HCC [13,14]. EMT
                                  is critically involved in invasion and metastasis, acquisition and maintenance of stem cell
                                  characteristics, resistance to cell death and aging, escape from immune monitoring, and
                                  drug resistance of tumor cells [15]. Given the limited availability of promising therapies
                                  for progressive HCC, clarification of the downstream signaling pathways related to EMT
                                  may be useful to identify significant molecules for therapeutic exploitation.
                                        Previously, we employed a quantitative phosphoproteomic approach to delineate the
                                  mechanisms underlying acquired resistance of HCC to sorafenib [16]. By integrating data
                                  on significantly upregulated phosphoproteins with genes implicated in poor prognosis
                                  in patients with liver cancer from the TCGA database and subjecting the intersecting 148
                                  differentially expressed molecules to biological network analysis, Y-box binding protein-1
                                  (YB-1) was identified as a potential regulatory molecule of this dysregulated downstream
                                  network in sorafenib-resistant cells. YB-1 is a multifunctional protein that regulates gene
                                  expression at different levels and is reported to activate several genes associated with
                                  cancer development and progression. Overexpression of YB-1 in multiple cancers is closely
                                  correlated with unfavorable patient prognosis. Accumulating clinical evidences suggests
                                  that patients with elevated YB-1 expression are at high risk of relapse and metastasis [17].
                                  The clinical relevance of YB-1 as a gene expression regulator in cancer progression is well
                                  documented. Moreover, nuclear localization of YB-1 is associated with drug resistance
                                  in cancer. Inhibition of YB-1 expression has been shown to increase the sensitivity of
                                  cancer cells to chemotherapy [17,18]. In view of its significant association with tumor
                                  progression, invasion, metastasis, and resistance to chemotherapeutic drugs, YB-1 may
                                  serve as a biomarkers for cancer progression. Notably, phosphorylation of YB-1 at serine
                                  102 appears necessary for its gene expression regulation activities [18].
                                        In this study, we focused on the molecular mechanisms of action of YB-1 in HCC devel-
                                  opment and its potential association with sorafenib resistance. The functional significance
                                  of YB-1 phosphorylation in tumor malignancy was further investigated.

                                  2. Results
                                  2.1. Overexpression of YB-1 in HuH-7R Cells Is Associated with Poor Prognosis of Liver Cancer
                                        We performed quantitative phosphoproteomic analyses to analyze phosphoproteins in
                                  HuH-7 and HuH-7R cells. The proteins showing >1.5-fold changes (including 533 phospho-
                                  proteins) were classified as significantly increased in phosphorylation in resistant HuH-7R
                                  cells [16]. To obtain potential candidate genes correlated with poor OS of HCC patients, a
                                  total of 1056 genes were identified from the TCGA database (p < 0.001). Upon combining
                                  the two datasets, we observed overlap of 148 differentially expressed molecules, which
                                  were further subjected to gene ontology (GO) analyses using database for annotation,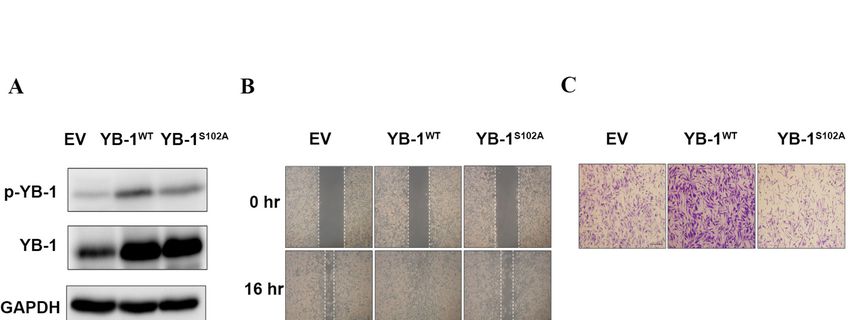
Int. J. Mol. Sci. 2021, 22, 224                                                                                           3 of 20

                                  visualization, and integrated discovery (DAVID) (Figure 1A). Functional enrichment anal-
                                  ysis revealed the top three significant functions (p < 0.05) of the differentially expressed
                                  molecules as cytoskeleton (n = 40, p < 0.001), cell–cell adhesion (n = 12, p < 0.001) and
                                  microtubule-based movement (n = 7, p < 0.001) (Figure S1). This finding supports the in-
                                  volvement of the differentially expressed molecules in regulation of cytoskeletal structures
                                  and the implication of effects of these molecules on cell migration or invasion. Subse-
                                  quently, the differentially expressed molecules were clustered through Protein-protein
                                  interaction (PPI) network construction using STRING. A total of 47 molecules with com-
                                  bination scores ≥ 0.95 were enrolled for PPI network construction. Twenty genes with
                                  roles in cellular movement-related functions were identified in the center cluster of the PPI
                                  network, and 27 other differentially expressed molecules were determined as potential
                                  regulatory genes of those in the center cluster (Figure S2). To further identify significant
                                  regulatory factors among the 27 differentially expressed molecules, functional enrichment
                                  analysis was performed with GO using DAVID. The top enriched biological process was
                                  gene expression (n = 11, p < 0.001) (Supplemental Table S3). Among the 11 differentially
                                  expressed molecules with potential roles in gene expression, transcription was the top
                                  enriched function (n = 3, p value = 0.11) (Supplemental Table S4), including YB-1, pituitary
                                  tumor transforming gene 1 (PTTG1), and proliferation-associated protein 2G4 (PA2G4).
                                  YB-1 has previously been identified as a metastasis-related molecule [19]. Accordingly, we
                                  focused on YB-1 as a potential gene expression regulatory molecule with cellular movement-
                                  related functions in drug-resistant HCC. High protein expression and the phosphorylation
                                  at Ser102 of YB-1 in HuH-7R cells were validated via immunoblotting (Figure 1B). Com-
                                  pared to HCC patients with low YB-1 expression, those expressing high levels of YB-1 had
                                  significantly shorter median OS (3.9 vs. 6.9 years, p < 0.001), as determine from analysis
                                  of the TCGA dataset (total sample size, n = 343) (Figure 1C). Our data suggest that high
                                  YB-1 expression is associated with poor OS and may be linked to malignant progression of
                                  HCC. Accordingly, we further investigated the role of YB-1 and its potential correlation
                                  with sorafenib resistance in HuH-7R cells.

                                  2.2. YB-1 Phosphorylation Is Regulated by Different Signaling Pathways Induced by Sorafenib in
                                  HuH-7 Cells and HuH-7R Cells
                                        Data from our bioinformatic analyses suggest that YB-1 phosphorylation is involved
                                  in facilitating the sorafenib resistance in HuH-7R cells. To characterize the different mecha-
                                  nistic responses of parental HuH-7 and HuH-7R cells to sorafenib treatment, we utilized
                                  several inhibitors for the mitogen-activated protein kinase (MAPK) signaling pathway
                                  (sorafenib, U0126 and BI-D1870) and EGFR/PI3K/AKT signaling pathway (AG1478 and
                                  LY294002). As shown in Figure 2A, upon treatment of HuH-7 cells with sorafenib, phospho-
                                  rylation levels of ERK1/2 and YB-1 were decreased in a dose-dependent manner, while the
                                  phosphorylation level of Akt was not altered (Figure S3A). Inhibition of ERK1/2 and 90 kDa
                                  ribosomal protein s6 kinase (RSK) phosphorylation with U0126 (a MEK inhibitor) addition-
                                  ally induced a significant decrease in p-YB-1 level in HuH-7 cells. Phosphorylation levels of
                                  RSK and YB-1 were decreased following BI-D1870 treatment in a dose-dependent manner
                                  while no changes in the p-ERK1/2 level were observed. Our data clearly suggest that the
                                  MAPK pathway is involved in sorafenib-mediated p-YB-1 downregulation in HuH-7 cells.
                                  Interestingly, however, we observed a dose-dependent increase in both the phosphorylation
                                  of AKT and YB-1 following sorafenib treatment in HuH-7R cells (Figure 2B), even though
                                  p-ERK was inhibited at the higher dose (Figure S3B). The effects of AG1478, LY294002
                                  and the combination of sorafenib and LY294002 on the phosphorylation status of AKT
                                  and YB-1 in HuH-7R cells were further evaluated. Notably, inhibition of PI3K and AKT
                                  phosphorylation with AG1478 or LY294002 treatment led to a significant decrease in YB-1
                                  phosphorylation in HuH-7R cells. In addition, the combination of sorafenib and LY294002
                                  also significantly inhibited in phosphorylation of YB-1 in HuH-7R cells (Figure 2B). Our
                                  findings suggest that sorafenib reduces YB-1 phosphorylation through inhibiting the MAPK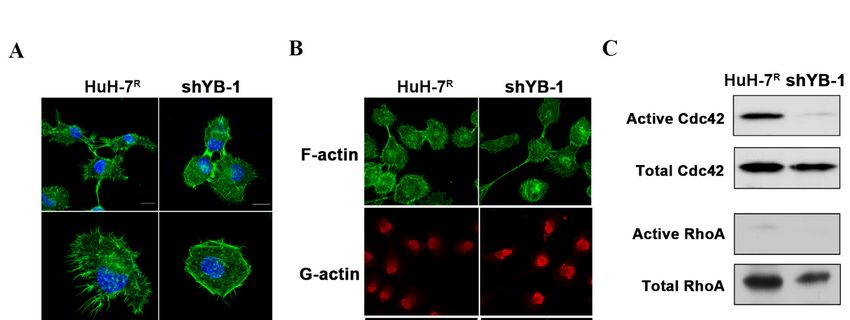
Int. J. Mol. Sci. 2021, 22, 224                                                                                                                 4 of 20

                                           pathway
                   Int. J. Mol. Sci. 2021, 22,        in HuH-7
                                               x FOR PEER      cells and conversely enhances YB-1 phosphorylation through activating
                                                          REVIEW
                                       the PI3K/AKT pathway in HuH-7R cells.

                         Figure 1. Bioinformatic     identificationidentification
                                        Figure 1. Bioinformatic      and validationandofvalidation
                                                                                         Y-box binding    protein-1
                                                                                                   of Y-box   binding(YB-1)   as a (YB-1)
                                                                                                                        protein-1  potential
                                                                                                                                          as abiomarker
                                                                                                                                               potential in HuH-
                         7R cells. (A) Strategy
                                        biomarkerforinidentification
                                                        HuH-7R cells.of(A)
                                                                         sorafenib
                                                                            Strategyresistance-related
                                                                                     for identification differentially   expressed molecules
                                                                                                        of sorafenib resistance-related          in hepatocellular
                                                                                                                                          differentially
                         carcinoma (HCC).     (B)  Phosphorylation     levels of YB-1  and  total YB-1  expression   in  HuH-7   and  HuH-7
                                        expressed molecules in hepatocellular carcinoma (HCC). (B) Phosphorylation levels of YB-1 and total
                                                                                                                                              R cells validated by

                         immunoblotting, upper panel. Relative changes of the           expression levels were quantified using GAPDH as normalization
                                       YB-1 expression in HuH-7 and HuH-7R cells validated by immunoblotting, upper panel. Relative
                         control, lower panel. (* p < 0.05; ** p < 0.01). (C) Kaplan-Meir OS curves of the YB-1 gene among 343 HCC patients in the
                                        changes of the expression levels were quantified using GAPDH as normalization control, lower panel.
                         TCGA dataset. The p value was calculated with the log-rank test (*** p < 0.001).
                                       (* p < 0.05; ** p < 0.01). (C) Kaplan-Meir OS curves of the YB-1 gene among 343 HCC patients in the
                                       TCGA dataset.2.2.       p value
                                                         TheYB-1        was calculated Is
                                                                     Phosphorylation     with the log-rank
                                                                                           Regulated                   p < 0.001). Pathways Induced by Sorafe
                                                                                                             test (*** Signaling
                                                                                                       by Different
                                                        in HuH-7 Cells and HuH-7R Cells
                                                             Data from our bioinformatic analyses suggest that YB-1 phosphorylation is invo
                                                        in facilitating the sorafenib resistance in HuH-7R cells. To characterize the different m
                                                        anistic responses of parental HuH-7 and HuH-7R cells to sorafenib treatment, we uti
                                                        several inhibitors for the mitogen-activated protein kinase (MAPK) signaling path
                                                        (sorafenib, U0126 and BI-D1870) and EGFR/PI3K/AKT signaling pathway (AG1478
                                                        LY294002). As shown in Figure 2A, upon treatment of HuH-7 cells with sorafenib, p
                                                        phorylation levels of ERK1/2 and YB-1 were decreased in a dose-dependent manner, w
                                                        the phosphorylation level of Akt was not altered (Figure S3A). Inhibition of ERK1/2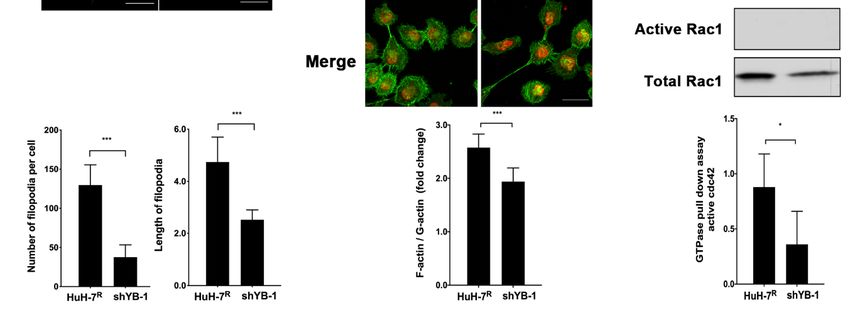
of PI3K and AKT phosphorylation with AG1478 or LY294002 treatment led to a significant
decrease in YB-1 phosphorylation in HuH-7R cells. In addition, the combination of soraf-
enib and LY294002 also significantly inhibited in phosphorylation of YB-1 in HuH-7R cells
(Figure 2B). Our findings suggest that sorafenib reduces YB-1 phosphorylation through
Int. J. Mol. Sci. 2021, 22, 224 inhibiting the MAPK pathway in HuH-7 cells and conversely enhances YB-1 phosphory-5 of 20
lation through activating the PI3K/AKT pathway in HuH-7R cells.
Figure 2. YB-1 phosphorylation is regulated by different signaling pathways in response to sorafenib treatment in HuH-7
and HuH-7R cells. (A) HuH-7 cells were incubated with increasing doses of sorafenib, U0126 or BI-D1870 for 12 h. (B)
Figure 2. YB-1 phosphorylation is regulated by different signaling pathways in response to sorafenib treatment in HuH-7
HuH-7R cellsR were incubated with increasing doses of sorafenib, LY294002, AG1478 or sorafenib combined with LY294002
and HuH-7 cells. (A) HuH-7 cells were incubated with increasing doses of sorafenib, U0126 or BI-D1870 for 12 h. (B)
for 12 h.R Cell
HuH-7 cells lysates were separated
were incubated using sodium
with increasing doses dodecyl sulfate-polyacrylamide
of sorafenib, LY294002, AG1478 orgelsorafenib
electrophoresis (SDS-PAGE)
combined and
with LY294002
subjected to immunoblotting with the indicated antibodies. Intensity was quantified using densitometry and normalized
for 12 h. Cell lysates were separated using sodium dodecyl sulfate-polyacrylamide gel electrophoresis (SDS-PAGE) and to
that of GAPDH.
subjected Blots are representatives
to immunoblotting of threeantibodies.
with the indicated separate experiments.
Intensity was quantified using densitometry and normalized
to that of GAPDH. Blots are representatives of three separate experiments.
2.3. R
2.3. Immunohistochemical
Immunohistochemical Staining
Staining of
of HuH-7
HuH-7 and
and HuH-7
HuH-7R Tumor-Bearing
Tumor-Bearing Mice
Mice with
with and
and With-
Without Sorafenib Treatment
out Sorafenib Treatment
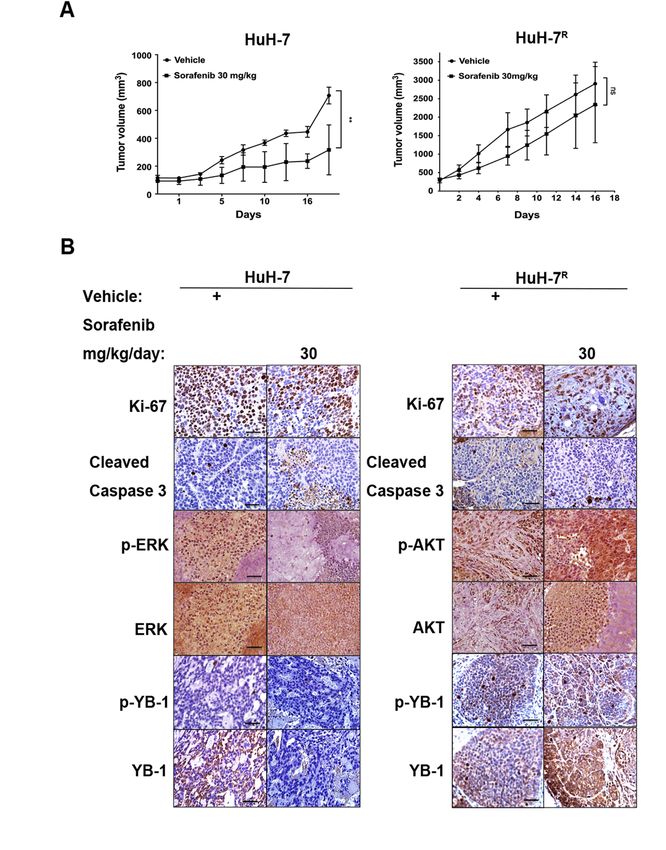
To further validate the in vivo response of HCC to sorafenib, we employed a mouse
To further validate the in vivo response of HCC to sorafenib, we employed a mouse
xenograft tumor models established by subcutaneous injection of HuH-7 or HuH-7RR cells.
xenograft tumor models established by subcutaneous injection of HuH-7 or HuH-7 cells.
As shown in Figure 3A, HuH-7 tumor-bearing mice were orally treated with sorafenib
As mg/kg)
(30 shown inorFigure
vehicle3A, HuH-7
control fortumor-bearing mice
18 days. Notably, were
the orally
tumor treated
volumes ofwith sorafenib (30
sorafenib-treated
HuH-7 tumor-bearing mice were significantly suppressed, compared with vehicle controls.
In contrast, sorafenib treatment failed to inhibit tumor growth in HuH-7R tumor-bearing
mice, resulting in no significant difference to vehicle controls. Immunohistochemical
assessment of key marker proteins in the tumor sections from HuH-7-bearing mice revealed
a significant reduction in levels of Ki-67 (a proliferation marker), p-YB-1, YB-1, p-ERK1/2
and ERK1/2. Moreover, the level of active cleaved caspase-3, an apoptosis marker, was
significantly increased in the presence of sorafenib. Immunohistochemical data revealed
strong staining for Ki-67, p-YB-1, YB-1, p-AKT and AKT but not cleaved caspase-3 in mice
bearing HuH-7R tumors (Figure 3B). Based on the collective results, we conclude that HuH-
7R tumors have greater tumorigenic potential than HuH-7 tumors. Sorafenib inhibited cell
proliferation and induces apoptosis in HuH-7 tumors, but it did not have significant effect
on HuH-7R -derived tumors. Furthermore, sorafenib promoted YB-1 phosphorylation via
effects from PI3K/AKT but not MAPK signaling in HuH-7R tumors, which was consistent
with our in vitro findings (Figure 2).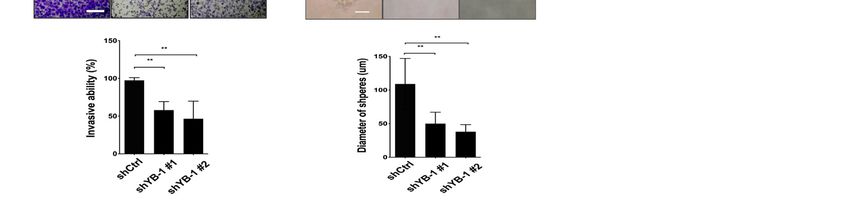
data revealed strong staining for Ki-67, p-YB-1, YB-1, p-AKT and AKT but not cleaved
                                          caspase-3 in mice bearing HuH-7R tumors (Figure 3B). Based on the collective results, we
                                          conclude that HuH-7R tumors have greater tumorigenic potential than HuH-7 tumors. So-
                                          rafenib inhibited cell proliferation and induces apoptosis in HuH-7 tumors, but it did not
                                          have significant effect on HuH-7R-derived tumors. Furthermore, sorafenib promoted YB-
Int. J. Mol. Sci. 2021, 22, 224                                                                                       6 of 20
                                          1 phosphorylation via effects from PI3K/AKT but not MAPK signaling in HuH-7R tumors,
                                          which was consistent with our in vitro findings (Figure 2).

                                  Figure 3. Effects of sorafenib on tumor growth and differentially expressed proteins of HuH-7 and
                                  HuH-7R cells in xenograft models. (A) In vivo effects of sorafenib on tumor growth of HuH-7 or
                                  HuH-7R mice. Nude mice were injected subcutaneously with HuH-7 or HuH-7R cells. Mice were
                                  orally administered vehicle or sorafenib 30 mg/kg for 18 days. Tumor volumes at the indicated
                                  time-points were calculated and plotted (n = 5/group). p Values were determined using the t test. (ns,
                                  not significant; ** p < 0.01). (B) Changes in specific protein markers in HuH-7 and HuH-7R tumors
                                  tissues. Paraffin-embedded sections of tumor tissues were analyzed via immunohistochemistry and
                                  stained with the indicated antibodies. Representative sections were captured at 400× magnification.

                                  2.4. YB-1 Knockdown Does Not Affect Proliferation, But Suppresses Migration, Invasion and
                                  Sphere Formation in HuH-7R Cells
                                       To establish the potential roles of YB-1 in resistant HCC cell lines, several functional
                                  assays were performed. We generated several sorafenib-resistant HCC cell lines (HuH-7R ,
                                  Hep3BR , PLC-5R , Sk-Hep-1R ) and compared YB-1expression and Ser102 phosphorylation
                                  status with those in parental HCC cell lines via immunoblotting (Figure S4). PLC-5R cells
                                  displayed high expression of YB-1 and Ser102 phosphorylation. The sorafenib IC50 value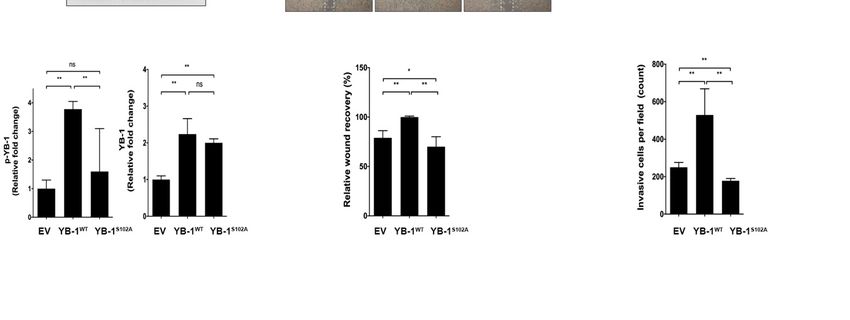
Int. J. Mol. Sci. 2021, 22, 224 7 of 20
of 12.6 µM was slightly higher than that of HuH-7R cells (10.3 µM). Lentiviral-mediated
delivery of YB-1 shRNAs (small hairpin RNA) was conducted to inhibit YB-1 expression in
HuH-7R and PLC-5R cells. The knockdown efficiency data are presented in Figure 4A and
Figure S5A. In the MTT (3-(4,5-dimethylthiazol-2-yl)-2,5-diphenyltetrazolium bromide)
assay, proliferation of HuH-7R cells was not markedly different under sorafenib treat-
ment or after YB-1 knockdown, compared with the control group (Figure 4B). Subsequent
wound healing and invasion assays performed using YB-1 knockdown and control HuH-
7R cells demonstrated that suppression of YB-1 led to a significant decrease in migration
(Figure 4C) and invasion activities (Figure 4D), compared with control HuH-7R cells. Fur-
thermore, sphere formation of HuH-7R cells was markedly attenuated upon inhibition of
YB-1 (Figure 4E). Similarly, knockdown of YB-1 in PLC-5R cells led to decreased migration,
invasion and sphere formation but not cell proliferation (Figure S5B–E). The results clearly
demonstrate that YB-1 does not influence cell proliferation but facilitates motility8 of
Int. J. Mol. Sci. 2021, 22, x FOR PEER REVIEW and
21
metastasis of HuH-7R and PLC-5R cells.
Figure 4.
Figure Knockdownof
4. Knockdown ofYB-1
YB-1does
doesnot
notinhibit
inhibitproliferation,
proliferation, but
but suppresses
suppresses migration,
migration, invasion,
invasion, and
and sphere
sphere formation
formation of of
HuH-7RR cells.
HuH-7 cells. (A) HuH-7RR cells
(A) HuH-7 cells were infected
infected with
withlentiviruses
lentivirusescontaining
containingshYB-1
shYB-1 (#1,
(#1, #2)#2)
or or shCtrl,
shCtrl, andand after
after 48 h,48lysed
h, lysed
and
and analyzed
analyzed for YB-1
for YB-1 expression
expression statusstatus by immunoblotting
by immunoblotting with
with the the indicated
indicated antibodies.
antibodies. (B) Viability
(B) Viability of HuH-7 of RHuH-7 R cells
cells treated
treated with shYB-1
with shCtrl, shCtrl, or
shYB-1
5 µM or 5 μM sorafenib
sorafenib determined determined at the indicated
at the indicated time-points
time-points with the MTT withssay.
the MTT
Plots ssay.
depictPlots depict
cumulative
cumulative cell absorbance
cell absorbance versus daysversus days(C)
in culture. in culture. (C) Wound
Wound healing assayhealing
of YB-1assay of YB-1 knockdown
knockdown HuH-7R cells. HuH-7 R cells. The micro-
The micrographs depict
graphs depict cells migrating into the gap 0 h and 15 h after removal of the insert. (D) Transwell invasion assay of YB-1
cells migrating intoR the gap 0 h and 15 h after removal of the insert. (D) Transwell invasion assay of YB-1 knockdown
knockdown HuH-7 cells. Cells in the central field of each insert were visualized using light microscopy and quantified.
HuH-7R cells. Cells in the central field of each insert were visualized using light microscopy and quantified. (E) Sphere
(E) Sphere formation assay of YB-1 knockdown HuH-7R cells. Images of the spheres formed were captured on day 9 and
R cells. Images of the spheres formed were captured on day 9 and sphere
formation assay of YB-1 knockdown HuH-7
sphere diameters measured. Data were quantified and presented as means ± SD. All results are the representatives of at
diameters
least measured. Data
three independent were quantified
biological replicates. and
Scalepresented as means
bars = 50 μm. ± SD.
p Values wereAlldetermined
results are using
the representatives of at
the t test (ns, not least
signif-
three **
icant; independent biological
p < 0.01); shCtrl, replicates.
control shRNA; Scale
shYB-1,bars = 50 µm.
shRNA p Values
against YB-1.were determined using the t test (ns, not significant;
** p < 0.01); shCtrl, control shRNA; shYB-1, shRNA against YB-1.
2.5. YB-1 Enhances Expression of EMT-Related Molecules in HuH-7R Cells
To clarify the mechanisms by which YB-1 enhances the migration and invasion of
drug-resistant cancer cells, expression levels of the genes and proteins associated with
EMT were assessed. Our data showed that mesenchymal genes encoding zinc-finger pro-
tein SNAI1 (Snail), twist-related protein 1 (Twist1), zinc-finger E-box-binding homeobox
1 (Zeb1), matrix metalloproteinase-2 (MMP-2), and vimentin (VIM) were downregulatedInt. J. Mol. Sci. 2021, 22, 224 8 of 20
2.5. YB-1 Enhances Expression of EMT-Related Molecules in HuH-7R Cells
To clarify the mechanisms by which YB-1 enhances the migration and invasion of
drug-resistant cancer cells, expression levels of the genes and proteins associated with EMT
were assessed. Our data showed that mesenchymal genes encoding zinc-finger protein
SNAI1 (Snail), twist-related protein 1 (Twist1), zinc-finger E-box-binding homeobox 1
(Zeb1), matrix metalloproteinase-2 (MMP-2), and vimentin (VIM) were downregulated
and epithelial genes encoding E-cadherin (E-cad) and tight junction protein ZO-1 were up-
regulated in YB-1-depleted HuH-7R cells. (Figure 5A). Reduced protein expression of Snail,
Twist1, Zeb1, MMP-2, and vimentin and the induction of E-cadherin and ZO-1 proteins
in YB-1 knockdown HuH-7R cells were determined via immunoblotting (Figure 5B–D).
Expression patterns of mesenchymal-related molecules, such as SNAI2 (Slug), MMP-9 and
fibronectin, were not significantly different in YB-1 knockdown HuH-7R cells. Our data
Int. J. Mol. Sci. 2021, 22, x FOR PEERsuggested
REVIEW that the YB-1 is involved in regulation of EMT through modulation of specific 9 of 21
genes in HuH-7R cells.
Figure 5. YB-1 enhances epithelial-mesenchymal transition (EMT)-associated gene and protein expression in HuH-7R cells.
Figure 5. YB-1 enhances epithelial-mesenchymal transition (EMT)-associated gene and protein expression in HuH-7R cells.
(A) mRNA levels of EMT-associated genes were assessed via quantitative real-time PCR (qPCR) after YB-1 silencing in
(A) mRNA
HuH-7 levels
R cells. (B)of EMT-associated
Protein expressiongenes
levelswere assessed via quantitative
of EMT-associated genes after real-time PCR (qPCR)
YB-1 knockdown after RYB-1
in HuH-7 cellssilencing
detected inby
HuH-7 R cells. (B–D) Protein expression levels ofusing
EMT-associated R
immunoblotting with the indicated antibodies GAPDH asgenes after YB-1
the loading knockdown
control. in HuH-7
Quantified data arecells detected
presented as
by immunoblotting
means withare
± SD. All results therepresentative
indicated antibodies using
of at least GAPDH
three as the biological
independent loading control. Quantified
replicates. shCtrl, data areshRNA;
control presented as
shYB-
means ± SD.
1, shRNA against Y-boxare
All results binding protein-1.
representative p Values
of at were
least three determinedbiological
independent using thereplicates.
t test (ns, shCtrl,
not significant; * p < 0.05;
control shRNA; ** p <
shYB-1,
0.01). against Y-box binding protein-1. p Values were determined using the t test (ns, not significant; * p < 0.05; ** p < 0.01).
shRNA
2.6. YB-1 Promotes Cdc42-Mediated F-Actin Regulation and Filopodia Formation in HuH-7R
2.6. YB-1 Promotes Cdc42-Mediated F-Actin Regulation and Filopodia Formation in HuH-7R Cells
Cells
In
Inview
viewof
ofthe
thefinding
findingthat
thatYB-1
YB-1influences
influencescell
cellinvasiveness
invasivenessand
andmobility,
mobility,the
theeffects
effects
of R
of its knockdown on filopodia formation and actin cytoskeleton structure in HuH-7Rcells
its knockdown on filopodia formation and actin cytoskeleton structure in HuH-7 cells
were further assessed. Knockdown of YB-1 caused a significant reduction in the number
and length of filopodia formed in HuH-7R cells compared to control cells (Figure 6A).
Cdc42, RhoA and Rac1 are members of a Ras-related Rho family of GTP-binding proteins
that support a migratory phenotype in cells. Moreover, F-actin formation is an important
event in progression of cell motility[20]. Accordingly, we explored the effect of YB-1 inhi-Int. J. Mol. Sci. 2021, 22, 224 9 of 20
were further assessed. Knockdown of YB-1 caused a significant reduction in the number
and length of filopodia formed in HuH-7R cells compared to control cells (Figure 6A).
Cdc42, RhoA and Rac1 are members of a Ras-related Rho family of GTP-binding proteins
that support a migratory phenotype in cells. Moreover, F-actin formation is an important
event in progression of cell motility [20]. Accordingly, we explored the effect of YB-1
inhibition on F-actin structure and GTPase activity of Cdc42, RhoA and Rac1. The F-actin
versus G-actin ratio was slightly decreased in YB-1-depletd HuH-7R cells, compared with
control cells (Figure 6B). Levels of GTP-bound (active) Cdc42, RhoA and Rac1 were further
determined using the GST-pull down assay. The active Cdc42 level was lower in YB-1
knockdown HuH-7R than control cells. However, active RhoA and active Rac1 levels
Int. J. Mol. Sci. 2021, 22, x FOR PEER REVIEW 10 of 21
were barely detectable in both knockdown and control cells (Figure 6C). Our collective
findings suggest that YB-1 regulates the activity of the GTPase Cdc42, which mediates actin
cytoskeleton rearrangement to facilitate filopodia formation and subsequent cell motility.
Figure 6.
Figure YB-1 regulates
6. YB-1 regulates filopodia
filopodia formation
formationthrough
throughmodulating
modulatingRho RhoGTPases
GTPasesactivity
activityand
andreorganization
reorganizationof of the
the actin
actin
cytoskeleton
cytoskeleton inin HuH-7 RR
HuH-7 cells.
cells.(A)
(A)YB-1
YB-1knockdown
knockdowninduced
inducedfilopodia
filopodiaregression.
regression.F-actin
F-actinwas
wasstained
stainedwithwithphalloidin-
phalloidin-
conjugated
conjugatedAlexa
AlexaFluor
Fluor488488(green).
(green).DNADNA was
was counterstained
counterstained with DAPI
with DAPI(blue). TheThe
(blue). number andand
number length of filopodia
length per
of filopodia
cell were calculated from 20 cells in each group (*** p < 0.001, Scale bars = 20 μm). (B) G-actin and F-actin
per cell were calculated from 20 cells in each group (*** p < 0.001, Scale bars = 20 µm). (B) G-actin and F-actin were were visualized
via immunofluorescence
visualized staining with
via immunofluorescence Alexawith
staining FluorAlexa
488 phalloidin
Fluor 488 (F-actin, green)
phalloidin and green)
(F-actin, DNaseandI-conjugated Alexa Fluor
DNase I-conjugated Alexa
594 (G-actin, red). The F-actin to G-actin ratio per cell was calculated from 50 cells in each group (*** p < 0.001, Scale bar =
Fluor 594 (G-actin, red). The F-actin to G-actin ratio per cell was calculated from 50 cells in each group (*** p < 0.001,
50 μm). (C) Rho-family-GTPase activity was examined using a small GTPase family pull-down assay. Total cell lysates
Scale bar = 50 µm). (C) Rho-family-GTPase activity was examined using a small GTPase family pull-down assay. Total cell
were immunoprecipitated and analyzed by immunoblotting with specific antibodies. Active cdc42 was quantified and
lysates weretoimmunoprecipitated
normalized total cdc42. Error bars and analyzed
indicate meanby immunoblotting
± SEM, and p valueswithwere
specific antibodies.
calculated withActive cdc42
the t test (* p was quantified
< 0.05).
and normalized to total cdc42. Error bars indicate mean ± SEM, and p values were calculated with the t test (* p < 0.05).
2.7. YB-1 Ser102 Phosphorylation Is Crucial for Migratory Potential and Invasiveness of HuH-
72.7.
R Cells
YB-1 Ser102 Phosphorylation Is Crucial for Migratory Potential and Invasiveness of HuH-7R Cells
Our findings suggest that YB-1 is a downstream target of the PI3K/AKT pathway in
HuH-7 R cells. S102 phosphorylation of YB-1 was reported to enhance tumor cell migration
Our findings suggest that YB-1 is a downstream target of the PI3K/AKT pathway in
HuH-7R cells.[21].
and invasion Tophosphorylation
S102 clarify the mechanisms
of YB-1 underlying enhanced
was reported tumorigenicity
to enhance elicited
tumor cell migration
by p-YB-1, mutational assays were performed on HuH-7 cells. To this end, a YB-1 S102A
R
mutant was constructed in a lentivirus expression-based vector. Overexpression of empty
vector control (EV), YB-1 wild-type (YB-1WT) or YB-1 S102A mutant (YB-1S102A) in HuH-7R
cells, was accomplished using the lentivirus-mediated delivery method. The expression
efficiency is presented and quantified in Figure 7A. Wound healing (Figure 7B) andInt. J. Mol. Sci. 2021, 22, 224 10 of 20
and invasion [21]. To clarify the mechanisms underlying enhanced tumorigenicity elicited
by p-YB-1, mutational assays were performed on HuH-7R cells. To this end, a YB-1
S102A mutant was constructed in a lentivirus expression-based vector. Overexpression
of empty vector control (EV), YB-1 wild-type (YB-1WT ) or YB-1 S102A mutant (YB-1S102A )
in HuH-7R cells, was accomplished using the lentivirus-mediated delivery method. The
Int. J. Mol. Sci. 2021, 22, x FOR PEER expression
REVIEW efficiency is presented and quantified in Figure 7A. Wound healing (Figure 7B)
11 of 21
and transwell (Figure 7C) assays revealed decreased motility and invasiveness of HuH-7R
cells following the inhibition of YB-1 S102 phosphorylation, compared to the control cells.
The collective results indicate that S102 phosphorylation of YB-1 is mediated by AKT affects
the migration and invasiveness of HuH-7R cells.
Figure 7. YB-1 S102 phosphorylation is required for migration and invasion of HuH-7R cells. (A) HuH-7R cells were
infected with lentiviruses containing empty vector control (EV), YB-1 wild-type (YB-1WT ) or YB-1 serine 102 to alanine
mutant (YB-1S102A ) and after 24 h, lysed and analyzed via immunoblotting with the indicated antibodies, upper panel.
Figure 7. YB-1 S102 phosphorylation is required for migration and invasion of HuH-7R cells. (A) HuH-7R cells were infected
The relative expression efficiency of WT and S102A YB-1 was quantified using GAPDH as normalization control, lower
with lentiviruses containing empty vector control (EV), YB-1 wild-type (YB-1WT) or YB-1 serine 102 to alanine mutant (YB-
panel. WT S102A R
1S102A) (B)
andWound
after 24healing
h, lysed assay
andofanalyzed
EV, YB-1via immunoblotting
or YB-1 -overexpressing HuH-7antibodies,
with the indicated cells. Theupper
micrographs depict
panel. The cells
relative
that migrated
expression into the of
efficiency gapWT 0 hand
andS102A
16 h after
YB-1removal of the insert,
was quantified usingupper
GAPDHpanel.
as Wound recovery
normalization was quantified,
control, lower panel.lower
(B)
panel. (C) Transwell invasion assay WTof WT or YB-1S102A - overexpressing R cells. Cells in the central field of
Wound healing assay of EV, YB-1 orEV,
YB-1YB-1
S102A -overexpressing HuH-7R cells. The HuH-7
micrographs depict cells that migrated
into insert
each the gap 0 hvisualized
were and 16 h via afterlight
removal of the insert,
microscopy, upper Invaded
upper panel. panel. Wound recovery
cells were was quantified,
quantified, lower panel.lower panel.
p values (C)
were
Transwell invasion
determined using theassay
t testof(scale
EV, YB-1
bar =WT50orµm;
YB-1* pS102A - overexpressing
< 0.05; ** p < 0.01). HuH-7R cells. Cells in the central field of each insert
were visualized via light microscopy, upper panel. Invaded cells were quantified, lower panel. p values were determined
using the t test (scale bar = 50 μm; * p < 0.05; ** p < 0.01).
3. Discussion
3. Discussion
Sorafenib is a kinase-targeting drug commonly used for treatment of advanced HCC,
but the majorityisofa patients
Sorafenib eventually
kinase-targeting develop
drug drug resistance.
commonly To enhance
used for treatment therapeutic
of advanced effi-
HCC,
cacy, elucidation
but the majorityofofthe molecular
patients changesdevelop
eventually related to sorafenib
drug resistance
resistance. is critical.
To enhance Previous
therapeutic
studies
efficacy,have describedofthe
elucidation theinvolvement of various
molecular changes aberrant
related signaling pathways
to sorafenib resistanceinisprogres-
critical.
sion of HCC.
Previous Primary
studies haveresistance
describedtothe
sorafenib is associated
involvement with aberrant
of various sustainedsignaling
activationpathways
of EGFR
downstream
in progression signaling
of HCC.molecules, including to
Primary resistance Raf/Ras/MEK/ERK,
sorafenib is associatedoverexpression
with sustained of JNK,
acti-
and abnormal activation of VEGFA [10]. Additionally, PI3K/AKT and
vation of EGFR downstream signaling molecules, including Raf/Ras/MEK/ERK, overex- JAK-STAT pathways
are reported
pression to be and
of JNK, involved in acquired
abnormal resistance
activation to sorafenib
of VEGFA of HCC [10,22].
[10]. Additionally, Elucidation
PI3K/AKT and
of the key molecules in aberrant pathways implicated in the development
JAK-STAT pathways are reported to be involved in acquired resistance to sorafenib of sorafenibof
resistance
HCC [10,22].mayElucidation
thus facilitate
of patient
the keystratification
molecules infor optimization
aberrant of therapeutic
pathways implicatedoutcomes.
in the de-
velopment of sorafenib resistance may thus facilitate patient stratification for optimization
of therapeutic outcomes.
To screen protein candidates potentially activated by sorafenib, we identified the key
molecules involved in aberrant signaling pathways in sorafenib-resistant HuH-7R cells. In
this study, 148 differentially expressed molecules were selected from intersective combi-Int. J. Mol. Sci. 2021, 22, 224 11 of 20
To screen protein candidates potentially activated by sorafenib, we identified the key
molecules involved in aberrant signaling pathways in sorafenib-resistant HuH-7R cells. In
this study, 148 differentially expressed molecules were selected from intersective combi-
nation of MS analysis and TCGA datasets, and PPI network construction was employed
to identify the key molecules in sorafenib-resistant HCC cells. A total of 20 differentially
expressed molecules were mainly linked to cellular movement-related functions and shown
to be critical for tumor progression [23–25]. NOP56 and ANLN are E-cadherin binding pro-
teins, which might be associated with E-cadherin-mediated cell-cell adhesion in epithelial
tissues [26]. TUBA1B, TUBA1C, TUBB2A and TUBB4B belong to the tubulin family and
form the microtubule filaments, which usually play important roles in mesenchymal mi-
gration [27,28]. NEDD1 and CKAP5 are also involved in microtubule system by promoting
the nucleation of microtubules, whereas STMN1 regulates microtubule filament by desta-
bilizing microtubules [29]. DYNC1H1, a dynein motor protein, and KIF18B, KIF23 and
KIF4A, members of kinesin superfamily motor proteins, assist cargo transport along micro-
tubules to various subcellular locations, such as the leading edge of migrating cells [30].
ALDOA and RACGAP1 are tubulin binding proteins important for the microtubule fil-
aments system, and are mainly responsible for metastasis and invasiveness in various
carcinomas [31,32]. Not only the microtubule system, some of the identified upregulated
molecules are involved in cellular metastasis and carcinogenesis through dysregulating cell
division, including cell cycle regulators, CDCA8, CDK1, CDK2, CEP55 and CHEK1 [33–38].
Moreover, these 20 proteins were modulated by 27 cellular movement-related regulators.
Several of these regulators are responsible for genomic integrity. TOP2A, PTTG1 and
SMC4 play central roles in chromosome stability and ERCC6 takes part in excision repair,
of which dysregulation drives deleterious chromosomal aberrations and thus carcino-
genesis [39–42]. Moreover, it has been reported that regulation of mRNA stability can
govern cancer metastasis [43]. FTSJ3 and DKC1are in charge of RNA modification; DDX10,
MKI67and NOP58 are RNA-binding proteins; and NUP188 plays a role in mRNA transport.
Dysregulation of these molecules may lead to malignancy [44–49]. Dysregulation of protein
metabolism is another known mechanism for promoting oncogenesis [50]. EIF2S2 is an
anabolic factor, while PSMD1 is a catabolic factor, both of which are correlated to poor
cancer prognosis [51,52]. Cell cycle regulators CDC23 and BUB1 have been regarded as
EMT-related regulatory proteins [53,54]. Besides, dynamic changes in alternative splicing
occur during EMT. hnRNPM is a splicing regulator that promotes an epithelial splicing
program [55]. Lastly, PA2G4, PTTG1, KPNA2 and YB-1 are gene expression regulators, of
which overexpression usually cause poor clinical outcomes in various malignancies [56–59].
In the enrichment analysis, the top-ranked molecules were PA2G4, PTTG1 and YB-1, which
may act as transcription factors. PA2G4, also designated ErbB3 receptor binding protein
1 (EBP1), is a well-conserved DNA/RNA binding protein that modulates transcriptional
activity in different cancer cell types [60,61]. Patients with high expression levels have
poor clinical outcomes [62]. PTTG1, an oncogenic transcription factor, is overexpressed
in various malignancies and associated with enhanced cell migration and invasion [63].
YB-1, another important gene expression regulator, is an unfavorable prognostic marker
in primary HCC and associated with advanced stages of HCC [19]. The multifunctional
YB-1 protein promotes expression of genes involved in cell proliferation, migration and
invasion of HCC [64]. Our findings suggest that the three cancer-associated gene expres-
sion regulators, PA2G4, PTTG1 and YB-1, play important roles in progression of HCC.
YB-1 has not been previously characterized as a mediator of sorafenib resistance. Data
from phosphoproteomic analyses indicate that upregulation of YB-1 phosphorylation could
serve as a mechanism to facilitate sorafenib resistance in HuH-7R cells. Based on correlation
analysis with TCGA data, high YB-1 levels were associated with shorter median OS in
patients with HCC, supporting a critical role in sorafenib resistance of HCC.
Several aberrant signaling pathways are implicated in acquisition of HCC resistance
to sorafenib [10]. For instance, the PI3K/AKT pathway contributes to sorafenib resistance
via crosstalk with the MAPK/ERK pathway [65]. Earlier studies have demonstrated thatInt. J. Mol. Sci. 2021, 22, 224 12 of 20
sorafenib activates the PI3K/AKT pathway and that blockage of this pathway enhances
the efficacy of sorafenib [66,67]. The PI3K/AKT pathway is involved in development and
progression of HCC and shown to be activated in 93% HCC specimens [68,69]. Another
study similarly reported activation of AKT in sorafenib-resistant HCC cells, consistent with
these findings [70]. In the current investigation, protein expression and phosphorylation
levels of Ser 102 of YB-1 were higher in HuH-7R than parental HuH-7 cells. Notably,
phosphorylation of YB-1 at Ser102 is reported to be activated by both MAPK/ERK and
PI3K/AKT signaling pathways in different cancer cells [71,72]. To establish the YB-1
phosphorylation responses in parental HuH-7 and HuH-7R cells after sorafenib treatment,
various inhibitors were employed. Our results showed that p-YB-1 was significantly
suppressed by sorafenib, U0126 and BI-D1870, indicating that regulation of YB-1 by the
MAPK pathway in HuH-7 cells. In addition, p-YB-1 was significantly increased by sorafenib
but decreased by LY294002 and AG1478 in HuH-7R cells, supporting a role as a downstream
effector of the EGFR/PI3K/AKT pathway. Experiments with xenograft tumor models
disclosed increased levels of p-YB-1 and p-AKT in HuH-7R cells, compared to HuH-7
cells. The results further confirm that sorafenib enhances YB-1 phosphorylation via effects
from PI3K/AKT but not MAPK signaling in HuH-7R tumors in vivo. Moreover, elevated
p-YB-1 expression was associated with a higher rate of tumor progression. Taken together,
these findings suggest that the levels of p-YB-1 regulated by PI3K/AKT signaling mediate
progression of HCC and resistance to sorafenib.
Previously, we showed that long-term exposure of HuH-7 cells to sorafenib led to an
alteration in morphology into spindle-shaped cells [70]. Sorafenib-resistant cells displayed
activation of the EMT process with enhanced invasive and metastatic potential [7]. In
our experiments, inhibition of YB-1 functions impaired tumor migration, invasion and
sphere formation in HuH-7R and PLC-5R cell lines. To further investigate if the elevated
YB-1 expression and phosphorylation after sorafenib treatment is universal in HCC cells,
PLC-5, Sk-Hep-1, and Hep3B were subjected to sorafenib training. Among the three
tested HCC cell lines, only PLC-5R showed strong expression of YB-1 with simultaneously
upregulated Ser102 phosphorylation after sorafenib training. In contrast, Hep3BR and
Sk-Hep-1R cells did not display significant increase in either YB-1 or its phosphorylation
levels. Heterogeneous composition of tumor cells has been proposed and observed in many
cancer types, including liver cancer and non-small cell lung cancer (NSCLC) [73,74]. Drug
resistance-induced tumor recurrence has been attributed in parts to heterogeneous tumor
cell subpopulations, such as cancer stem cells [74]. Therefore, it is suggested that drug-
resistant cancer cells, such as HuH-7R and/or PLC-5R cells, may share a certain similar
characteristic of a heterogeneous liver tumor. On the other hand, the original nature and
responses to sorafenib treatment of Hep3B and Sk-Hep-1 may be undergone by different
mechanisms. Moreover, the YB-1 S102A mutation impaired migration and invasiveness of
HuH-7R cells, indicating that phosphorylation of S102 is critical for the modulation of a
number of YB-1-induced EMT genes.
To elucidate the potential molecular mechanisms governing the actions of YB-1, we
analyzed the expression levels of genes and proteins associated with EMT in YB-1 knock-
down cells. Our data revealed downregulation of the EMT transcription factors Zeb1,
Twist1, and Snail after YB-1 knockdown in HuH-7R cells. Zeb1 belongs to the zinc family
of transcription factors, which suppress the expression of cell polarity factors and activate
matrix metalloproteinases (MMP), thus promoting remodeling of the basement membrane
and invasion of tumor cells to the surrounding tissue [75]. YB-1 acts as a gene expres-
sion regulator at various levels and regulates the corresponding genes through splicing,
mRNA stability, translation, or transcription [76]. YB-1 was reported to be recruited by
lncRNA-BX111887 at the promoter region of Zeb1, upregulated Zeb1 transcription, and
promoted cell invasion and metastasis in pancreatic cancer [77]. Snail, an EMT-inducing
transcription factor, plays an important role in cancer invasion. Expression of Snail is corre-
lated with metastasis and poor prognosis in HCC [78,79]. Previous reports have shown
that knockdown of YB-1 suppresses expression of Snail in human malignancies [64,80].Int. J. Mol. Sci. 2021, 22, 224 13 of 20
We additionally observed that YB-1 regulates expression of Snail, suggesting that YB-1
enhances Snail activity to promote mesenchymal changes in HuH-7R cells. Twist1, another
transcription factor, belongs to the basic helix-loop-helix family of proteins. The protein
promotes migration and invasion, induces cancer stem cell-like phenotype and mediates
chemoresistance [81]. Previous studies have demonstrated that YB-1 serves a main target
of Twist [82]. Interestingly, our results showed downregulation of Twist1 at both mRNA
and protein levels upon silencing of YB-1 in HuH-7R cells. Earlier microarray data further
suggest that YB-1 enhances Twist1 expression at both the mRNA and protein levels [83].
Here, Twist is proposed to be a downstream target of YB-1 in HuH-7R cells. However, the
mechanisms underlying the regulation of Twist by YB-1 require further investigation.
Additionally, in our experiments, YB-1 knockdown reduced expression of the mes-
enchymal markers, MMP-2 and vimentin, and increased expression of the epithelial mark-
ers, E-cadherin and ZO-1, in HuH-7R cells. MMP-2, a member of the MMP family, is a
proteolytic enzyme that degrades the extracellular matrix to promote invasiveness. Expres-
sion and activity of MMP-2 are correlated with poor prognosis, invasion, and metastasis in
many human cancer types [84]. YB-1 is reported to regulate MMP-2 expression through
interacting at the promoter region of MMP [85]. Vimentin plays a role in maintaining
cell shape, stabilizing cytoskeletal interactions, and cell motility [86]. Earlier, YB-1 was
shown to enhance vimentin expression and drive tumor progression via EMT in colorectal
cancer [87]. However, the mechanisms by which YB-1 enhances vimentin expression in
HuH-7R cells are unclear at present.
E-cadherin mediates cell–cell adhesion, and loss of its expression results in increased
motility and invasiveness [79]. Snail is reported to block E-cadherin transcription through
binding to specific DNA sequences [88]. Our experiments showed that YB-1 knockdown
reduces Snail expression, suggesting that YB-1 promotes activation of Snail and reduction
of E-cadherin to facilitate cell migration ability. ZO-1 belongs to the tight junction protein
family and plays important roles in maintaining cell–cell adhesion [89]. Further studies are
necessary to determine the mechanisms by which YB-1 induces suppression of E-cadherin
and ZO-1 expression.
During EMT, numerous cytoskeletal proteins are altered, leading to cytoskeleton
rearrangement [90]. The Rho family of GTPases (Cdc42, Rac1 and Rho) play essential roles
in the dynamic changes of actin and formation of filopodia during cell migration [20]. Data
from the present study showed that YB-1 promotes Cdc42 GTPase activity, which mediates
F-actin formation to facilitate filopodia generation in HuH-7R cells but does not activates
Rac1 or Rho. Based on the collective results, it is proposed that YB-1 modulates specific
EMT-related molecules and stimulates the GTPase family protein, Cdc42, to promote cell
migration and invasion.
In summary, YB-1 promotes invasion and migration through the EGFR/PI3K/AKT
signaling pathway in sorafenib-resistant HCC. Our findings support the utility of YB-1 as
a useful prognostic biomarker and potential molecular target for overcoming sorafenib
resistance in HCC.
4. Materials and Methods
4.1. Cell Culture, YB-1 Knockdown, and Mutant YB-1 Expression
The HCC cell line, HuH-7, was obtained from the Health Science Research Resources
Bank (JCRB0403). Hep3B, PLC-5, Sk-Hep-1, and HEK293T cells were acquired from the
American Type Culture Collection. Sorafenib-resistant HCC cell lines (HuH-7R , Hep3BR ,
PLC-5R , and Sk-Hep-1R ) were established by long-term exposure of each cell type to so-
rafenib as described previously [91]. HuH-7, HuH-7R , Hep3B, Hep3BR , PLC-5, PLC-5R ,
Sk-Hep-1, Sk-Hep-1R , and HEK293T cells were cultured in Dulbecco’s modified Eagle’s
medium (DMEM; HyClone) containing 10% fetal bovine serum, penicillin (100 U/L), and
streptomycin (10 mg/L) in a 5% CO2 incubator at 37 ◦ C. Lentivirus was produced as
described previously [70]. Two target sequences for YB-1 knockdown are: CCAGTTCAAG-
GCAGTAAATAT (shYB-1#1) and AGCAGACCGTAACCATTATAG (shYB-1 #2). VectorsInt. J. Mol. Sci. 2021, 22, 224 14 of 20
expressing small hairpin RNAs (shRNA) targeting YB-1 (shYB-1 #1 and #2) or control
shRNA (shCtrl) were co-transfected with packaging plasmids in HEK293T cells, after
which lentiviruses were harvested and further used to infect HuH-7R or PLC-5R cells. After
selection with 1.25 µg/mL puromycin in DMEM for three days, stable clones were used
for subsequent assays. For generation of mutant YB-1, the gene was cloned from a cDNA
library generated from HuH-7R cells. Substitution of the putative phosphorylation site to
alanine was performed using a transformer site-directed mutagenesis by PCR as described
previously [92]. Following replacement of Ser102 of YB-1 with alanine, the gene was cloned
into the lentivirus construct for expression. Functional assays were performed as described
below after confirmation of expression via immunoblotting.
4.2. Bioinformatic Analysis
In an earlier study, we have performed quantitative phosphoproteomic analyses to
compare the proteomes of HuH-7 and HuH-7R cells [16]. Phosphoproteins displaying
>1.5-fold changes were considered significantly increased in phosphorylation in HuH-7R
cells. Overexpressed genes showing a significant correlation with poor OS in HCC patients
were obtained from The Cancer Genome Atlas database (TCGA, https://cancergenome.
nih.gov/) and intersected with significantly upregulated phosphoproteins to obtain the
differentially expressed molecules. Functional enrichment analyses of these differentially
expressed molecules were subsequently performed using gene ontology (GO) with the
database for annotation, visualization, and integrated discovery (DAVID) tool. The ranking
and significance of biological functions were evaluated based on p values. Protein–protein
interaction (PPI) networks of the differentially expressed molecules were illustrated with
STRING, where a combined reliability combined score >0.4 was taken as a significant
interaction pair.
4.3. Immunoblotting, Immunohistochemistry (IHC) and Immunofluorescent Staining
Protein was extracted from the cells using lysis buffer containing 50 mM Tris-HCl,
150 mM NaCl, 1 mM EDTA, 0.1% SDS, 1% Nonidet P-40, 0.5% sodium deoxycholate, 1×
phosphatase inhibitor, and 1× protease inhibitor cocktails, pH 7.4. Cell lysates were sepa-
rated using sodium dodecyl sulfate-polyacrylamide gel electrophoresis (SDS-PAGE) and
transferred onto polyvinylidene fluoride membranes (Millipore). After blocking 5% skim
milk in buffer containing 20 mM Tris-HCl and 150 mM NaCl, membranes were incubated
in 5% skim milk containing the indicated primary antibodies. A total of 25 commercial anti-
bodies were used for immunoblotting (Supplemental Table S1). For immunohistochemical
experiments, sample slides prepared from 5 µm sections of paraffin-embedded xenograft
tumors harvested from in vivo animal experiments were deparaffinized, and expression
of p-YB-1 S102, YB-1, cleaved caspase-3, Ki-67, p-ERK, ERK, p-AKT, and AKT was exam-
ined. Immunoblotting and immunohistochemistry analyses were conducted as described
previously [16]. For F-actin analysis, shCtrl and shYB-1 containing HuH-7R cells were
stained with Alexa 488-conjugated phalloidin (Thermo Fisher, Waltham, MA, USA), and
for G-actin staining, Alexa 594-conjugated deoxyribonuclease I (Thermo Fisher, Waltham,
MA, USA) was used in accordance with the manufacturer’s instructions. Cell nuclei were
counterstained with 40 ,6-diamidino-2-phenylindole (DAPI). Images were captured using a
Carl Zeiss LSM 880 confocal microscope (ZEISS, Jena, Germany).
4.4. Cell Proliferation, Viability, Wound Healing, Invasion, and Sphere Formation Assays
Cell proliferation and viability were evaluated using the 3-(4,5-dimethylthiazol-2-yl)-
2,5-diphenyltetrazolium bromide (MTT) assay (Sigma–Aldrich, St. Louis, MO, USA), and
the IC50 values were determined by measuring absorbance at 570 nm. Cell migration ability
was assessed with a scratch wound healing assay and the invasive capability of cells was
determined using a Matrigel-coated Boyden chamber assay as described previously [93].
The sphere formation assay was performed for 9 days using an ultra-low attachment plateYou can also read