Earliest Mechanisms of Dopaminergic Neurons Sufferance in a Novel Slow Progressing Ex Vivo Model of Parkinson Disease in Rat Organotypic Cultures ...
←
→
Page content transcription
If your browser does not render page correctly, please read the page content below
International Journal of
            Molecular Sciences

Article
Earliest Mechanisms of Dopaminergic Neurons
Sufferance in a Novel Slow Progressing Ex Vivo
Model of Parkinson Disease in Rat Organotypic
Cultures of Substantia Nigra
Matteo Dal Ben 1,2 , Rosario Bongiovanni 2 , Simone Tuniz 2 , Emanuela Fioriti 2 ,
Claudio Tiribelli 2 , Rita Moretti 3 and Silvia Gazzin 2, *
 1    Department of Medical, Surgical, and Health Sciences, University of Trieste, 34100 Trieste, Italy;
      mdalben@fegato.it
 2    Fondazione Italiana Fegato, AREA Science Park, 34149 Trieste, Italy; rbongiovanni@fegato.it (R.B.);
      simone.tuniz@fegato.it (S.T.); emanuela.fioriti@fegato.it (E.F.); ctliver@fegato.it (C.T.)
 3    Neurology Clinic, Department of Medical, Surgical, and Health Sciences, University of Trieste, 34100 Trieste,
      Italy; moretti@units.it
 *    Correspondence: silvia.gazzin@fegato.it; Tel.: +39-040-375-7925

 Received: 10 April 2019; Accepted: 3 May 2019; Published: 6 May 2019

 Abstract: The current treatments of Parkinson disease (PD) are ineffective mainly due to the poor
 understanding of the early events causing the decline of dopaminergic neurons (DOPAn). To overcome
 this problem, slow progressively degenerating models of PD allowing the study of the pre-clinical
 phase are crucial. We recreated in a short ex vivo time scale (96 h) all the features of human PD (needing
 dozens of years) by challenging organotypic culture of rat substantia nigra with low doses of rotenone.
 Thus, taking advantage of the existent knowledge, the model was used to perform a time-dependent
 comparative study of the principal possible causative molecular mechanisms undergoing DOPAn
 demise. Alteration in the redox state and inflammation started at 3 h, preceding the reduction
 in DOPAn number (pre-diagnosis phase). The number of DOPAn declined to levels compatible
 with diagnosis only at 12 h. The decline was accompanied by a persistent inflammation and redox
 imbalance. Significant microglia activation, apoptosis, a reduction in dopamine vesicle transporters,
 and the ubiquitination of misfolded protein clearance pathways were late (96 h, consequential) events.
 The work suggests inflammation and redox imbalance as simultaneous early mechanisms undergoing
 DOPAn sufferance, to be targeted for a causative treatment aimed to stop/delay PD.

 Keywords: brain organotypic cultures; dopaminergic neurons; causative mechanisms; Real-Time
 PCR; glutamate neurotoxicity; dopamine; neurodegeneration; neuron morphometry

1. Introduction
     Parkinson disease (PD) is the second most common neurodegenerative disorder after Alzheimer’s
disease [1]. The core pathologic feature of motor PD is the reduced production of the neurotransmitter
dopamine in dopaminergic neurons (DOPAn) in the substantia nigra pars compacta (SN). The main
consequence is the alteration of the nigrostriatal pathway, causing motor imbalance, associated
to the recently acquired alterations of the other three dopaminergic pathways (the mesolimbic,
the mesocortical and the tuberoinfundibular system) involved in the altered non-motor functions,
constantly described in PD [2–6].
     Nowadays is clear that PD is a multifactorial pathology. Several genes have been identified as
risk-factors, but very few cases (about of 5–10%) are related to genetic mutations, and the majority of

Int. J. Mol. Sci. 2019, 20, 2224; doi:10.3390/ijms20092224                              www.mdpi.com/journal/ijms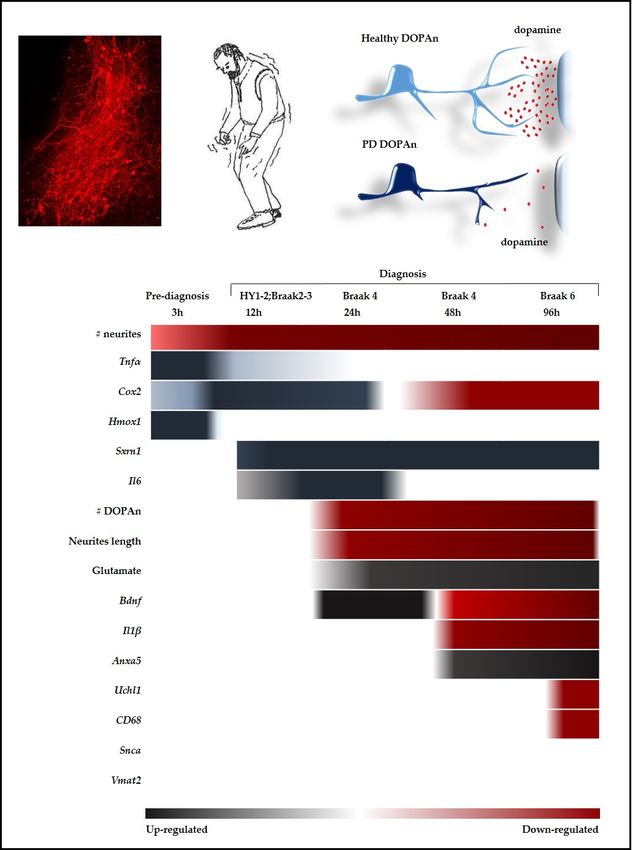
Int. J. Mol. Sci. 2019, 20, 2224                                                                   2 of 18

Parkinson cases are classified as sporadic [7,8]. Older age and male sex are a risk factor in developing
PD [9]. Environmental factors, occupational exposure to heavy metals, as well specific pesticides are
also responsible for the pathogenesis [7].
      From a molecular point of view, an incredible amount of work has been done in the past
decades in every available experimental model (in silico, in vitro, ex vivo, in vivo, toxin induced, and
genetically modified) to unravel the molecular determinants of dopamine demise. Demonstrated
components are oxidative stress, inflammation, microgliosis, excitotoxicity, apoptosis, autophagy,
mitochondrial dysfunction, alterations in the endosomal-lysosomal functioning, vesicle trafficking,
and the ubiquitination mediated clearance of unfolded protein, until the most recent involvement of
epigenetics [3,8,10–18].
      Nevertheless, the etiology of PD is still elusive [5,8]: a comparative, time-course evaluation able
to unravel the sequence of the molecular events of the very early, pre-clinical phase DOPAn sufferance,
is still not available. This might be the reason why we still do not have curative therapies but just a
temporary control for symptoms [12,17,19,20].
      To unravel the onset of DOPAn demise, a dynamic (time-course) slowly progressing approach
comparing multiple potential causative mechanisms is crucial [21]. This is unlikely given that the vast
majority of the old and most recent literature preferred an end-point experimental set-up, classically
representative of an already evident pathology, or coming from the autopsy. Indeed, the vast majority
of the published studies investigated only specific processes (e.g., only inflammation, only redox, only
growth factors) avoiding an integrative vision of the degenerative disorder and preventing a proper
description of the sequence of events from the onset, up to the final stages of PD progression. One
original work tried to compare the higher number of potential causative mechanisms by a time-course
approach [22] but, due to the acute scheme (see later into discussion), all the investigated genes were
already activated at the earliest time (3 h).
      For this reason, we decided to address the time course of the molecular events ongoing to DOPAn
demise by developing an ex vivo chronic (96 h) model of PD characterized by a slow and progressive
degeneration of dopaminergic cells of the SN, reproducing all the features of the human pathology
(needing dozen of years) [23]. The primary relevance of the model was that we gained access the
pre-diagnostic phase, addressing the earliest (potentially causative) molecular mechanisms ongoing
with the very first dopaminergic neurons sufferance.

2. Results

2.1. Model Development and Experimental Plan
      To gain access to the early, causative molecular mechanisms undergoing DOPAn sufferance,
possibly preceding diagnosis, it was crucial to set-up a slow progressive PD model.
      To reproduce all the features of human pathology in an in vitro time scale (96 h), we combined
the rat brain organotypic cultures of substantia nigra, maintaining in vitro the architecture, cellular
heterogeneity, and metabolic features of the in vivo tissue, with low dose of rotenone. Rotenone
is a pesticide known to induce PD in human [24–26], and reproducing in rats all of the behavioral,
morphological and molecular features reminiscent of human PD [27,28].
      Because the cutting procedure to generate brain slices determines an important tissue sufferance,
as first we followed the LDH release (lactate dehydrogenase, a marker of membrane leakage) during
the first days in culture, without any challenging. Because challenging already suffering slices may
introduce bias in the model, we waited the normalization of LDH (indicative of slices recovery).
As shown in Figure 1a, after a relevant LDH release in the first 2–3 days, the LDH level stabilized at
around 7 days, remaining constant at least for 15 days in vitro. Based on this information, we started
the challenging at 8 days in vitro. Notably, the experiment (96 h long at maximum) finished largely in
the plateau of LDH release.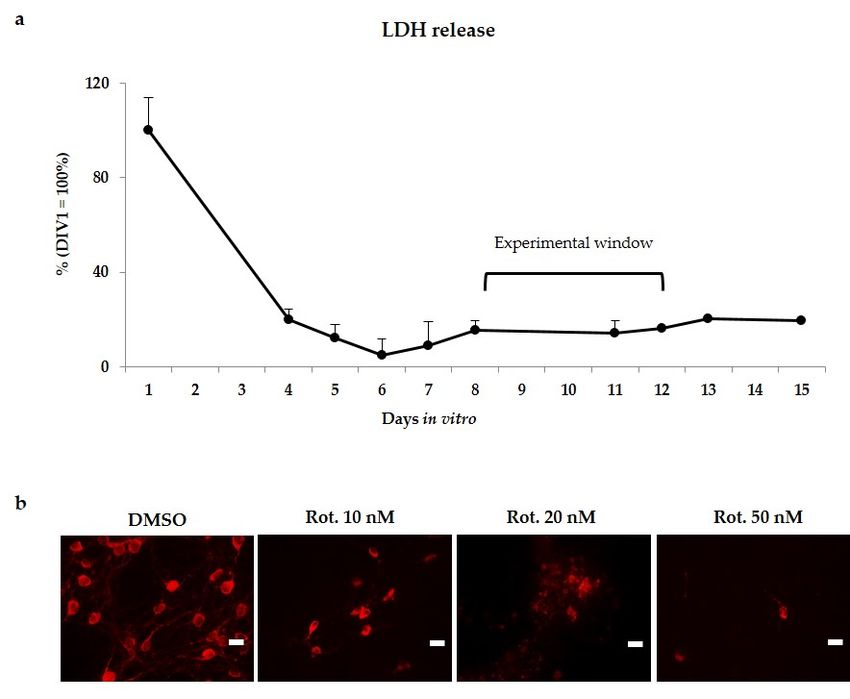
tested, and the appearance of DOPAn was evaluated by tyrosine hydroxylase (TH+)
       immunofluorescence staining (Figure 1b) at the end of the trial (96 h). As Figure 1b shows, 50 nM of
       rotenone induced the complete disappearance of DOPAn, few remnants were observable at 20 nM of
       rotenone, while 10 nM of the pesticide induced only a partial DOPAn TH+ signal loss. This
Int. J. Mol. Sci. 2019, 20, 2224                                                                            3 of 18
       concentration was applied thereafter in the study.

     Figure 1. Experimental plan set-up. (a) LDH release in unchallenged cultures (indicative of culture
          Figure 1. Experimental plan set-up. (a) LDH release in unchallenged cultures (indicative of culture
     recovery     from the slicing procedure), and chose experimental window for rotenone challenging;
          recovery from the slicing procedure), and chose experimental window for rotenone challenging; (b)
     (b) Representative immunofluorescences of DOPAn appearance evaluated by tyrosine hydroxylase
          Representative immunofluorescences of DOPAn appearance evaluated by tyrosine hydroxylase
     (TH+) immunofluorescence staining (red signal) under 50, 20 and 10 nM rotenone (Rot.) challenging
          (TH+) immunofluorescence staining (red signal) under 50, 20 and 10 nM rotenone (Rot.) challenging
     for 96
          forh.96Scare  barbar
                  h. Scare  25 25
                               µm.μm.

     TheMorphometric
    2.2.  concentration   of rotenone
                       Analysis           required
                                of the Temporal     to develop
                                                Degeneration      a slow progressive
                                                             of Dopaminergic Neurons anddemise of DOPAn
                                                                                         Agreement with was
experimentally    determined. After recovery from the stress due to the slicing procedure Figure 1a, the
    the Clinical Scenario
cultures were exposed to the chemical. Three decreasing (from 50 to 10 nM) concentration were tested,
          It has been established that most of the diagnoses occur when the degenerative process is
and advanced,
     the appearance     of DOPAn was evaluated by tyrosine hydroxylase (TH+) immunofluorescence
                 with an estimated death of 40–60% of DOPAn, leading to the loss of 80% of putamen
staining   (Figure
     dopamine       1b) at
                 content   the end ofTothe
                         [3,11,29,30].      trial (96
                                         identify     h). As Figure
                                                  the different steps of1bthe
                                                                            shows,   50 nM of
                                                                              morphological       rotenone induced
                                                                                                degeneration    of
the complete    disappearance     of DOPAn,    few  remnants    were  observable     at  20
     dopaminergic neurons under low (10nM) concentration of rotenone, we assessed the number nM   of rotenone,
                                                                                                           of TH+while
10 nM   of the the
     DOPAn,    pesticide
                   numberinduced    only a partial
                            of dopaminergic        DOPAn
                                             neuron’s        TH+
                                                      neurites, as signal
                                                                   well as loss.
                                                                            their This
                                                                                  lengthconcentration
                                                                                          at 3, 12, 24, 48 was  applied
                                                                                                           and 96
     h of rotenone
thereafter          challenging.
            in the study.

     2.2.1. Decrease Analysis
2.2. Morphometric    of the Number
                              of the of the DOPAn’s
                                     Temporal       Neuritesof Dopaminergic Neurons and Agreement with the
                                              Degeneration
Clinical Scenario
        The first sign of DOPAn sufferance was the reduction of the number of neurites (Figure 2b),
   dropping
    It has beenafterestablished
                     3 h by 26% (pthat
                                     < 0.01) in challenged
                                          most              slices. Thisoccur
                                                 of the diagnoses        decrease is considered
                                                                               when              not sufficient
                                                                                       the degenerative          to
                                                                                                             process is
   lead to symptom     [29], thus it is representative of a pre-diagnosis  clinical scenario.
advanced, with an estimated death of 40–60% of DOPAn, leading to the loss of 80% of putamen   Later on (12, 24, 48,
   96 h, all p < 0.001), the reduction of the number of neurites stabilizes to values of about of 50–60% of
dopamine content [3,11,29,30]. To identify the different steps of the morphological degeneration of
   controls. The results at 12–96 h hours agree with Cheng [29], estimating a 50–60% axon terminal loss
dopaminergic neurons under low (10 nM) concentration of rotenone, we assessed the number of TH+
DOPAn, the number of dopaminergic neuron’s neurites, as well as their length at 3, 12, 24, 48 and 96 h
of rotenone challenging.

2.2.1. Decrease of the Number of the DOPAn’s Neurites
     The first sign of DOPAn sufferance was the reduction of the number of neurites (Figure 2b),
dropping after 3 h by 26% (p < 0.01) in challenged slices. This decrease is considered not sufficient to
lead to symptom [29], thus it is representative of a pre-diagnosis clinical scenario. Later on (12, 24, 48,
96 h, all p < 0.001), the reduction of the number of neurites stabilizes to values of about of 50–60% of
controls. The results at 12–96 h agree with Cheng [29], estimating a 50–60% axon terminal loss the time
Int. J. Mol. Sci. 2019, 20, x FOR PEER REVIEW 4 of 18
Int. J. Mol. Sci. 2019, 20, 2224 4 of 18
the time of the first diagnosis of PD [29]. Moreover, this finding agrees with the recent clinical
observation
of of a retrograde
the first diagnosis axisMoreover,
of PD [29]. in the morphological changes
this finding agrees involving
with DOPAn,
the recent clinicalbeginning
observation inof
the
a
distal neuritis
retrograde axisand proceeding
in the towards
morphological (in theinvolving
changes direction DOPAn,
of) the cell bodies, as
beginning in recently
the distalobserved
neuritis by
anda
PET (positron
proceeding emission
towards (in thetomography) scan
direction of) the cellinbodies,
early PD patients
as recently with a by
observed Hohen
a PET&(positron
Yhar score (HY)
emission
[31,32] of 1–2scan
tomography) [33].inNo changes
early in thewith
PD patients number of DOPAn
a Hohen neurites
& Yhar score (HY)were detected
[31,32] in control
of 1–2 [33]. OBCs
No changes
during
in the experimental
the number of DOPAn period.
neurites were detected in control OBCs during the experimental period.
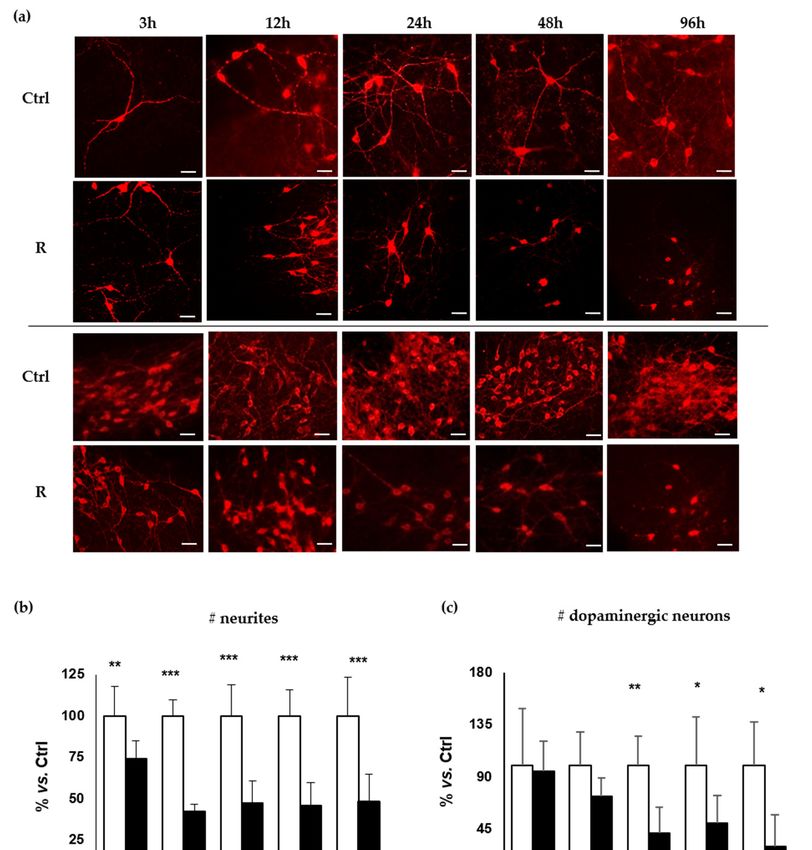
Figure 2. Analysis of the temporal degeneration of dopaminergic neurons. DOPAn appearance
Figure 2. Analysis of the temporal degeneration of dopaminergic neurons. DOPAn appearance
evaluated by tyrosine hydroxylase (TH+) immunofluorescence staining (red signal). Ctrl: controls.
evaluated by tyrosine hydroxylase (TH+) immunofluorescence staining (red signal). Ctrl: controls. R:
R: rotenone challenging. (a) Representation of DOPAn neurites changes (Upper two lines: both Ctrl
rotenone challenging. (a) Representation of DOPAn neurites changes (Upper two lines: both Ctrl and
and R, scale bar: 50 µm) and DOPAn number decrease (Lower two lines: both Ctrl and R, scale bar
R, scale bar: 50 μm) and DOPAn number decrease (Lower two lines: both Ctrl and R, scale bar 100
100 µm); (b–d) Analysis of DOPAn demise; (b) Number of neurites; (c) Number of dopaminergic
μm); (b–d) Analysis of DOPAn demise; (b) Number of neurites; (c) Number of dopaminergic neurons.
neurons. (d) Length of neurites (µm). White bars: DMSO. Black bars: Rotenone challenged slices.
(d) Length of neurites (μm). White bars: DMSO. Black bars: Rotenone challenged slices. x axis: hours.
x axis: hours. Data are expressed as the mean ± S.D. of at least five biological repetitions. Statistical
Data are expressed as the mean ± S.D. of at least five biological repetitions. Statistical significance: * p
significance: * p < 0.05; ** p < 0.01; *** p < 0.001.
< 0.05; ** p < 0.01; *** p < 0.001.Int. J. Mol. Sci. 2019, 20, 2224 5 of 18
2.2.2. Decrease of the Number of the DOPAn
The number of TH+ DOPAn was not significantly affected at the early times (3–12 h, Figure 2c),
reaching a maximal reduction of 27% at 12 h. At 24, 48, 96 h the decrease was more relevant, reaching
the statistical significance (60%, 50%, 70%; p < 0.01, p < 0.05, p < 0.05, respectively). This picture
well reproduces the human pathology as described by the Braak’s staging [34] and HY scale [31].
Specifically, motor symptoms appear at HY stage 1–2 [31] and Braak’s stage 2–3 [29,33,35], when the
30% of DOPAn TH+ and 60% of dopamine are lost (29); timing corresponding to the 12 h in our model.
Thereafter DOPAn TH+ loss progresses up to 50% at Braak’s stage 4, corresponding to 24–48 h in our
model, till to 60–70% DOPAn TH+ loss at the Braak’s stage 6 [23,29,33–36], corresponding to 96 h in
our model. No changes in the number of DOPAn have been detected in control OBCs during the
experimental period.
2.2.3. Decrease of the Length of the DOPAn’s Neurites
Similarly, the neurite length (Figure 2d) started declining at 24 h (35%), becoming significantly
reduced at 24, 48 and 96 h (60%, 60% and 70%; p < 0.001, p < 0.05 and p < 0.01, respectively). No
changes in the length of neurites were detected in control OBCs all long the experimental period.
Altogether, the morphological analysis confirms we reached the goal of creating a slow progressing
ex vivo system, supporting its use to represent the human pathology and allowing the analysis of the
early (possibly causative) mechanisms ongoing DOPAn sufferance. As it is, the 3 h experimental time
will offer the opportunity to focus on an early temporal window (pre-diagnosis) actually not accessible
in a clinic.
2.3. Time-Dependent Comparative Evaluation of the Molecular Events Undergoing DOPAn Sufferance
and Demise
To identify the earliest (causative) molecular events undergoing DOPAn sufferance and demise,
we performed a time-dependent comparative study of selected markers for the principal possible
mechanisms underlining DOPAn degeneration and PD (Table 1). To this end, we selected markers
already validated (see below).
2.3.1. Real-Time PCR Analysis of Inflammation, Redox Imbalance, Unfolded Proteins Ubiquitination,
Vesicles Transport, and Apoptosis; and Quantification of Glutamate in the Medium
Redox stress has been mentioned as the first-hint in PD development [6,37]. To monitor redox
imbalance, we chose Heme-oxygenase 1 (Hmox1), noticed up-regulated in PD patients and considered
a redox sensor [38–41], and sulfiredoxin1 (Srnx1), an adaptive response to redox stress, potentially
protecting DOPAn from ROS toxicity [38,42–44].
Inflammation is a recognized component of PD. A heterogeneous panel of inflammatory molecules
have been reported in literature, possibly representing different stages of the inflammatory cascade
activated in the numerous models, as well during the progression of the diseases in patients. For
this reason we chose multiple markers: Tumor necrosis factor alfa α (Tnfα [45–47]), cyclo-oxygenase
2 (Cox2 [48–51]), interleukin 6 (Il6 [46,52]), interleukin 1β (Il1 β); and Cd68, the marker of microglia
activation [53–55].
The brain-derived neurotrophic factor (Bdnf ), reported decreased in serum of PD patients and
correlating with motor impairment an DOPAn death [56–58], was addressed.
We analyzed also the risk factors described to be involved in the development of PD: Snca (Park1,4:
α-synuclein) [59–61], component of the Lewy-bodies observed in PD and other neurodegenerative
pathologies [36,62]. The ubiquitin carboxy-terminal hydrolase L1 (Uchl1/Park5), responsible for
the clearance of misfolded/aggregated proteins (among them, Snca), and reported as reduced in
the cerebrospinal fluid of PD patients [59,63–65]. The vesicular monoamine transporter 2 (Vmat2)
participating in the intracellular vesicular system regulating the cytosolic level of free dopamine, with
consequent ROS generation [66,67].Int. J. Mol. Sci. 2019, 20, 2224 6 of 18
Finally apoptosis [30,68], considered an end-point event in the pathology [30], was followed by
annexin5 (Anxa5).
The release of glutamate in the medium (Glu) was used to monitor glutamate neurotoxicity,
leading to excitotoxicity and suggested enhancing DOPAn loss [69,70].
Table 1. Analysis of selected markers.
Gene 3h 12 h 24 h 48 h 96 h
Redox imbalance
Hmox1 1.68 ± 0.40 ** 1.03 ± 0.16 0.64 ± 0.13 1.07 ± 0.21 1.04 ± 0.46
Srnx1 1.21 ± 0.35 1.71 ± 0.57 * 1.48 ± 0.38 ** 1.69 ± 0.80 * 1.70 ± 0.39 *
Inflammation
Tnfa 1.68 ± 0.54 * 1.47 ± 0.39 1.26 ± 0.19 * 1.58 ± 0.78 0.89 ± 0.29
Cox2 1.89 ± 0.55 * 1.40 ± 0.74 2.43 ± 0.69 *** 0.43 ± 0.58 0.31 ± 0.21
Il6 0.82 ± 0.44 2.10 ± 0.60 * 5.52 ± 0.81 *** 0.92 ± 0.68 0.88 ± 0.46
Cd68 1.35 ± 0.36 0.93 ± 0.19 0.87 ± 0.15 2.16 ± 0.82 4.20 ± 1.91 ***
Il1b 1.58 ± 0.51 1.07 ± 0.37 0.73 ± 0.23 0.83 ± 0.45 0.39 ± 0.12 *
Glutamate neurotoxicity
Glu 1.12 ± 0.2 1.34 ± 0.12 1.38 ± 0.21 * 1.53 ± 0.37 ** 1.52 ± 0.54 **
Neurotrophic growth factor
Bdnf 1.16 ± 0.29 0.84 ± 0.48 2.01 ± 0.68 *** 0.19 ± 0.04 ** 0.17 ± 0.17 **
Sinucleopathy
Snca 0.80 ± 0.21 1.38 ± 0.14 1.06 ± 0.27 1.09 ± 0.48 0.90 ± 0.60
Ubiquitination
Uchl1 0.88 ± 0.17 1.08 ± 0.14 1.13 ± 0.24 0.63 ± 0.19 0.46 ± 0.22 **
Vesicular transport
Vmat2 1.11 ± 0.21 1.16 ± 0.56 0.46 ± 0.28 1.07 ± 0.38 0.47 ± 0.11
Apoptosis
Anxa5 1.20 ± 0.14 1.20 ± 0.31 1.00 ± 0.23 1.57 ± 0.37 * 1.79 ± 0.58 ***
mRNA levels and glutamate release in medium in rotenone challenged cultures were expressed as fold vs.
DMSO-treated slices. h: hours. Hmox1: heme oxygenase1; Srnx1: sulfiredoxin 1; Tnfα: tumor necrosis factor α;
Il6: Interleukin 6; Cox2: cyclo-oxygenase 2; Cd68: cluster of differentiation 68; Il1β: interleukin 1β; Glu: glutamate
release; Bdnf : brain-derived neurotrophic factor; Snca: alpha-synuclein; Uchl1: ubiquitin carboxy-terminal hydrolase
L1; Vmat2: vesicular monoamine transporter 2, Anxa5: annexin 5. Data are expressed as the mean ± S.D. of at least
five independent repetitions. Statistical significance: * p < 0.05; ** p < 0.01; *** p < 0.001.
2.3.2. Results at 3 h
As reported in the previous section, at that time the only sign of DOPAn sufferance was the
decreased number of neurites, in absence of changes in the number of TH+ DOPAn or neurite length
(Figure 2). This experimental time corresponds to a pre-diagnose phase, thus represents the most
relevant timing to address in order to individuate the molecular effectors of DOPAn demise.
As shown in Table 1, at 3 h, the very first alteration we noticed involves Hmox1 (redox marker),
Tnfα and Cox2 (inflammation). Hmox1 is up regulated of about 1.7 fold (p < 0.01), returning to
basal levels at 12 h. Tnfα and Cox2 experience an increase of about 1.7 fold (p < 0.05) and 1.9-fold
(p < 0.05), reverting rapidly thereafter to control levels (Tnfα), or picking (Cox2) at about 2.5-fold at
24 h, (p < 0.001) before reverting. The results suggest that redox imbalance and inflammation are the
early and simultaneous effectors (causes) of DOPAn demise.Int. J. Mol. Sci. 2019, 20, 2224 7 of 18
2.3.3. Results at 12 h
At 12 h, the morphometric analysis of DOPAn presented a picture comparable with diagnosis
(Figure 2). At this experimental point, inflammation and redox imbalances are still present, as revealed
by the induction of Il6 and Srnx1 (Table 1, 12 h). Il6 is significantly increased at 12 h (p < 0.05), picking
at 24 h (about 5.5-fold vs. controls; p < 0.001) and then decreasing to control levels. Sxrn1 up-regulation
(1.7-fold, p < 0.05 at 12 h) is maintained along the experimental period 48 and 96 h: both p < 0.05).
The data suggest that, after the first hint, sustained inflammation and oxidative stress push TH+
DOPAn loss.
2.3.4. Results at 24 h, 48 h and 96 h
As shown in Table 1, at 24 h, Bdnf is significantly up-regulated (p < 0.001), falling below control
levels at 48 and 96 h (both about 0.2 fold, both p < 0.01). At 24 h, we notice also a significant glutamate
release (p < 0.05), continuing all long the 96 h (48 h, and 96 h; both p < 0.01).
After 48 h of challenging, apoptosis (Anxa5, p < 0.05) starts, increasing even more later on (96 h,
p < 0.001).
Only at the end (96 h), microgliosis (CD68, p < 0.001) is increased, while Uchl1 (ubiquitination,
p < 0.01) and Il1b (inflammation, p < 0.05) are significantly down-regulated.
All the mentioned events come up with a TH+ DOPAn loss compatible with advanced PD diagnosis,
thus representing late/consequential, rather than causative, molecular events in the pathology.
3. Discussion
Currently, PD is considered as a direct consequence of dopaminergic neurons loss, starting from
the substantia nigra pars reticularis, and later involving the dopaminergic striato-nigral, and the
other three dopaminergic paths form the basal ganglia to the cortex and hypothalamus. Despite the
enormous effort made by researchers and clinicians, the huge knowledge of the molecular determinants
in DOPAn demise, and the agreed concept that PD is a multifactorial pathology, there is still no clear
vision of the sequence of the steps leading to dopamine loss in PD. A model characterized by a slow
and progressive degeneration of dopaminergic cells of the SN will, therefore, be useful to allow an
assessment of the pre-diagnosis molecular events [21] by a comparison of markers representative of
the major molecular effectors of DOPAn demise.
To the best of our knowledge, only one original study tried to compare the higher number of
potential causative mechanisms by a time-course approach [22]. In this study, at the shorter time (3 h)
all the investigated genes: inflammation (Il1β); oxidative stress (glutathione reductase and glutathione
peroxidase precursor), glutamate excitotoxicity (N-methyl-d-aspartate 2a receptor); and growth factors
(Gdnf : glial cell-derived neurotrophic factor) were already altered. The immunohistochemistry also
revealed a dramatic (compatible with diagnosis) decrease of TH+ DOPAn density. Altogether, these
findings suggest that the experimental scheme applied (50 mg/kg intra peritoneal MPTP: 1-metil 4-fenil
1,2,3,6-tetraidro-piridina to C57Bl mice), was too strong to create a slowly degenerative model, and
indicating the need to inducing a more gradual damage, allowing to gain access to the pre-clinical
phase and better unravel the temporal sequence of the molecular events in respect to the earliest
DOPAn sufferance, before the starting of DOPAn loss.
As illustrated by Figure 3, the morphometric data we obtained indicates that we created an ex
vivo model of PD with a slow and progressive degeneration of DOPAn, well agreeing with the clinical
scenario, and allowing to follow the pathology progression from the pre-diagnosis phase (3 h) to the
most advanced stages (24–96 h).protective reaction has been also reported acting through the inhibition of inflammation (down-
regulating Tnfα and Il1β) [74], a feature not observed in our model, nor in the clinic. In fact, an
increased level of TNFα has been reported in the serum of PD patients (HY score 2; corresponding to
12 h in our model), and correlating with the cognitive and mood decline [45,46], sleep disorder [45–
47], as well as correlating with the Hoehn & Yahr progression [45]. The observation again may
Int. J. Mol. Sci. 2019, 20, 2224 8 of 18
corroborate the idea of a failure of the adaptive to the damage mechanisms.
Figure 3.3. Temporal
Figure Temporal alterations
alterations of
of the
the markers
markers evaluated
evaluated in in the
the study.
study. The
The picture
picture summarizes
summarizes the
the
dynamic
dynamic of of all
all the
the parameters
parameters alterations
alterations studied
studied inin the
the work
work byby aa time
time scale
scale approach,
approach, tempting
tempting aa
parallel
parallel with
with the clinical situation
the clinical situation (for
(fordetails
detailssee
seetext).
text).Red:
Red: down-regulated.
down-regulated. Black:
Black: up-regulated.
up-regulated. No
No color: unchanged.
color: unchanged. h: hours. h: hours.
The most important finding is that we obtained a temporal window (Figure 3, 3 h) corresponding
to a pre-diagnosis stage, where the number of DOPAn TH+ cells, as well the length of neurites, is
comparable to controls. At that timing the unique sign of DOPAn sufferance is a 27% decrease in
the number of neurites, a reduction considered not sufficient to be symptomatic [29]. Therefore, this
temporal window (3 h) is crucial for the identification of the molecular events triggering the DOPAn
demise (resumed in Figure 3).
At the 3 h time (pre-diagnosis phase), we detected an increased expression of redox stress markers
(Hmox1) and inflammation markers (Tnfα, Cox2). Redox imbalance is usually considered the first
hint in PD [6,37]. An increase of Hmox1 has been reported in the serum of subjects with a diagnosis
of PD [38], and, in autopsy, in the peripheral regions of Lewy bodies [71], where it is supposed to
enhance the toxicity by deposition of iron, one of its products [71,72]. By the other side, Hmox1 is not
only a sensor for the presence of redox stress but also an inducer of adaptive mechanisms to redox
imbalance [73], as well a potential link between redox stress, inflammation and growth factors [74].Int. J. Mol. Sci. 2019, 20, 2224 9 of 18
One of the adaptive mechanisms induced by Hmox1 is Srnx1, always up regulated from 12 h in
our model (Figure 3). In models, Srnx1 has been demonstrated to protect from excessive nitrosylation
the peroxiredoxins involved in the maintenance of thiol homeostasis [43,75,76], and improving DOPAn
survival [42,77], possibly acting on mitochondria [78], another known player in PD. The progressive
degeneration of DOPAn in our model, as well the inexorable clinical progression, suggests the failure of
the Srnx1 protective mechanism toward redox imbalance. The Hmox1 potential protective reaction has
been also reported acting through the inhibition of inflammation (down-regulating Tnfα and Il1β) [74],
a feature not observed in our model, nor in the clinic. In fact, an increased level of TNFα has been
reported in the serum of PD patients (HY score 2; corresponding to 12 h in our model), and correlating
with the cognitive and mood decline [45,46], sleep disorder [45–47], as well as correlating with the
Hoehn & Yahr progression [45]. The observation again may corroborate the idea of a failure of the
adaptive to the damage mechanisms.
Persistent inflammation is a recognized player in PD [30,50,53,79,80], described as contributing to
DOPAn demise, and acting as a second hit on the ongoing oxidative imbalance by amplifying it [79,80].
Tacking advantage of our model, allowing accessing the molecular events ongoing the pre-diagnosis
stages, we suggest a different scenario, where redox imbalance and inflammation may be simultaneous
triggers for DOPAn demise. In fact, in literature, Cox2 is reported as a second-hit pro-inflammatory
molecule, supposed to worsen DOPAn degeneration by enhancing both inflammation and redox
stress [79,80]. Based on our model, Cox2 (and inflammation) is a first hit, already significantly
up-regulated at 3 h (pre-diagnosis point, together with redox markers), and picking at 24 h (Braak 4).
The up-regulation of Tnfα at the same earlier (3 h) timing supports this interpretation.
Completing the inflammatory picture, in the model Il6 is upregulated at 12 h (HY 1/2, Braak 2/3,
Figure 3), picking at 24 h (Braak 4). In agreement, Il6 has been described to be increased in the serum
of PD subject (HY score 2), and correlating with the worsening of cognition, locomotor speed, and
mood (46). Notably, Il6 has been reported enhancing ROS by induction of iNOS (inducible nitric oxide
synthase), increasing redox stress and nitrosylation [79,80], thus amplifying the toxic cascade, and
possibly explaining the failure in the adaptive-to stress mechanisms.
Lately on our model (48/96 h, corresponding to Braak 4/6, Figure 3) microgliosis (CD68) and
apoptosis (Anxa5) markers are also increased. Microgliosis is always detected in autopsy of PD
brains [48–50,53–55], and considered crucial to DOPAn loss [6,30]. Alternately, apoptosis has been
previously suggested as a final step in PD degeneration [30]. Based on our model, DOPAn TH+ loss
(24 h) largely precede the alteration of both microgliosis and apoptosis markers, suggesting that both
death mechanisms, and not only apoptosis, are late and consequential events in the dopamine loss.
Among the final events of dopamine demise, we notice also the alteration of the ubiquitination
mediated clearance of unfolded proteins (Uchl1, 96 h), in line with the clinical scenario [59,63]. Notably,
unfolded synuclein (Snca) is one of the targets of Uchl1. Thus, the temporal windows we described in
our model, may agree with the concept that dopamine loss precede synucleinopathy, as previously
described [3,36].
Of notice, Uchl1 is a known target for nitrosylation (destroying the enzymatic activity of its targets)
occurring in case of excessive oxidative stress [81]. Thus, the reduction of Uchl1 may be another
(together with DOPAn TH+ loss and increased inflammation, see above in the discussion) potential
consequence of the inefficient adaptation to stress.
Oxidative stress, and specifically Hmox1 modulation, has been linked also to the induction of
growth factors (Gdnf, Bdnf) in animal models of PD [74], with consequent reduction in the DOPAn
loss. Bdnf has been consistently reported protecting neurons by an anti-apoptotic effect [82–84], by
inhibiting microgliosis [11,53], and by inducing the formation of synapses at the dendritic spines [85].
In clinics, BDNF depletion in brain (up to 70% in SN and 80% in DOPAn) has been correlated with
DOPAn loss [56], and BDNF decrease in the serum of PD patients has been reported correlating with
the timing from diagnosis, pathology severity [58], and cognitive deficit [86,87]. Most importantly,
Scalzo [58] noticed an increase of BDNF during the early disease, interpreting this trend as a tentativeInt. J. Mol. Sci. 2019, 20, 2224 10 of 18
reaction to DOPAn degeneration. This description fits well with our data (Figure 3), showing an initial
significant up-regulation of Bdnf (24 h, tentative reaction), followed by a trend to decreasing under the
level in controls thereafter (48/96 h). Altogether, the data may support the idea of the failure of the
potential adaptive to stress mechanisms.
We notice also an increase of glutamate release starting from 24 h, when DOPAn neurites loss starts
(Figure 3), and persisting to the end of the experimental timing (96 h), suggesting its role in worsening
the dopaminergic neurons loss. This may fits with chemically induced rodent models of PD [88],
where glutamate neurotoxicity has been proposed to accelerate DOPAn loss by excitotoxicity [69,70].
In the described models, the attenuation of excitotoxicity by the induction of glutamate transporters,
improved DOPAn survival, synaptic proteins expression and motor functions [89], while the blockage
of induced neurotoxicity by MK801 attenuated the DOPAn loss [69]. Supporting the potential
toxic role of glutamate in PD, the administration of drugs able to improve the astrocytes glutamate
uptake (responsible for the 90% of extracellular glutamate brain clearance [88]), exhibits a beneficial
effects in humans [17,90]. Indeed, extracellular glutamate regulates also immune response and
microglia activation [91], supporting one more time the close relationship among all the analyzed
molecular players.
The links between the damaging mechanisms reported in literature and fitting with our data,
stress two critical aspects of the pathology:
(1) The importance of blocking the early, inducing steps, to avoid the priming of the
self-promoting and self-amplifying cascade of toxic events ongoing DOPAn degeneration, before it
became uncontrollable.
(2) Might explain the inefficacy of the current treatment schemes focused in facing a single
molecular target.
For this reason, and based on our results, we suggest a cocktail approach with a wide spectrum
anti-inflammatory and an anti-oxidant.
Admittedly, this study lacks of the assessment of the protein(s) content related to the genes
variations. However, the selection of the genes we investigated was based on previous data showing
a correlation between gene(s) and protein(s) variation [39–41,44,51,56,60,61,64,65], rendering the
results reliable.
4. Materials and Methods
4.1. Organotypic Brain Culture Preparation
Organotypic cultures were prepared as described before, with few modifications [92]. Wistar
Han TM Rats at 5 days after birth (P5) were obtained from the animal facility of the University
of Trieste. Immediately after sacrifice by decapitation, the ventral tegmental area containing
substantia nigra (SN) was dissected and maintained in dissection medium (ice-cold Gey’s Balanced
Salt Solution—Sigma-Aldrich, St. Louis, MO, USA, plus d-Glucose 10 mg/mL) until use. A McIlwain
tissue chopper (Gomshall Surrey, UK) was used to cut transversely 300 µm slices. Healthy slices were
selected for structural integrity under stereomicroscope inspection. Slices were then transferred to
sterile, semi-porous Millicell-CM inserts (PICM03050, Millipore, Darmstadt, Germany), fed by 1 mL of
media and maintained at 37 ◦ C, 5% CO2 , 95% humidity in a humidified incubator. The media was
changed the day after cutting and every two days thereafter. Slices were maintained in culture 10 days
before starting treatment. The whole experimental procedure agreed with the Italian Law (Decree
87–848) and European Community Directive (86-606-ECC), and was authorized by the competent
OPBA (Organismo Per il Benessere Animale) of the University of Trieste (23 February 2016, and
10 October 2017).Int. J. Mol. Sci. 2019, 20, 2224 11 of 18
4.2. Cultures Medium and Treatment
To create an ex vivo chronic (96 h) model reproducing all the features of human PD (needing
dozens of years), slices were challenged with low doses of rotenone. The medium used to culturing the
slices was composed of 65% Basal Medium Eagle (Life Technologies Corporation, Grand Island, NY,
USA), 10% heat-inactivated Fetal Bovine Serum (Euroclone, Milan, Italy), 25% Hank’s Balanced Salt
Solution (Sigma-Aldrich), 1% l-Glutamine (Life Technologies Corporation), 2% Penicillin/Streptomycin
(Life Technologies Corporation), and 10 mg/mL d-Glucose (Sigma-Aldrich).
Rotenone (Sigma-Aldrich) was dissolved in DMSO (Sigma-Aldrich) and diluted to the final
concentration of 10 nM in complete medium. At each time point, a well was challenged with rotenone,
and one well exposed to the same amount of DMSO required dissolving rotenone (controls).
4.3. LDH Test
The amount of total extracellular LDH in media, indicative of membrane leakage, was determined
using a CytoTox-ONE™ Homogeneous Membrane Integrity Assay (G7891, Promega, Madison, WI,
USA), as previously described [92]). The supernatant was collected at each experimental time-point,
and the LDH in medium was quantified following the manufacturer’s instruction. The glutamate
contained in the OBCs medium was subtracted from the analysis (blank). The signal was read at
560Ex/590Em by an EnSpire Multimode Plate Reader (PerkinElmer, Waltham, MA, USA).
4.4. Immunofluorescent Staining of Dopaminergic Neurons
To follow the morphological degeneration of DOPAn, the cells number, the number of dopaminergic
neuron’s neurites, as well as their length were assessed at 3, 12, 24, 48 and 96 h after challenging with
low doses of rotenone. Slices were immediately fixed in 4% neutral buffered formalin for 30 min
at 4 ◦ C, washed with PBS, and then glycine 0.1 M (Sigma-Aldrich) in PBS to remove residues of
paraformaldehyde. After washing, slices were pre-incubated 1 h in 10% normal donkey serum
(Sigma-Aldrich), 1% bovine serum albumin (Sigma-Aldrich) and 0.1% Triton-X100 (Sigma-Aldrich) in
PBS (blocking solution). Then, slices were incubated three days at 4 ◦ C with primary polyclonal antibody
anti-tyrosine hydroxylase (267 ng/mL, AB152, Millipore, Temecula, CA, USA) in an incubation solution
containing 1% normal donkey serum (Sigma-Aldrich), 1% bovine serum albumin (Sigma-Aldrich) and
0.1% Triton-X100 (Sigma-Aldrich). After rinsing three times in PBS for 5 min, slices were incubated with
labeled donkey anti-rabbit Alexa fluor 546 secondary antibody (1 µg/mL, A10040, Life Technologies,
Carlsbad, CA, USA) overnight at 4 ◦ C in incubation solution. Slices were then washed twice with
PBS, stained with Hoechst 33258 (2 µg/mL, Sigma-Aldrich), washed with water and mounted (Dako,
Agilent, Santa Clara, CA, USA). Fluorescence was detected by fluorescent microscopy Leica DM2000
(Leica Microsystems Srl, Solms, Germany).
4.5. Counting of Dopaminergic Neurons and Neurites
Tyrosine hydroxylase-positive (TH+) DOPAn, the number of neurites, and neurites length were
counted using a Leica DM2000 fluorescence microscope (Leica Microsystems Srl) by three separate
individuals. For DOPAn counting, all the TH positive cells in the 2/3 slices challenged with rotenone
(or vehicle) at each experimental timing were counted under a 10× magnification.
Fiji software (ImageJ) [93,94] was used to trace the neurite length of DOPAn, and then expressed
in microns. The number of neurites was expressed as the number of neurites for each cell in the treated
slices relative to the number of neurites in control. The number of DOPAn in exposed slices was
expressed relative to the number of cells in control. DOPAn neurites number and length was assessed
(20× magnification) on at least three fields for each slice challenged with rotenone (or vehicle) at each
experimental timing, to obtain morphological detail.Int. J. Mol. Sci. 2019, 20, 2224 12 of 18
4.6. Glutamate Quantification in Culture Media
The amount of extracellular glutamate, a marker of excitotoxicity, was quantified using a Glutamate
Assay Kit (MAK004, Sigma-Aldrich). Briefly, after the rotenone exposure, the supernatant was collected,
and the assay was performed according to the manufacturer’s instructions. The absorbance (450 nm),
proportional to the glutamate released in the medium, was determined using an EnSpire Multimode
Plate Reader (PerkinElmer). Glutamate release in media was expressed as fold change compared to the
control slices.
4.7. Quantitative Real-Time PCR of Selected Marker Genes
Genes reported to be involved in the biomolecular pathways of neuronal degeneration were
chosen as markers of these pathways. The mRNA expression of the genes of interest was analyzed
by quantitative real-time PCR. Total RNA was extracted using TRI Reagent® RNA Isolation Reagent
(Sigma-Aldrich), following the manufacturer’s instructions. Only mRNA samples passing the quality
test (230–260–280 nm spectrophotometric validation) were retro-transcribed and used in the study.
Complementary DNA (cDNA) was synthesized with the High Capacity cDNA Reverse Transcription
Kit (Applied Biosystems, Monza, Italy).
For the quantitative real-time PCR (qPCR), primers were designed using the Beacon Designer 4.2
software (Premier Biosoft International, Palo Alto, CA, USA) on rat sequences available in GenBank
(Table 2). The reaction was performed in an iQ5 Bio-Rad thermal cycler (BioRad Laboratories, Hercules,
CA, USA). Briefly, 25 ng of cDNA and the corresponding gene-specific sense/antisense primers (250 nM
each, except Cox2 and Il1β, 500 and 750 nM, respectively) were diluted in the Sso Advance SYBER
green supermix (Bio-Rad Laboratories, Hercules, CA, USA). The genes of interest were analyzed by
performing the qPCR as follow: 95 ◦ C for 3 min; a 40 times repetition of: 95 ◦ C for 20 s, 60 ◦ C for 20 s,
and 72 ◦ C for 30 s. Finally, the reaction was stopped by an additional step at 72 ◦ C for 5 min.
Table 2. Primers used to analyze gene expression of selected genes.
Gene Accession Number Forward 50 -30 Reverse 30 –50
Gapdh NM_017008.2 CTCTCTGCTCCTCCCTGTTC CACCGACCTTCACCATCTTG
Tbp NM_001004198.1 CAATGACTCCTATGACCCCT TTTACAGCCAAGATTCACGG
Bdnf NM_012513.4 GGACATATCCATGACCAGAA GGCAACAAACCACAACAT
Uchl1 NM_017237.3 GGAACTGAAGGGACAAGAAG ATCCATCCTCAAATTCCAGC
Vmat2 NM_013031.1 AACGTCGCCAAATGTTTAAC CAATGGATGGTGGGACTAAG
Snca NM_019169.2 ACCCCTCTTGCATTGAAATT CATGAACACATCCATGGCTA
Hmox1 NM_012580.2 GGTGATGGCCTCCTTGTA ATAGACTGGGTTCTGCTTGT
Srxn1 NM_001047858.3 AAGGCGGTGACTACTACT TTGGCAGGAATGGTCTCT
Tnfα NM_012675.2 CAACTACGATGCTCAGAAACAC AGACAGCCTGATCCACTCC
Il6 NM_012589.1 GCCCACCAGGAACGAAAGTC ATCCTCTGTGAAGTCTCCTCTCC
IL1β NM_031512.2 AACAAGATAGAAGTCAAGA ATGGTGAAGTCAACTATG
Cox2 NM_017232.3 CTTTCAATGTGCAAGACC TACTGTAGGGTTAATGTCATC
CD68 NM_001031638.1 ACTTGGCTCTCTCATTCC GACTGTACTGTGGCTCTG
Anxa5 NM_013132.1 TAATGACCAAAGCTGTCTCG TTGATTGACAGCACTTCCAA
Gapdh: Glyceraldehyde 3-phosphate dehydrogenase; Tbp: TATA-binding protein; Bdnf : Brain-derived neurotrophic
factor; Uchl1: Ubiquitin carboxy-terminal hydrolase L1; Vmat2: Vesicular monoamine transporter 2; Snca:
Alpha-synuclein; Hmox1: Heme oxygenase1; Srnx1: Sulfiredoxin 1; Tnfα: Tumor necrosis factor α; Il6: Interleukin 6;
Il1β: Interleukin 1β; Cox2: Cyclo-oxygenase 2; Cd68: Cluster of differentiation 68; Anxa5: Annexin 5.
At the end of the amplification, we performed a melting curve analysis to confirm the amplification
of the desired targets. We never observed non-specific products, primer dimers, or contaminations.
The relative quantification was made using the iCycler iQ software, version 3.1 (Bio-Rad
Laboratories, Hercules, CA, USA) by the ∆∆Ct method, taking into account the efficiencies of
the individual genes and normalizing the results to the housekeeping genes (TATA-binding protein:
Tbp, Glyceraldehyde 3-phosphate dehydrogenase: Gapdh) [95,96].Int. J. Mol. Sci. 2019, 20, 2224 13 of 18
4.8. Statistical Analysis
Data were analyzed with GraphPad Prism version 5.00 for Windows (GraphPad Software, La Jolla,
CA, USA). Statistical significance was evaluated by one-way analysis of variance (ANOVA), followed
by a Tukey-Kramer multiple comparisons test when p value < 0.05. A p value < 0.05 was considered
as statistically significant. The results are expressed as the mean ± standard deviation (S.D.). Details
on the number of independent biological repetitions for each experiment are given in figure and
table legends.
5. Conclusions
In this work, we describe the development of a slowly degenerative ex-vivo model of Parkinson
disease, used to identify the early causative mechanisms of dopaminergic neurons sufferance. Based on
our results, we suggest the simultaneous activation of inflammation and oxidative stress as triggers of
DOPAn demise, possibly sustained by glutamate neurotoxicity. Thus, we suggest a cocktail approach
with a wide spectrum anti-inflammatory, an anti-oxidant, and possibly a glutamate blocker.
Author Contributions: Conceptualization: M.D.B., S.G., R.M., C.T.; Methodology: M.D.B., S.G.; Validation: R.B.,
M.D.B., E.F., S.G.; formal analysis: M.D.B., R.B., S.G.; investigation: M.D.B., R.B., S.T., E.F., S.G.; resources: C.T.;
data curation: M.D.B., S.G.; writing—original draft preparation: M.D.B., S.G.; writing—review and editing: S.G.,
R.M., C.T.; visualization: M.D.B., S.G.; supervision: M.D.B., S.G.; project administration: S.G.; funding acquisition:
C.T., R.M.
Funding: M.D.B. was funded by U12GPFIRB11-CUP: J91J11000450001 fellowship. S.G. was supported by an
internal grant of Fondazione Italiana Fegato-Onlus. ST was supported in part by an internal grant of Fondazione
Italiana Fegato–Onlus.
Acknowledgments: We thank Paola Zarattini from the Local Animal Facility of the Università degli Studi di
Trieste, and for their kind support and help with the procedures involving the animals.
Conflicts of Interest: The authors declare no conflict of interest. The funders had no role in the design of the
study; in the collection, analyses, or interpretation of data; in the writing of the manuscript, or in the decision to
publish the results.
Abbreviations
PD Parkinson disease
DOPAn Dopaminergic neurons
SN Substantia nigra
TH+ Tyrosine hydroxylase
HY Hohen & Yhar score
PET Positron Emission Tomography
Hmox1 Heme-oxygenase 1
Srnx1 Sulfiredoxin 1
ROS Reactive oxygen species
Tnfα Tumor necrosis factor alfa α
Cox2 Cyclo-oxygenase 2
Il6 Interleukine 6
Il1 β Interleukine 1β
Cd68 Cluster of differentiation 68, marker of microglia activation
Bdnf Brain-derived neurotrophic factor
Snca Alpha-synuclein (also known as Park1,4)
Uchl1 Ubiquitin carboxy-terminal hydrolase L1 (also known as Park5)
Vmat2 Vesicular monoamine transporter 2
Anxa5 Annexin5
Glu Glutamate
Gdnf Glial cell-derived neurotrophic factorInt. J. Mol. Sci. 2019, 20, 2224 14 of 18
References
1. De Lau, L.M.; Breteler, M.M. Epidemiology of Parkinson’s disease. Lancet Neurol. 2006, 5, 525–535. [CrossRef]
2. Braak, H.; Braak, E. Pathoanatomy of Parkinson’s disease. J. Neurol. 2000, 247, II3–II10. [CrossRef]
3. Shulman, J.M.; De Jager, P.L.; Feany, M.B. Parkinson’s disease: Genetics and pathogenesis. Annu. Rev. Pathol.
2011, 6, 193–222. [CrossRef]
4. Dickson, D.W. Parkinson’s disease and parkinsonism: Neuropathology. Cold Spring Harb. Perspect. Med.
2012, 2, a009258. [CrossRef] [PubMed]
5. Dexter, D.T.; Jenner, P. Parkinson disease: From pathology to molecular disease mechanisms. Free Radic.
Biol. Med. 2013, 62, 132–144. [CrossRef]
6. Hwang, O. Role of oxidative stress in Parkinson’s disease. Exp. Neurobiol. 2013, 22, 11–17. [CrossRef]
7. Antony, P.M.A.; Diederich, N.J.; Krüger, R.; Balling, R. The hallmarks of Parkinson’s disease. FEBS J. 2013,
280, 5981–5993. [CrossRef]
8. Klemann, C.J.H.M.; Martens, G.J.M.; Sharma, M.; Martens, M.B.; Isacson, O.; Gasser, T.; Visser, J.E.;
Poelmans, G. Integrated molecular landscape of Parkinson’s disease. NPJ Parkinson’s Dis. 2017, 3, 14.
[CrossRef]
9. Reeve, A.; Simcox, E.; Turnbull, D. Ageing and Parkinson’s disease: Why is advancing age the biggest risk
factor? Ageing Res. Rev. 2014, 14, 19–30. [CrossRef] [PubMed]
10. Beal, M.F. Excitotoxicity and nitric oxide in Parkinson’s disease pathogenesis. Ann. Neurol. 1998, 44,
S110–S114. [CrossRef] [PubMed]
11. Dauer, W.; Przedborski, S. Parkinson’s disease: Mechanisms and models. Neuron 2003, 39, 889–909. [CrossRef]
12. Espay, A.J.; Schwarzschild, M.A.; Tanner, C.M.; Fernandez, H.H.; Simon, D.K.; Leverenz, J.B.; Merola, A.;
Chen-Plotkin, A.; Brundin, P.; Kauffman, M.A.; et al. Biomarker-driven phenotyping in Parkinson’s disease:
A translational missing link in disease-modifying clinical trials. Mov. Disord. 2017, 32, 319–324. [CrossRef]
[PubMed]
13. Grünblatt, E.; Mandel, S.; Jacob-Hirsch, J.; Zeligson, S.; Amariglo, N.; Rechavi, G.; Li, J.; Ravid, R.;
Roggendorf, W.; Riederer, P.; et al. Gene expression profiling of parkinsonian substantia nigra pars compacta;
alterations in ubiquitin-proteasome, heat shock protein, iron and oxidative stress regulated proteins, cell
adhesion/cellular matrix and vesicle trafficking genes. J. Neural Transm. 2004, 111, 1543–1573. [CrossRef]
14. Lin, D.; Liang, Y.; Zheng, D.; Chen, Y.; Jing, X.; Lei, M.; Zeng, Z.; Zhou, T.; Wu, X.; Peng, S.; et al. Novel
biomolecular information in rotenone-induced cellular model of Parkinson’s disease. Gene 2018, 647, 244–260.
[CrossRef]
15. Saghazadeh, A.; Rezaei, N. MicroRNA machinery in Parkinson’s disease: A platform for neurodegenerative
diseases. Expert Rev. Neurother. 2015, 17, 1–27. [CrossRef]
16. Youdim, M.B.H.; Grünblatt, E.; Levites, Y.; Maor, G.; Mandel, S. Early and late molecular events in
neurodegeneration and neuroprotection in Parkinson’s disease MPTP model as assessed by cDNA microarray;
the role of iron. Neurotox. Res. 2002, 4, 679–689. [CrossRef]
17. Yuan, H.; Zhang, Z.-W.; Liang, L.-W.; Shen, Q.; Wang, X.-D.; Ren, S.-M.; Ma, H.-J.; Jiao, S.-J.; Liu, P. Treatment
strategies for Parkinson’s disease. Neurosci. Bull. 2010, 26, 66–76. [CrossRef]
18. Zhu, M.; Li, W.-W.; Lu, C.-Z. Histone decacetylase inhibitors prevent mitochondrial fragmentation and elicit
early neuroprotection against MPP+. CNS Neurosci. Ther. 2014, 20, 308–316. [CrossRef]
19. Freitas, M.E.; Fox, S.H. Nondopaminergic treatments for Parkinson’s disease: Current and future prospects.
Neurodegener. Dis. Manag. 2016, 6, 249–268. [CrossRef]
20. Xu, L.; Pu, J. Alpha-synuclein in Parkinson’s disease: From pathogenetic dysfunction to potential clinical
application. Parkinsons Dis. 2016, 2016, 1720621.
21. Perry, V.H. Innate inflammation in Parkinson’s disease. Cold Spring Harb. Perspect. Med. 2012, 2, a009373.
[CrossRef]
22. Mandel, S.; Grünblatt, E.; Maor, G.; Youdim, M.B.H. Early and late gene changes in MPTP mice model of
Parkinson’s disease employing cDNA microarray. Neurochem. Res. 2002, 27, 1231–1243. [CrossRef]
23. Hawkes, C.H.; Del Tredici, K.; Braak, H. A timeline for Parkinson’s disease. Parkinsonism Relat. Disord. 2010,
16, 79–84. [CrossRef] [PubMed]
24. Schapira, A.H.; Cooper, J.M.; Dexter, D.; Jenner, P.; Clark, J.B.; Marsden, C.D. Mitochondrial complex I
deficiency in Parkinson’s disease. Lancet 1989, 1, 1269. [CrossRef]Int. J. Mol. Sci. 2019, 20, 2224 15 of 18
25. Sherer, T.B.; Betarbet, R.; Testa, C.M.; Seo, B.B.; Richardson, J.R.; Kim, J.H.; Miller, G.W.; Yagi, T.;
Matsuno-Yagi, A.; Greenamyre, J.T. Mechanism of toxicity in rotenone models of Parkinson’s disease.
J. Neurosci. 2003, 23, 10756–10764. [CrossRef]
26. Tanner, C.M.; Kamel, F.; Ross, G.W.; Hoppin, J.A.; Goldman, S.M.; Korell, M.; Marras, C.; Bhudhikanok, G.S.;
Kasten, M.; Chade, A.R.; et al. Rotenone, paraquat, and Parkinson’s disease. Environ. Health Perspect. 2011,
119, 866–872. [CrossRef]
27. Johnosn, M.E.; Bobrovskaya, L. An update on the rotenone models of Parkinson’s disease: Their ability to
reproduce the features of clinical disease and model gene–environment interactions. NeuroToxicology 2015,
46, 101–116. [CrossRef]
28. Blesa, J.; Przedborski, S. Parkinson’s disease: Animal models and dopaminergic cell vulnerability.
Front. Neuroanat. 2014, 8, 155. [CrossRef]
29. Cheng, H.-C.; Ulane, C.M.; Burke, R.E. Clinical progression in Parkinson disease and the neurobiology of
axons. Ann. Neurol. 2010, 67, 715–725. [CrossRef]
30. Rocha, N.P.; de Miranda, A.S.; Teixeira, A.L. Insights into neuroinflammation in Parkinson’s disease: From
biomarkers to anti-inflammatory based therapies. BioMed Res. Int. 2015, 2015, 628192. [CrossRef] [PubMed]
31. Hoehn, M.M.; Yahr, M.D. Parkinsonism: Onset, progression and mortality. Neurology 1967, 17, 427–442.
[CrossRef]
32. Bhidayasiri, R.; Tarsy, D. Parkinson’s disease: Hoehn and Yahr scale. In Movement Disorders: A Video Atlas;
Bhidayasiri, R., Tarsy, D., Eds.; Current Clinical Neurology; Humana Press: Totowa, NJ, USA, 2012; pp. 4–5,
ISBN 978-1-60327-426-5.
33. Fazio, P.; Svenningsson, P.; Cselényi, Z.; Halldin, C.; Farde, L.; Varrone, A. Nigrostriatal dopamine transporter
availability in early Parkinson’s disease. Mov. Disord. 2018, 33, 592–599. [CrossRef]
34. Braak, H.; Del Tredici, K.; Rüb, U.; de Vos, R.A.I.; Jansen Steur, E.N.H.; Braak, E. Staging of brain pathology
related to sporadic Parkinson’s disease. Neurobiol. Aging 2003, 24, 197–211. [CrossRef]
35. Liu, L.-X.; Du, D.; Zheng, T.; Fang, Y.; Chen, Y.-S.; Yi, H.-L.; He, Q.-Y.; Gao, D.-W.; Shi, Q.-L. Detecting
dopaminergic neuronal degeneration using diffusion tensor imaging in a rotenone-induced rat model
of Parkinson’s disease: Fractional anisotropy and mean diffusivity values. Neural Regen. Res. 2017, 12,
1485–1491. [CrossRef]
36. Dijkstra, A.A.; Voorn, P.; Berendse, H.W.; Groenewegen, H.J.; Netherlands Brain Bank; Rozemuller, A.J.M.;
van de Berg, W.D.J. Stage-dependent nigral neuronal loss in incidental lewy body and Parkinson’s disease.
Mov. Disord. 2014, 29, 1244–1251. [CrossRef] [PubMed]
37. Blesa, J.; Trigo-Damas, I.; Quiroga-Varela, A.; Jackson-Lewis, V.R. Oxidative stress and Parkinson’s disease.
Front. Neuroanat. 2015, 9, 91. [CrossRef]
38. Mateo, I.; Infante, J.; Sánchez-Juan, P.; García-Gorostiaga, I.; Rodríguez-Rodríguez, E.; Vázquez-Higuera, J.L.;
Berciano, J.; Combarros, O. Serum heme oxygenase-1 levels are increased in Parkinson’s disease but not in
Alzheimer’s disease. Acta Neurol. Scand. 2010, 121, 136–138. [CrossRef] [PubMed]
39. Loboda, A.; Damulewicz, M.; Pyza, E.; Jozkowicz, A.; Dulak, J. Role of Nrf2/HO-1 system in development,
oxidative stress response and diseases: An evolutionarily conserved mechanism. Cell. Mol. Life Sci. 2016, 73,
3221–3247. [PubMed]
40. McMahon, M.; Ding, S.; Acosta-Jimenez, L.P.; Frangova, T.G.; Henderson, C.J.; Wolf, C.R. Measuring
physiological responses to stressors using a novel Hmox1 reporter mouse. bioRxiv 2017, 098467. [CrossRef]
41. Chang, L.-C.; Fan, C.-W.; Tseng, W.-K.; Chein, H.-P.; Hsieh, T.-Y.; Chen, J.-R.; Hwang, C.-C.; Hua, C.-C. The
Ratio of Hmox1/Nrf2 mRNA Level in the Tumor Tissue Is a Predictor of Distant Metastasis in Colorectal Cancer.
Available online: https://www.hindawi.com/journals/dm/2016/8143465/abs/ (accessed on 29 April 2019).
42. Li, Q.; Yu, S.; Wu, J.; Zou, Y.; Zhao, Y. Sulfiredoxin-1 protects PC12 cells against oxidative stress induced by
hydrogen peroxide. J. Neurosci. Res. 2013, 91, 861–870. [CrossRef] [PubMed]
43. Zhou, Y.; Zhou, Y.; Yu, S.; Wu, J.; Chen, Y.; Zhao, Y. Sulfiredoxin-1 exerts anti-apoptotic and neuroprotective
effects against oxidative stress-induced injury in rat cortical astrocytes following exposure to oxygen-glucose
deprivation and hydrogen peroxide. Int. J. Mol. Med. 2015, 36, 43–52. [CrossRef] [PubMed]
44. Escobar, J.; Cubells, E.; Enomoto, M.; Quintas, G.; Kuligowski, J.; Martinez-Fernandez de la Camara, C.;
Torres-Cuevas, I.; Sastre, J.; Belik, J.; Vento, M. Prolonging in utero-like oxygenation after birth diminishes
oxidative stress in the lung and brain of mice pups. Redox Biol. 2013, 1, 297–303. [CrossRef]You can also read