Anatomy of a Paroxysmal Lava Fountain at Etna Volcano: The Case of the 12 March 2021, Episode - MDPI
←
→
Page content transcription
If your browser does not render page correctly, please read the page content below
remote sensing
Article
Anatomy of a Paroxysmal Lava Fountain at Etna
Volcano: The Case of the 12 March 2021, Episode
Sonia Calvari * , Alessandro Bonaccorso                       and Gaetana Ganci

                                          Istituto Nazionale di Geofisica e Vulcanologia, Osservatorio Etneo-Sezione di Catania, 95125 Catania, Italy;
                                          alessandro.bonaccorso@ingv.it (A.B.); gaetana.ganci@ingv.it (G.G.)
                                          * Correspondence: sonia.calvari@ingv.it

                                          Abstract: On 13 December 2020, Etna volcano entered a new eruptive phase, giving rise to a number
                                          of paroxysmal episodes involving increased Strombolian activity from the summit craters, lava
                                          fountains feeding several-km high eruptive columns and ash plumes, as well as lava flows. As of 2
                                          August 2021, 57 such episodes have occurred in 2021, all of them from the New Southeast Crater
                                          (NSEC). Each paroxysmal episode lasted a few hours and was sometimes preceded (but more often
                                          followed) by lava flow output from the crater rim lasting a few hours. In this paper, we use remote
                                          sensing data from the ground and satellite, integrated with ground deformation data recorded by
                                          a high precision borehole strainmeter to characterize the 12 March 2021 eruptive episode, which
                                          was one of the most powerful (and best recorded) among that occurred since 13 December 2020.
                                          We describe the formation and growth of the lava fountains, and the way they feed the eruptive
                                          column and the ash plume, using data gathered from the INGV visible and thermal camera monitor-
                                          ing network, compared with satellite images. We show the growth of the lava flow field associated
                                          with the explosive phase obtained from a fixed thermal monitoring camera. We estimate the erupted
                                volume of pyroclasts from the heights of the lava fountains measured by the cameras, and the erupted

                                          lava flow volume from the satellite-derived radiant heat flux. We compare all erupted volumes (pyro-
Citation: Calvari, S.; Bonaccorso, A.;
                                          clasts plus lava flows) with the total erupted volume inferred from the volcano deflation recorded by
Ganci, G. Anatomy of a Paroxysmal
                                          the borehole strainmeter, obtaining a total erupted volume of ~3 × 10⁶ m3 of magma constrained by
Lava Fountain at Etna Volcano: The
                                          the strainmeter. This volume comprises ~1.6 × 10⁶ m3 of pyroclasts erupted during the lava fountain
Case of the 12 March 2021, Episode.
Remote Sens. 2021, 13, 3052. https://
                                          and 2.4 × 10⁶ m3 of lava flow, with ~30% of the erupted pyroclasts being remobilized as rootless
doi.org/10.3390/rs13153052                lava to feed the lava flows. The episode lasted 130 min and resulted in an eruption rate of ~385 m3
                                          s−1 and caused the formation of an ash plume rising from the margins of the lava fountain that rose
Academic Editor: Andrew McGonigle         up to 12.6 km a.s.l. in ~1 h. The maximum elevation of the ash plume was well constrained by an
                                          empirical formula that can be used for prompt hazard assessment.
Received: 14 June 2021
Accepted: 30 July 2021                    Keywords: Etna volcano; paroxysmal explosive and effusive episodes; ash plume; remote sensing;
Published: 3 August 2021                  volcano monitoring; volcanic hazard

Publisher’s Note: MDPI stays neutral
with regard to jurisdictional claims in
published maps and institutional affil-
                                          1. Introduction
iations.
                                               Explosive eruptions of mafic magmas produce lava fountains whose heights de-
                                          pend on the exsolved volatile content of the magma, its erupted mass flux, and the ge-
                                          ometry of the vent, either an elongated eruptive fissure or a near circular conduit [1].
                                          Lava fountains were typical at Kilauea volcano during the 1959–1960, 1969–1970, and
Copyright: © 2021 by the authors.
                                          1983–2008 eruptions [2–5], being characterized by vertical jets of gas and incandescent
Licensee MDPI, Basel, Switzerland.
                                          pyroclasts rising several hundred meters above the vent. This activity is also common
This article is an open access article
                                          at Etna volcano, with several such explosive phases occurring in 2000 [6–8], 2001, 2002–
distributed under the terms and
                                          2003 [9–11], and in 2011–2015 [12–16]. The last paroxysmal lava fountain sequence started
conditions of the Creative Commons
Attribution (CC BY) license (https://
                                          on 13 December 2020, and is still going on as of 2 August 2021. A recent study, based on
creativecommons.org/licenses/by/
                                          a catalogue of the explosive paroxysmal episodes that occurred at Etna since 1986 (and
4.0/).
                                          updated to 1 April 2021), showed a general marked increase in the release of seismic energy

Remote Sens. 2021, 13, 3052. https://doi.org/10.3390/rs13153052                                         https://www.mdpi.com/journal/remotesensing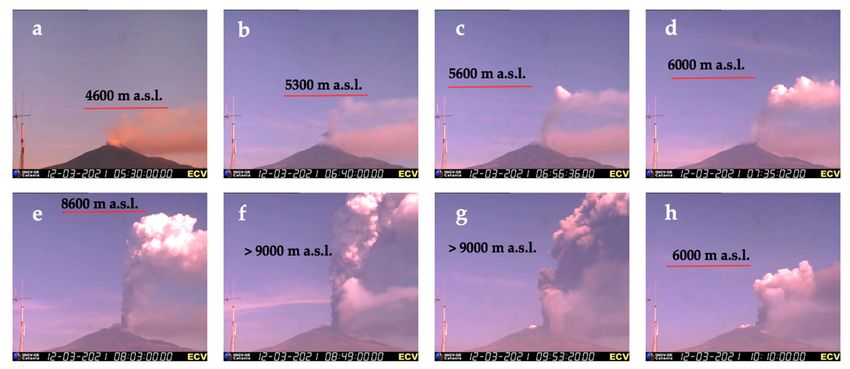
Remote Sens. 2021, 13, 3052                                                                                            2 of 23

                              over time [17]. This is in agreement with a general trend of increasing heights and volume
                              of the lava fountains and ash plumes from 2000 until now [6,8,10–12,14,15].
                                    The summit of Etna volcano comprises four main craters: Voragine, Bocca Nuova, NE
                              Crater, and SE Crater, with the addition of the newly formed New SE Crater (NSEC) built
                              up on top of the SE Crater since 2011 [14,18]. Lava fountains from the summit craters or
                              from eruptive fissures have often preceded major flank effusive activity, such as at Etna in
                              2001 and 2002–2003; thus, they were considered as possible precursors [10,11]. However,
                              the several lava fountain events between 2011 and 2015 [12,14–17,19] were not followed by
                              flank eruptions. This observation, combined with the estimation of erupted volumes from
                              the monitoring camera analyses [14,15], allowed recognizing that Etna displayed a steady-
                              state behavior for at least four decades [20–23]. Therefore, in cases such as the 2011–2015
                              lava fountains, this explosive activity can represent a modality of magma discharge able to
                              maintain the steady-state. At Etna volcano, the average output rate was estimated at 0.8
                              m3 s−1 , or 25 × 106 m3 per year [21,22]. On this basis, Bonaccorso and Calvari [22] found
                              that the magma stored within the plumbing system can be released either through a high
                              number of lava fountains, erupting volumes of ~2–3 × 10⁶ m3 each [12,14,15,22], or with
                              a small number of flank effusive eruptions, each normally releasing ~30–60 × 106 m3 of
                              lava [21,22]. Considering this conceptual model, it is not surprising that on 13 December
                              2020, after about 18 months of eruptive pause [24–27], the volcano entered a new eruptive
                              phase characterized by 57 lava fountain episodes (as of 2 August 2021) accompanied,
                              preceded, or followed by short-lasting effusive phases. Lava fountains, being characterized
                              at Etna by heights of a few km, and always accompanied by several km high ash plumes
                              generated from the same vent, raise serious concern among the local population. In fact,
                              an ash fallout up to ~38 kg/m2 [10] has a strong impact on the viability, on the stability of
                              roofs, on the air traffic (the Catania airport is a major international hub), on agriculture, on
                              water contamination, and on the health of the local population [28–32].
                                    The release of ash plumes during mild basaltic explosive activity was described and
                              analyzed only recently, when two distinct eruption styles were identified for Strombolian
                              explosions [33]. Type 1 Strombolian eruptions consist of coarse ballistic scoria (cm/dm-
                              scale) and a relatively ash-free gas plume. Type 2 Strombolian eruptions consist of an
                              ash-rich plume, with or without additional ballistic scoria. What determines type 2 ash-
                              rich Strombolian behavior is the sliding of loose clastic material into the vent [33–35], or
                              rheological changes in the uppermost magma column [36,37]. The formation of ash plume
                              during lava fountaining is even more questioned and often not considered in lava fountain
                              models [38,39]. This is because lava fountaining is considered as mostly characterized by
                              coarse ballistics falling around the vent and building spatter cones or spatter ramparts,
                              with small amounts of ash being released in the atmosphere [40–42].
                                    The formation of ash plumes is a common feature at Etna volcano, always accompany-
                              ing lava fountain eruptions [6–15,17]. Conversely, ash plume is lacking during Strombolian
                              and intermediate explosive activity [43], but is released by the summit craters during
                              rare phreatomagmatic activity [44–46]. In addition, weak and dilute ash plume may form
                              during summit collapses, occurring within the craters or pit crater formations [44,47,48].
                                    Several authors described a transitional explosive stage in between the Strombo-
                              lian and lava fountain [6,14,39,43], occurring when the discrete countable Strombolian
                              bursts increase in number and frequency, shifting to the continuous lava fountaining
                              regime [14,43]. This transition can be either abrupt or gradual [6]. At Etna, lava fountains
                              are always associated to the formation of ash plumes [6,7,10,11,14,15], and as soon as the
                              lava fountain regime starts, we observe the release of ash from the upper part of the lava
                              fountain that rises for kilometers above the crater, feeding a sustained ash plume [42].
                              However, the way a lava fountain expands vertically into a sustained ash plume, as well as
                              the timing of this process, is still little constrained. Nonetheless, sustained eruptive columns
                              and ash plumes are of great concern to local authorities in Sicily and elsewhere [17,49–51]
                              because the ash plumes may expand well beyond the national country. As an example,
                              Etna’s ash plumes also affected Malta and Greece [25,45,52,53] for several days after the
Remote Sens. 2021, 13, 3052                                                                                                   3 of 23

                              end of the eruption [54], and its gas and ash plumes even travelled the entire globe [55].
                              Even worse, the eruption of Mt St Helens in 1982 [49], Pinatubo in 1991 [56], and the
                              Icelandic volcano Eyjafjallajökull in 2010 caused air traffic disruption for about a month
                              across Europe [50,51].
                                    In this paper, we have analyzed, in detail, one of the most powerful (and best recorded)
                              lava fountains taking place between 13 December 2020, and 20 July 2021, namely the
                              episode of 12 March 2021, which occurred during good weather conditions and in the
                              daytime (Figure 1), and enabled the collection of excellent data from the ground and
                              satellite. We present details on the lava fountains and their connections with ash plume and
                              lava flow field formation, as well as persistence and decline gathered from a network of
                              ground-based monitoring cameras and from high temporal resolution satellite sensors (e.g.,
                              SEVIRI, MODIS, and VIIRS). We compare the timing and volumes obtained from these
                              devices with results from the reference borehole strainmeter [57,58], in order to highlight
                              key processes that characterize the phenomenon and are useful for hazard assessment. In
                              particular, we analyze the formation and growth of the lava fountain and of the associated
                              lava flow field, the timing, and how the fountain feeds the ash column and eruptive plume.
                              Our focus was to acquire parameters that could be useful for prompt hazard assessment.

                              Figure 1. Photo of Etna paroxysmal episode on 12 March 2021. The shot was taken at 08:50 UTC from
                              the main road (Etnea Street) crossing N–S the city of Catania. The view is from south (photo by A.B.).

                              2. Methods
                              2.1. Camera Networks
                                  We used the monitoring camera network installed and maintained by the Istituto
                              Nazionale di Geofisica e Vulcanologia (INGV) Osservatorio Etneo-Sezione di Catania,
                              comprising thermal and visible cameras, in order to detect and quantify the phases of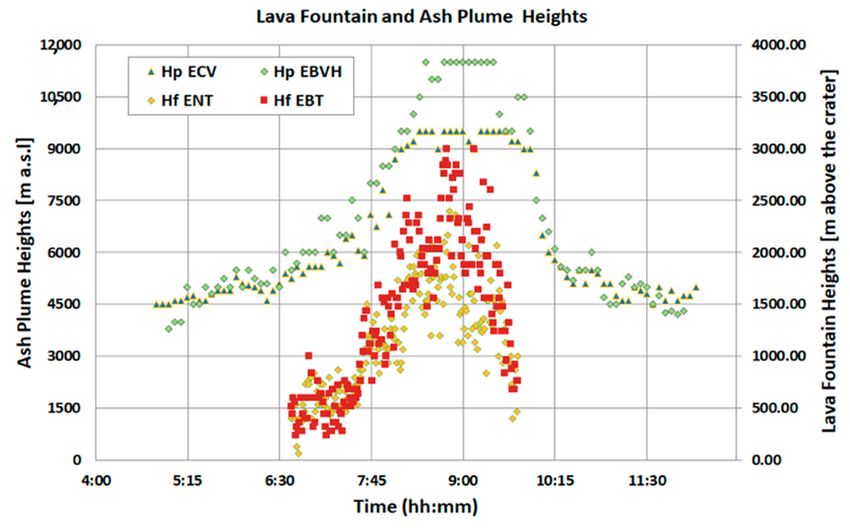
Remote Sens. 2021, 13, 3052                                                                                                       4 of 23

                                     eruptive activity. Our aim was to define the timing of its changes, as well as the height of
                                     the lava fountains and ash plume, the erupted volume of pyroclastics and the expansion of
                                     the lava flow field, and of their timing—parameters that are essential for hazard assessment
                                     at a frequently erupting volcano. The labels of the cameras used in this paper, as well as
                                     their main features, viewing direction, and average distance from the craters, are listed in
                                     Table 1, and their positions are shown in Figure 2. The height of the lava fountains was
                                     obtained from the thermal cameras ENT and EBT located on the S and NW flanks of the
                                     volcano, respectively. The error in the height measurement is ±50 m [14,15]. These heights
                                     were used to calculate the erupted volume of pyroclasts, following the method developed
                                     by Calvari et al. [14,15]. This method consists in measuring the lava fountain height on
                                     thermal images with a 1-minute time lapse, and applying the Equation (1):

                                                                                v = (2gh)0.5                                           (1)

                                     for the calculation of the flux of gas and pyroclasts through the vent section. In Equation (1),
                                     v is the velocity of the mixture comprising gas plus pyroclasts, g is the acceleration of gravity,
                                     and h is the lava fountain height, expressed in meters above the crater rim. The NSEC
                                     vent section, following Calvari et al. [14,15], was considered circular, with a vent diameter
                                     of 30 m. By integrating the velocity of the gas plus pyroclasts mixture over the entire
                                     duration of the lava fountain, multiplied by the vent section area, and extracting from
                                     the final value the 0.18%, which represents the average amount of pyroclasts within the
                                     fluid mixture [14,15], we obtain the volume of pyroclasts erupted during the lava fountain
                                     episode. It is worth noting that the growth of the NSEC cinder cone during one single
                                     lava fountain episode is not enough to affect our measurements of lava fountain or ash
                                     plumes [18].

      Table 1. List of the INGV monitoring cameras used in this paper and their main features. The field of view is considered at
      the crater rim.

                                                                       Distance from the
         Label                    Type                Location                                  Frame Rate          Field of View
                                                                         Craters (km)
                                                   Nicolosi, South
                                Thermal                                                                             24◦ (horizontal)
          ENT                                           flank                 15.0              2 frames/s
                               FLIR A40M                                                                             18◦ (vertical)
                                                    730 m a.s.l.
                                Thermal           Bronte, NW flank                                                  25◦ (horizontal)
          EBT                                                                 13.5              2 frames/s
                               FLIR A320             85 m a.s.l.                                                    18.8◦ (vertical)
                                                 Mt. Cagliato, East
                                Thermal                                                                             25◦ (horizontal)
         EMCT                                          flank                   8.3              2 frames/s
                               FLIR A320                                                                            18.8◦ (vertical)
                                                   1160 m a.s.l.
                                                 Montagnola, South
                                Thermal                                                                             25◦ (horizontal)
        EMOT                                          flank                    3.0               1 frame/s
                               FLIR A320                                                                            18.8◦ (vertical)
                                                   2600 m a.s.l.
                                                 Mt. Cagliato, East                                                     33◦ ~93◦
                                 Visible
        EMCH                                           flank                   8.3             2 frames/min          (horizontal),
                              Vivotec IP8172
                                                    390 m a.s.l.                                                   24◦ ~68◦ (vertical)
                                                  Catania Nesima,
                                 Visible                                                                          3–47.5◦ (horizontal
          ECV                                       South flank               26.7              1 frame/2 s
                              Canon VC-C4R                                                                           and vertical)
                                                     35 m a.s.l.
                                                  Catania Nesima,                                                       33◦ ~93◦
                                 Visible
         ECVH                                       South flank               27.0             1 frame/min           (horizontal),
                              Vivotec IP8172
                                                     35 m a.s.l.                                                   24◦ ~68◦ (vertical)
                                                                                                                        33◦ ~93◦
                                 Visible          Bronte, NW flank
         EBVH                                                                 13.5             1 frame/min           (horizontal),
                              Vivotec IP8172         163 m a.s.l.
                                                                                                                   24◦ ~68◦ (vertical)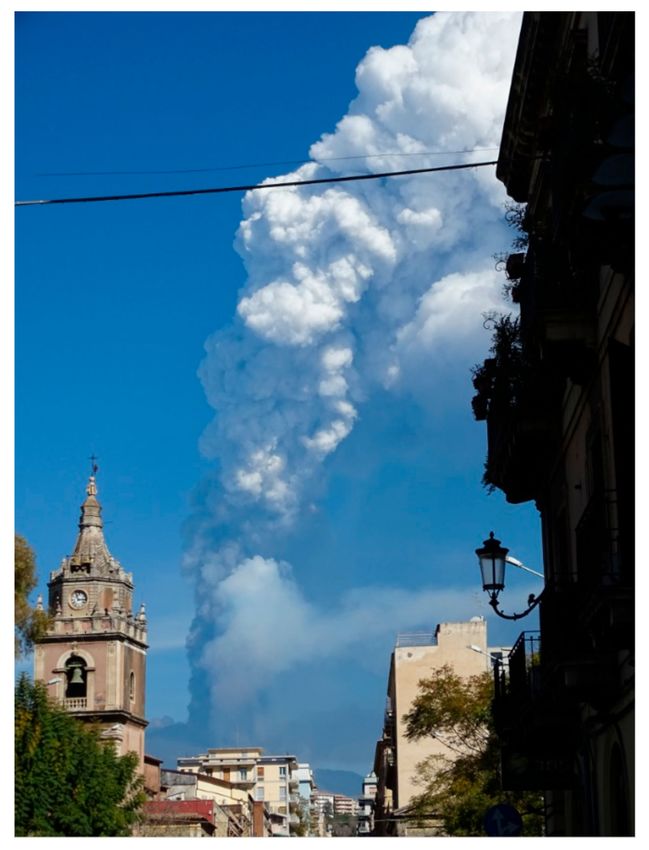
Remote Sens. 2021, 13, 3052                                                                                                5 of 23

                              Figure 2. Map of INGV monitoring cameras and borehole strainmeter (DRUV) used in this paper.
                              The pale blue area shows the portion of topography that can be imaged by the EMCT and EMCH
                              cameras, used for the emplacement of the 12 March 2021, lava flow field. The Northeast Crater (NEC),
                              Voragine (VOR), Bocca Nuova (BN), Southeast Crater (SEC), and New Southeast Crater (NSEC)
                              summit craters are indicated in the yellow frame inset. The blue color is for visible cameras, the
                              purple color is for thermal cameras.

                                   The height of the ash plume was measured from the calibrated [59–61] visible cameras
                              ECV and EBVH located on the S and NW flank of the volcano, respectively. ECV has
                              a maximum vertical field of view of ~9.0–9.5 km above sea level (a.s.l.), whereas EBVH
                              allows the detection of ash plumes up to ~12.5 km a.s.l., depending on the wind speed and
                              direction [59–61].
                                   The EMCT thermal camera (Table 1 and Figure 2) was used to follow the lava flow
                              emplacement associated with the lava fountaining activity [62,63]. This camera is located
                              ~8.3 km east of the summit craters (Figure 2, Table 1). Thermal images acquired from EMCT
                              are currently received in real time and stored as RGB files. A routine was implemented to
                              automatically process the images. The images are reprojected on the topography, consider-
                              ing the position and orientation of the camera. To detect the active portion of the lava flow,
                              a threshold is set at 245 for the red channel. This threshold was found by considering the
                              histogram images of recorded values in the presence—or not—of lava flow. Concerning
                              the topography, a digital elevation model derived from Pleiades images and updated in
                              2020 is taken into account.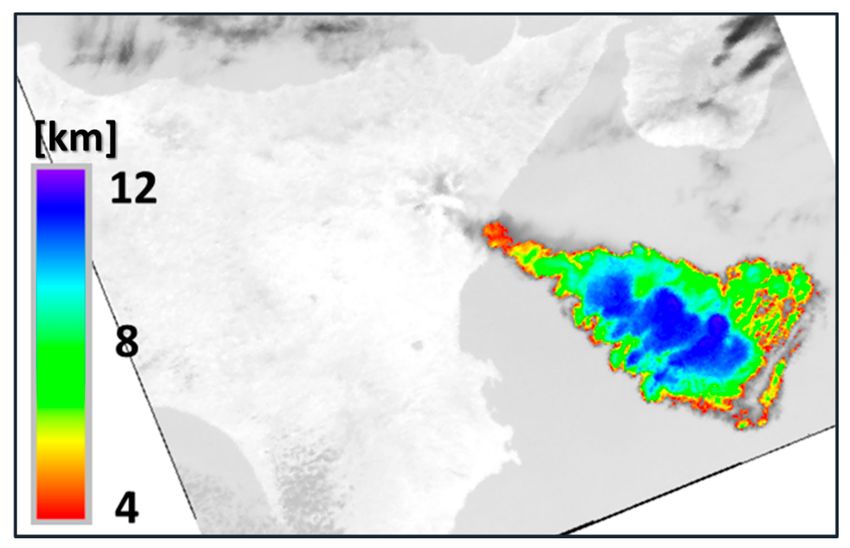
Remote Sens. 2021, 13, 3052                                                                                           6 of 23

                              2.2. Satellite Thermal Monitoring
                                   Low spatial-high temporal resolution satellite images (1–3 km pixel at nadir, 6 h—up
                              to 5 min frequency), such as those acquired by SEVIRI, MODIS, and VIIRS, are currently
                              used to follow the eruptive activity at Mount Etna. Due to the short-lived nature of the
                              lava fountains that occurred to date in 2021, SEVIRI aboard the geostationary Meteosat
                              Second Generation, providing information at 15 to 5 min sample times, is the best sensor
                              to describe the evolution of the eruptive phenomena [62,64,65]. The thermal anomalies
                              related to the volcanic activity can be located in the satellite images by processing the
                              middle infrared (MIR) channel that is particularly sensitive to high temperature events.
                              The automatic system HOTSAT [66] was used to process these data. Besides locating
                              the thermal anomalies, HOTSAT also computes the radiant heat flux by quantifying the
                              thermal anomaly in each image. From a temporal sequence of images, a radiant heat flux
                              curve can be retrieved, and the timing of an eruptive event can be determined. In the
                              case of effusive events, this curve can provide an estimation of the eruption rate, i.e., it
                              can be converted into a time averaged discharge rate (TADR; [64,67–69]), TADR being
                              an essential parameter for defining the size and magnitude of a volcanic eruption [40,68].
                              This conversion entails some assumptions [70], among which the thermal steady state
                              needs to be reached [71]. Lava fountains are very fast and transient events, so converting the
                              radiant heat flux into TADR is not possible. Indeed, during the climax phase, saturation and
                              plume obscuration occur, increasing the uncertainties on the peak values of radiant heat flux.
                              To overcome these limitations, the method developed by Ganci et al. [65] was applied here.
                              This method considers the surface temperature for a stagnant, stable, cooling lava sur-
                              face as a function of time following the solution of the Stefan cooling problem [68,72].
                              The satellite-derived radiant heat flux depends on the radiative heat flux density due to
                              the surface temperature and the area of cooling lava. The erupted volume of lava is hence
                              computed by modeling the cooling curve apparent in the satellite-derived radiant heat
                              flux curve. A minimum and a maximum range of thickness are assumed for the lava
                              flow field, and the actual curve is constrained between two modeled curves by using the
                              Nelder–Mead algorithm.
                                   SEVIRI, MODIS, and VIIRS data were also used to compute the volcanic Ash Cloud
                              Top Height (ACTH). In this work, this value was derived by comparing the brightness tem-
                              perature for the pixels contaminated by the volcanic plume with atmospheric temperature
                              profiles. Data for the atmospheric profiles were downloaded with hourly frequency, regrid-
                              ded to a regular lat–long grid of 0.25 degrees, from ERA5, the fifth generation ECMWF re-
                              analysis for the global climate and weather (available at https://cds.climate.copernicus.eu/,
                              accessed on 2 August 2021). The radiances acquired in the thermal infrared were cor-
                              rected for atmospheric effect by using the MODTRAN (MODerate resolution atmospheric
                              TRANsmission) model and converted to brightness temperatures by using the Planck law.
                              We computed the Brightness Temperature Difference (BTD) between channels IR12.0 and
                              IR10.8 to highlight the presence of ash/SO2 plume, so we also computed the area of the
                              volcanic cloud as seen from space for each image. In order to compare the temperature at
                              the top of the volcanic cloud with the temperature of the atmospheric profile, we developed
                              a MATLAB routine that interpolated the atmospheric profile at the measured value of
                              temperature and provided the correspondent height. The interpolation is made through
                              the MATLAB function spline. The method assumes that the top layer volcanic ash cloud
                              behaves as a blackbody, and it is opaque; the assumption can cause significant overesti-
                              mation of the cloud top temperature and, therefore, underestimation of the volcanic ash
                              height if there are multilayer clouds under the top volcanic ash layer. Moreover, for high
                              clouds near the tropopause and at high latitudes, the method can lead to errors because
                              the rate of temperature change with height is small [73]. However, reanalysis of regional
                              atmospheric products was used for ACTH estimations at the Etna volcano during recent
                              eruptions [25,52]; the results of these models for lava fountains at Mount Etna were also
                              validated with other ground-based approaches [59]. Finally, higher spatial resolution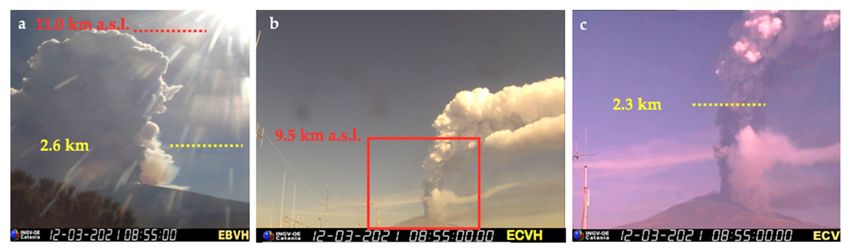
Remote Sens. 2021, 13, 3052                                                                                              7 of 23

                              images, such as those acquired by Sentinel-2 MSI, Landsat 8, and Aster, were used to locate
                              and map the active or recently emplaced lava flow field [74,75].

                              2.3. High Precision Strain from the Borehole Dilatometer
                                   A network composed of deep borehole dilatometers was installed on Etna in 2011
                              (two stations) and 2014 (further two stations). The dilatometers measure the volumetric
                              strain of the rocks where they are installed, reaching nominal resolution of 10−10 to 10−11 ,
                              and guaranteeing a frequency range from 10−7 to >20 Hz. The instruments are usually
                              installed into deep drilled holes (depth > 100 m) to reduce environmental noise, mainly
                              the thermoelastic strain effects, to better exploit their high sensitivity. The instruments
                              are coupled to the rock by using expansive cement and they require final calibration after
                              installation. The calibrations are usually performed by comparing the recorded strain with
                              the estimated reference signals, such as those produced by lunar tides, mainly the diurnal
                              O1 (25.82 h) and the semidiurnal M2 (12.42 h) [58]. Other approaches are also implemented
                              by comparing the recorded dynamic strain amplitude of long-period surface waves from
                              strong distant earthquakes [76] or by direct comparison of the strain recorded by the
                              borehole dilatometer with the seismic strain of teleseismic waves, recorded by a nearby
                              broadband seismic array [77]. A detailed description of the installations, instrumental in
                              situ calibrations, and main results are fully described by Bonaccorso et al. [76,78]. In this
                              study, we used the signal from the most precise station, namely DRUV. This dilatometer
                              was installed at a depth of 172.5 m within a very massive basalt layer in the mid-western
                              flank of the volcano at about 10 km away from the summit craters (Figure 2). All previously
                              cited calibration approaches were successfully applied to the strain recorded at this station
                              obtaining the same calibration coefficient [58,76–78]. This is considered the reference station
                              since, as testified by the in situ calibrations, it has a >20 times more precise sensitivity than
                              the other stations.

                              3. Eruptive Activity before the 12 March 2021, Paroxysm
                                   In the recent years, Etna volcano often displayed sequences of lava fountain events,
                              mostly occurring from the SE Crater (SEC), and more recently from the NSEC [6,8,9,11,17].
                              These are characterized by the development of associated ash plumes and short-lived
                              lava overflows from the crater rim [6–11,17]. Several periods of lava fountain activity
                              characterized the growth of the SEC: in 1989 (16 lava fountains), in 1998–1999 (22), in
                              2000 (64), in 2001 (15), and in 2013–2015 (49) [8,14,15,17]. The first, most relevant of these
                              sequences occurred in 2000, when during the six months (spanning between January and
                              June) the SEC produced 64 such episodes [8]. This episodic activity was triggered by more
                              primitive and gas-rich magma entering the SEC reservoir, where it mixed with the resident
                              and more evolved magma, giving rise to a gas bubble foam layer accumulated at about
                              1.5 km depth below the erupting crater [7,8,57]. In general, paroxysmal episodes taking
                              place close in time are generally impulsive and characterized by rapid waxing and waning
                              phases compared to the episodes more distant in time that show a slower pattern [17].
                                   Following the short flank eruption on Etna in December 2018 [25,27], the volcano had
                              another effusive phase from the summit craters between 30 May and 6 June 2019, when
                              some short fissures opened at the base of the NSEC, feeding a lava flow field that spread
                              eastwards [26,79]. Once this eruptive activity ended, the summit craters of the volcano
                              displayed a mild Strombolian explosive activity with occasional ash emission. On 18 July
                              2019, an effusive vent opened at the base of the NSEC, producing a small lava flow that
                              spread NE for a few kilometers. This lava flow stopped on the evening of 20 July 2019.
                              Another effusive vent opened on 27 July 2019, at the S base of the NSEC, producing a
                              lava flow that spread towards SW and S for several hundred meters and stopped the next
                              day. The Strombolian explosive activity at the summit craters continued during the year,
                              accompanied by occasional and pulsating ash emissions, and producing an intra-crater
                              cinder cone and a several hundred-meter-long lava flow within the Voragine crater in
                              September 2019. From October 2019, the summit craters of the volcano displayed a mild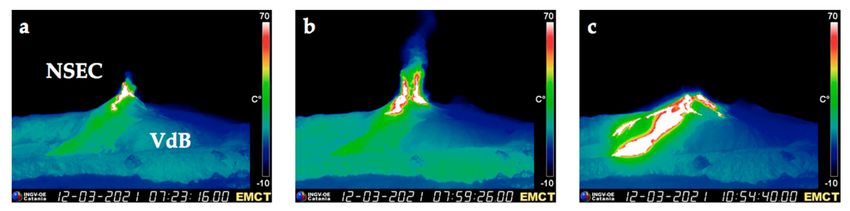
Remote Sens. 2021, 13, 3052                                                                                            8 of 23

                              Strombolian explosive activity with occasional dilute ash emission [80]. In December 2019,
                              the explosive activity increased in intensity, with bomb spatter and ballistics falling on
                              the outer flanks of the NSEC, and a lava flow erupted from the Voragine crater, spreading
                              within the nearby Bocca Nuova crater. This eruptive activity continued in 2020, intensifying
                              during February–early March 2020 [80], when up to three scoria cones built up within
                              the Voragine crater by March 2020. A complex lava flow field fed by the Voragine vents
                              was spreading within the nearby Bocca Nuova crater, lasting until the end of April 2020.
                              The Strombolian explosive activity continued at all summit craters with occasional dilute
                              ash emissions, increasing in May 2020, and forming ash clouds rising several hundred
                              meters above the craters. Several such ash clouds were also observed from June and August
                              2020 until 13 December 2020, when the first episode of lava fountaining occurred at the
                              NSEC, accompanied by lava flow output from the crater rim spreading S. The collapse of
                              a portion of the crater rim caused three pyroclastic density currents (PDC) spreading S,
                              SW and SE from the base of the cone for several hundred meters. The explosive activity
                              climaxed into an additional lava fountaining episode on 14 December 2020, and a lava flow
                              from the NSEC spreading S on 15 December 2020. Additional lava fountaining episodes
                              and lava flow outputs occurred on: 21 and 22 December 2020, 18 January 2021; on 16,
                              17, 19, 20, 22, 23, 24, and 28 February 2021; on 2, 4 (two episodes), 7, 9, 12, 14, 17, 19, 23,
                              and 31 March 2021, on 19, 21, 22, 24, 25, 26 (three episodes), 27, 28 (four episodes), and
                              30 May 2021, on 2, 4, 12, 16, 17, 19, 20, 22, 23 (two episodes), 24, 25 (two episodes), 26,
                              27, and 28 June 2021; and on 1, 4, 6, 8, 14, 20 and 31 July 2021 (see activity reports of
                              INGV-OE at https://www.ct.ingv.it/index.php/monitoraggio-e-sorveglianza/prodotti-
                              del-monitoraggio/bollettini-settimanali-multidisciplinari, accessed on 2 August 2021).

                              4. Results
                                   The chronology of the eruptive events was gathered from the analysis of the images
                              acquired by the INGV monitoring network, comprising visible and thermal cameras
                              (Table 1 and Figure 2) and allowing a view of the volcano from various distances and
                              directions, and by satellite. All times indicated in this paper are UTC.

                              4.1. Eruptive Events and Characterization of the Lava Fountain and Ash Plume
                                   The Strombolian activity at the NSEC, observed from the INGV network of monitoring
                              cameras (Figure 2 and Table 1), started on 12 March 2021, at 02:35, gradually increasing in
                              frequency, height, and intensity of the jets. Table 2 summarizes the timing of the events as
                              observed by the monitoring cameras and satellite, also complemented by strain informa-
                              tion. At 06:40 the activity became transitional between Strombolian and lava fountaining
                              (Figure 3a), and at 07:00 a lava flow breached the lower eastern rim of the crater spreading
                              E within the Valle del Bove depression (VdB; Figures 2 and 3b). At 07:22 a second overflow
                              occurred from the NE margin of the crater rim, expanding on the N flank of the crater
                              (Figure 3b). At 07:35, the explosive activity became a clear lava fountaining, accompa-
                              nied by significant ash emission and fast formation and growth of an eruptive column
                              (Figure 3b). The third lava flow started spreading SE from 09:20 (Figure 3c).
Remote Sens. 2021, 13, 3052 9 of 23
Table 2. Timing of the 12 March 2021, eruptive episode retrieved from the INGV monitoring cameras, from the satellite and
strain signal. IER = instantaneous effusion rate [68].
Time UTC Eruptive Activity Notes
02:35 Strombolian activity started at the NSEC Figure 7
First satellite thermal anomaly detected
02:56 Figure 7
and Strombolian activity intensified
05:00 Plume already reached 4000 m a.s.l. Figures 5 and 6a
Transitional activity between Strombolian
06:40 Figures 3a and 6b
and lava fountaining started at NSEC
Lava flow output started from the E rim
07:00 Figure 3a
of NSEC, expanding E
A second lava flow started from the NE
07:22 rim of NSEC, expanding N, strain Figure 3b
suddenly declining
Lava fountaining phase with significant
ash emission and formation of an
07:35 Figures 3b and 6d
eruptive column, 20–30 m s−1 of muzzle
velocity
Radiant heat flux increased from satellite,
07:35–08:56 muzzle velocity of ~70 m s−1, strain rate Figure 9
increased
Maximum muzzle velocity of 133 m s−1
08:14
reached by the lava fountain
Maximum plume height of 11.3 km a.s.l.
08:30 Figures 4 and 5
detected from EBVH
Maximum elevation reached by the lava
fountain of 3000 m above the crater rim
08:47–08:49 (from EBT), and of 2400 m above the Figures 4b and 5
crater rim (from ENT) and peak IER of
276 m3 s−1
Peak value of 35 GW measured from
08:57 Figures 5 and 9
satellite and peak value from strain
09:05–09:30 The ash plume started declining in height Figure 5
A third lava flow started from the SE rim
09:20 Figure 3c
of NSEC, expanding SE
Lava fountain ended, strain declining
09:45 Figure 3c
stopped
The ash plume dropped below 6.0 km
10:10–10:15 Figure 5
a.s.l.
10:54 Explosive paroxysm ended Figure 3c
Lava flow output ended and lava flow
12:00
field coolingRemote Sens. 2021, 13, 3052 10 of 23
Figure 3. The output of three lava flows from the crater rim of the New Southeast Crater (NSEC), observed by the EMCT
thermal camera located on the E flank of the volcano, on 12 March 2021. North is on the right, south is on the left. See
Figure 2 for camera location and Table 1 for its characteristics. (a) Thermal image recorded at 07:23:16 showing the first
lava flow (white) spreading E along the western wall of the Valle del Bove (VdB). (b) Thermal image recorded at 07:59:26
showing the lava fountain with the ash plume (blue), and the second lava flow spreading N (white, right of the image).
(c) Thermal image recorded at 10:54:40 showing the crater inactive, and in white the three lava branches slowly expanding.
The height of the lava fountain, detected from the ENT (S flank) and EBT (NW
flank, Figure 2 and Table 1) thermal cameras, gradually increased up to 08:49, when it
reached the maximum elevation of 2400 m above the crater rim and the peak instantaneous
effusion rate (IER, averaged over a shorter lapse of time than the effusion rate [68]) of
276 m3 s−1 (Table 2). The muzzle velocity, obtained from the EMOT camera which is
closer to the summit vents, was only 20–30 m s−1 during the initial phase of fountaining,
increased to ~70 m s−1 after 08:05, and reached the peak of 133 m s−1 at 08:14 (Table 2).
Then the fountain height decreased, stopping at 09:45 (Table 2), after a duration of 130 min
(Figure 3). The average fountain height, calculated from the values measured every minute
with the ENT camera, was 1149 m.
The height of the ash plume was measured on the frames overlapped on the visible
images recorded by the ECV and EBVH visible cameras, located on the S and NW flank of
the volcano, respectively (Figures 2 and 4, Table 1), using the calibrated images automati-
cally provided by the procedure developed by Corradini et al. [59] and Scollo et al. [60,61].
The images of the ash plume are displayed in Figure 4, and the results of the ash plume
heights against time are shown in Figure 5, where they are compared with the heights of
the lava fountains retrieved from the ENT and EBT thermal cameras.
Figure 4. Heights and shapes of the 12 March 2021 ash plume at 08:55 imaged from (a) the EBVH calibrated camera located
on the NW flank of the volcano where it reached 11.0 km above sea level (red dotted line) and with the lava fountain
measuring 2.6 km above the crater rim (yellow dotted line), from (b) the uncalibrated ECVH camera located on the S flank
of the volcano, with the red box displaying the area imaged in (c) and related to the ECV calibrated camera field of view,
located in the same position as the ECVH, and having a maximum vertical field of view up to 9.5 km elevation above sea
level, and displaying the elevation of the lava fountain (yellow dotted line) estimated at 2.3 km above the crater.Remote Sens. 2021, 13, 3052 11 of 23
Figure 5. Heights of the lava fountain (Hf, in m above the crater rim) obtained from the ENT and the EBT thermal cameras,
compared to the heights of the ash plume (Hp, in m above sea level) obtained from the ECV and EBVH visible cameras
against time (hh:mm, UTC).
It is worth noting that although the lava fountain phase started at 07:35, the elevation
of the plume was more than 4000 m above sea level (a.s.l.) much earlier, and at least from
dawn at 05:00 when the ash plume became visible (Figures 5 and 6, Table 2). This was
probably owing to the heat released by the Strombolian activity that started at the NSEC at
02:35 (Figure 3a and Table 2). However, at that time, it was a weak plume bent eastward
and comprising mostly diluted reddish ash (Figure 6a). At 06:40, as soon as the explosive
activity became transitional [4,14,43] between Strombolian and lava fountaining, the ash
plume rose to 5300 m a.s.l. and changed inclination (Figure 6b), suddenly becoming more
vertical as a result of an increased IER~120 m3 s−1 and displaying increasing water vapor
condensation at the top (Figure 6c–e).
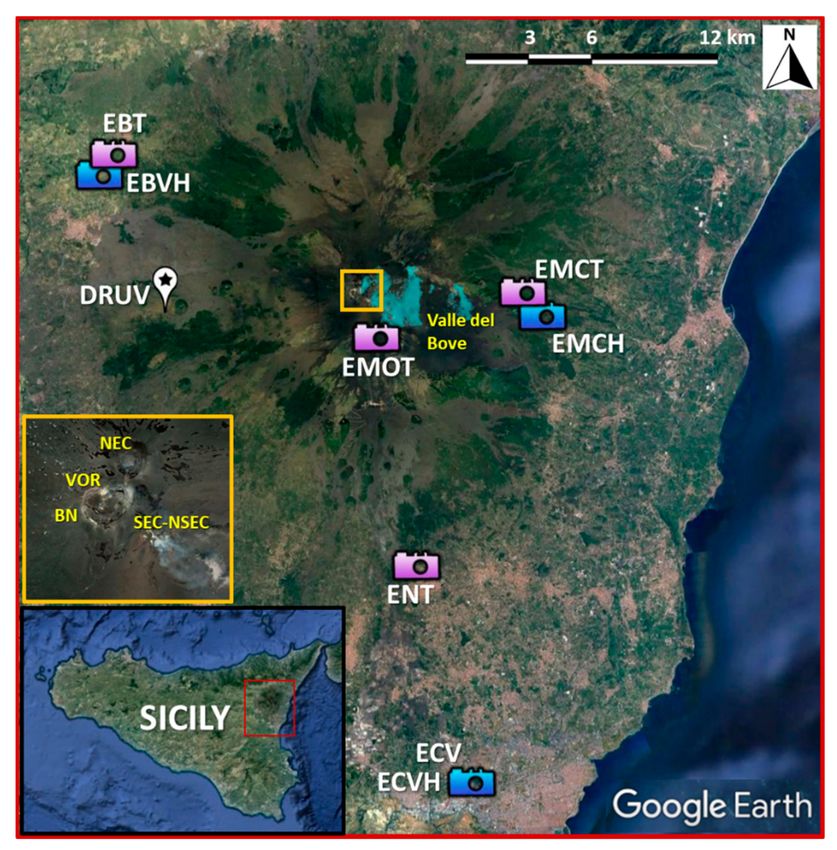
Figure 6. Heights and shapes of the 12 March 2021, ash plume imaged from the ECV calibrated camera. The vertical field of
view reaches ~9.0 km above sea level. (a) Weak plume at 05:30; (b) weak ash plume at 06:40, with an upper part becoming
more vertical; (c) intermediate ash plume at 06:56, with water vapor condensation at top; (d) intermediate ash plume at
07:35, when the lava fountain starts; (e) strong vertical plume at 08:03, slightly bent eastward (right) in the uppermost
portion; (f) strong plume at 08:49, with a lower and more diluted cloud caused by the lava flow expanding eastward; (g) ash
plume bending eastward after the end of the lava fountaining at 09:53; (h) ash plume decreasing in height at 10:10.Remote Sens. 2021, 13, 3052 12 of 23
The amount of water vapor condensation at the top of the eruptive column increased
even more after 07:35, when the eruptive activity became lava fountaining (Figure 6d–f).
The increased IER~153 m3 s−1 resulted in the formation of a strong plume extending
vertically above the vent, with only the uppermost portion being bent eastward by the
wind (Figure 6e). The ash plume went beyond the ECV camera field of view (i.e., more
than 9.0–9.5 km a.s.l.) as soon as the lava fountain attained its peak IER of 252–276 m3
s−1 at 08:47–08:49 (Table 2 and Figure 6f). At this stage, the lava flow field spreading
eastward increased its speed significantly, as observed by satellite (Table 2) and also by
the appearance of a lower steam cloud produced by the heat released by the lava flow
(Figure 6f). The ash plume started to drop several minutes after the lava fountaining
stopped (Figure 6g), but its disappearance was evident only after 10:10 (Figure 6h), about
30 min after the end of the lava fountaining phase.
The maximum plume elevation was not recorded by the ECV camera because its
maximum field of view reaches ~9.0–9.5 km a.s.l. [60], but probably also the EBVH camera
gave a slightly underestimated maximum ash plume elevation, given that the maximum
elevation of 11.5 km a.s.l. was observed at 08:30 (Table 2 and Figure 5), whereas the
maximum elevation of the lava fountains was attained at 08:49 from ENT (2.4 km above
the crater rim, Table 2; average value 1.15 km).
The lava fountain heights decreased soon after having reached the peak values (i.e.,
at 08:50 from ENT; Figure 5), whereas the ash plume started decreasing in height at 09:05
from ECV and at 09:30 from EBVH, with a delay of 18–43 min (Figure 5).
Given that ash plume can be a serious threat to airport and airplane viability due to
the proximity of Mount Etna with the Catania international airport (~32 km), we need to
estimate the maximum elevation that the ash plume can attain, as well as its direction, as
soon as possible, in order to provide prompt advice to the Civil Protection and Air Traffic
Authorities. In this regard, the average lava fountain height is a key parameter because
it allows us to estimate the maximum plume elevation as soon as the peak height of the
lava fountain is reached. From the data recorded during the 2011–2013 lava fountains from
NSEC, Calvari et al. [15] proposed the following empirical equation:
HP = 5.26 HF + 6.83 (2)
where HP is the maximum height reached by the ash plume, and HF is the average height
of the lava fountain. Considering an average lava fountain height of 1.15 km above the
crater rim, and applying the formula (2) by Calvari et al. [15], the estimated maximum
plume height is 12.9 km, close to the real value of 11.5 km a.s.l. estimated from the EBVH
monitoring camera (Figure 4a).
The difference in elevation for the lava fountain and ash plume obtained from the
different cameras can be due to the irregular shapes of the lava fountain and ash plume,
and/or to the ash partially obscuring the sight at the thermal image. Although the lava
fountain suddenly stopped at 09:45, the ash plume was above 9.0 km a.s.l. at least for
10 additional minutes (until 09:55), and started to decrease below 6.0 km a.s.l. only after
10:10–10:15, with a delay of about 30 min (Figure 5).
On the basis of the lava fountain heights measured from the ENT camera, we estimated
the volume of pyroclasts erupted during the lava fountain episode, following the method
proposed by Calvari et al. [14,15]. The resulting volume is ~1.6 × 10⁶ m3 , which, averaged
over the 130 min of duration of the event, gave a time-averaged discharge rate (TADR; [68])
of ~209 m3 s−1 and a peak instantaneous effusion rate (IER, [68]) of 276 m3 s−1 recorded at
08:49.
4.2. Satellite Thermal Data
Processing satellite images enables us to derive: (i) the timing of eruptive activity as
seen from space; an estimation of the (ii) area; and (iii) volume for the lava flow field and
of (iv) the top height for the ash plume. The first thermal anomaly, related to the 12 March
eruptive episode, was detected by SEVIRI at 02:56 when the Strombolian activity intensifiedRemote Sens. 2021, 13, 3052 13 of 23
(Table 2). This anomaly was followed by a constant increase in the satellite-derived radiant
heat flux mainly related to the lava flow spreading, as also visible from the lava flow area
increase imaged by the EMCT thermal camera (Figure 7b). A first increase in the radiant
heat flux signal was recorded at 6:42 and a second sharp increase occurred at 08:12, with
a peak value of ~25 GW at 08:57 (Table 2). After this a constant decrease, related to the
cooling of the lava flow, was observed. Due to the low spatial resolution of SEVIRI images
at Etna volcano, we are not able to distinguish between the radiant heat flux curve coming
from the lava fountain and the contribution related to the lava flow field. Most of the
thermal signal is due to the lava flow emplacement as shown by the comparison with the
lava flow field growth recorded by the EMCT thermal camera (Figure 7a,b). This happens
for two reasons: the first is that the SEVIRI pixel over the summit crater saturates, and the
second one is that the eruptive column above the lava fountain covers the view from the
satellite. Applying the method by Ganci et al., [64], the satellite-derived cooling curve was
modeled and a lava flow volume of ~2.4 × 10⁶ m3 was estimated.
Figure 7. (a) Map of the lava flow derived from the thermal camera EMCT superimposed on the RGB composite (Band 12,
Band 11, Band 5 at 20 m spatial resolution) of the Sentinel-2 image acquired on 13 March at 09:50. The projected map of
the lava flow is cut in order to remove the jet portion of the lava fountain. (b) Thermally anomalous area detected from
the EMCT thermal camera against time (red squares), compared with the radiant heat flux curve retrieved from SEVIRI
(blue diamonds).
Figure 7b shows the SEVIRI-derived radiant heat flux versus the active lava flow
area as imaged by the EMCT thermal camera. We found a slight difference between the
two signals at the beginning and at the end because the oblique view from the camera
missed the thermal activity at the crater area and part of the lava flow emplaced below
~1900 m a.s.l. that was instead visible by satellite. During the fountaining, the ash plume
partially prevented the view of the lava flow field from EMCT (see Figure 6g,h), until 10:45
when the maximum value of 0.75 × 10⁶ m2 was reached. Figure 7a shows the lava flow
area as imaged from EMCT superimposed on the RGB composite obtained from Band 12,
Band 11, Band 5 (20 m spatial resolution) of the Sentinel-2 image acquired on 13 March at
09:50. The EMCT-derived map of the lava flow was retrieved considering all the images
acquired by the camera with a portion of active lava flow from 12 March at 04:26 to 13
March at 05:40. We found an overlap of 97% between the projected thermal camera lava
flow surface and the one visible from the Sentinel-2 image for the portion visible from the
EMCT camera (Figure 7a). From the Sentinel-2 image, we derived a whole lava flow field
area that resulted of about 1.17 × 10⁶ m2 . Combining the SEVIRI-derived volume and the
Sentinel-2 derived area, we found an average thickness of ~2.1 m for the lava flow field.Remote Sens. 2021, 13, 3052 14 of 23
Figure 8 shows the ash cloud top height obtained from a VIIRS image acquired on 12
March 2021, at 10:46. The result is a maximum height of 12.6 km a.s.l. (Figure 8).
Figure 8. Ash Cloud Top Height (ACTH) computed from a VIIRS image of 12 March 2021, at 10:46.
By processing SEVIRI data, we were also able to follow the ash cloud dispersion
during the eruptive episode. The plume top area was visible by SEVIRI at 8:15 and the
area increased until 10:45 with an almost constant velocity between 0.1 and 0.2 km2 s−1
(Figure 9). At 11:00, more than one hour after the end of the lava fountaining (Table 2), the
plume top area started decreasing and separating from the volcano.
Figure 9. On the left: three SEVIRI scenes (channel IR 10.8) acquired on 12 March 2021 at 8:30, 10:00, and 10:45. On the right:
histogram of the plume top area during 12 March 2021 from 8:15 to 11:00.Remote Sens. 2021, 13, 3052 15 of 23
4.3. Strain
The DRUV reference station is located 10 km away from the summit craters (Figure 2),
but has a very high sensitivity allowing to clearly detect the small strain variations (~0.2
microstrain) caused by the activity of the lava fountains at that distance. During the
paroxysmal phase, the strain signal showed a negative variation which corresponded to a
decompression of the medium surrounding the instrument. A weak variation started at
06:40, during the transitional phase (from Strombolian to lava fountaining activity) and
the small lava flows occurrence. Then the strain increased its rate during the most intense
lava fountain phase (07:35–08:57; Table 2). The strain signal continued to decrease until
09:46, cumulating a change of 0.18 microstrain. This variation is of the same order of
magnitude as those recorded during the 2011–2013 paroxysmal episodes, with a value a
little greater than the average of these events, which was 0.15 microstrain [58]. The strain
rate, calculated as the strain change per 1 min sampling rate unit, reached a maximum
value at 08:57. The strain recorded is shown in Figure 10a, where it is compared to the
heat flux measured by satellite, and the strain rate against heat flux is shown in Figure 10b.
In Figure 10, four phases can clearly be identified: (1) Strombolian activity and an initial
weak effusive phase producing the beginning of the thermal release, but without strain
change; (2) increase of the Strombolian activity (i.e., transitional activity between Strombo-
lian and lava fountaining) in which the strain starts to decrease (i.e., decompression begins)
and the strain rate increases; (3) start of the lava fountain phase ejecting at a high mass
rate. This phase is characterized by a strong increment in the thermal contribution and
by a marked decompression recorded by the strain. The maximum of the strain rate at
08:57 is coincident with the maximum of the radiant heat flux and lava fountain height
(Table 2 and Figure 5); (4) after 08:56, the strain rate began to decrease, indicating that the
lava fountain intensity was going to decrease and, therefore, the turning point of the strain
rate represented the exact moment at which the eruptive activity started to decline; (5) at
09:45, the strain change reached the minimum, indicating that the lava fountain finished,
the magma was no longer emitted, and the strain no longer recorded decompression (only
the regular lunar tides), while the slow cooling of the hot material of the effused portion
caused a slow exponential decrease in the thermal contribution detected by satellite.Remote Sens. 2021, 13, 3052 16 of 23
Figure 10. (a) Comparison of the radiant heat flux (GW, blue diamonds) detected by SEVIRI satellite with the strain signal
(black line, in microstrain) and (b) the strain signal recorded at the DRUV station (black line, in microstrain per minute). (1)
Strombolian activity and initial weak effusive phase; (2) transitional activity between Strombolian and lava fountaining; the
strain starts to decrease and the strain rate increases; (3) start of the lava fountain phase; (4) the strain rate began to decrease
indicating that the lava fountain intensity was going to decrease; (5) the strain change reached the minimum indicating that
the lava fountain finished.Remote Sens. 2021, 13, 3052 17 of 23
It is interesting to observe that the strain signal provided correct timings of the start and
end of the lava fountain phase (Figure 10a), with times in agreement with those obtained
from the camera frames. The strain rate marked the intensity regime of the explosive phase,
and when the sign inversion occurred (at the beginning of phase 4, Figure 10a) there was a
precise indication that the lava fountain began to decline (5, Figure 10b).
5. Discussion
The explosive mechanism of the lava fountains at Etna is generally understood as
the “foam model” [81,82], which takes account of a rapid and violent ascent of a bubble
foam layer previously accumulated at a shallow depth [7,8,14,83]. In this paper we have
analyzed ground, satellite data and high precision strain signals collected during the 12
March lava fountain episode at Etna volcano in order to characterize the formation and
growth of the lava fountain and of the associated lava flow field, and the way the fountain
feeds the ash column and eruptive plume. The aim was to acquire parameters that could
be useful for hazard assessment.
The cameras allowed us to observe the phenomenon from the ground and provided
precise information on the characteristics of the lava fountain, on the subsequent erup-
tive column, ash plume development, and height. In particular, they constrained the
total amount of the erupted fluid (gas plus pyroclasts) during the lava fountaining phase,
and from this value we extracted the volume of pyroclasts as 0.18% of the total [14,15].
Thermal satellite analyses enable estimating the thermal energy and lava flows erupted dur-
ing and after the lava fountains. In addition, satellite images reveal the size and elevation of
the ash plume and their changes in time. The strain measures the response of the volcanic
edifice to the decompression caused by the eruptive activity and provides constraints on
the timing and total erupted volume. In general, the approach of integrating these various
observations allowed us to obtain robust constraints to characterize the phenomenon.
In particular, in this study we have described the Strombolian activity at the vent,
which began on 12 March 2021 at 02:35 (Table 2), gradually increasing with time in intensity
and frequency of the bursts. Only after 06:40, i.e., after about 4 h of growing explosive
activity, did the Strombolian activity pass to transitional explosions [14,39,43], and at 07:35,
about one hour later, became lava fountaining. This transition corresponds to an increase
in coalescence between gas bubbles [39] that drives the change from countable discrete
explosions (Strombolian activity), revealing a bubbly flow regime within the conduit, to
the transitional activity [14,39,43], indicative of a slug flow regime within the conduit,
to the uncountable oscillations of a lava fountaining typical of a sustained annular flow
regime [84]. It is at this stage—namely when lava fountaining is fully developed—that
abundant ash is released from the fountain margins to feed the ash plume, suggesting
further passage from an annular flow regime to a dispersed flow regime [84]. The lava
fountaining phase showed a growing muzzle velocity that started from 20–30 m s−1 ,
rapidly grew to 70 m s−1 , and peaked at 133 m s−1 (Table 2). These values are in the range
of Etna’s previous paroxysmal events [15,31,85].
Considering that the wind speed during the lava fountaining episode ranged between
~5 and 10 m s−1 , at an altitude between 3 and 10 km (ERA5 Reanalysis available at
https://cds.climate.copernicus.eu/, accessed on 2 August 2021), the results by Calvari
et al. [15] is confirmed, namely that wind speed up to 10 m s−1 leads to a strong to
intermediate plume rising vertically above the crater or slightly bending in the wind
direction. This shape has a lower impact on the local population because ash fallout is
mainly concentrated around the vent, but has a greater impact on aviation because the
plume reaches greater elevation [15]. In the case of the 12 March 2021, paroxysmal episode,
the ash plume rose to the maximum elevation of 11.3 km a.s.l. at 08:30, as detected from the
monitoring cameras (Table 2), but grew even further away from the volcano and reached
12.6 km at 10:46 (Figure 8), as detected by the satellite. Thus, even more than one hour
after the end of the lava fountaining, the ash plume was still threatening the airplanes
path (Figures 8 and 9). Given that the maximum elevation of the lava fountaining wasRemote Sens. 2021, 13, 3052 18 of 23
detected 10–15 min after the top plume height detected from the EBVH camera (Table 2),
it is possible that the maximum elevation of the ash plume was slightly higher than that
detected by the EBVH ground camera even close to the volcano. This is confirmed by the
12.6 km detected by satellite at 10:46 (Figure 8) and is in agreement with what was predicted
by the Equation (2) [15] that estimated a maximum ash plume elevation of 12.9 km.
The lava fountaining paroxysm ejected 1.6 × 10⁶ m3 pyroclasts at maximum IER
of 276 m3 s−1 . Most of the pyroclastic material erupted by the fountaining fell around
the vent, further increasing the size of the NSEC cinder cone, as happened in the recent
past [14,15,18,86]. Together with the lava fountaining, a lava flow also erupted from the
crater rim, spreading a volume of 2.4 × 10⁶ m3 over a surface of 1.2 × 10⁶ m2 and travelling
for 3.7 km eastward for a few hours.
The strain, based on the change cumulated during the lava fountain, was particularly
useful for giving an estimate of the total erupted volumes, comprising both the pyroclasts
erupted during the lava fountaining phase and the lava flows. In fact, considering the strain
changes recorded during the lava fountains occurring at Etna on 2011–2013, Bonaccorso
et al. [57] inferred a near spherical source of radius 0.5 km located below the crater area at
a depth close to the sea level. This source represents the shallow storage where gas-rich
magma is trapped and then violently ejected through the lava fountains. During the
lava fountain, this source deflated and its volume changed by 2 × 10⁶ m3 ; due to the
compressibility of the magma that accommodates a further amount of magma, the total
volume of magma expelled was ~2.5 × 10⁶ m3 [57]. This was considered the representative
volume for a lava fountain producing the mean strain change recorded for the 2011–2013
lava fountains, which was a 0.15 microstrain. Since the expected strain caused by a
depressurizing spherical source is linearly related to the volume change of this source [87],
we can use the results obtained by Bonaccorso et al. [57] to estimate the volume emitted
by the NSEC lava fountains by the amplitude of the strain change at DRUV. For the 12
March 2021, episode, the 0.18 microstrain corresponds to a total emitted volume of ~3
× 106 m3 , comprising both lava flows and pyroclasts. This value results in an average
eruption rate of 385 m3 s−1 . However, by summing up the satellite-derived lava flow
volume and the thermal camera derived pyroclastic volumes, a value of 4 × 10⁶ m3 is
obtained. We argue that the lava fountain heights analysis measured a quantity of magma
that partly flowed as lava flow and partly fell into the cone as pyroclasts. Indeed, by
comparing the satellite-derived and the thermal camera derived volumes, the quantity of
magma ejected into the fountain and falling into the lava flow field is about 1 × 10⁶ m3 ,
while about 0.6 × 10⁶ m3 is related to pyroclasts. This value is comparable with the growth
of the NSEC cone already measured during 2011–2013 [14], but also with a recent DEM
difference computation by using Pleiades data (6.4 × 10⁶ m3 during 12 eruptive episodes;
Ganci et al. unpublished data).
It is noteworthy that sustained ash plumes at the Etna volcano always accompany
lava fountains [10,11,14,15,17,25,52–54,59]. Ash plumes cause the greatest concern on the
civil protection authorities because they can attain up to 12–14 km in elevation [52,88]
causing severe threat to the air traffic, while still expanding in the atmosphere, but also
great damage to infrastructures, viability, and public health upon falling on the ground [30].
The ash plume forms as soon as the explosive activity shifts from transitional to lava foun-
tain (stage 3 in Figure 10), most often within 30 min from the paroxysmal
start [14,15,25]. It corresponds to an acceleration of the jet that is responsible for the peak
IER (Table 2) and the greater cooling and fragmentation of pyroclasts [25,33,44]. The heat
released during the lava fountain phase is sufficient to rise a large volume of fine-grained
pyroclasts (ash) up into the atmosphere, causing it to spread for several hours around the
volcano, and to travel distances of several tens of kilometers [89].
A numerical study involving explosive eruptions, carried out at the Etna volcano [90],
estimated that the mass deposited over a distance of 1 and 100 km from the vent represents
30% of the emitted pyroclastic mass. Thus, it is noteworthy that this amount was sufficient
to feed an ash plume 11–13 km high (Table 2, Figures 4 and 5) expanding for hundreds ofRemote Sens. 2021, 13, 3052 19 of 23
kilometers from the vent (Figures 8 and 9), and covering a sky surface of up to 1900 km2
and a distance of ~140 km from the vent in two and half hours. This matches a plume-
cloud expanding for 60 km from the vent in just 50 min during a previous paroxysmal
episode [89], and fully displays the hazard posed by the ash cloud to aviation safety
and circulation also because of growing airline traffic [91–93]. It is, thus, of paramount
importance to use monitoring data to develop simple equations, such as those used during
recent effusive eruptions at Etna [94,95], which might allow for fast and reliable estimates
useful for hazard assessment during the earlier phases of an explosive paroxysm. In this
respect, application of the formula proposed by Calvari et al. [15], to estimate the maximum
vertical extent of the ash plume once the lava fountaining phase stabilized, proved to be
effective when applied to the 12 March 2021, paroxysm. In fact, this formula estimated an
ash plume maximum elevation of 12.9 km a.s.l., which is a value very close to the 12.6 km
a.s.l. estimated from the satellite images.
6. Conclusions
Our results have essential implications in regard to hazard assessments at Etna during
paroxysmal explosive phases. They confirm the role of wind speed [15] in determining if a
strong, intermediate, or weak ash plume forms, with wind speeds below 10 m s−1 favoring
the formation of strong to intermediate, taller vertical plumes, which cause most of the
pyroclastic fallout around the vent. Our results on the 12 March 2021, episode confirm the
possibility of estimating the maximum ash plume elevation using the formula proposed by
Calvari et al. [15], given that the maximum plume elevation obtained by satellite (12.6 km)
was very close to the 12.9 km estimated by the empirical formula. Integrating results from
the ground monitoring cameras, satellite, and strainmeters, we obtained an estimation of
the total erupted volume of 3 × 10⁶ m3 , of which 1.6 × 10⁶ m3 erupted as pyroclasts, with
~1 × 10⁶ m3 of the volume of pyroclasts flowing together with the lava flows to comprise a
lava flow field extending over a surface of ~1.17 × 10⁶ m2 , with a volume of 2.4 × 10⁶ m3 .
Considering the duration of 130 min for the episode, there was an average eruption rate of
385 m3 s−1 for this event, comprising both pyroclasts and lava flows. Our results show that
extreme caution must be applied when calculating the volume erupted during paroxysmal
episodes, combining data obtained from monitoring cameras and satellites. In fact, by
comparing these results with the strain changes at the shallow magma source, we have
shown how a significant portion of pyroclasts (~1 × 10⁶ m3 ) flowed along the flanks of the
NSEC cone to feed the lava flows. This corresponds to ~33% of the total volume erupted
by the paroxysmal episode.
Although the duration of the eruptive event was rather short (130 min), the expansion
of the ash cloud continued for the following hours, reaching the maximum elevation
detected by satellite about 1 h after the end of the paroxysm (Figures 8 and 9). The ash
cloud expanded in the atmosphere and eventually detached from the volcano 1.5 h after
the end of the paroxysm (Figure 9). This result must be taken into account when organizing
air traffic immediately after the end of an explosive paroxysm.
Author Contributions: Conceptualization, S.C.; methodology, S.C., G.G., A.B.; validation, S.C.,
G.G., A.B.; formal analysis, S.C., G.G., A.B.; investigation, S.C., G.G., A.B.; resources, S.C.; data
curation, S.C., G.G., A.B.; visible and thermal ground imagery data treatment, S.C., G.G.; satellite data
treatment, G.G.; ground deformation data treatment, A.B.; writing—original draft preparation, S.C.,
G.G., A.B.; writing—review and editing, S.C., G.G., A.B.; visualization, S.C., G.G., A.B.; supervision,
S.C., G.G., A.B.; project administration, S.C.; funding acquisition, S.C. All authors have read and
agreed to the published version of the manuscript.You can also read