Phenolic Compounds and Bioaccessibility Thereof in Functional Pasta - MDPI
←
→
Page content transcription
If your browser does not render page correctly, please read the page content below
antioxidants
Review
Phenolic Compounds and Bioaccessibility Thereof in
Functional Pasta
Valentina Melini * , Francesca Melini                  and Rita Acquistucci
 CREA Research Centre for Food and Nutrition, Via Ardeatina 546, I-00178 Roma, Italy;
 francesca.melini@crea.gov.it (F.M.); rita.acquistucci@crea.gov.it (R.A.)
 * Correspondence: valentina.melini@crea.gov.it

 Received: 6 April 2020; Accepted: 20 April 2020; Published: 22 April 2020

 Abstract: Consumption of food products rich in phenolic compounds has been associated to reduced
 risk of chronic disease onset. Daily consumed cereal-based products, such as bread and pasta,
 are not carriers of phenolic compounds, since they are produced with refined flour or semolina.
 Novel formulations of pasta have been thus proposed, in order to obtain functional products
 contributing to the increase in phenolic compound dietary intake. This paper aims to review
 the strategies used so far to formulate functional pasta, both gluten-containing and gluten-free,
 and compare their effect on phenolic compound content, and bioaccessibility and bioavailability
 thereof. It emerged that whole grain, legume and composite flours are the main substituents of
 durum wheat semolina in the formulation of functional pasta. Plant by-products from industrial
 food wastes have been also used as functional ingredients. In addition, pre-processing technologies
 on raw materials such as sprouting, or the modulation of extrusion/extrusion-cooking conditions,
 are valuable approaches to increase phenolic content in pasta. Few studies on phenolic compound
 bioaccessibility and bioavailability in pasta have been performed so far; however, they contribute to
 evaluating the usefulness of strategies used in the formulation of functional pasta.

 Keywords: phenolic compounds; bioactive compounds; functional pasta; gluten-free pasta;
 bioaccessibility; bioavailability; whole grain; composite flour; legumes; food by-products

1. Introduction
      Phenolic compounds are secondary plant metabolites with strong antioxidant activity [1].
The consumption of food products rich in phenolic compounds has been associated with a reduced risk
of chronic disease onset and ageing [2,3]. Currently, Phenol-Explorer, the first comprehensive database
on polyphenol content in foods, reports the content for 500 phenolic compounds in 400 foods, for a
total of 35,000 values. Fruit and vegetables are the main source of these secondary plant-metabolites.
      Cereal grains contain significant amounts of phenolic compounds, as well [4,5]. Nevertheless,
daily consumed cereal-based products, such as bread and pasta, are not a carrier of phenolic compounds,
since they are produced with refined flour or semolina. Most bioactive compounds are concentrated in
the outer layers of cereal grains which are discarded as bran, while flour and semolina are obtained
from the starchy endosperm layer [6]. Hence, phenolic compounds are commonly lost during milling.
      Pasta is one of the staple foods of the Mediterranean diet. It composes the base of the food
pyramid and a daily consumption is recommended [7]. Pasta is a good source of carbohydrates
and energy. One serving of 100 g of pasta (cooked, unenriched, without added salt) contains about
31 g of carbohydrates, 26.01 g starch, 1.8 g total dietary fibre, 5.8 g protein, and 0.93 g lipid (fat),
and provides about 158 kcal [8]. When pasta is cooked al dente, it also has a low glycemic index,
ranging around 32–40, depending on the pasta type [9]. Pasta glycemic index is far lower than
that of bread. Additionally, pasta can possibly slow digestion rates and may contribute to longer

Antioxidants 2020, 9, 343; doi:10.3390/antiox9040343                          www.mdpi.com/journal/antioxidants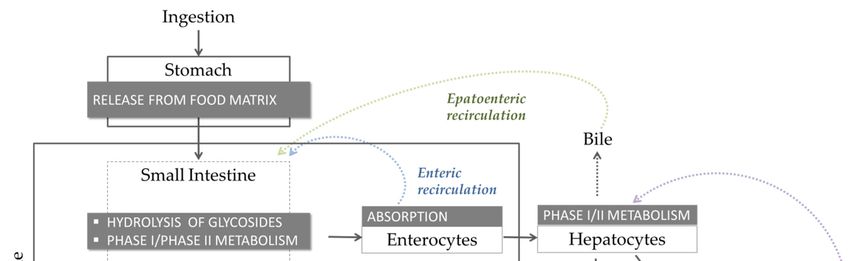
Antioxidants 2020, 9, 343                                                                        2 of 30

satiety [10–13]. Pasta has also additional unquestionable advantages, such as ease of preparation,
long shelf-life, low price and global consumption. It is consumed by people of all ages and from all
walks of life. Hence, it may be an optimal carrier of phenolic compounds.
      Currently, the focus of nutritional science has shifted toward the concept of optimal nutrition,
which aims at optimizing the daily diet in terms of nutrients and non-nutrients. Hence, the demand for
functional food products with a well-balanced nutritional composition and contributing to maintaining
wellbeing and health, has grown.
      In this framework, novel formulations of functional pasta have been proposed and innovation
in pasta-making has been prompted. The aim of this paper is to identify which formulations of
functional pasta contribute to a higher intake of phenolic compounds, and greater bioaccessibility
and bioavailability thereof. The consumption of food products with a high number of bioactive
compounds does not necessarily imply beneficial effects on human health. Bioaccessibility studies
are, thus, mandatory, to evaluate the bioactivity of a functional product. To this aim, the strategies
used so far in formulation of functional pasta rich in phenolic compounds, both gluten-containing
and gluten-free, will be reviewed. In addition, studies on phenolic compound bioaccessibility and
bioavailability in pasta will be discussed, in order to evaluate the usefulness of these strategies and
provide a basis for further investigations.

2. Dietary Phenolic Compounds

2.1. Structure
      Phenolic compounds are a heterogeneous group of bioactive compounds produced in plants,
via either the shikimate or the acetate pathway [14]. They include a variety of chemical structures
having one or more phenolic groups as a common structural feature.
      Based on the number of phenol rings and the structural elements that bind rings one to another,
they can be classified into: (i) simple phenols; (ii) phenolic acids; (iii) flavonoids; (iv) xanthones;
(v) stilbenes; and (vi) lignans [15], while a broader classification divides phenolic compounds into
flavonoids and non-flavonoids [16]. Flavonoids show a distinctive benzo-γ-pyrone skeleton and
occur as aglycones, glycosides and methylated derivatives. They comprise flavonols, flavan-3-ols,
flavones, isoflavones, flavanones, anthocyanidins and dihydrochalcones. Non-flavonoids include
diverse classes of polyphenols, such as phenolic acids and stilbenes [16]. Among non-flavonoids of
dietary significance, phenolic acids play a pivotal role and are a major class in grains. They include
hydroxybenzoic acids (C6–C1), such as gallic, p-hydroxybenzoic, vanillic, syringic, protocatechuic and
ellagic acids, as well as hydroxycinnamic acids (C6–C3), namely p-coumaric, caffeic, ferulic, sinapic
and chlorogenic acids (Table 1).
      Phenolic compounds may occur in free, soluble conjugated, and bound form, depending on
whether they are bound to other constituents, or otherwise. Hence, they can be classified as free
phenolic compounds (FPCs), soluble conjugated phenolic compounds (EPCs) and insoluble bound
phenolic compounds (BPCs) [17]. EPCs are esterified to other molecules such as fatty acids, while BPCs
are covalently bound to cell wall constituents, such as pectin, cellulose, arabinoxylans and structural
proteins. BPCs are the main fraction of phenolic compounds in wheat grains [18,19].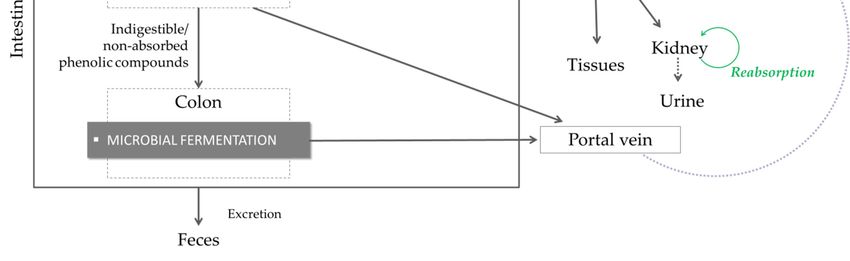
Antioxidants 2020, 9, 343 3 of 30
Antioxidants 2020, 9,
Antioxidants 9, x FOR PEER
PEER REVIEW 333 of
of 31
Antioxidants 2020,
2020, 9, xx FOR
FOR PEER REVIEW
REVIEW of 31
31
Antioxidants 2020, 9, x FOR PEER REVIEW 3 of 31
Table 1. Major classes of dietary phenolic compounds, skeleton structure thereof and common representatives.
Table 1. Major
Table Major classes of
of dietary phenolic
phenolic compounds, skeleton
skeleton structure thereof
thereof and common
common representatives.
Table 1.
Table 1. Major classes
1. Major classes of dietary
classes of dietary phenolic compounds,
dietary phenolic compounds, skeleton structure
compounds, skeleton thereof and
structure thereof
structure common representatives.
and common
and representatives.
representatives.
Class Class
Subclass Subclass Skeleton Structure
Skeleton Structure
Structure Common Representatives
Common Representatives
Representatives
Class
Class Subclass
Subclass Skeleton
Skeleton Structure
Structure Common
Common Representatives
Representatives
Class Subclass Skeleton Common
O
O
O
O
Flavonols
Flavonols Flavonols Kaempferol,
Kaempferol,
Kaempferol, quercetin
quercetin
Flavonols
Flavonols Kaempferol, quercetin
Kaempferol, quercetin
quercetin
OH
OH
OH
OH
O
O
O
O
O
O Catechin, gallocatechin,
Flavan-3-ols
Flavan-3-ols
Flavan-3-ols Flavan-3-ols O
O Catechin,
Catechin,
Catechin,
gallocatechin,
gallocatechin, epicatechin
gallocatechin, epicatechin
epicatechin
Flavan-3-ols epicatechin
Catechin, gallocatechin, epicatechin
OH
OH
Flavonoids OH
OH
Flavonoids
Flavonoids
Flavonoids
O
O
O
O
Flavones
Flavones Luteolin, apingenin
Luteolin, apingenin
Flavones
Flavones Flavones Luteolin, apingenin
Luteolin,
Luteolin, apingenin
apingenin
O
O
O
O
O
O
O
O
Isoflavones
Isoflavones Genistein, daidzein
Genistein, daidzein
Isoflavones
Flavonoids
Isoflavones Isoflavones Genistein, daidzein
Genistein,
Genistein, daidzein
daidzein
O
O
Antioxidants 2020,
Antioxidants2020,
Antioxidants 9,9,x
2020,9, xxFOR
FOR PEER
FORPEER REVIEW
PEERREVIEW
REVIEW O
O 444of
ofof31
31
31
O
O
O
Flavanones
Flavanones
Flavanones Flavanones Naringenin,
Naringenin,
Naringenin, hesperetin
Naringenin, hesperetin
hesperetin
hesperetin
O
O
O
+++
HHO
H O
O O
O
O
Anthocyanidins
Anthocyanidins Anthocyanidins
Cyanidin,
Cyanidin, malvidin,
Cyanidin,malvidin,
malvidin,delphinidin
delphinidin
Anthocyanidins Cyanidin, malvidin, delphinidin
delphinidin
OH
OH
OH
Dihydrochalcones
Dihydrochalcones
Dihydrochalcones
Dihydrochalcones Phloretin
Phloretin
Phloretin
Phloretin
O
O
O
R1
R1
R1
R2
R2
R2
Gallic
Gallicacid,
Gallic acid,p-hydroxybenzoic
acid, p-hydroxybenzoicacid,
p-hydroxybenzoic acid,vanillic
acid, vanillicacid,
vanillic acid,syringic
acid, syringic
syringic
Non-Flavonoids
Non-Flavonoids Phenolic
Non-Flavonoids Phenolicacids—Hydroxybenzoic
Phenolic acids—Hydroxybenzoicacids
acids—Hydroxybenzoic acids
acids acid, protocatechuic
acid,protocatechuic
acid, acid,
protocatechuicacid, ellagic
acid,ellagic acid
ellagicacid
acid
R3
R3
R3 COOH
COOH
COOH
R1,
R1,R2,
R1, R2,R3:
R2, R3:–H
R3: –Hor
–H or–OH
or –OH
–OHOH
Antioxidants 2020, 9, 343 4 of 30
Dihydrochalcones Phloretin
Table 1. Cont.
Class Subclass Skeleton Structure
O Common Representatives
R1
Phenolic
R2 Gallic acid, p-hydroxybenzoic
Non-Flavonoids Phenolic acids—Hydroxybenzoic acids
acid,
Gallic vanillic
acid, acid, syringic
p-hydroxybenzoic acid, vanillic acid, syringic
acids—Hydroxybenzoic acid, protocatechuic acid, ellagic
acid, protocatechuic acid, acid
acids
ellagic acid
R3 COOH
Antioxidants 2020, 9, x FOR PEER REVIEW 5 of 31
Antioxidants 2020, 9, x FOR PEER REVIEW R1, R2, R3: –H or –OH 5 of 31
R1
Antioxidants 2020, 9, x FOR PEER REVIEW
R1 OO 6 of 31
Non-Flavonoids Phenolic p-coumaric acid, caffeic acid,
Phenoliccompounds
Phenolic acids—Hydroxycinnamic
may HHOfree,
acids in
occur
acids—Hydroxycinnamic
O
soluble
OH
OH
conjugated, and
p-coumaric acid, caffeic acid, ferulic acid, sinapic acid,
p-coumaric
ferulic acid,
bound caffeic
form,
acid, acid, ferulic acid,
depending
sinapic acid, onsinapic acid,
Phenolic acids—Hydroxycinnamic acids chlorogenic acid
acids chlorogenic acid acid
chlorogenic
whether they are bound to other constituents, or otherwise. Hence, they can be classified as free
R2
R2
phenolic compounds (FPCs), soluble conjugated phenolic compounds (EPCs) and insoluble bound
R1, R2, R3: –H or –OH
phenolic compounds (BPCs) [17]. EPCsR1,areR2, R3: –H or –OH
esterified to other molecules such as fatty acids, while
BPCs are covalently bound to cell wall constituents, such as pectin, cellulose, arabinoxylans and
structural proteins. BPCs are the main fraction of phenolic compoundsResveratrol
Stilbenes in wheat grains [18,19].
Stilbenes Stilbenes Resveratrol
Resveratrol
2.2. Bioaccessibility, Biotransformation and Bioavailability
The concept of bioavailability in nutrition has been borrowed from pharmacology. In this
discipline, the termBiotransformation
2.2. Bioaccessibility, “bioavailability” andrefers to the fraction of the administered dose of drug that
Bioavailability
enters systemic circulation, so as to access the site of action [20]. In nutrition, bioavailability refers to
The concept
the amount of bioavailability
of a nutrient or bioactiveincompound
nutrition which
has been borrowed
becomes fromfor
available pharmacology. In this
normal physiological
discipline,
functions orthe term “bioavailability”
storage, after absorption by refers to the
the gut [21].fraction of the administered dose of drug that
entersThe
systemic circulation, so as to access
first step, necessary for a food component the site of action [20]. bioavailable,
to become In nutrition, bioavailability refersthe
is the release from to
the amount of a nutrient or bioactive compound which becomes available for normal
food matrix. The extent at which a nutrient or bioactive molecule is released from the food matrix physiological
functions or storage, aftertract
into the gastrointestinal absorption
and is inbythethe gut form
right [21]. to be absorbed, is referred to as bioaccessibility
[22]. The first step, necessary for a food component to become bioavailable, is the release from the food
matrix.
TheThe extent at which
bioaccessibility anda bioavailability
nutrient or bioactive molecule
of phenolic is released
compounds arefrom the food
affected matrixrelated
by factors into the
to
gastrointestinal tract and is in the
phenolics, food matrix and host (Figure 1).right form to be absorbed, is referred to as bioaccessibility [22].
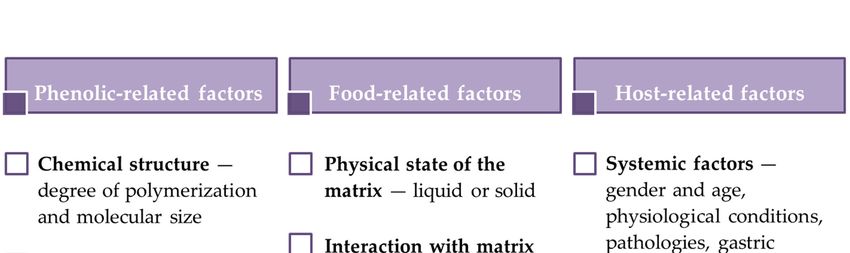
The bioaccessibility and bioavailability of phenolic compounds are affected by factors related to
phenolics, food matrix and host (Figure 1).
Figure 1. Factors affecting bioaccessibility and bioavailability of phenolic compounds.
Figure 1. Factors affecting bioaccessibility and bioavailability of phenolic compounds.
As regards the relationship between phenolic characteristics and bioavailability, it has been
observed that chemical structure (degree of polymerization and molecular size), glycosylation and
conjugation with other phenolics, and solubility are critical factors [23]. For example, phenolic acids,Antioxidants 2020, 9, 343 5 of 30
As regards the relationship between phenolic characteristics and bioavailability, it has been
observed that chemical structure (degree of polymerization and molecular size), glycosylation and
conjugation with other phenolics, and solubility are critical factors [23]. For example, phenolic acids,
isoflavones, catechins and quercetin glucosides are easily absorbed, while large polyphenols are
poorly absorbed.
Generally, phenolic compounds in liquid foods are more bioaccessible than those in solid
foods. However, differences in phenolic bioavailability among liquid matrices have been observed.
The occurrence of alcohol, dietary fibre or other nutrients, such as carbohydrates, lipids and proteins,
may in fact influence phenolic compound bioavailability because of the interactions between phenolics
and matrix
Antioxidants constituents.
2020, 9, x FOR PEER FoodREVIEWprocessing may positively or negatively affect phenolic compound 7 of 31
bioaccesibility and bioavailability, as well. Lafarga et al. observed that cooking increased the
bioaccessible
bioaccessibility phenolics
of phenolic in compounds
brown riceinand pulsesoat[24].
significantly
Zeng et al. decreased
found that the(bycontent
31.09%ofand 30.95%,
bioaccessible
respectively)
phenolics in brownafter improved
rice and oat extrusion-cooking
significantly decreasedtreatment, while and
(by 31.09% in wheat
30.95%,they were almost
respectively) after
unchanged, possibly because treatment,
improved extrusion-cooking of differences
while in in
thewheat
cerealthey
matrixwere [25]. It should
almost be alsopossibly
unchanged, considered that
because
processing
of differencescanincause a lossmatrix
the cereal of phenolic
[25]. It compounds
should be also while promoting
considered that their bioaccessibility.
processing can cause aHence,
loss of
bioavailability
phenolic compounds is a compromise betweentheir
while promoting the compounds
bioaccessibility.lost Hence,
during processing andisthose
bioavailability absorbed
a compromise
into the organism
between the compounds[26]. lost during processing and those absorbed into the organism [26].
Host-related factors—suchas as
Host-related factors—such physiological
physiological conditions,
conditions, disordersdisorders or pathologies,
or pathologies, gastric
gastric emptying,
emptying, enzyme activity, intestinal transit time and colonic microflora—may
enzyme activity, intestinal transit time and colonic microflora—may influence bioaccessibility and influence
bioaccessibility
bioavailability of and bioavailability
phenolic compounds,of phenolic
as well.compounds, as well.
The bioavailability of a phenolic compound
The bioavailability of a phenolic compound implies: implies: (i) release
(i) its its release
fromfrom the matrix;
the food food matrix; (ii)
(ii) gastric
gastric and small-intestinal
and small-intestinal digestiondigestion (likelyofchange
(likely change phenolicofcompound
phenolic structure
compounddue structure due to
to hydrolysis of
hydrolysis
glycosides andof glycosides and phase I/II
phase I/II metabolism); (iii)metabolism);
cellular uptake (iii) cellular uptake
of aglycons and some of conjugated
aglycons and some
phenolics
conjugated phenolics
by enterocytes; by enterocytes;
(iv) microbiological (iv) microbiological
fermentation fermentation
of non-absorbed of non-absorbed
polyphenols or phenolics polyphenols
re-excreted
or
via phenolics re-excreted
bile or the pancreas, via bile additional
to produce or the pancreas,
metabolites; to (v)
produce additional
modifications metabolites;
by phase I/II enzymes,(v)
modifications
upon uptake inbythe phase
smallI/II enzymes,
intestine upon
or in uptake
the colon; in transport
(vi) the small intointestine or instream
the blood the colon;
and (vi) transport
redistribution
into the blood
to tissues; (vii)stream and redistribution
excretion via the kidneytoortissues; (vii) excretion
re-excretion into the via gutthe
viakidney
bile andor re-excretion
pancreatic juicesinto
the gut via
(Figure 2). bile and pancreatic juices (Figure 2).
Figure 2. Representation of digestion, absorption and excretion of phenolic compounds and metabolites thereof.
Figure 2. Representation of digestion, absorption and excretion of phenolic compounds and
metabolites thereof.
Generally, after the absorption step, phenolics undergo phase I and II metabolic transformation,
and metabolites with improved bioactivity or completely inactive can be obtained. As an example,
protocatechuic acid, phloroglucinaldehyde, vanillic acid, and ferulic acid are bioactive metabolitesAntioxidants 2020, 9, 343 6 of 30
Generally, after the absorption step, phenolics undergo phase I and II metabolic transformation,
and metabolites with improved bioactivity or completely inactive can be obtained. As an example,
protocatechuic acid, phloroglucinaldehyde, vanillic acid, and ferulic acid are bioactive metabolites
obtained by the catabolism of cyanidine-3-O-glucoside in the gastrointestinal tract that contribute to
maintaining intestinal integrity and function [27]. Hence, the evaluation of polyphenol bioavailability
should include not only the determination of native compounds, but also of metabolites thereof.
Methods to Evaluate Phenolic Compound Bioaccessibility and Bioavailability
Several approaches have been proposed to evaluate phenolic compound bioaccessibility and
bioavailability. They include the use of in vitro methods and in vivo models [23]. In vitro methods
comprise simulated gastrointestinal (GI) digestion, artificial membranes, Caco-2 cell cultures and
ussing chambers. As regards in vitro digestion models, they can be either static or dynamic [28].
Static models consist of multiple phases, including oral digestion (OD), gastric digestion (GD), intestinal
digestion (ID) and dialysate (DIA). Each phase can vary slightly among studies. They can differ in the
incubation time and characteristics of the digestive juices, and can also be adjusted for pH on the basis
of the specific gut compartment [29]. However, they operate in static mode across the whole process,
with prefixed conditions and parameters in terms of concentrations and volumes of digested materials,
enzymes and salts, among others. The INFOGEST digestion method is an example of standardised
static model [28,30].
Dynamic models include physical and mechanical processes and consider the changes that occur
during the digestive process, as well as different physiological conditions. They were developed
because static methods do not provide an accurate simulation of the complex dynamic physiological
processes occurring under in vivo conditions. A common and very sophisticated gut model is the TIM
system, a multi-compartmental dynamic computer-controlled model, used to simulate the human
digestive system and to study the bioaccessibility of many compounds, such as vitamins, minerals,
as well as phenolics [31].
In addition to the aforementioned methods, gastrointestinal organs in laboratory conditions
(ex-vivo models) and intestinal perfusion in animals (in situ model) can be also applied in
bioaccessibility/bioavailability determination [23]. In-vivo approaches are based on animal or
human studies.
3. Strategies to Modulate Phenolic Compound Content in Pasta
According to tradition, pasta is seemingly a very simple food, produced with one ingredient,
i.e., semolina of durum wheat (Triticum turgidum L. var. durum), and one “reactant”, i.e., water. Pasta
final configuration, made of starch granules dispersed within the protein network, is hence obtained
upon the biochemical modification of the two main constituents of durum wheat semolina (that is,
proteins and starch) prompted by water addition, and mechanical and thermal energy.
Pasta by itself is a healthy food. It is a good source of carbohydrates and energy. However,
in recent years, scientists and producers have been striving to develop new formulas, so that pasta can
not only provide nutrients and energy, but also beneficially modulate one or more targeted functions
in the body, by enhancing a certain physiological response and/or reducing the risk of disease [32].
These new formulations are known as functional pasta products.
The use of functional ingredients, such as whole grain and composite flours, as well as the
addition of extracts from plant foods and food wastes, has been increasingly explored as a strategy to
improve phenolic content in pasta and gluten-free pasta. In addition, processing technologies have
been specifically applied to raw materials or to the pasta-making process in order to increase the
content of bioactive components and their bioavailability (Table 2).Antioxidants 2020, 9, 343 7 of 30
Table 2. Modulation of phenolic compound content in pasta.
Strategy Sub-Strategy Pasta Products Effect on Phenolic Compound Content/Profile Reference
↑ content of protocatechuic, 4-hydroxybenzoic, vanillic,
Whole grain wheat and whole grain
syringic, trans-p-coumaric, cis-p-coumaric, trans-ferulic Wójtowicz et al. [33]
spelt pasta (precooked)
and cis-ferulic acids.
Whole Grain Flours
Whole grain wheat products TPAs: 226.7 µg/g Chen et al. [34]
TPC (whole wheat spaghetti): 1263–1423 µg FAE/g dm
Whole grain spaghetti Hirawan et al. [35]
TPC (regular spaghetti): 718–927 µg FAE/g dm
Pasta formulated with wheat semolina TPC (functional pasta): 185.3 mg GAE/100 g dm
Turco et al. [36]
and 35% faba bean (Vicia faba L.) flour TPC (control pasta): 63.8 mg GAE/100 g dm
Pasta with varying proportions of
TPC (pasta with 10:90 chia:chickpea flour ): 16 mg
wheat (T. durum L.) semolina (0–100%),
GAE/g dm Cota-Gastélum et al. [37]
chickpea flour (0–90%), and chia flour
TPC (control pasta): 2 mg GAE/g
Use of functional (0–10%)
ingredients in TPC (pasta with 1% of carob flour): 5.27 mg GAE/g dm
pasta-making Pasta prepared with carob flour (1–5%) TPC (pasta with 5% carob flour): 12.12 mg GAE/g dm Sȩczyk et al. [38]
TPC (control pasta): 3.51 mg GAE/g dm
TPC (amaranth-added pasta): 1.54 to 3.37 mg FAE/g dm
Composite Flours Pasta prepared with amaranth seed
TPC (control pasta, 100% semolina): 0.98 mg FAE/g dm
flours and dried amaranth leaves (35%, Cárdenas-Hernández et al. [39]
The highest value was observed in pasta with a
50%, 55% and 70%)
semolina: amaranth flour/leaves ratio of 65:35.
Samples containing 75% of blue maize presented the
GF pasta (unripe plantain and chickpea highest TPC retention after extrusion and cooking
flour ) added with blue maize (Zea mays (approx. 70% and 80%, respectively). In the control Camelo-Méndez et al. [40]
L.) at 25%, 50% and 75% pasta, the phenolic retention after extrusion and cooking
was approx. 52% and 60%, respectively.
TPC (pasta with white sorghum): 2.41 g GAE/ kg
GF pasta (with rice, maize and soy TPC (pasta with brown sorghum): 2.88 g GAE/kg
flour) added with white and brown TPC (rice pasta): 0.37 g GAE/kg Palavecino et al. [41]
sorghum TPC (soy pasta): 1.37 g GAE/kg
TPC (corn pasta): 0.52 g GAE/kgAntioxidants 2020, 9, 343 8 of 30
Table 2. Cont.
Strategy Sub-Strategy Pasta Products Effect on Phenolic Compound Content/Profile Reference
Pasta from wheat semolina and TFC (control pasta): 6.30 mg/100 g dm
pearl-millet added with carrot powder TFC (carrot-added pasta): 7.63 mg/100 g dm
(10%), mango peel powder (5%), TFC (mango peel-added pasta): 16.53 mg/100 g dm Jalgaonkar et al. [42]
moringa leaves powder (3%) and TFC (moringa leaves-added pasta): 17.98 mg/100 g dm
defatted soy flour (15%) TFC (defatted soy flour-added pasta): 8.03 mg/100 g dm
TPC values in mushroom pasta were significantly
Pasta added with mushroom (white
higher than in control pasta, except for 5% and 10%
button, shiitake and porcini) powder,
shiitake mushroom pasta. The greatest values were Lu et al. [43]
at 5%, 10% and 15% semolina
found in porcini mushroom pasta samples
substitution levels
(approximately 4–5 mg GAE/g dm).
TPC (cooked pasta added with onion skin): approx.
from 1.4 to 3 mg GAE/g dm
TFC (cooked pasta added with onion skin): approx.
Powders and Pasta added with onion powder, at 0%, from 0.7 to 3.8 mg QE/g dm
Use of functional
extracts from plant 2.5%, 5% and 7.5% semolina TPC (cooked control pasta): approx. 0.5 mg GAE/g dm Michalak-Majewska et al. [44]
ingredients in
foods and food substitution level TFC (cooked control pasta): approx. 0.1 mg QE/g dm
pasta-making
by-products Cooked pasta showed TPC not significantly different
from the corresponding raw sample, whichever addition
level of onion skin powder.
TPC (enriched spaghetti): 245.08 µg/g dm
TPC (control pasta): 82.39 µg/g dm
Durum spaghetti added with olive Control and functional pasta differed also in the
Padalino et al. [45]
paste powder (10%) phenolic profile.
Increased level of flavonoids (i.e., quercetin and luteolin)
in functional pasta.
Spaghetti added with extracts from
TPC (functional spaghetti): approx. 700 mg
grape marc (grape skins, seeds, Marinelli et al. [46]
GAE/100g dm
and stalks)
Pasta prepared from semolina and bran TPC (functional spaghetti): 127 mg FAE/100 g fw
Pasqualone et al. [47]
aqueous extract TPC (control pasta): 97 mg FAE/100 g fwAntioxidants 2020, 9, 343 9 of 30
Table 2. Cont.
Strategy Sub-Strategy Pasta Products Effect on Phenolic Compound Content/Profile Reference
In raw samples—
TPA (functional GF pasta—10% sub.): 164.3 µg/g
TPA (durum wheat pasta): 149.08 µg/g
TPA (functional GF pasta—5% sub.): 98.40 µg/g
TPA (pasta produced with commercial GF flour):
10.30 µg/g
GF pasta added with chia (Salvia
In cooked samples—
hispanica L.) milled seeds (5% and 10% Menga et al. [48]
↑ TPAs in all pasta samples.
substitution levels)
TPA (functional GF pasta—10% sub.): 186.80 µg/g
TPA (durum wheat pasta): 156.99 µg/g
TPA (functional GF pasta—5% sub.): 123.53 µg/g
TPA (pasta produced with commercial GF flour):
11.83 µg/g
Control and functional pasta also differed in the
Powders and
Use of functional phenolic profile.
extracts from plant
ingredients in foods and food Pasta samples enriched with pear prickly fruit were rich
pasta-making by-products in several phenolic acids, namely protocatechuic, caffeic,
GF pasta (from a blend of rice and field
syryngic, 4-OH-benzoic, vanilic, gentisic, trans-sinapic,
bean flour) added with pear prickly
cis-sinapic, p-coumaric, ferulic, isoferulic, m-coumaric,
fruit (Opuntia ficus indica (L.) Mill.) in Oniszczuk et al. [49]
3,4-dimetoxycinnamic, and salicylic acids.
different amounts (2.5%, 5%, 7.5%, 10%,
The higher was the addition of pear prickly fruit, the
12.5% and 15%)
higher was the content of phenolic acids.
The dominant acid was isoferulic.
TPA content (10%): 38.93 µg/g dm
TPA content (20%): 46.98 µg/g dm
GF pasta (from a blend of rice and field
TPA content (30%): 51.47 µg/g dm
bean flour) added with chestnut fruit
TPA content (40%): 56.59 µg/g dm
(Castanea sativa Mill.) in different Oniszczuk et al. [50]
TPA content (50%): 65.01 µg/g dm
amounts (10%, 20%, 30%, 40%, and
The content of each phenolic acid also increased at the
50%)
higher addition of chestnut fruit, with the exception of
4-hydroxy-benzoic and salicylic acids.Antioxidants 2020, 9, 343 10 of 30
Table 2. Cont.
Strategy Sub-Strategy Pasta Products Effect on Phenolic Compound Content/Profile Reference
Phenolic compounds in wheat flour and semolina were
negligible compared to the debranning fraction from
Pasta enriched with a debranning purple wheat.
Abbasi et al. [51]
fraction from purple wheat (25%) In pasta samples TPC was lower than it was expected.
This was possibly due to the degradation of phenolics
during the pasta-making process.
Anthocyanin content (pasta enriched with the 1st
debranning fraction): 67.9 µg/g dm
Pasta enriched with the first and the
Anthocyanin content (pasta added with the 2nd
second debranning fraction from Zanoletti et al. [52]
debranning fraction): 60 µg/g dm
purple wheat
Anthocyanin content (control pasta with bran addition):
Raw material 28 µg/g dm
processing, Debranning In raw samples—
pasta-making and Free PAs were higher in the control pasta than in
pasta cooking functional pasta.
Conjugated PAs (functional pasta): 59.4 mg/kg dm
Conjugated PAs (control pasta): 21.6 mg/kg dm
Bound PAs (functional pasta): 650.0 mg/kg dm
Bound PAs (control pasta): 27.2 mg/kg dm
Spaghetti enriched (30%) with Conjugated TPC (functional pasta): 110.7 mg/kg dm
Ciccoritti et al. [53]
debranning fractions of durum wheat Conjugated TPC (control pasta): 31.4 mg/kg dm
Bound TPC (functional pasta): 1308.4 mg/kg dm
Bound TPC (control pasta): 156.9 mg/kg dm
In cooked samples—
↑ level of PAs, whichever form was considered
↓ free and conjugated TPC
↑ level of bound phenolic compoundAntioxidants 2020, 9, 343 11 of 30
Table 2. Cont.
Strategy Sub-Strategy Pasta Products Effect on Phenolic Compound Content/Profile Reference
In raw functional pasta—
Conjugated PAs: 36.8 mg/kg dm
Bound PAs: 357.3 mg/kg dm
Conjugated TPs: 75.8 mg/kg dm
Bound TPs: 113.3 mg/kg dm
Pasta added with micronized fractions Ciccoritti et al. [53]
In cooked functional pasta (with respect to raw
Micronization samples)—
↑ free PAs and conjugated PAs
↓ bound PAs
↓ conjugated TPs
Raw material ↑ bound TPs
processing,
Micronization preserved the content of phenolic acids,
pasta-making and
Pasta added with micronized fractions while conventional milling determined 89% decrease Martini et al. [54]
pasta cooking
from seeds to cooked durum wheat pasta
In raw samples—
TPC (raw tartary buckwheat spaghetti): 3.7 mg GAE/g
TPC (100% semolina spaghetti): 0.3 mg GAE/g
Spaghetti formulated by using 30% dry
Cereal germination Merendino et al. [55]
tartary buckwheat sprouts
In cooked samples—
TPC (raw tartary buckwheat spaghetti): 2.2 mg GAE/g
TPC (100% semolina spaghetti): 0.2 mg GAE/g
Pasta prepared with sprouted TPC (sprouted chickpea pasta): 8.4 mg GAE/g
Legume germination Bruno et al. [56]
chickpea flour TPC (non-sprouted chickpea pasta): 7.3 mg GAE/gAntioxidants 2020, 9, 343 12 of 30
Table 2. Cont.
Strategy Sub-Strategy Pasta Products Effect on Phenolic Compound Content/Profile Reference
GF precooked rice-yellow pea pasta ↑ TPC at higher screw speed (80 rpm) Bouasla et al. [57]
Highest level of benzoic acid derivatives (i.e., gallic,
protocatechuic, gentisic, 4-hydroxybenzoic and salicylic
acids) at 100 rpm extruder screw speed and 32% flour
Extrusion and GF precooked pasta from roasted moisture content.
Extrusion-cooking buckwheat (Fagopyrum esculentum Oniszczuk et al. [58]
Moench and F. tataricum Gaertner) flour Highest content in cinnamic acid derivatives (i.e.,
trans-caffeic, trans-p-coumaric, cis-p-coumaric and
cis-ferulic acids) at 60 rpm extruder screw speed and
Raw material
30% of flour moisture
processing,
pasta-making and Barley pasta ↓ TPC after extrusion De Paula et al. [59]
pasta cooking Barley pasta TPAs were not greatly affected by cooking De Paula et al. [59]
Whole wheat ↑ free TPC Podio et al. [60]
In raw GF pasta—
Bound TPC > Free TPC
Cooking Bound TPC (sorghum GF pasta): 7.58 mg GAE/100 g
GF pasta (i.e., pasta enriched with black Bound TPC (quinoa GF pasta): 32.68 mg GAE/100 g
rice, chickpea, red lentil, sorghum, Rocchetti et al. [61]
amaranth and quinoa) In cooked GF pasta—
Free TPC > Bound TPC
Free TPC (black rice pasta): 27.27 mg GAE/100 g
Free TPC (quinoa pasta): 19.27 mg GAE/100 g
↓: decrease; ↑: increase; dm: dry matter; FAE: Ferulic Acid Equivalents; fw: fresh weight; GAE: Gallic Acid Equivalents; GF: Gluten-free; PAs: Phenolic Acids; QE: Quercetin Equivalents;
TFC: Total Flavonoid Content; TPA(s): Total Phenolic Acid(s); TPC: Total Phenolic Content; TPs: Total Phenolics.Antioxidants 2020, 9, 343 13 of 30
3.1. Use of Functional Ingredients in Pasta-Making
3.1.1. Whole Grain Flours
According to the HEALTHGRAIN Consortium, whole grains (WGs) shall consist of “the intact,
ground, cracked or flaked kernel after the removal of inedible parts such as the hull and husk.
The principal anatomical components—the starchy endosperm, germ and bran—are present in the
same relative proportions as they exist in the intact kernel” [62]. While agreement on the definition of
“whole grain” has been reached, there is a lack of consensus on the definition of whole-grain foods,
including “whole grain pasta” [63].
In Germany and Italy, “whole grain pasta” is pasta where 100% of the grain component in the
final product is whole grain; in Denmark, pasta containing a percentage of whole grain equal or higher
than 60% on a dry matter basis, can be classified as “whole grain pasta”; in France and the Netherlands,
there are no regulations nor guidelines for whole grain pasta definition [63].
Two main factors explain these different levels of whole grains admitted in whole grain products.
On the one hand, foods with high whole grain content are not universally appreciated by consumers,
hence manufacturers need to use whole grain ingredients in a level enabling to obtain products with
good sensory qualities. On the other hand, the content of whole grain ingredients used for product
preparation, must be adequate to guarantee nutritional benefits to consumers.
Cereals included in the whole grain definition are wheat (including spelt, emmer, faro, einkorn,
khorasan wheat, durums), rice (including pigmented varieties), barley (including hull-less or naked
barley but not pearled), corn, rye, oats (including hull-less or naked oats), millets, sorghum, teff,
triticale, Canary seed, Job’s tears, fonio, black fonio and Asian millet. Pseudocereals included in the
whole grain definition are amaranth, buckwheat and tartar buckwheat, quinoa, and wild rice [62].
In whole grain flours, the outer multi-layered skin (bran) and the germ are retained together with
the starchy main part of the grain. The bran is a major source of phenolic acids, dietary fibre (DF) and
minerals, while the germ contains vitamins, minerals, fats and some proteins [64]. Phenolic acids,
together with DF, are components responsible for many of the health effects associated with whole
grain consumption [25]. They have shown to act synergistically and modulate favourably appetite,
glucose metabolism, insulin sensitivity, and gut microbiota composition [65], and to have a role in the
prevention and treatment of cardiovascular diseases [66,67]. Several studies have evidenced a lower
risk from all causes and disease-specific mortality associated with a high intake of WGs [68].
The content of phenolic compounds in whole grain pasta has been, however, poorly investigated.
Wójtowicz et al. determined the qualitative and quantitative profile of phenolic compounds in
precooked pasta prepared from whole grain wheat and whole grain spelt [33]. Protocatechuic,
4-hydroxybenzoic, vanillic, syringic, trans-p-coumaric, cis-p-coumaric, trans-ferulic and cis-ferulic acids
were identified in samples under investigation. Cis-ferulic acid was the main phenolic acid in both
whole grain wheat and spelt pasta. In whole grain wheat pasta, vanillic acid was the second more
abundant phenolic compound, while in whole grain spelt pasta, syringic and vanillic acids were
identified as the main phenolics, after cis-ferulic acid. Compared to refined flours, the use of whole
flours enabled to double the intake of phenolic acids. These data are in keeping with Chen et al. who
found ferulic acid as the dominant phenolic compound in six whole grain wheat products, with values
ranging between 99.9 and 316.0 µg/g [34]. In whole wheat pasta (41.4% fortification), Total Phenolic
Acid (TPA) content was 226.7 µg/g dm.
Hirawan et al. determined the total phenolic content (TPC) in regular and whole grain spaghetti,
and found that the former had a TPC level 2-fold lower than the latter [35]. TPC values in whole wheat
spaghetti ranged between 1263 and 1423 µg/g Ferulic Acid Equivalents (FAE)/g dm, while in regular
spaghetti TPC ranged between 718 and 927 µg/g FAE/g dm. It was also observed that all whole wheat
spaghetti samples contained ferulic acid, while this compound was detected only in two out of regular
spaghetti samples. However, TPC significantly decreased after cooking (about 40%), both in regular
and whole wheat spaghetti. Despite the differences in the TPC, regular and whole grain spaghettiAntioxidants 2020, 9, 343 14 of 30
exhibited the same antioxidant capacity, possibly due to the antioxidant components, such as the
Maillard reaction products, formed during pasta drying.
3.1.2. Composite Flours
Composite flours are blends of wheat and varying proportion of legumes, tubers or other cereals,
including minor cereals, and pseudocereals. Cassava, maize, rice, sorghum, millets, potato, barley,
sweet potato and yam are common ingredients of composite flours [69].
The concept of using composite flours in bread and pasta-making was first elaborated to tackle a
low availability of wheat in areas whose climatic conditions are not suitable for wheat production,
and to encourage the use of autochthonous crops with economic advantages for local producers
and consumers [69]. The concept thus first had an economic value. However, partial or total wheat
substitution with composite flours affects also the nutritional profile of the final product. Wheat is,
in fact, deficient in essential amino acids, such as lysine and threonine, and, during milling, bioactive
compounds and minerals are commonly lost. Hence, the use of composite flours contributes to
counteracting these deficiencies. More recently, the concept of “composite flours” has been thus
extended to blends of wheat flour/semolina and other flours richer in essential amino acids, minerals,
vitamins and phenolic compounds.
Blends of cereal flours with pulse flours have been by far explored in pasta-making. Pulses are
an important source of nutrients [69]. They have a low glycemic index and are rich in complex
carbohydrates, DF, plant proteins, and micronutrients. They also have high levels of polyphenols with
good antioxidant properties, and other plant secondary metabolites and components (i.e., isoflavones,
phytosterols, bioactive carbohydrates, alkaloids, and saponins), that are being increasingly recognized
for their bioavailability and potential benefits for human health. Among phenolic compounds, phenolic
acids, flavonoids and condensed tannins are the most abundant [70].
The use of pulses in pasta-making and their contribution to the content of phenolic compounds
have been recently investigated by Turco et al. [36]. They found that, in pasta formulated by wheat
semolina and 35% faba bean (Vicia faba L.) flour, TPC increased from 63.8 mg Gallic Acid Equivalents
(GAE)/100 g dry matter (dm) to 185.3 mg GAE/100 g dm. Cota-Gastélum et al. prepared functional
pasta with varying proportions of wheat (T. durum L.) semolina (0–100%), chickpea flour (0–90%),
and chia flour (0–10%) [37]. In raw samples, the highest phenolic content (approximately 16 mg GAE/g)
was observed when durum semolina was totally replaced and a blend of 10% chia flour and 90%
chickpea flour was used. This value was approximately 8-fold higher than in durum wheat pasta
(2 mg GAE/g) [37]. Carob flour, which is obtained from carob seeds, has been also used in substitution
of semolina in pasta-making. Sȩczyk et al. produced pasta by using varying percentages of carob flour
(1–5%) [38]. They found that the phenolic content in the produced functional pasta was higher than in
the control pasta (3.51 mg GAE/g dm). In pasta with 1% of carob flour, TPC was 5.27 mg GAE/g dm,
and it increased to 12.12 mg GAE/g dm in pasta with 5% carob flour [38].
Pseudocereal flours were also used to partially or totally replace semolina in pasta-making, in order
to enhance pasta nutritional profile. Pseudocereals are, in fact, characterized by a high nutritional
composition, in terms of high content in DF, high-quality protein, essential minerals, vitamins (e.g., folic
acid), essential amino acids and unsaturated fatty acids [71,72]. They are also a valuable source of
phenolic compounds [73]. Varying levels of amaranth seed flours and dried amaranth leaves (35%, 50%,
55% and 70%) were used as semolina substituents in the preparation of elbow-type pasta [39]. Both
grains and leaves are, in fact, rich in bioactive compounds. Grains also show high levels of proteins
(15 g/100 g) and are a source of vitamins, such as thiamine, niacin, riboflavin and folate, and minerals,
namely iron, calcium, zinc, magnesium, phosphorus, copper, and manganese [74,75]. The study by
Cárdenas-Hernández et al. showed that, whichever the substitution levels, amaranth pasta had a TPC
higher than 100% semolina pasta (0.98 mg of FAE/g dm), with values ranging from 1.54 to 3.37 mg
FAE/g dm [39]. The highest value was observed in pasta with a semolina:amaranth flour/leaves ratio ofAntioxidants 2020, 9, 343 15 of 30
65:35. A significant decrease in phenolic content (15–27%) was observed in all amaranth pasta samples,
after cooking [39].
Composite flours have been also used to improve the nutritional value of gluten-free (GF) pasta.
As a matter of fact, GF pasta is mainly produced with GF flours, such as rice and corn, which are low
in micronutrients and bioactive compounds [76]. The use of blue maize in GF pasta-making has been
recently explored. Blue maize (Zea mays L.), like the red and purple varieties, is rich in anthocyanidins
(up to 325 mg/100 g dm), including cyanidin derivatives (75–90%), peonidin derivatives (15–20%) and
pelargonidin derivatives (5–10%) [77]. Different percentages of blue maize (25%, 50% and 75%) were
added to pasta dough produced with equal amounts of unripe plantain and chickpea flour [40]. It was
observed that pasta samples containing 75% of blue maize presented the highest TPC retention after
extrusion and cooking. Upon extrusion, TPC in pasta decreased between 20% and 30%, while an
additional 10% loss occurred upon cooking. The phenolic compounds, retained after extrusion, were
likely bound phenolics, whereas free phenolic species (e.g., free phenolic acids and anthocyanins),
not physically trapped in the protein network, were leached into the cooking water.
The fortification of traditional GF flours with sorghum (Sorghum bicolor (L.) Moench) flour
in pasta-making has been also studied. Sorghum has, in fact, high levels of a diverse array of
beneficial bioactive components (e.g., polyphenols, especially flavonoids), and bioactive lipids (such as
policosanols and phytosterols) [78–80]. Palavecino et al. produced GF pasta with white and brown
sorghum [41]. They compared the two sorghum-based formulations to GF pasta produced with rice,
maize and soy flour. Total phenolic compound content was higher in the two sorghum-based pasta
samples than in the controls, with a value of 2.41 g GAE kg−1 and 2.88 g GAE kg−1 for white and
brown sorghum, respectively. Sorghum pasta, after cooking, also showed higher radical scavenging
activity and ferric reducing ability than the control samples, without significant differences between
sorghum varieties.
3.1.3. Powders and Extracts from Plant Foods and Food By-Products
The use of powders and extracts from plant foods and food by-products in pasta-making is among
the strategies recently explored to obtain functional pasta, both gluten-containing and gluten-free.
Functional pasta was prepared by incorporating carrot powder (10%), mango peel powder
(5%), moringa leaves powder (3%) and defatted soy flour (15%) in a blend of wheat semolina and
pearl-millet [42]. Total flavonoid content (TFC) was determined in order to evaluate the contribution
of these ingredients to the phenolic content in pasta. It emerged that, in the control pasta, TFC was
6.30 mg/100 g. The addition of mango peel powder and moringa leaves powder provided the highest
values (16.53 and 17.98 mg/100 g, respectively), while carrot powder and defatted soy flour contributed
at a lower extent, with values of 7.63 and 8.03 mg/100 g, respectively.
Mushrooms can also contribute to the phenolic dietary intake. The study by Lu et al. investigated
the contribution of mushroom powder addition to the phenolic content of spaghetti [43]. Three different
powders were used: from white button, from shiitake and from porcini mushrooms. Three different
semolina substitution levels were tested: 5 g, 10 g and 15 g/100 g (w/w). It emerged that all
mushroom-powder-supplemented pasta samples showed TPC values significantly higher than semolina
pasta, except for 5% and 10% shiitake mushroom pasta. The greatest values were found in porcini
mushroom pasta samples (approximately 4–5 mg GAE/g dm), followed by the second button mushroom
samples (approximately 2 mg GAE/g dm), and shiitake mushroom pasta.
Plant food industrial processing produces huge amounts of by-products that are a serious
disposal issue. However, some by-products have shown to be an abundant source of valuable
compounds [81]. Hence, in the domain of circular economy, they have been increasingly turned into
functional ingredients. Vegetable wastes, such as peelings, trimmings, stems, seeds, shells, and bran
are some by-products from which phenolic compounds can be extracted [82]. Ultrasound-assisted
extraction, microwave-assisted extraction, supercritical fluid extraction, pressurized fluid extraction,
pulsed electric field extraction and enzyme-assisted extraction are green technologies commonlyAntioxidants 2020, 9, 343 16 of 30
used in the recovery of phenolic compounds from food wastes [82–84]. The choice of the extraction
technique is related to factors including the functional ingredient to extract and the characteristics of
the food matrix.
Onion dry skin powder has been used as a functional ingredient to modulate phenolic compound
content in pasta [44]. Onion dry skins are by-products generated during industrial peeling and contain
bioavailable compounds such as DF, fructo-oligosaccharides and quercetin aglycones. In the study by
Michalak-Majewska et al., semolina was replaced by varying amounts of onion powder: 0%, 2.5%, 5%
and 7.5%. TPC and TFC were determined both in raw and cooked samples. It was observed that pasta
added with onion skin powder showed TPC and TFC higher than the control (100% semolina pasta).
The highest TPC was found in pasta with 7.5% substitution level. Moreover, cooked pasta showed TPC
not significantly different from the corresponding raw sample, whichever addition level of onion skin
powder. Conversely, in the control pasta, TPC decreased after cooking. Hence, the functional pasta
ensured a higher intake of phenolic compounds, compared to 100% semolina pasta. As regards TFC,
the addition of onion skin powder enabled to obtain pasta with higher level of flavonoids, and after
cooking a significant increase was observed.
Durum spaghetti were formulated by the addition of olive paste powder [45]. Olive paste is an
industrial by-product of olive oil production, rich in phenolic compounds [45]. Two levels of olive paste
powder were added to semolina: 10% and 15%. Phenolic content was determined on spaghetti with
10% addition of olive paste powder, since they showed the best sensory properties. TPC was 82.39 µg/g
dm in the control pasta and 245.08 µg/g dm in the enriched spaghetti. In 100% semolina pasta, vanillic
acid was the most abundant phenolic compound in free form (0.56 µg/g dm), while ferulic acid was
the main bound phenolic compound (67.70 µg/g dm). In spaghetti enriched with olive paste powder,
vanillic acid was the main phenolic acid in free form as in the control pasta; however, its content was
higher (7.28 µg/g dm) than in the control. HPLC analysis also showed that the addition of olive paste
powder increased the content of flavonoids, such as quercetin and luteolin.
Functional spaghetti were also produced by addition of extracts from grape marc, made up of
skins, seeds, and stalks [46]. TPC was determined on fresh extruded spaghetti, pasteurized extruded
spaghetti and dry spaghetti. It was found that, compared to the control, the addition of grape
marc extract increased TPC in all enriched spaghetti samples (approximately 700 mg GAE/100g dm).
The pasteurization and drying process did not significantly affect the TPC. Interestingly, after cooking
an increase in TPC was observed, with respect to the raw samples.
Bran is the main by-product of cereal milling and is a great source of phenolic compounds and
minerals. Despite its functionality, its use in pasta-making is challenging, since it has adverse effects
on the quality of the final products, such as an increase of cooking loss, swelling index, and water
absorption in pasta [85]. Recently, bran aqueous extract was used in the production of spaghetti [47].
The extract was obtained by ultrasound assisted-extraction at 20 ◦ C for 25 min. The ratio between
water and bran was 10 L/kg. The bran aqueous extract completely substituted processing water in
pasta-making. A significant increase in phenolic compounds was observed in pasta samples due to the
bran extract. In detail, TPC was 127 mg FAE/100 g fresh weight (fw) in functional spaghetti and 97 mg
FAE/100 g fw in the control pasta.
As regards the formulation of functional GF pasta, different percentages (5% and 10%) of chia
(Salvia hispanica L.) milled seeds were incorporated into rice flour dough [48]. Chia seed addition
allowed increasing phenolic acid content, besides the slowly digestible starch fraction of rice, and
protein and DF content. The highest content of TPAs was observed in raw samples of pasta produced
with 10% milled chia seeds (164.3 µg/g). TPA content in functional GF pasta did not significantly differ
from durum wheat pasta (164.3 vs 149.08 µg/g), but it was by far higher than in pasta produced with
commercial GF flour (10.30 µg/g) [48].
After cooking, TPA content was higher in all pasta samples, with an increase of 5.3% in durum
wheat pasta, 14.8% in commercial GF pasta, 25.5% in pasta with 5% of milled chia seeds and 13.7% in
pasta with 10% of milled chia seeds. The highest content in TPAs was observed in pasta with a 10%Antioxidants 2020, 9, 343 17 of 30
milled chia seeds (186.80 µg/g). The increase in TPA content in cooked samples was possibly due to
the increased bioaccessibility of bound phenolic acids after boiling [48]. Samples also differed for the
content of specific phenolic acids. Addition of milled chia seeds allowed obtaining pasta samples
containing chlorogenic acid, which is otherwise absent in commercial GF and durum wheat pasta.
Chia seed pasta was also rich in caffeic and vanillic acids, in contrast to durum wheat pasta. The higher
was milled chia seed addition, the higher was the content of chlorogenic, caffeic, and vanillic acids.
Oniszczuk et al. investigated the phenolic profile of GF pasta prepared with a blend of rice
and field bean flour, enriched with different amounts (2.5%, 5%, 7.5%, 10%, 12.5% and 15%) of pear
prickly fruit (Opuntia ficus indica (L.) Mill.) [49]. The latter is a source of phenolic compounds and
also provides vitamins (C, B1, B2, A, and E), minerals (calcium, potassium, magnesium, iron, and
phosphorus), and other bioactive compounds, such as carotenoids and betalains. High-performance
liquid chromatography/electrospray ionization tandem mass spectrometry (HPLC-ESI-MS/MS) showed
that pasta samples enriched with the different amounts of pear prickly fruit were rich in several phenolic
acids: protocatechuic, caffeic, syryngic, 4-OH-benzoic, vanilic, gentisic, trans-sinapic, cis-sinapic,
p-coumaric, ferulic, isoferulic, m-coumaric, 3,4-dimetoxycinnamic, and salicylic acids. The dominant
acid was isoferulic. The higher was the addition of pear prickly fruit, the higher was the content of
phenolic acids. Antioxidant activity was also positively correlated with the addition of fruit.
The effect of chestnut fruit (Castanea sativa Mill.) addition (10%, 20%, 30%, 40%, and 50%) to
the aforesaid blend of rice and field bean flour on pasta phenolic content, was also investigated [50].
Chestnut fruit is rich in phenolic compounds, as well as in proteins, unsaturated fatty acids, DF,
vitamins and micronutrients. As regards the content of phenolic compounds, it was observed that the
total content of free phenolic acids increased along with the chestnut addition. TPA content was 38.93,
46.98, 51.47, 56.59, and 65.01 µg/g dm in samples with 10%, 20%, 30%, 40% and 50% of chestnut flour,
respectively [50]. The content of each phenolic acid also increased at a higher addition of chestnut
fruit, with the exception of 4-hydroxy-benzoic and salicylic acids whose level decreased at the increase
of chestnut flour addition. This trend might be explained by a content of these two acids higher in the
rice and field bean flour blend than in chestnut fruit powder.
3.2. Raw Material Processing, Pasta-Making and Pasta Cooking
In addition to the use of raw materials naturally rich in phenolic compounds, such as whole grain
flour, composite flours, and plant powders and extracts, raw material processing and modulation of
pasta-making and pasta cooking parameters have been explored to increase the content of phenolic
compounds in pasta.
Debranning, also known as pearling, is a technology based on the gradual removal of the outer
bran layers prior to milling process. While in conventional milling the aleurone layer remains attached
to the bran, in debranning it remains attached to the endosperm. As a consequence, semolina and
flour obtained by debranning are richer in components commonly found in the grain aleurone.
The technology also enables to isolate aleurone-rich fractions, which can be used as functional
ingredients [86]. Abbasi et al. have recently formulated pasta enriched with a debranning fraction from
purple wheat [51]. The debranning fraction (25%) was added to flour and to semolina by dry mixing,
and macaroni pasta samples were prepared. Experimental analyses on raw materials showed that
phenolic compounds in wheat flour and semolina were negligible compared to the debranning fraction.
Despite the debranning technology enabled to obtain raw materials rich in phenolic compounds,
pasta samples showed TPC lower than it was expected. This was possibly due to the degradation of
phenolics during the pasta-making process, especially in the drying step.
One more study on the formulation of pasta products by using debranning fractions was reported
by Zanoletti et al. [52]. Two functional pasta products enriched with a fraction obtained from either the
first or the second debranning step of purple wheat were produced. The first fraction corresponded
to a debranning level of 3.7% of whole grain, while the second fraction corresponded to 6% of the
debranned grain after the first step. The content of anthocyanins, a subclass of phenolic compoundsYou can also read