Optical Identification of Middle Ear Infection - MDPI
←
→
Page content transcription
If your browser does not render page correctly, please read the page content below
molecules
Review
Optical Identification of Middle Ear Infection
Alisha Prasad † , Syed Mohammad Abid Hasan † and Manas Ranjan Gartia *
 Department of Mechanical and Industrial Engineering, Louisiana State University, Baton Rouge, LA 70803, USA;
 aprasa9@lsu.edu (A.P.); shasan4@lsu.edu (S.M.A.H.)
 * Correspondence: mgartia@lsu.edu
 † These authors contributed equally to this work.

 Academic Editor: Kamilla Malek

 Received: 31 March 2020; Accepted: 29 April 2020; Published: 9 May 2020

 Abstract: Ear infection is one of the most commonly occurring inflammation diseases in the world,
 especially for children. Almost every child encounters at least one episode of ear infection before
 he/she reaches the age of seven. The typical treatment currently followed by physicians is visual
 inspection and antibiotic prescription. In most cases, a lack of improper treatment results in severe
 bacterial infection. Therefore, it is necessary to design and explore advanced practices for effective
 diagnosis. In this review paper, we present the various types of ear infection and the related pathogens
 responsible for middle ear infection. We outline the conventional techniques along with clinical trials
 using those techniques to detect ear infections. Further, we highlight the need for emerging techniques
 to reduce ear infection complications. Finally, we emphasize the utility of Raman spectroscopy as a
 prospective non-invasive technique for the identification of middle ear infection.

 Keywords: middle ear infection; bacterial infection; otitis media; otoscope; drug-resistant microbial;
 label-free method; Raman spectroscopy

1. Introduction
     Ear infection or otitis media (OM) is a commonly found illness in children under the age of
three [1–5]. The healthcare cost due to ear infections in the U.S. is estimated to be $3–5 billion
annually [6–8]. There are three types of OM, acute otitis media (AOM), otitis media with effusion
(OME), and chronic otitis media with effusion [9–13]. AOM occurs in the middle ear due to bacterial
infection resulting in the buildup of fluid. OME also results in the buildup of fluid in the middle
ear area due to inflammation and is much more severe than AOM. The symptom of both AOM and
OME is the swelling of the tympanic membrane (TM). This makes it difficult to diagnose AOM from
OME clinically. The typical diagnostic is based on pneumatic otoscopy, which is the gold standard
to differentiate AOM from OME [14]. The pneumatic otoscope measures the deflection of TM under
pressure by creating an air-tight seal. The response will change when there is fluid buildup behind the
TM. In addition to the complicated process of creating an air-tight seal, the pneumatic otoscope can
neither identify the bacteria involved in the infection nor distinguish viral infections from bacterial
infections. Failure to differentiate viral and bacterial infections and/or AOM from OME may lead to
the prescription of antibiotics, leading to drug-resistant microorganisms. Therefore, accurate detection
and identification of bacteria responsible for OM is a clinically unmet need.
     The three most common bacteria that are responsible for AOM and OME are Streptococcus
pneumoniae (Gram-positive) [15,16], Haemophilus influenza (Gram-negative), and Moraxella catarrhalis
(Gram-negative) [17–21]. Humans asymptomatically harbor these bacteria, and they primarily colonize
in the upper respiratory tract and scantily populate the lower respiratory tract. These bacteria normally
act as symbiotic partners, which ultimately protect the host from getting colonized by possibly more
pathogenic or antibiotic-resistant organisms. Fluid buildup in the middle ear with a moist and warm

Molecules 2020, 25, 2239; doi:10.3390/molecules25092239                       www.mdpi.com/journal/molecules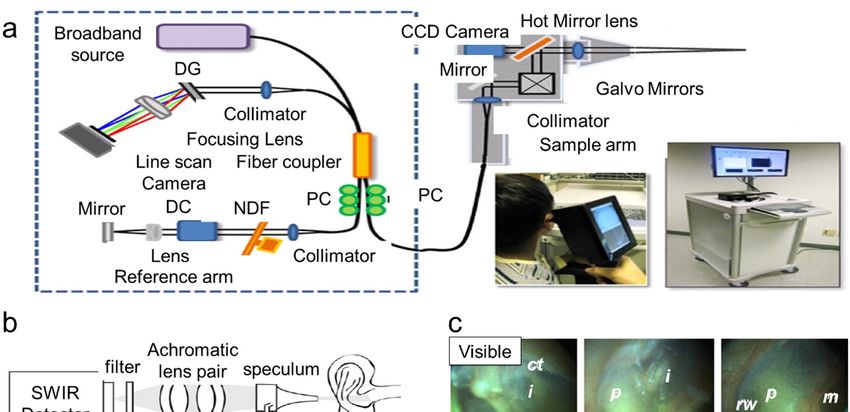
Molecules 2020, 25, 2239 2 of 16
Molecules 2020, 25, x FOR PEER REVIEW 2 of 16
environment provides ready access and a well-suited place for bacterial growth and is the main
acause
moistofand
AOM warm
[20].environment
Acute mastoiditis provides ready access
is another type ofand a well-suited
bacterial infection place for bacterial
resulting growth
from untreated
and is the main cause of AOM [20]. Acute mastoiditis is another type of
acute otitis media, prompting serious exertion and intrusion of the mastoid cells in the mastoid bonebacterial infection resulting
from
locateduntreated
behind the acute
earotitis
[22]. media,
In currentprompting serious exertion
clinical settings, and intrusion
Gram staining of the
is a routine mastoidfollowed,
procedure cells in
the mastoid
wherein ear bone
swabslocated behind
are collected forthe ear [22].
analysis In current
of the bacteria.clinical settings,
The major Gramassociated
drawback staining iswith
a routine
Gram
procedure followed, wherein ear swabs are collected for analysis of the bacteria.
staining is that although it helps in bacterial classification, it gives no information about the bacterial The major drawback
associated
strain. Thiswith Gram staining
misinformation mayiscausethat thealthough
bacterial it infection
helps in to bacterial
recur asclassification,
the prescribedit antibiotics
gives no
information about the
might be resistant bacterial
to the strain.InThis
infection. misinformation
a recent study, it was may causethat
found the only
bacterial
in 25%infection
of theto recura
cases,
as
specific bacteria stain was found in the culture; however, in nearly 80% of the same cases of OME,that
the prescribed antibiotics might be resistant to the infection. In a recent study, it was found the
only in 25%
specific of the cases,
DNA-RNA a specific
of the pathogens bacteria
werestain was found
accurately in thebyculture;
detected however,
polymerase chainin reaction
nearly 80%(PCR)of
the same cases of OME, the specific DNA-RNA of the pathogens were
method [19]. This suggest that the combination of molecular biology techniques (like analysis of DNA, accurately detected by
polymerase
RNA, protein) chain reactionin
is needed (PCR) method
addition [19].
to the This suggesttechniques
microbiology that the combination of molecular
(bacterial staining) biology
for accurate
techniques
examination (like analysis
of the of DNA,
pathogen. RNA, protein)
Although is needed are
these techniques in addition
useful, the to the
mainmicrobiology
drawbacks techniques
include the
(bacterial staining) for accurate examination of the pathogen. Although
requirement of specialized expensive equipment, highly skilled lab personnel, and time-consuming these techniques are useful,
the main drawbacks
sample preparation. include the requirement of specialized expensive equipment, highly skilled lab
personnel,
Althoughand time-consuming
most infections are sample
a result preparation.
of bacterial invasion, there are a few ear infections such as
Although most infections are
vestibular neuronitis, infectious myringitis, a result ofand
bacterial
herpesinvasion,
zoster ofthere are which
the ear, a few ear
are infections
caused bysuch as
viruses.
vestibular
Vestibular neuronitis, infectious
neuritis is caused myringitis,
by the inflammationand herpes
of the zoster of the
vestibular ear, which
nerve, whichare caused by
is situated viruses.
at the inner
Vestibular neuritis is caused by the inflammation of the vestibular nerve,
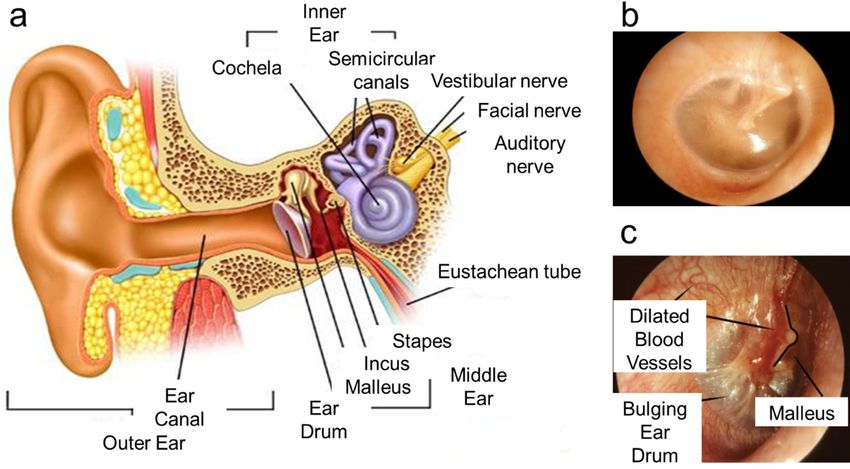
ear (Figure 1a). Acute mastoiditis is a type of bacterial infection resulting from untreated acute otitis which is situated at the
inner ear (Figure 1a). Acute mastoiditis is a type of bacterial infection
media, prompting serious exertion and intrusion of the mastoid cells in the mastoid bone located resulting from untreated acute
otitis
behind media,
the earprompting
[22]. As seen serious
from exertion
Figure 1b, andtheintrusion
eardrum of of athe mastoid
healthy cells pinkish
ear looks in the mastoid bone
gray, whereas
located behind the ear [22]. As seen from Figure 1b, the
the otitis media infected middle ear in Figure 1c has a red, bulging eardrum. eardrum of a healthy ear looks pinkish gray,
whereas the otitis media infected middle ear in Figure 1c has a red, bulging eardrum.
Figure 1. (a) Anatomy of a human ear. Adopted and modified from [9]. (b) Healthy human ear. (c)
Figure 1. (a) Anatomy of a human ear. Adopted and modified from [9]. (b) Healthy human ear. (c)
Infected human ear. Adopted and modified from [23], Copyright Microbiology Society, 2015.
Infected human ear. Adopted and modified from [23], Copyright Microbiology Society, 2015.
In this manuscript, we reviewed the current and emerging optical techniques useful for the
In this
detection of manuscript,
ear infection,we
andreviewed
in Table 1,the
wecurrent
list themand emerging
in detail. opticalintechniques
However, some cases,useful for the
the sensitivity
detection of ear information
and specificity infection, and inear
for Table 1, we list
infection werethem
notinfound.
detail.However,
However,wein some cases,
included the
the sensitivity
performance
and specificity information for ear infection were not found. However, we included the
parameters for those cases based on the same technology that has been applied in similar fields. performance
parameters for those cases
Accurate identification based on
of bacteria theprovide
will same technology
physicians that has been
additional applied intosimilar
information fields.
prescribe the
Accurate identification
proper treatment of bacteria
plan while avoiding willantimicrobial
provide physicians additional
drug resistance. Weinformation to prescribe
also highlighted the Ramanthe
proper treatment plan while avoiding antimicrobial drug resistance. We also highlighted the Raman
spectroscopy-based method as a label-free technique with minimal sample preparation to detect and
identify bacteria relevant to OM.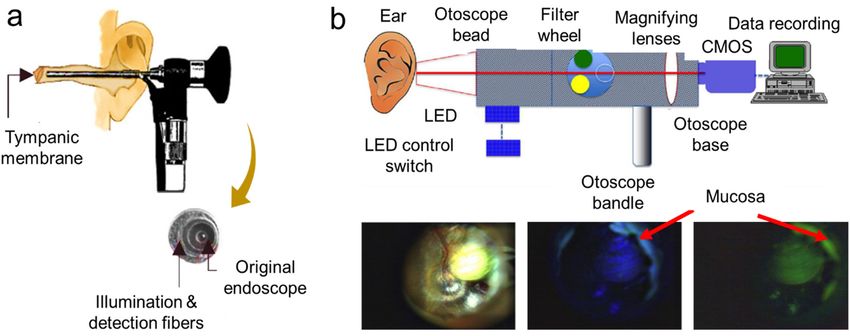
Molecules 2020, 25, 2239 3 of 16
spectroscopy-based method as a label-free technique with minimal sample preparation to detect and
identify bacteria relevant to OM.
Table 1. List of current and emerging optical techniques for the detection of ear infection. OCT, optical
coherence tomography; AOM, acute otitis media.
Performance
Technology Advantages Limitations
Parameters
Visually examines middle ear Sensitivity =
Visual inspection may not be
including coloration, transparency, 61–70%;
Otoscope enough to detect the type of
and presence of liquid in the Specificity =
infection.
tympanic membrane. 61–70% [24,25].
Visually examines middle ear like Visual inspection with the help Sensitivity = 70%;
Cell Scope the otoscope with the help of a of a cellphone may not detect Specificity = 70%
cellphone. the exact type of infection. [26,27].
Electromagnetic waves sensitively * Sensitivity = 82–89%;
Terahertz (THz) Terahertz waves are sensitive
detect water molecules for feasible * Specificity = 66–77%
otoscope to membrane geometry.
AOM diagnosis. [28–30].
Limited information for Sensitivity = 63.6–96%;
Acoustic Measure the fluid formation in the
structural changes in tympanic Specificity = 79.7–87%
reflectometry middle ear.
membrane. [31,32].
Structural changes in Sensitivity = 70–91%;
Examine the movement of the
Tympanometry tympanic membrane cannot be Specificity = 71.7–98%
eardrum by air pressure.
detected accurately. [32–34].
Misinterpretation of diagnosis Sensitivity = 74–94%;
Examine the mobility in the
Pneumatic otoscopy and often performed by Specificity = 79–80%
tympanic membrane.
untrained personnel. [25,35].
Determine the unique chemical Sometimes, Raman signals
Sensitivity = 95.48%;
Raman spectrometer fingerprints of molecules may need to be enhanced for
Specificity = 99.06%.
responsible for ear infection. better sensitivity of detection.
Low-coherence
interferometry (LCI)
Identify pathogens of ear Bacterial pathogens in body
along with Raman Not available.
infection. fluid cannot be detected.
scattering
spectroscopy (RS)
Sometimes, the beam focus
Low-coherence Sensitivity =
Non-invasive; causes no tissue cannot reach to the long ear
interferometry/optical 68–86%;
damage, and suitable for in vivo canal; thus, it delivers
coherence Specificity = 90–98%
applications. inadequate signal-to-noise
tomography [1,36].
ratio data.
* Sensitivity = 89–100%;
Diffuse reflectance Measure the hemoglobin content May not be suitable for in vivo
Specificity = 79–100%
spectroscopy of the tympanic membrane. experiment.
[37,38].
Experiments were done on ear
Reflectance and Analyze the gases and also
phantom and planning to be
scattering absorption determine the oxygen flow in the Not available.
performed in clinical trials
spectroscopy eardrum.
soon.
A platform for fluorescence
imaging of congenital Difficult to get proper * Sensitivity = 96.7%;
Fluorescence
cholesteatomas (i.e., signal-to-noise ratio for weak Specificity = 91.7%
otoscope
non-cancerous skin growth) found fluorescent features. [39].
in the middle ear tissue.
Provide quantitative information Acquiring full Sensitivity = 68–90.9%;
Hand-held OCT about the biofilm progression in three-dimensional in vivo Specificity = 90.2–98%
cases of middle ear infection. imaging is difficult. [1,40]
Analyze the anatomical structures
SWIR (short Some supplementary training Sensitivity = *67–100%;
situated after the thin tissue
wavelength infrared) is required for the medical Specificity = 89–100%
membranes inside the ear such as
otoscope practitioners. [41].
an ear drum.
* Sensitivity =
Confocal laser
Detect biofilm-related middle ear Detecting biofilm in adenoid is 85.19–98.15%;
scanning microscopy
pathogens. a challenging task. Specificity =
(CLSM)
97.6–99.26% [42,43].
* Refers to a similar technology, but not specifically applied to detect ear infection.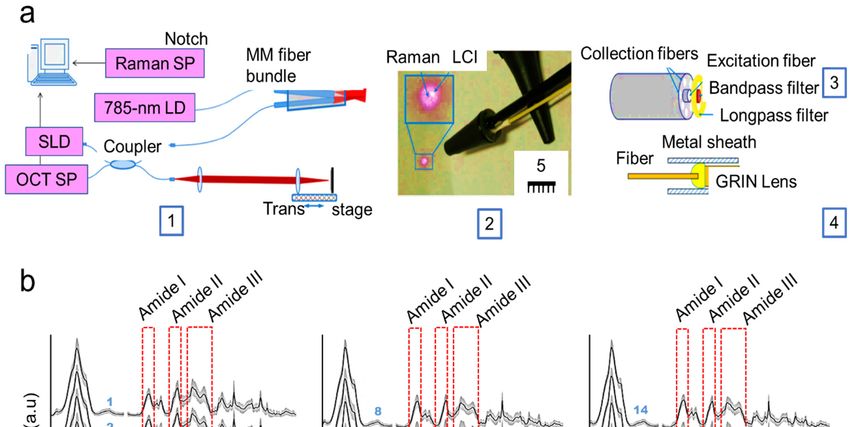
*Sensitivity=
Confocal laser Detecting biofilm in 85.19–98.15%;
Detect biofilm-related middle ear
scanning microscopy adenoid is a challenging Specificity =
pathogens.
(CLSM) task. 97.6–99.26%
Molecules 2020, 25, 2239 4 of 16
[42,43].
* Refers to a similar technology, but not specifically applied to detect ear infection.
2. Clinical Imaging Techniques for the Identification of Otitis Media
2. Clinical Imaging Techniques for the Identification of Otitis Media
Clinically, an otoscope is the most widely used device by an otolaryngologist for identification of
problemsClinically, an otoscope
associated with ear is the most
pain. The key widely used device
parameters examined by an inotolaryngologist
the middle ear includefor identification
coloration,
of problems associated with ear pain. The key parameters examined
transparency, and the presence of liquid in the tympanic membrane [14]. In most cases, patients in the middle ear include
are
coloration, transparency, and the presence of liquid in the tympanic
advised oral or topical antibiotics; although being sufficient for pain, the infection recurs due to membrane [14]. In most cases,
the
patients are
evolution advised oral or topical bacteria.
of antimicrobial-resistant antibiotics; although
It has been foundbeing that
sufficient for pain,
the frequent usethe
ofinfection
antibiotics recurs
and
due to the evolution of antimicrobial-resistant bacteria. It has been found
bacterial biofilms can help to increase antimicrobial resistance [44,45]. Recently, Yang et al. developed that the frequent use of
antibiotics and bacterial biofilms can help to increase antimicrobial resistance
an antibiotic-encapsulated hydrogel with chemical permeation enhancers to improve the drug efficiency [44,45]. Recently, Yang
et al.antimicrobial
and developed antherapy antibiotic-encapsulated
of the hydrogel,hydrogel when applied with chemical permeation
to the tympanic enhancers
membrane to improve
through the
the drug efficiency and antimicrobial therapy of the hydrogel,
external auditory canal of the ear. The formulated hydrogel successfully eradicated AOM from the when applied to the tympanic
membrane through
Haemophilus influenzaethe external
bacteria in aauditory
chinchillacanal
model of [46].
the ear. The dosage
A single formulatedof suchhydrogel
drugs wouldsuccessfully
cover
eradicated AOM from the Haemophilus influenzae bacteria in a chinchilla
a complete antibiotic course, improving patient compliance, avoiding antibiotic over-dosage, and model [46]. A single dosage
of such drugs
ultimately would
reducing cover a side
recurrent complete antibiotic
effects. Figure 2a course, improving
(left) shows patient
a typical compliance,
otoscope, avoiding
and Figure 2a
antibiotic over-dosage, and ultimately reducing recurrent side effects.
(right) shows an iPhone-enabled otoscope (Cell Scope). Monroy et al. mentioned that an otoscope Figure 2a (left) shows a typical
otoscope,
showed and Figure 70%
approximately 2a (right)
sensitivityshowsandan iPhone-enabled
specificity for diagnosis otoscope (Cell
of otitis mediaScope). Monroy et
[24]. Although al.
both
mentioned that an otoscope showed approximately 70% sensitivity and
the otoscope and CellScope are useful tools, visual inspection alone may not be sufficient to detect the specificity for diagnosis of
otitis media [24]. Although both the otoscope and CellScope are useful
specific type of infection, in more severe cases. AOM is associated with inflammatory changes, such as tools, visual inspection alone
may not beinsufficient
variations the mucous to detect the specific
membrane, type of infection,
accumulation of liquid,inand more severe
pus. Some cases.
visualAOM is associated
observation can
with inflammatory changes, such as variations in the mucous membrane,
be made with the otoscope; however, any chemical changes or identification of bacterial phenotype accumulation of liquid, and
pus.not
are Some visual
possible observation
with a conventionalcan beotoscope.
made with Ji etthe
al.otoscope;
designedhowever, any chemical
and constructed a terahertzchanges
(THz) or
identification of bacterial phenotype are not possible with a conventional
otoscope, which works on THz technology or in other words electromagnetic waves to detect water otoscope. Ji et al. designed
and constructed
molecules a terahertz
sensitively (THz)
for feasible AOM otoscope,
diagnosis.which The works on THz
detection technology or waves
of electromagnetic in other words
enabled
electromagnetic
by waves to detect
the terahertz technology is helpful water
for molecules
obtaining precisesensitively for feasibleinformation.
ear membrane AOM diagnosis. FigureThe 2b
shows the schematics of a THz otoscope, which is integrated with a conventional optical obtaining
detection of electromagnetic waves enabled by the terahertz technology is helpful for otoscope
precise
with ear membrane
a fiber-coupled THz information.
module. ItFigure 2b shows to
was interesting theseeschematics of a THz
that this device canotoscope,
be used aswhich both isa
integrated
THz otoscope,withasa well
conventional optical otoscope
as a conventional otoscope. with a fiber-coupled
While THz technology THz module.
has beenIt used
was interesting
in several
to see that this
biomedical device can
applications, betechnology
this used as both a THz
helps otoscope, diagnose
the physician as well asAOM a conventional
as well. Fromotoscope. While
their results,
THz technology has been used in several biomedical applications, this
it was evident that it was possible to identify the presence of water located at the membrane and technology helps the physician
diagnose
sample AOM as
interface well.
with From to
respect their results,types
different it was of evident
THz pulses that regulated
it was possible to identifythickness
by membrane the presence
and
of water located at the membrane
separate refractive indices [47]. and sample interface with respect to different types of THz pulses
regulated by membrane thickness and separate refractive indices [47].
Figure 2. Clinically available tools to detect middle ear infection. (a) CellScope; (b) terahertz
Figure 2. Clinically available tools to detect middle ear infection. (a) CellScope; (b) terahertz otoscope
otoscope [47].
[47].
A few other clinical methods for the diagnosis of otitis media and otitis media-related infections
include acoustic reflectometry, tympanometry, and pneumatic otoscopy. Acoustic reflectometry is
used to measure the fluid formation in the middle ear and has 63.6–96% sensitivity and 79.7–87%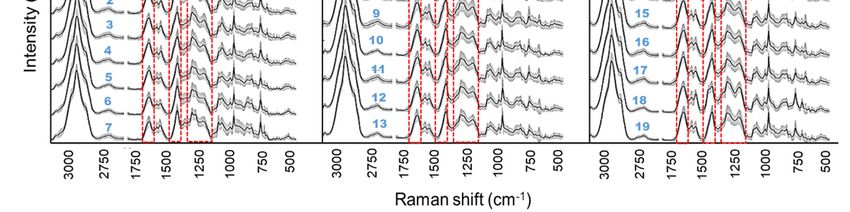
Molecules 2020, 25, 2239                                                                             5 of 16

specificity [31,32]. Tympanometry is used to examine the movement of the eardrum by air pressure
and has 70–91% sensitivity and 71.7–98% specificity [32–34]. Pneumatic otoscopy is used to examine
the mobility in the tympanic membrane with diagnostic accuracy (percent of total test items correct)
of about 76%. Pneumatic otoscopy showed 24% improvement in sensitivity and 42% improvement
in specificity, compared to a conventional otoscope [25]. However, Sundvall et al. reported the
sensitivity and specificity of pneumatic otoscopy as 94% and 80%, respectively [27,35]. According to
a clinical chronic ear survey (CES), it was found that in nearly 25–50% of cases of ear inspection,
otolaryngologists do not use pneumatic otoscopes, while the ergonomic survey reveals that in most of
the remaining cases, nearly 43% of pneumatic diagnosis are misinterpreted and performed by untrained
personnel [48]. However, these three techniques—pneumatic otoscopy, acoustic reflectometry, and
tympanometry—have a common limitation, as they cannot provide complete depth-resolved statistics
regarding the structural variations at the tympanic membrane. Furthermore, if any kind of biofilm has
formed behind the tympanic membrane, it will not be detected properly by these techniques [49].

3. Preclinical Imaging Techniques for the Identification of Otitis Media
      Optical-based diagnostics, which utilize the properties and behavior of light to obtain information
about the structure and properties of matter, is emerging as a powerful technique for various biomedical
examinations. Although there are a few scientific publications exploring optical imaging for middle ear
evaluation, in clinical settings, they have generally been unexplored. To date, no technique manages to
replicate or surpass otoscopic clinical capabilities. In this section, we cover published reports on optical
imaging of middle ear pathologies. For example, Raman spectroscopy is a label-free method that utilizes
the light scattering phenomena to determine the unique chemical fingerprints of any molecule by
probing individual chemical bond vibrations [50]. According to the literature, the Raman spectrometer
has been utilized extensively for identifying single bacteria cells or bacterial colonies based on the
acquired Raman spectra [51–54]. Recently, several researchers have also exploited Raman spectroscopy
for identification and detection of pathogens in ear infection cases. For example, in a recent study, a
Raman spectrometer was used to understand the middle ear pathology and analyze the molecular
peaks from the collected spectra [55]. They found the sensitivity and specificity to be 95.48% and
99.06%, respectively, from their experiment. However, one of the limitations of the Raman spectrometer
is the weak signal, and by enhancing the signal, detection sensitivity can be improved [56]. Zhao et al.
also developed a combinatorial platform assembling low-coherence interferometry (LCI) along with
Raman scattering spectroscopy (RS) to identify pathogens relevant to ear infection. Figure 3a shows a
schematic representation of their assembly. The LCI helps to distinguish and detect depth-resolved
structural evidence of the pathogens, while the Raman spectrometer provides non-invasive molecular
evidence. Together, they help to improve the diagnostic capability for identification of middle ear
infection (or AOM) in real-time. On the other hand, this technology cannot detect bacteria pathogens
in body fluid as it requires them to be restricted to a limited area of the microscope [56]. In another
similar study, Rebrosova et al. utilized a Raman spectrometer to detect Staphylococcal species (n = 16)
from bacterial colonies. Such studies could be applied for the identification of the Staphylococcal type
of bacteria found prominently in ear infection patients [57–62]. Raman spectroscopy is a challenging
technique, as the Raman spectra are generated from numerous molecular constituents of the target.
Hence, the global spectral features of a single bacteria or bacterium would ideally show peaks within a
certain range for biomolecules such as proteins (amide bonds), lipids, carbohydrates, and nucleic acids
(polypeptide backbone) [63]. This information is shown in Figure 3b, and the Raman band assignments
of these common bacteria of ear infection are tabulated in Table 2.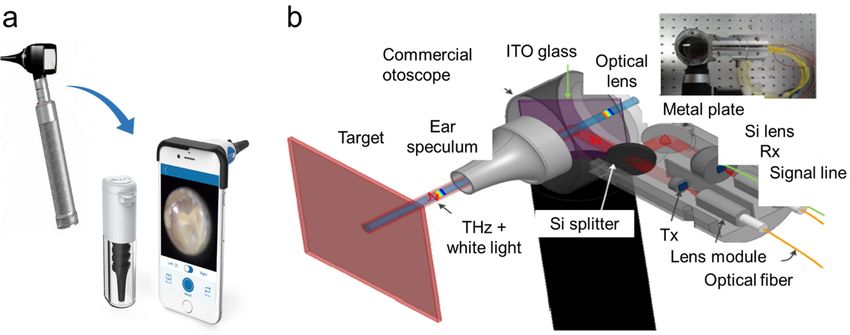
Molecules 2020, 25, 2239                                                                                                 6 of 16
Molecules 2020, 25, x FOR PEER REVIEW                                                                                    6 of 16

     Figure 3.
     Figure       (a) Raman
              3. (a)   Raman and and low-coherence
                                       low-coherence interferometry
                                                        interferometry (Raman
                                                                           (Raman LCI)
                                                                                     LCI) ((gradient
                                                                                           ((gradient index
                                                                                                          index (GRIN);
                                                                                                                 (GRIN);
     spectrometer    (SP); laser diode   (LD);  superluminescence    diode   (SLD);  multimode    (MM)).
     spectrometer (SP); laser diode (LD); superluminescence diode (SLD); multimode (MM)). Reproduced        Reproduced
     with permission
     with  permission from
                         from [56]
                               [56].. (b)
                                      (b) Mean
                                          Mean Raman
                                                  Raman spectra
                                                          spectra of
                                                                   of common
                                                                      common bacteria
                                                                                  bacteria of
                                                                                           of ear
                                                                                              ear infection.
                                                                                                   infection. 1:  Listeria
                                                                                                               1: Listeria
     grayi, 2: Listeria innocua,   3:  Listeria monocytogenes,  4:  Listeria  welshimeri, 5:  Staphylococcus
     grayi, 2: Listeria innocua, 3: Listeria monocytogenes, 4: Listeria welshimeri, 5: Staphylococcus aureus, 6:aureus,  6:
     Staphylococcus cohnii, 7: Staphylococcus epidermidis, 8: Escherichia coli, 9: Pseudomonas aeruginosa, 10:
     Staphylococcus cohnii, 7: Staphylococcus epidermidis, 8: Escherichia coli, 9: Pseudomonas aeruginosa, 10:
     Pseudomonas putida, 11: Pseudomonas stutzeri, 12: Salmonella enterica, 13: Salmonella typhimurium, 14:
     Pseudomonas putida, 11: Pseudomonas stutzeri, 12: Salmonella enterica, 13: Salmonella typhimurium, 14:
     Yersinia aldovae, 15: Yersinia bercovieri, 16: Yersinia enterocolitica, 17: Yersinia mollaretii, 18: Yersinia rohdei,
     Yersinia aldovae, 15: Yersinia bercovieri, 16: Yersinia enterocolitica, 17: Yersinia mollaretii, 18: Yersinia rohdei,
     19: Yersinia ruckeri. Adopted and modified with permission from [64]. Copyright Elsevier Ltd., 2013.
     19: Yersinia ruckeri. Adopted and modified with permission from [64]. Copyright Elsevier Ltd., 2013.
     Table 2. Raman spectra and band assignments observed in common pathogens such as S. pneumoniae,
     Table  2. Raman
     H. influenzae,    spectra andMoraxella,
                    P. aeruginosa,  band assignments    observed
                                             Streptococcus       in common
                                                           pyogenes,         pathogensaureus
                                                                     and Staphylococcus  such as[58–61,64].
                                                                                                  S. pneumoniae,
     H. influenzae, P. aeruginosa, Moraxella, Streptococcus pyogenes, and Staphylococcus aureus [58–61,64].
             Range (cm−1 )                                  Peak Assignment
  Range (cm−1)                                           Peak Assignment
            640–675                                Guanine (B-DNA), tyrosine valine
    640–675 713–740                              GuanineAdenine,
                                                           (B-DNA),        tyrosine valine
                                                                       glycoside
    713–740 745–790                                     Adenine,
                                                 Cytosine,             glycoside
                                                           uracil, thymine,      tryptophan
    745–790 800–815                                          O–P–O
                                              Cytosine, uracil,        (RNA) tryptophan
                                                                    thymine,
    800–815 930–990                       C-C stretch (α-helix
                                                            O–P–O skeletal
                                                                        (RNA) mode), C–N stretch
           1000–1010                          Phenylalanine, C–C aromatic ring stretch
    930–9901025–1060                    C-C stretch (α-helix skeletal mode), C–N stretch
                                      C–C stretch (phospholipids, glucosidic rings), C–N stretch
   1000–1010
           1080–1105            PO /O–P–OPhenylalanine,
                                   2−        (DNA), CO3 2− /C–CC–Coraromatic         ring stretch
                                                                         C–O–C stretching     (carbohydrates)
   1025–1060
           1130–1145               C–C stretch (phospholipids,
                                                    C–O–C (unsaturatedglucosidic      rings), C–N stretch
                                                                              fatty acids)
           1215–1295
   1080–1105                           Amide
                              PO2-/O–P–O      III (random),
                                          (DNA),             thymine
                                                     CO32-/C–C           phenylalanine,
                                                                   or C–O–C                tryptophan
                                                                                   stretching  (carbohydrates)
           1330–1345
   1130–1145                                         Adenine,  guanine,     C–H
                                                  C–O–C (unsaturated fatty acids)  stretch
           1390–1415                                   COO– symmetric stretch
   1215–1295
           1440–1475
                                    Amide III (random),CH   thymine      phenylalanine, tryptophan
                                                                2 deformation
   1330–1345
           1510–1560                               Adenine,Amide
                                                              guanine,       C–H stretch
                                                                      II (C=C)
   1390–1415
           1570–1595                                  COO–
                                        Adenine, guanine       symmetric
                                                            (ring  stretching), stretch
                                                                                   nuclei acid bands
           1658–1700
   1440–1475                                                     Amide
                                                          CH2 deformation   I
           2890–2900
   1510–1560                           C−H-stretching deformation
                                                           Amide IIvibrations
                                                                          (C=C) of CH2 and CH3
   1570–1595                          Adenine, guanine (ring stretching), nuclei acid bands
   1658–1700                                                     Amide I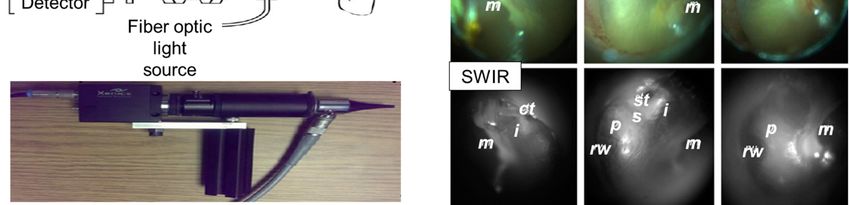
Molecules 2020, 25, 2239                                                                            7 of 16

      These Raman peaks are helpful in identifying the pathogen; however, classifying these pathogenic
strains as per the nomenclature is challenging without statistical analysis. Therefore, researchers have
used multivariate analysis to define, differentiate, and classify the constituent peaks from the bacteria
to detect clinically relevant information with precise specificity [65]. In a similar study, Pandey et al.
used Raman spectroscopy to image myringosclerosis, a pathologic condition arising due to calcium
deposits on the tympanic membrane, and to understand the molecular characteristics of these whitish,
sclerotic plaques [66]. Similarly, Ayala et al. used an in vivo confocal assisted Raman microscope to
analyze and study the profile of three commonly found bacteria, Haemophilus influenzae, Moraxella
catarrhalis, and Streptococcus pneumonia grown on agar plates which are responsible for acute otitis
media (AOM) [20]. Their group also conducted an extensive study on Staphylococcus aureus using
Raman spectroscopy, to understand the antibiotic resistance capability of this species from the acquired
Raman peaks [67]. In 2018, Boppart et al. developed and patented a Raman handheld device to detect
microbiological constituents of the middle ear from the collected Raman spectrum [68]. This handheld
Raman tool can serve as a point-of-care device providing the potential for label-free, non-invasive,
real-time identification and detection of ear contagions.
      Besides Raman spectroscopy, several other optical systems have been constructed lately. In this
section, we present some of the notable works using emerging optical platforms for diagnosis of ear
infection. For example, Sundberg et al. used diffuse reflectance spectroscopy, an infrared spectroscopy
technique, to measure the hemoglobin content of the tympanic membrane in children to find whether
or not they were affected with otitis media [69]. Figure 4a shows the schematic of their assembled setup,
which included a probe head along with its illumination and detector fibers. Because the tympanic
membrane is well supplied with blood vessels and sensory nerve fibers, the oxygenated hemoglobin
peaks could be recorded at 542 nm and 576 nm, respectively. The hypothesis of their study was that
the diffuse reflectance spectra from a healthy and an erythematous tympanic membrane ought to differ
analogously with the spectra. This method is fast and non-invasive, making it very advantageous and
competitive for in vivo measurements over other optical methods. However, their probe design may
not be suitable for in vivo experiments for conscious children.
      Scientists have also constructed ear phantoms to understand the acoustic transmission in the
internal ear cavities. The middle ear cleft contains two capillary vessels: one with arterial blood
takes away oxygen (O2 ), while the vessels with venous blood escalates the carbon dioxide (CO2 ) and
water vapor (H2 O) from the air at the fork. Because of the anatomy of the middle ear, this circulation
is in the order of a few minutes such that the partial pressure of these gases in air and the blood
vessels is equal [70]. This gas exchange mechanism has been used to explore different regions of the
air-filled middle ear cavities such as the tympanic membrane caries, aditus, antrum, and the mastoid
air cell system [71]. Recently, Zhang et al. developed a noninvasive optical method by combining
reflectance and scattering absorption spectroscopy. In their setup, absorption spectroscopy was utilized
for analyzing the gases by collecting the backscattered light through a fiber-optics probe, while the
diffuse reflectance spectra were used simultaneously to determine the oxygen flow in the eardrum
with a reflectance probe [9]. The combined spectroscopic approach was very convincing because
the absorption marks of gases were nearly 104 times finer compared to immediate solid constituents,
providing a high accuracy of diagnosis. They recently improved their performance of detection by
using a more realistic phantom compared to the previous studies, but clinical trials are yet to be
performed in the near future [72].
      Besides pneumatic assessment to differentiate healthy and diseased ear sections, based on single
wavelength transmission, researchers have also explored multi-wavelength based imaging strategies.
A few advantages of a multi-wavelength imaging system in comparison to the latter include the ability
to obtain high-resolution cell images with reduced flare and low signal-to-noise ratio irregularities.
For almost a century and to date, white light otoscopes were/are used extensively for the identification
of external auditory canal and middle ear pathologies. Recently, Valdez et al. coupled the conventional
otoscope with multiwavelength fluorescent filters and a CMOS camera to record videos of the
Molecules 2020, 25, 2239 8 of 16
Molecules 2020, 25, x FOR PEER REVIEW 8 of 16
ear
Figureinfections.
4b (bottom) Figureshows 4b the(top) shows
images of the block diagram
the middle of their design,
ear and tympanic membrane and by Figure
using4b (bottom)
white light
shows
otoscopy and fluorescence imaging acquired at two different excitations (405 nm and 450 and
the images of the middle ear and tympanic membrane by using white light otoscopy nm,
fluorescence
respectively).imaging Their team acquired at two different
demonstrated this excitations
proof-of-concept(405 nmplatform
and 450 nm, for respectively).
fluorescence imaging Their team of
demonstrated this proof-of-concept platform for fluorescence
congenital cholesteatomas (i.e., non-cancerous skin growth) found in the middle ear tissue. This imaging of congenital cholesteatomas
(i.e., non-cancerous
assembled otoscope skin broughtgrowth) found
together in the middle
a portable, ear tissue.
adaptable, This feasible
low-cost, assembled otoscope imaging
fluorescence brought
together
device for a portable, adaptable, low-cost,
clinical identification of middle feasible fluorescence
ear pathologies. imaging device
However, for clinical
their system identification
was limited to the
of middle ear pathologies. However, their system was limited to
gain signal from the brightest chromophores, and it was difficult to get a proper signal-to-noise ratio the gain signal from the brightest
chromophores,
for weak fluorescent and it was difficult
features [73].toStudies
get a properhave signal-to-noise
also been reported ratio for
on weak
applyingfluorescent features
non-contact [73].
optical
Studies
sensinghave also been
techniques orreported on applying
optical scattering non-contact
techniques byoptical
using sensing techniques
low-coherence or optical
light to obtain scattering
2D/3D
techniques by using low-coherence
images of biological tissues/sections light
in to obtainresolution.
micron 2D/3D images Thisofimaging
biological tissues/sections
technique is widely in known
micron
resolution. This imaging
as optical coherence technique(OCT)
tomography is widely known as optical
or low-coherence coherence tomography
interferometry (LCI). Nguyen (OCT)et al.or
low-coherence interferometry (LCI). Nguyen et al. integrated
integrated these techniques to identify infected and non-infected ear based on light scattering these techniques to identify infected and
non-infected
phenomena arising ear based from onthelight scattering
middle phenomena
ear biofilms arising
[1]. Their from the
research group middle
also ear biofilmsLCI
integrated [1].with
Theira
research group also
video otoscope integrated
to quantify theLCI with ainvideo
biofilms otoscope
an animal modelto quantify
based onthe thebiofilms
developed in analgorithm
animal model code
based on the developed algorithm code [36]. The advantages of
[36]. The advantages of OCT are that it is non-invasive, causes no tissue damage, and is suitable forOCT are that it is non-invasive, causes
no tissue
in vivo damage, and
applications [74].isHowever,
suitable for dueinto vivo
theapplications
long ear canal, [74]. However,it due
sometimes, to the long
is difficult to getear canal,
a proper
sometimes,
signal-to-noise it is ratio
difficult from to get
the aLCI/OCT
proper signal-to-noise
setup as the beam ratio from
focusthe LCI/OCT
is not able tosetup reach asthere
the beam focus
[1]. Near-
is not able to reach there [1]. Near-infrared OCT has been demonstrated
infrared OCT has been demonstrated to detect middle ear biofilms by penetrating through the tissues to detect middle ear biofilms by
penetrating
of an ear with through the tissues of an ear
ultra-high-resolution up to with ultra-high-resolution
nearly 1.3 μm and generating up to nearly
3D images 1.3 µmfor and generating
visualization
3D images for visualization [75]. Jung et al. and Nguyen et al.
[75]. Jung et al. and Nguyen et al. were the forerunners in this area of research and also assembled were the forerunners in this area ofa
research
portable,and also assembled
handheld OCT system, a portable, handheld
as shown OCT system,
in Figure 5a. Their as shown
OCT setup in Figure 5a. Their
contained OCT setup
a broadband
contained a broadband
source to generate source to generate
low-coherence low-coherence
light, a fiber coupler for light, a fibertwo
splitting coupler
beams, forand
splitting two beams,
transferring it to
and transferring it to the interferometer, a linear photodetector that
the interferometer, a linear photodetector that captured the scattered beams, and a computer for data captured the scattered beams, and a
computer
acquisition. forThey data utilized
acquisition. this They
OCT utilized
system to this OCTbacterial
detect system tobiofilms
detect bacterial
accumulated biofilms accumulated
in the eardrum.
in the eardrum.
However, acquiring However,
complete acquiring complete three-dimensional
three-dimensional imaging is still a challenge imagingfor is their
still asystem
challenge for
[76,77].
their system [76,77]. While a clinical otoscope only provided
While a clinical otoscope only provided subjective or qualitative diagnosis, the assembled handheldsubjective or qualitative diagnosis, the
assembled
OCT provided handheld OCT provided
quantitative quantitative
information about information
the biofilm about the biofilm
progression progression
in cases of middle in cases
ear
of middle ear infection. OCT has also been applied to understand
infection. OCT has also been applied to understand AOM and chronic cases of otitis media in the AOM and chronic cases of otitis
media
tympanic in the tympanic
membrane membraneAOM
[75].Besides [75].Besides AOM identification,
identification, several studies several
have alsostudies havethe
utilized also utilized
handheld
the
OCT handheld
for scanning OCTbiofilms
for scanning frombiofilms
the tympanic from the tympanic
membrane membrane
[1,77–79]. [1,77–79]. By
By combining combining
a fiber a fiber
based device
based device with OCT, Boppart et al. studied possible reasons
with OCT, Boppart et al. studied possible reasons for the formation of fluid behind the ear drum as for the formation of fluid behind thea
ear
resultdrum as a result
of otitis mediaofwith otitis media [80].
effusion with effusion [80].
Figure 4. Tools available to detect middle ear infection. (a) Diffuse reflectance spectroscopy. Reproduced
Figure 4. Tools available to detect middle ear infection. (a) Diffuse reflectance spectroscopy.
with permission from [68]. Copyright IOP Publishing, 2017. (b) Fluorescence otoscope. Reproduced
Reproduced with permission from [68]. Copyright IOP Publishing, 2017. (b) Fluorescence otoscope.
with permission from [72], Copyright American Chemical Society, 2014.
Reproduced with permission from [72], Copyright American Chemical Society, 2014.
The clinical otoscope has a single white light source only, which limits its applicability from an
optical imaging standpoint. To overcome this, Carr et al. used short wave infrared (SWIR) lightthree common bacteria, namely H. influenzae, S. pneumoniae, and M. catarrhalis, by using a fluorescent
dye and a bacterial targeting ligand, Concanavalin A [83]. Similarly, Hoa et al. used confocal laser
scanning microscopy (CLSM) to detect middle ear pathogens in biofilms obtained from the nasal
cavities [84]. The bacteria type was identified by using type-specific 16S ribosomal RNA labeled with
Molecules Cy525,fluorescent
Cy3 and2020, 2239 9 of 16
dyes, respectively. However, detecting biofilm in adenoid is a challenging
task by using CLSM, and the role of adenoid biofilm in ear infection is very significant [84,85].
Figure Tools available
Figure 5.5. Tools available toto detect
detect middle
middle ear
ear infection. (a) Handheld
infection. (a) Handheld OCTOCT (optical
(optical coherence
coherence
tomography)
tomography) (diffraction grating (DG); polarization controller (PC); dispersion compensation (DC)
(diffraction grating (DG); polarization controller (PC); dispersion compensation (DC)
materials;
materials; neutral
neutral density
density filter
filter (NDF)).
(NDF)). Reproduced
Reproduced with
with permission
permission from
from [76].
[76]. Copyright
Copyright Elsevier
Elsevier
B.V.,2013.
B.V.,2013. (b)
(b) SWIR
SWIR (short
(short wavelength
wavelength infrared)
infrared) otoscope. Reproduced with
otoscope. Reproduced with permission
permission from
from [81]
[81]..
Copyright
Copyright National
National Academy
Academy of of Sciences,2016
Sciences,2016 (c)
(c) Representative
Representative images
images for
for (b)
(b) Reproduced
Reproduced with
with
permission from [81]. Copyright National Academy of Sciences,2016. ct, chorda tympani; i, incus; m,
malleus; p, cochlear promontory; st, stapedial tendon; s, stapes; rw, round window niche.
The clinical otoscope has a single white light source only, which limits its applicability from
an optical imaging standpoint. To overcome this, Carr et al. used short wave infrared (SWIR)
light combined with an otoscope to analyze the anatomical structures situated after the thin tissue
membranes inside the ear such as the ear drum [81]. SWIR covers the wavelength from 1.4 to 3 microns
in the electromagnetic spectrum and as a result can often offer increased penetration and better image
resolution that is otherwise not achievable with visible light imaging. In Figure 5b, we show the
schematic of their SWIR system, which includes a fiber-coupled light source, a pair of achromatic
doublet lenses, a disposable medical speculum, an indium gallium arsenide (InGaAs) sensor, and
an SWIR detector. As shown in Figure 5c, they compared SWIR otoscope-acquired images with
visible images and successfully identified the chorda tympani, cochlear promontory, malleus, stapedial
tendon, incus, stapes, and round window niche (indicated by their initials as shown in the images).
Even though their system was very much viable to image middle ear pathologies, sometimes it may
require some supplementary training of the medical practitioners. In another similar study, Schaefer et
al. also suggested an infrared light source for thermography for early recognition of various infections,
not only in ears, but also other facial areas [82].
Confocal laser scanning microscopy (CLSM) is another emerging real-time in vivo imaging system.
Hall-Stoodley used CLSM to obtain middle-ear mucosa biopsy specimens and concluded that otitis
media was biofilm related [19]. On the other hand, Tang et al. used CLSM and identified three common
bacteria, namely H. influenzae, S. pneumoniae, and M. catarrhalis, by using a fluorescent dye and aMolecules 2020, 25, 2239 10 of 16
bacterial targeting ligand, Concanavalin A [83]. Similarly, Hoa et al. used confocal laser scanning
microscopy (CLSM) to detect middle ear pathogens in biofilms obtained from the nasal cavities [84].
The bacteria type was identified by using type-specific 16S ribosomal RNA labeled with Cy3 and Cy5
fluorescent dyes, respectively. However, detecting biofilm in adenoid is a challenging task by using
CLSM, and the role of adenoid biofilm in ear infection is very significant [84,85].
In recent years, more focus has been devoted towards building point-of-care devices/technology,
for example handheld OCT or handheld Raman probes, for easy, handy, and accurate diagnosis in
clinical or non-clinical settings [77,78,86].
4. Clinical Trials Using the Optical Imaging Techniques
Although the data in clinical trials are limited due to the tedious investigation protocols, number
of subjects, and patient consent issues, we have listed a few published reports on Phase II clinical
trials (in Table 3) wherein the number of patients/participants observed were greater than 10. We
also categorized these approaches based on the device/technology used, brief objectives, and main
findings. These clinical trials suggested that an otoscope is the most used medical device by healthcare
professionals (e.g., physicians, nurse practitioners, audiologists) to screen or diagnose patients with ear
infection followed by tympanometry and optical coherence tomography.
Table 3. List of Phase II clinical trials for ear infection detection.
No. of
Technology Objective Main Observations Patients Authors
Observed
Physicians, patients, and parents
favored CellScope Oto in
Otoscope with # Used for diagnosis of the comparison to the conventional
cellphone: tympanic membrane. otoscope as it was easy to use, had Richards
# Handy, easy to use, 51 (adults)
CellScope Oto good diagnostic precision, with the et al. [87]
(CSO) good precision. benefit of image acquisition
to track changes through the period
of infection.
# Used for examination of the
tympanic membrane and to SWIR facilitated non-invasive
identify fluid accumulation optical penetration to image
in the middle ear. deep ear tissues and identify fluid
Carr et al.
SWIR otoscope # The infrared transmission accumulation in the middle ear, 10 (adults)
[81]
provides better visibility of which is otherwise difficult to
the anatomical components visualize from a conventional
of the inside ear. otoscope.
Due to a lack of techniques to track
early symptoms in children with
# Used for routine checkup AOM, a parent-reported AOM
from parent-reported severity of symptoms (AOM-SOS) Shaikh et
Otoscope symptom for children with 264 (children)
structured questionnaire was al. [88]
AOM (AOM-SOS). established to understand the AOM
symptoms for better treatment
trials.
To understand AOM diagnosis,
endoscopic still images of the
# Used to identify otitis media tympanic membrane were
from endoscopic still images Shaikh et
Otoscope examined by expert otoscopists. 783 (children)
of the tympanic membranes. al. [89]
Preventive antibiotic treatment was
the individual-advised diagnostic
criteria.
# Used for routine analysis to This study revealed the general ear
check for dullness or reflex features in healthy newborns (~ 72 h
Pneumatic Cavanaugh
from the tympanic of life), mostly having pink/red 81 (newborn)
otoscope et al. [90]
membrane in newborns. colored eardrums, with a dull
gray/opaque tympanic membrane.Molecules 2020, 25, 2239 11 of 16
Table 3. Cont.
No. of
Technology Objective Main Observations Patients Authors
Observed
# Used to determine severity
of AOM for both This clinical trial helped to
symptomatic and understand the severity and
otoscopic conditions. symptoms of uni-/bi-lateral AOM in
# Routine analysis of Uitti et al.
Otoscope children aged 6 to 35 months. 232 (children)
tympanic membrane, bulla [91]
Assessment revealed that bilateral
formation, hemorrhagic AOM was more severe than
redness, and unilateral AOM.
purulent effusion.
A randomized trial was conducted
to understand physician diagnosis
# Used to assess the effect of and prescription for OM when
tympanometry on diagnosis using either a tympanometry Spiro et al.
Tympanometry 698 (children)
of otitis media. (specific to the middle ear) or an [92]
otoscope (sees all the ear). The
study revealed that antibiotics were
prescribed for OM in both cases.
# Used to compare the The clinical trial study showed that
effectiveness of tympanometry could be used as an
Tympanometry Helenius
tympanometry with respect adjunctive device with pneumatic 515 (children)
with otoscope et al. [93]
to pneumatic otoscopy. otoscopy and not as a standalone
device.
# Used for ear canal imaging The OCT clinical trials provided a
of the human tympanic non-invasive means to study the
Optical membrane to identify middle ear microstructure in vivo
Djalilian
coherence epithelial and collagenous utilizing a safe near-infrared light 10 (adults)
et al. [94]
tomography layers and quantify source. Advantages include the
their thickness. ability to image diseased tissues
with high resolution.
# Used for measuring the The biofilm thickness results from
optical properties of the the OCT clinical trials revealed a
Optical tympanic membrane. statistically significant quantitative Monroy et
coherence # Handheld, easy to use, for 34 (children)
difference between normal, acute, al. [24]
tomography noninvasive and chronic otitis media (OM)
routine analysis. infections.
Combination of
# For proper diagnosis and The clinical findings from the OCT
low-coherence
visualization of the image scans in adults with chronic
interferometry Nguyen
tympanic membrane with OM indicated the formation of 20 (adult)
and optical et al. [1]
and without biofilm growth. biofilms as opposed to no biofilms
coherence
in healthy subjects.
tomography
Spectral domain-OCT (840 nm) was
utilized to acquire axial depth scan
# Used to observe effusion of images from normal and healthy ear
Optical otitis media infected areas to understand the OM infections. 39 Cho et al.
coherence based on the axial These OCT image databases could (non-specified) [95]
tomography depth scan. potentially serve as a means to
upgrade the current otoscopic
techniques.
# Used for identification of
Confocal laser biofilm growth from otitis The CLSM mucosal biofilm images,
Hall
scanning media and middle-ear collected in this clinical study,
26 (children) Stoodley
microscopy mucosa (MEM) revealed that chronic OM in
[19]
(CLSM) biopsy specimens. humans is biofilm related.Molecules 2020, 25, 2239 12 of 16
5. Conclusions
This review summarized the literature regarding clinical and preclinical imaging techniques used
for optical identification of middle ear infections. Clinical methods of investigating infections using a
conventional otoscope, tympanometry, and optical coherence tomography were discussed along with
their advantages and limitations. The list of clinical trial further presented the current medical devices
used to diagnose middle ear infections. Furthermore, novel preclinical approaches and information on
non-invasive Raman spectroscopy techniques for the detection of middle ear infection were presented
to provide an outline of the current literature and to create a guideline for future progress. Although
these non-invasive techniques are promising, future work should be directed to conducting clinical
trials for these emerging imaging techniques to combat the suspected inefficiency in the current otologic
diagnosis and help with the accurate treatment of middle ear infection decision making.
Author Contributions: Conceptualization, M.R.G., A.P., and S.M.A.H; writing, original draft preparation, review
and editing, A.P. and S.M.A.H.; supervision, M.R.G.; funding acquisition, M.R.G. All authors have read and
agreed to the published version of the manuscript.
Funding: A.P. was supported by the Louisiana Board of Regents Support Fund (RCS Award Contract
Number: LEQSF (2017-20)-RD-A-04). M.R.G. acknowledges the support from LaSPACE REA SSC (Award
No. AWDC-001589).
Conflicts of Interest: The authors declare no conflict of interest.
References
1. Nguyen, C.T.; Jung, W.; Kim, J.; Chaney, E.J.; Novak, M.; Stewart, C.N.; Boppart, S.A. Noninvasive in vivo
optical detection of biofilm in the human middle ear. Proc. Natl. Acad. Sci. USA 2012, 109, 9529–9534.
[CrossRef] [PubMed]
2. Klein, J.O. Otitis media. Clin. Infect. Dis. 1994, 19, 823–832. [CrossRef] [PubMed]
3. Roberts, J.E.; Rosenfeld, R.M.; Zeisel, S.A. Otitis media and speech and language: A meta-analysis of
prospective studies. Pediatrics 2004, 113, e238–e248. [CrossRef] [PubMed]
4. Klein, J.O. The burden of otitis media. Vaccine 2000, 19, S2–S8. [CrossRef]
5. Harmes, K.; Blackwood, R.A.; Burrows, H.; Cooke, J.M.; Van Harrison, R.; Passamani, P. Otitis media:
Diagnosis and treatment. Am. Fam. Physician 2013, 88, 435–440.
6. Heikkinen, T.; Thint, M.; Chonmaitree, T. Prevalence of various respiratory viruses in the middle ear during
acute otitis media. N. Engl. J. Med. 1999, 340, 260–264. [CrossRef]
7. Stool, S.E.; Field, M.J. The impact of otitis media. Pediatric Infect. Dis. J. 1989, 8, S11–S14. [CrossRef]
8. Ahmed, S.; Shapiro, N.L.; Bhattacharyya, N. Incremental health care utilization and costs for acute otitis
media in children. Laryngoscope 2014, 124, 301–305. [CrossRef]
9. Zhang, H.; Huang, J.; Li, T.; Svanberg, S.; Svanberg, K. Optical detection of middle ear infection using
spectroscopic techniques: Phantom experiments. J. Biomed. Opt. 2015, 20, 057001. [CrossRef]
10. Bluestone, C.D.; Klein, J.O. Otitis Media in Infants and Children; PMPH: North Carolona, USA, 2007.
11. Dicks, L.; Knoetze, H.; Van Reenen, C. Otitis media: A review, with a focus on alternative treatments.
Probiotics Antimicrob. Proteins 2009, 1, 45–59. [CrossRef]
12. Maxson, S.; Yamauchi, T. Acute otitis media. Pediatrics Rev. 1996, 17, 191. [CrossRef]
13. Kubba, H.; Pearson, J.; Birchall, J. The aetiology of otitis media with effusion: A review. Clin. Otolaryngol.
Allied Sci. 2000, 25, 181–194. [CrossRef] [PubMed]
14. Lieberthal, A.S.; Carroll, A.E.; Chonmaitree, T.; Ganiats, T.G.; Hoberman, A.; Jackson, M.A.; Joffe, M.D.;
Miller, D.T.; Rosenfeld, R.M.; Sevilla, X.D. The diagnosis and management of acute otitis media. Pediatrics
2013, 131, e964–e999. [CrossRef] [PubMed]
15. Tonnaer, E.L.; Graamans, K.; Sanders, E.A.; Curfs, J.H. Advances in understanding the pathogenesis of
pneumococcal otitis media. Pediatric Infect. Dis. J. 2006, 25, 546–552. [CrossRef] [PubMed]
16. Reid, S.D.; Hong, W.; Dew, K.E.; Winn, D.R.; Pang, B.; Watt, J.; Glover, D.T.; Hollingshead, S.K.; Swords, W.E.
Streptococcus pneumoniae forms surface-attached communities in the middle ear of experimentally infected
chinchillas. J. Infect. Dis. 2009, 199, 786–794. [CrossRef] [PubMed]Molecules 2020, 25, 2239 13 of 16
17. Cappelletty, D. Microbiology of bacterial respiratory infections. Pediatric Infect. Dis. J. 1998, 17, S55–S61.
[CrossRef]
18. Del Beccaro, M.A.; Mendelman, P.M.; Inglis, A.F.; Richardson, M.A.; Duncan, N.O.; Clausen, C.R.; Stull, T.L.
Bacteriology of acute otitis media: A new perspective. J. Pediatrics 1992, 120, 81–84. [CrossRef]
19. Hall-Stoodley, L.; Hu, F.Z.; Gieseke, A.; Nistico, L.; Nguyen, D.; Hayes, J.; Forbes, M.; Greenberg, D.P.;
Dice, B.; Burrows, A. Direct detection of bacterial biofilms on the middle-ear mucosa of children with chronic
otitis media. JAMA 2006, 296, 202–211. [CrossRef]
20. Ayala, O.D.; Wakeman, C.A.; Skaar, E.P.; Mahadevan-Jansen, A. Identification of bacteria causing acute otitis
media using Raman microspectroscopy. In Biomedical Vibrational Spectroscopy 2016: Advances in Research and
Industry; International Society for Optics and Photonics; San Francisco, CA, USA, 2016; p. 97040U.
21. Holm, M.M.; Vanlerberg, S.L.; Sledjeski, D.D.; Lafontaine, E.R. The Hag protein of Moraxella catarrhalis strain
O35E is associated with adherence to human lung and middle ear cells. Infect. Immun. 2003, 71, 4977–4984.
[CrossRef]
22. Ludman, H.S.; Bradley, P.J. ABC of Ear, Nose and Throat; John Wiley & Sons: Hoboken, NJ, USA, 2012;
Volume 254.
23. Mittal, R.; Lisi, C.V.; Gerring, R.; Mittal, J.; Mathee, K.; Narasimhan, G.; Azad, R.K.; Yao, Q.; Grati, M.H.; Yan, D.
Current concepts in the pathogenesis and treatment of chronic suppurative otitis media. J. Med. Microbiol.
2015, 64, 1103. [CrossRef]
24. Monroy, G.L.; Shelton, R.L.; Nolan, R.M.; Nguyen, C.T.; Novak, M.A.; Hill, M.C.; McCormick, D.T.;
Boppart, S.A. Noninvasive depth-resolved optical measurements of the tympanic membrane and middle ear
for differentiating otitis media. Laryngoscope 2015, 125, E276–E282. [CrossRef] [PubMed]
25. Jones, W.S.; Kaleida, P.H. How helpful is pneumatic otoscopy in improving diagnostic accuracy? Pediatrics
2003, 112, 510–513. [CrossRef] [PubMed]
26. Moshtaghi, O.; Sahyouni, R.; Haidar, Y.M.; Huang, M.; Moshtaghi, A.; Ghavami, Y.; Lin, H.W.; Djalilian, H.R.
Smartphone-enabled otoscopy in neurotology/otology. Otolaryngol. Head Neck Surg. 2017, 156, 554–558.
[CrossRef] [PubMed]
27. Bhavana, K.; Ahmad, M.; Sharma, P. Smartphone Otoscopy Sans Attachment: A Paradigm Shift in Diagnosing
Ear Pathologies. OTO Open 2018, 2, 2473974X18786496. [CrossRef] [PubMed]
28. Son, J.H.; Oh, S.J.; Cheon, H. Potential clinical applications of terahertz radiation. J. Appl. Phys.
2019, 125, 190901. [CrossRef]
29. D’Arco, A.; Di Fabrizio, M.; Dolci, V.; Petrarca, M.; Lupi, S. THz Pulsed Imaging in Biomedical Applications.
Condens. Matter 2020, 5, 25. [CrossRef]
30. Reid, C.B.; Fitzgerald, A.; Reese, G.; Goldin, R.; Tekkis, P.; O’Kelly, P.; Pickwell-MacPherson, E.; Gibson, A.P.;
Wallace, V.P. Terahertz pulsed imaging of freshly excised human colonic tissues. Phys. Med. Biol. 2011, 56, 4333.
[CrossRef]
31. Teppo, H.; Revonta, M.; Lindén, H.; Palmu, A. Detection of middle-ear fluid in children with spectral gradient
acoustic reflectometry: A screening tool for nurses? Scand. J. Prim. Health Care 2006, 24, 88–92. [CrossRef]
32. Shekelle, P.; Takata, G.; Chan, L.S.; Mangione-Smith, R.; Corley, P.M.; Morphew, T.; Morton, S. Diagnosis,
natural history, and late effects of otitis media with effusion. Evid. Rep./Technol. Assess. 2002, 55, 1.
33. Palmu, A.; Puhakka, H.; Rahko, T.; Takala, A.K. Diagnostic value of tympanometry in infants in clinical
practice. Int. J. Pediatric Otorhinolaryngol. 1999, 49, 207–213. [CrossRef]
34. Watters, G.; Jones, J.; Freeland, A. The predictive value of tympanometry in the diagnosis of middle ear
effusion. Clin. Otolaryngol. Allied Sci. 1997, 22, 343–345. [CrossRef] [PubMed]
35. Sundvall, P.D.; Papachristodoulou, C.E.; Nordeman, L. Diagnostic methods for acute otitis media in 1 to 12
year old children: A cross sectional study in primary health care. BMC Fam. Pract. 2019, 20, 127. [CrossRef]
[PubMed]
36. Nguyen, C.T.; Tu, H.; Chaney, E.J.; Stewart, C.N.; Boppart, S.A. Non-invasive optical interferometry for
the assessment of biofilm growth in the middle ear. Biomed. Opt. Express 2010, 1, 1104–1116. [CrossRef]
[PubMed]
37. Evers, D.J.; Nachabé, R.; Klomp, H.M.; van Sandick, J.W.; Wouters, M.W.; Lucassen, G.W.; Hendriks, B.H.;
Wesseling, J.; Ruers, T.J. Diffuse reflectance spectroscopy: A new guidance tool for improvement of biopsy
procedures in lung malignancies. Clin. Lung Cancer 2012, 13, 424–431. [CrossRef] [PubMed]You can also read