Iodine Biofortification of Apples and Pears in an Orchard Using Foliar Sprays of Different Composition
←
→
Page content transcription
If your browser does not render page correctly, please read the page content below
ORIGINAL RESEARCH
                                                                                                                                             published: 24 February 2021
                                                                                                                                           doi: 10.3389/fpls.2021.638671

                                             Iodine Biofortification of Apples and
                                             Pears in an Orchard Using Foliar
                                             Sprays of Different Composition
                                             Christoph Budke 1* , Werner Dierend 1 , Hans-Georg Schön 1 , Katja Hora 2 ,
                                             Karl Hermann Mühling 3 and Diemo Daum 1
                                             1
                                              Faculty of Agricultural Sciences and Landscape Architecture, Osnabrück University of Applied Sciences, Osnabrück,
                                             Germany, 2 SQM International N.V., Antwerpen, Belgium, 3 Faculty of Agricultural and Nutritional Sciences, Institute of Plant
                                             Nutrition and Soil Science, Kiel University, Kiel, Germany

                                             Many people across the world suffer from iodine (I) deficiency and related diseases. The
                                             I content in plant-based foods is particularly low, but can be enhanced by agronomic
                                             biofortification. Therefore, in this study two field experiments were conducted under
                                             orchard conditions to assess the potential of I biofortification of apples and pears by
                                             foliar fertilization. Fruit trees were sprayed at various times during the growing season
                                             with solutions containing I in different concentrations and forms. In addition, tests were
                                             carried out to establish whether the effect of I sprays can be improved by co-application
                           Edited by:
                  Victoria Fernandez,        of potassium nitrate (KNO3 ) and sodium selenate (Na2 SeO4 ). Iodine accumulation in
     Polytechnic University of Madrid,       apple and pear fruits was dose-dependent, with a stronger response to potassium
                                Spain
                                             iodide (KI) than potassium iodate (KIO3 ). In freshly harvested apple and pear fruits,
                        Reviewed by:
                                             51% and 75% of the biofortified iodine was localized in the fruit peel, respectively. The
                  Vitor L. Nascimento,
Universidade Federal de Lavras, Brazil       remaining I was translocated into the fruit flesh, with a maximum of 3% reaching the
                    Sylwester Smoleń,       core. Washing apples and pears with running deionized water reduced their I content by
   University of Agriculture in Krakow,
                                 Poland      14%. To achieve the targeted accumulation level of 50–100 µg I per 100 g fresh mass in
                 *Correspondence:            washed and unpeeled fruits, foliar fertilization of 1.5 kg I per hectare and meter canopy
                   Christoph Budke           height was required when KIO3 was applied. The addition of KNO3 and Na2 SeO4 to
          c.budke@hs-osnabrueck.de
                                             I-containing spray solutions did not affect the I content in fruits. However, the application
                   Specialty section:        of KNO3 increased the total soluble solids content of the fruits by up to 1.0 ◦ Brix
         This article was submitted to       compared to the control, and Na2 SeO4 in the spray solution increased the fruit selenium
                        Plant Nutrition,
               a section of the journal
                                             (Se) content. Iodine sprays caused leaf necrosis, but without affecting the development
            Frontiers in Plant Science       and marketing quality of the fruits. Even after three months of cold storage, no adverse
       Received: 07 December 2020            effects of I fertilization on general fruit characteristics were observed, however, I content
        Accepted: 22 January 2021            of apples decreased by 20%.
       Published: 24 February 2021
                               Citation:     Keywords: pome fruit, agronomic biofortification, foliar fertilization, iodide, iodate, selenium, potassium nitrate,
    Budke C, Dierend W, Schön H-G,           total soluble solids
    Hora K, Mühling KH and Daum D
(2021) Iodine Biofortification of Apples
 and Pears in an Orchard Using Foliar        Abbreviations: CH, canopy height; DM, dry matter; FM, fresh matter; GF-AAS, graphite furnace atomic absorption
     Sprays of Different Composition.        spectrometry; ICP-MS, inductively coupled plasma mass spectrometry; POD, point of deliquescence; POE, point of
          Front. Plant Sci. 12:638671.       efflorescence; TMAH, tetramethylammonium hydroxide; VDLUFA, Association of German Agricultural Analytic and
      doi: 10.3389/fpls.2021.638671          Research Institutes.

Frontiers in Plant Science | www.frontiersin.org                                     1                                         February 2021 | Volume 12 | Article 638671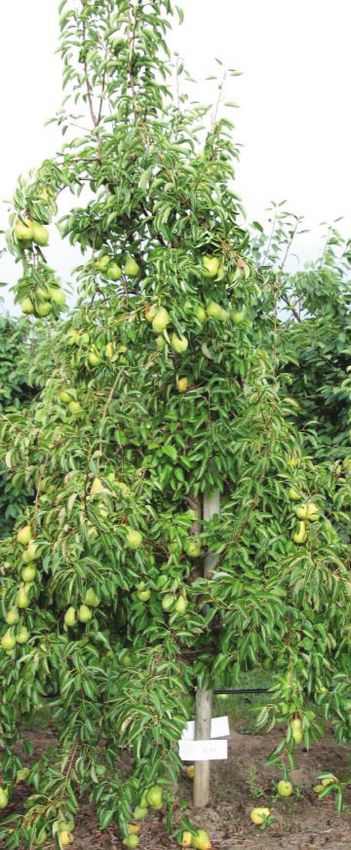
Budke et al.                                                                                                        Iodine Biofortification Apples and Pears

INTRODUCTION                                                                   are peeled. This is important because a previous study on apples
                                                                               showed that more than half of the foliar-sprayed I is localized
Iodine is an integral component of thyroid hormones, which                     in the fruit peel. Nevertheless, I in the peel is hardly affected
control various metabolic processes in the human body. Globally,               by washing of the fruit under running water – this reduced the
around two billion people are insufficiently supplied with this                fruit I content by only 8% (Budke et al., 2020a). Thus, when
essential trace element (Andersson et al., 2012). The associated               fresh pome fruits are consumed, most of the biofortified I usually
health disorders range from mild, unspecific symptoms such                     becomes nutritionally effective. In contrast, processed foods, such
as listlessness to severe neurological developmental disorders.                as potatoes, vegetables, and cereals, may experience significant
Iodine deficiency is considered to be the most common single                   I losses through cooking, peeling, or extraction compared to
cause of preventable brain damage and intellectual disability in               harvested produce. Even then, however, enough I remains in the
children worldwide (Benoist et al., 2009; Redman et al., 2016).                biofortified plant-based foods to substantially increase dietary
Even a mild to moderate I deficiency during pregnancy and in the               supply of this micronutrient (Caffagni et al., 2012; Gonnella et al.,
first years of life can lead to children not being able to fully exploit       2019; Cakmak et al., 2020). Loss of I from iodized table salt during
their cognitive development potential (Velasco et al., 2018; Bath,             food preparation can be much higher. When cooking vegetables
2019). The problem of I deficiency exists in both developing and               or potatoes with iodized table salt, only very little amounts of
industrialized countries. In Europe, about 44% of the population               the I dissolved in the cooking water enters the prepared food
is inadequately supplied with I, despite its wealth and its high               (Comandini et al., 2013; Weng et al., 2014).
standards of health care (Zimmermann, 2017). The widespread                        The inorganic I− and IO3 − forms, which are mainly used
occurrence of I deficiency is due to the fact that the native I                for the biofortification of food plants, are characterized by a
content in food is usually very low. Food crops such as fruits,                high bioavailability (> 95%) in the human organism (Hou,
vegetables and cereals usually contain no more than about 1.0 µg               2009). After the incorporation of I into plant tissue, it is
of I per 100 g of fresh mass, since soils are low in phytoavailable            mainly present in the cytoplasm, and to a smaller extent in the
I, and therefore the absorption of this trace element by plants is             cell wall or the organelles (Weng et al., 2014). Iodine can be
quite limited (Fuge, 2013; Milagres et al., 2020).                             incorporated into various organic compounds such as proteins,
    An option for increasing the I content of food crops is                    lipids, polysaccharides and polyphenols (Millard, 1988; Hou,
therefore to fertilize the soil with I-containing salts. Various               2009), and occurs naturally in the form of triiodothyronines or
studies show that this measure actually has an effect, but requires            other iodo-tyrosins in lettuce and tomato plants even if they are
relatively high amounts of I fertilizer (Ren et al., 2008; Weng et al.,        not receiving exogenous I (Halka et al., 2019; Sularz et al., 2020).
2014). This is due to the relatively rapid fixation of I in the soil           Recently, in a study on proteomics in Arabidopsis thaliana (L.),
when applied as iodide (I− ) or iodate (IO3 − ). In addition, these            I has been found to be organified in many important regulatory
inorganic I forms can be converted by soil microorganisms into                 proteins of the plant, pointing to a nutritional role of I for plants
gaseous compounds such as methyl iodide, which are emitted                     at concentrations which are generally much lower than the I levels
into the atmosphere (Ashworth, 2009; Shetaya et al., 2012; Fuge,               applied for purpose of biofortification (Kiferle et al., 2020). So far,
2013). While leafy and root vegetables respond relatively well                 little is known about which of these organic I species play a major
to I soil fertilization, only little I reaches the edible plant parts          role in I-fertilized plants. Nevertheless, several studies conducted
of fruit vegetables and cereals using this method (Hong et al.,                in vitro and as clinical trials indicate that biofortified I remains
2008; Cakmak et al., 2017). Compared to soil fertilization, foliar             largely bioavailable in plant foods (Tonacchera et al., 2013; Li
applications proved to be much more efficient. For example, it                 et al., 2018; Cakmak et al., 2020).
was possible to biofortify lettuce adequately with I if the plants                 Previous work showed that it is possible to biofortify apples
were sprayed with 0.5 kg I ha−1 one week before harvest. With                  with I via foliar fertilization in an order of magnitude appropriate
soil drenches, a 15-fold higher I fertilizer quantity was required             for improving the dietary I intake. However, this required that
for the same I enrichment in this leafy vegetable (Lawson et al.,              the applied KI-containing solution was supplied directly to the
2015). Also in experiments carried out with strawberries and                   fruits. No significant translocation of I from the leaves to the
cereals, foliar sprays proved to be superior to soil fertilization             fruits was observed, although the I content in the leaves rose
in order to increase the I content in the fruits and grains,                   up to over 2,000 µg (100 g FM)−1 as a result of the treatment.
respectively (Cakmak et al., 2017; Budke et al., 2020b).                       Thus it was concluded that leaf-absorbed I in apple trees is
    In this study apples and pears were selected as target crops               hardly translocated via the phloem (Budke et al., 2020a). The
for I biofortification via foliar sprays. These fruits have several            aforementioned study was performed on apple trees cultivated
characteristics that make them particularly suitable for improving             in a plastic tunnel. The trees were protected from precipitation
the dietary I intake in I deficiency areas. First of all, apple and            and temporarily exposed to a microclimate with higher humidity.
pear are among the ten most important fruit species in the                     These conditions may have favored the absorption of the sprayed
world with a production of 86 million tons and 24 million tons,                I into the fruit. Therefore, the present study was designed to
respectively (FAO, 2020). Fruits can be stored for a long time –               evaluate the efficacy of I biofortification under field conditions
pears for a few months, while apples from domestic production                  in an apple and pear orchard.
can be offered in food stores throughout the year. Pome fruits are                 Regarding the effect of the I form – I− versus IO3 − –
usually eaten with the peel, while other fruits that are regularly             on I accumulation in plants, different results are reported in
consumed in larger quantities, such as bananas and citrus fruits,              the literature. In some cases, foliar-applied I− proved to be

Frontiers in Plant Science | www.frontiersin.org                           2                                    February 2021 | Volume 12 | Article 638671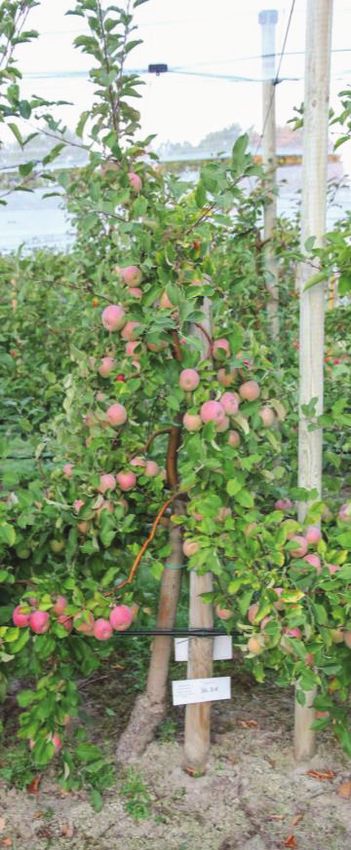
Budke et al.                                                                                                              Iodine Biofortification Apples and Pears

more easily absorbable, while in other experiments no consistent             storage-related changes in I and Se contents. Additionally, the
differences between the two I forms could be observed (Lawson                distribution and translocation of the trace elements within
et al., 2015; Lawson et al., 2016; Cakmak et al., 2017). At higher           biofortified fruits (fruit peel, fruit flesh and fruit core) were
fertilization rates, however, IO3 − is generally better tolerated            studied from harvest through storage.
by plants than I− (Dávila-Rangel et al., 2019). Therefore, we                   Overall, the aim of this study was to investigate various aspects
examined in our field experiments how treatments with both                   of I biofortification of apples and pears by different foliar spray
I species affected the development and external appearance of                treatments during cultivation in an orchard, relevant for an
leaves and fruits.                                                           implementation of this approach in fruit growing practice. We
   Various additives can be used to improve the effect of foliar             tested the hypothesis that by this method these pome fruits
fertilization. Surfactants contribute to improve wetting of the              can be enriched with I at a level sufficient for improvement of
sprayed above-ground plant parts (Fernández et al., 2013). They              human I nutrition.
are particularly important for the treatment of pome fruit, as the
fruits form a epicuticular wax layer during their development
which is much thicker than that of leaves (Fernandes et al., 1964).          MATERIALS AND METHODS
The hydrophobic coatings impair the penetration of ionic solutes
into the fruit. In I fertilization experiments with wheat, apart             Plant Material and Growing Conditions
from a wetting agent, the addition of KNO3 to the spray solution             Field experiments were conducted on two sites in an orchard
had a positive effect on the absorption and translocation of the             of the horticultural trial station of the Osnabrück University
trace element in the plant. The I content in grains was 1.5–2.3              of Applied Sciences (site 1: 52◦ 180 23.500 N 8◦ 020 23.700 E; site 2:
times higher when I was sprayed with a wetting agent or KNO3                 52◦ 180 39.100 N 8◦ 010 42.300 E). Both neighboring locations (distance
than when I was applied alone (Cakmak et al., 2017). In the                  approx. 1.2 km as the crow flies) were characterized by a plaggen
present study all foliar sprays were supplied with a surfactant              soil of loamy-sand texture. Soil analyses in representative samples
additionally. Furthermore, the effect of co-fertilization of KNO3            were conducted in 2012 (for site 1) and 2017 (for site 2). The
on I accumulation in apples and pears was investigated.                      results are shown in Table 1. The first field experiment was carried
   In addition to I, Se plays an important role in normal thyroid            out in 2013 on site 1 and included apple trees (Malus domestica)
function (Schomburg and Köhrle, 2008). In many European                      of the variety ‘Jonagold’ and pear trees (Pyrus communis) of the
countries and other regions of the world, the native Se content              variety ‘Alexander Lucas’. The second field experiment took place
in plant-based foods is very low and therefore an insufficient               on site 2 in 2018 with apple trees of the variety ‘Fuji’ and pear
dietary intake of Se is also widespread (Rayman, 2008; Peters                trees of the variety ‘Williams Christ’. Here, the soil was fertilized
et al., 2016). Again, as with I, the original reason for this is the         with 90 kg K2 O ha−1 in spring. The planting distances of the trees
low phytoavailability of the trace element in soils (Poòaviè and             were 3.25 m × 1.0 m for the apple trees and 3.25 m × 1.5 m for the
Scheib, 2014; dos Reis et al., 2017). Simultaneous biofortification          pear trees. This corresponds to a total number of 3,076 apple trees
of food crops with I and Se is therefore considered to be a useful           and 2,051 pear trees per hectare. The trees had an average height
strategy for the prevention of thyroid diseases (Lyons, 2018).               of 2.5 – 3.0 m and were grown in spindle form with a dominant
   Biofortified fruit can be marketed with nutritional claims such           trunk (Figures 1A,B). The average air temperature, precipitation
as “rich in iodine”. The willingness of customers to buy such                quantity and number of rainy days were 14.2 ◦ C, 392.5 mm and
products is even greater when other quality characteristics such as
the taste of the fruit are also appealing (Wortmann et al., 2018).
The sugar content affects the degree of sweetness and thus the               TABLE 1 | Results of the soil analyses from the experimental sites.
taste of the fruits (Aprea et al., 2017; Charles et al., 2017). Both I
and Se are known to influence the allocation of photoassimilates                                         First field trial (site 1)   Second field trial (site 2)
in plants. Studies on strawberries have shown that, depending on             Soil parameter              Topsoil     Subsoil      Topsoil     Subsoil
amount, form and application technique, I fertilization can have
                                                                                                       (0 - 30 cm) (30 - 60 cm) (0 - 30 cm) (30 - 60 cm)
beneficial and inhibitory effects on the accumulation of soluble
solids in the fruits, which are mainly composed of sugars (Li et al.,        Phosphorus (CAL)*               D              D              C              C
2017; Budke et al., 2020b). Spraying of pear trees with sodium               Potassium (CAL)*                D              C              C              C
selenate (Na2 SeO4 ) resulted in a significant increase in the total         Magnesium (CaCl2 )              E              D              C              C
soluble solids content of the fruits (Pezzarossa et al., 2012). In           pH (CaCl2 )                    5.6            5.9            5.0            5.1
addition, foliar applications with KNO3 can enhance fructose                 Humus content (%)              2.3            1.7            1.8            1.1
and sucrose content, as was observed in ‘Kousui’ Japanese pears              CaCl2 -extractable           < 0.025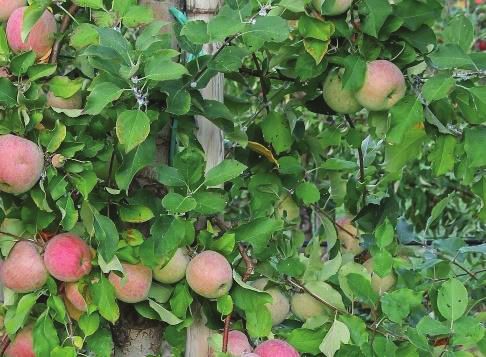
Budke et al. Iodine Biofortification Apples and Pears
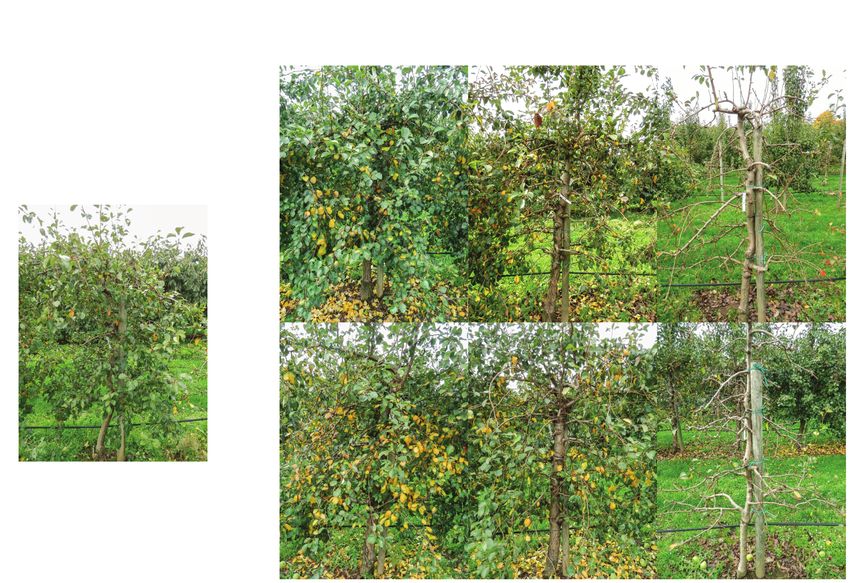
A B C
D
E
FIGURE 1 | Examples of fruit trees included in the second field experiment and fruit appearance shortly after the harvest: Apple tree cv. ‘Fuji’ (A), pear tree cv.
‘Williams Christ’ (B). Selection of 10 harvested apple (C) and pear fruits (D) from treatment no. 5 consisting of a combined foliar spray with KNO3 , KIO3 and
Na2 SeO4 which did not negatively affect external fruit characteristics. Partitioning of fruits for further preparation and analysis steps (E).
88 days, respectively, between April and October 2013. For the (REB 15 AZ2, Birchmeier Sprühtechnik AG, Stetten, Switzerland)
corresponding period in 2018, the values were 16.1◦ C, 268.6 mm and were split into several dates. For apples, two applications
and 70 days, respectively. were carried out and for pears three (Table 3). The water
application rate was 1,000 L (ha · m CH)−1 (CH = canopy height)
Foliar Spray Treatments
The first field experiment was aimed at determining the influence
TABLE 2 | Composition of the spray solutions used in the field experiments.
of the I fertilizer dose and form in foliar sprays on I accumulation
in apples and pears. Here, potassium iodide (KI) and potassium First field trial Second field trial
iodate (KIO3 ) were applied as pure salts (VWR International
GmbH, Bruchsal, Germany) in three different application rates Total foliar Total foliar
application dose application dose
each (Table 2). In the second field experiment, the effect of I Treatment Treatment
[kg (ha · m CH)−1 ] [kg (ha · m CH)−1 ]
fertilization in combination with further foliar spray treatments and chemical form and chemical form
was investigated. The following fertilizers were used: KIO3 as
Speedfol Iodine SP and KNO3 as Ultrasol K Plus, both as
R R
1 0 Control 1 0 Control
powder (SQM EUROPE N.V., Antwerp, Belgium) as well as
sodium selenate (Na2 SeO4 ), analytical-grade quality (Thermo 2 20 KNO3
Fisher Scientific, Kandel, Germany). Detailed information on the
2 0.25 KI 3 1.5 KIO3
spray solutions are provided in Table 2. For all foliar sprays
3 1.0 KI 4 1.5 KIO3
the surfactant Break-Thru S 240 (AlzChem AG, Trostberg,
R
4 2.5 KI 20 KNO3
Germany) was used in a concentration of 0.02% v/v.
All foliar treatments were supplied to the entire canopy of 5 0.25 KIO3 5 1.5 KIO3
fruit trees, i.e. leaves and fruits. In the first field experiment 6 1.0 KIO3 0.05 Na2 SeO4
the spray solutions were applied once two weeks before harvest 7 2.5 KIO3 20 KNO3
of the apples or pears using a handheld sprayer (Easy Sprayer
Applied doses are indicated per hectare and meter canopy height (CH) with the
Plus, Lehnartz GmbH, Remscheid, Germany). In the second field adjuvant Break-Thru R S 240 (0.02% v/v) at a water amount of 1,000 L (ha · m
experiment the treatments took place with a backpack sprayer CH)−1 .
Frontiers in Plant Science | www.frontiersin.org 4 February 2021 | Volume 12 | Article 638671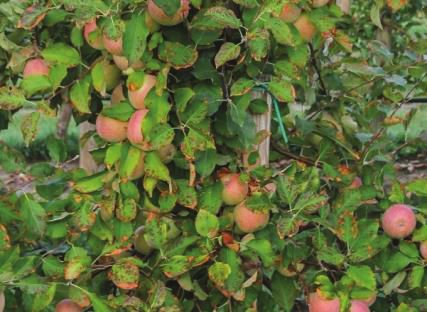
Budke et al.                                                                                                                        Iodine Biofortification Apples and Pears

TABLE 3 | Splitting of the total foliar application dose, application dates and harvest dates in the conducted field experiments.

                               First field trial                                                                           Second field trial

                                                    Fruit species                                                                                   Fruit species

                                           Apple                      Pear                                                                Apple                      Pear

Number of applications                        1                         1                      Number of applications                       2                          3
Treatment                                 Sep. 15                    Sep. 13                   1st treatment                              Jul. 26                   Jun. 19
                                                                                               2nd treatment                             Aug. 31                    Jul. 23
                                                                                               3rd treatment                                 -                      Aug. 6
Harvest date                              Sep. 30                    Sep. 24                   Harvest date                               Oct. 8                    Aug. 20
                                                                                               End of fruit storage                      Jan. 10                    Nov. 21

in each case. The water application rates chosen ensured that the                        analysis, certified reference material (ERM-BB422 fish muscle
spray solutions did not run off the plant surface. The treatments                        and NIST-1849a infant/adult nutritional milk powder) was used.
were always carried out in the morning hours with no wind and                            Another reference material was apple powder from our own
in dry weather conditions.                                                               experiments, which had been previously analyzed in an external
                                                                                         laboratory accredited for I analysis in food (LUFA Nord-West,
Data Collection, Sampling and Sample                                                     Hameln, Germany). The I determination was performed by
Preparation                                                                              inductively coupled plasma mass spectrometry (ICP-MS, Agilent
                                                                                         7700, Agilent Technologies Inc., Santa Clara, CA, United States).
The trees were checked for leaf and fruit damage four times
                                                                                            Selenium was determined according to the method DIN EN
during the test period and were rated accordingly (1 = no damage,
                                                                                         13805 (2014). For this purpose, 0.5 g of the ground plant material
9 = very severe damage). Only fruits that were positioned in
                                                                                         was digested by microwave pressure digestion in quartz glass
the outer part of the tree were included in the sampling for
                                                                                         vessels with 65% nitric acid at a temperature of 190◦ C and
analytical investigations to ensure that they were directly wetted
                                                                                         under pressure. The digestion solution was analyzed by graphite
by the spray solution. 20 fruits per tree were harvested and the
                                                                                         furnace atomic absorption spectrometry (GF-AAS, Thermo
individual fruit weight was determined. In 2018 half of the fruits
                                                                                         Scientific – SOLAAR M Series AA Spectrometer, Thermo Fisher
were stored for three months at 2◦ C (Table 3). After harvest
                                                                                         Scientific Inc., Waltham, MA, United States). For quality control
and storage, the external appearance of the fruits was visually
                                                                                         purposes, the same certified reference materials were used as for I
evaluated and photographically documented (Figures 1C,D). In
                                                                                         analysis. Again, comparative tests were performed in an external
the second field experiment leaf samples were also taken for
                                                                                         laboratory accredited for Se determination (LUFA Nord-West,
analytical purposes from the apple trees at harvest time. For
                                                                                         Hameln, Germany). Samples with Se concentrations below 2.5 µg
this purpose about 20 – 30 leaves per tree were collected near
                                                                                         L−1 were analyzed by using the hydride technique in accordance
the sampled fruits.
                                                                                         with the method DIN 38405-23 (1994).
   During fruit processing the fruits were initially divided
                                                                                            The I and Se content of the fruit peel was calculated from
vertically into eight equal segments and the core cylinder
                                                                                         the difference between washed and peeled fruit segments. In
(Figure 1E). Two opposite fruit segments were then processed
                                                                                         the second field experiment the I and Se contents were also
unwashed, washed or peeled. The washing was carried out under
                                                                                         determined in unwashed and washed apple leaves, once in the
running deionised water. A fine peeler was used for peeling the
                                                                                         control (treatment 1) and once in the variants fertilized with
fruit segments. The middle part of the core cylinder was used for
                                                                                         KIO3 (treatment 3) and KIO3 + Na2 SeO4 + KNO3 (treatment 5).
the analytical examination and the upper and lower parts were
discarded. The fruit samples were dried at 60◦ C in a forced air
oven (TUH 75/100, Heraeus Holding GmbH, Hanau, Germany)                                  Measurement of Total Soluble Solids
until the weight was constant. Using an ultracentrifugal mill (ZM                        Content
200, RETSCH GmbH, Haan, Germany), the samples were then                                  Two segments per fruit were used to determine the total soluble
ground at 14,000 rpm to a particle size of ≤ 0.5 mm. Until analysis                      solids content. The sample material was pureed and then filtered.
the sample material obtained in this way was stored in sealed                            The resulting juice was analyzed with a digital refractometer
plastic beakers and dried again shortly before chemical digestion.                       (PAL-1, ATAGO CO., Ltd., Tokyo, Japan).

Analyses of Iodine and Selenium in Plant                                                 Trial Set-Up and Statistical Procedures
Samples                                                                                  The field experiments were designed as randomized block
The I determination was performed according to the method                                experiments with usually four replications. The experiment with
DIN EN 15111 (2007). Briefly, 1 g of dried plant substance was                           apple trees in 2018 included six replications. Each treatment was
used and chemically digested with 25% tetramethylammonium                                represented by one tree per block. The selection of the trees was
hydroxide solution (TMAH). To ensure the quality of the                                  based on a homogeneous structure and fruit number. To avoid

Frontiers in Plant Science | www.frontiersin.org                                     5                                          February 2021 | Volume 12 | Article 638671
Budke et al. Iodine Biofortification Apples and Pears
A B
450 Apple 450 Pear
400 400
fruit segments [µg (100 g FM) ]
fruit segments [µg (100 g FM) ]
-1
-1
Iodine content in washed
Iodine content in washed
350 350
300 KI 300
250 y = 116.8x - 9.7 250
KI
R² = 0.99 y = 94.0x - 3.7
200 200 R² = 0.99
150 150
y = 37.5x + 2.9
100 R² = 0.99 KIO3 100 y = 20.8x + 6.0
R² = 0.97 KIO3
50 50
0 0
0.0
0,0 0.5
0,5 1.0
1,0 1.5
1,5 2.0
2,0 2.5
2,5 3,0
3.0 0.0
0,0 0.5
0,5 1.0
1,0 1.5
1,5 2.0
2,0 2.5
2,5 3,0
3.0
Foliar spray treatment Foliar spray treatment
[kg I (ha · m CH)-1] [kg I (ha · m CH)-1]
FIGURE 2 | Iodine content in washed fruit segments of apples cv. ‘Jonagold’ (A) and pears cv. ‘Alexander Lucas’ (B) at harvest time as affected by the dose and
form of iodine foliar sprays in the first field experiment. Means ± standard deviation (n = 4).
edge effects, the treated trees were separated from each other by Figure 2 also shows that apples tended to accumulate more I per
at least one untreated tree. In addition, plastic foil barriers were unit of weight than pears. These differences in I content were
used to isolate each tree during the spraying process to prevent related to the different individual fruit weights. Pears harvested
contamination by drift. in this trial were 19% heavier than a single apple fruit. The total
The results obtained in the fruit analyses were subjected to amount of I per fruit contained in apples and pears was similar
one-way or two-way ANOVA and, if needed, logarithmized to with the same I form and dose and reached a maximum of
meet assumptions of normality and homogeneity of variances. 508 µg/fruit for apple and 467 µg/fruit for pear at the highest
Multiple mean value comparisons were made using the Tukey- I− supply rate (Table 4). In I-sprayed apples, 51, 47, and 2%
HSD test and the LSD test. The program IBM SPSS Statistics, R
of the I was localized in the fruit peel, the fruit flesh and the
version 26 (IBM Deutschland GmbH, Ehningen, Germany), was fruit core, respectively. For pears the corresponding values were
used for statistical data evaluation. 78, 20, and 2%, respectively (Figure 3). Compared to KIO3 , the
supply of KI favored the translocation of the I into the fruit
flesh. Washing the fruits in running deionised water reduced
RESULTS the I content in the first field experiment by 14% for apples
and 16% for pears.
Iodine Content of Fruits and Leaves In the second field experiment the effect of I spraying in
The native I content of apples and pears was 1.5 µg (100 g combination with further foliar fertilization treatments was
FM)−1 and 1.0 µg (100 g FM)−1 , respectively. Foliar sprays investigated. In contrast to the previous experiment, only KIO3
with I-containing solutions significantly increased the I content with a uniform application rate of 1.5 kg I (ha · m CH)−1 was
of the fruits. In the first field experiment, a single treatment used. Furthermore, the applications were split into two dates
with 0.25 – 2.50 kg I (ha · m CH)−1 , carried out two weeks for apple and three dates for pear. The addition of KNO3 and
before harvest, led to an increase in the I content in washed Na2 SeO4 to the I spray solution had no clear influence on the
fruit segments from 15.7 µg (100 g FM)−1 up to more than I accumulation in washed fruit segments. At harvest time, the I
200 µg (100 g FM)−1 (Figure 2). The mean dry matter (DM) content in the I-sprayed treatments varied between 47 – 54 µg
content was 16% for apple and pear. The aforementioned (100 g FM)−1 for apples and 58 – 69 µg (100 g FM)−1 for
values thus correspond 0.9 to > 12.5 mg I (kg DM)−1 . There pears, irrespective of the addition of the aforementioned salts
was a close linear relationship between the I fertilization level (Figures 4A,C). The fruit-specific differences in I enrichment
and the I enrichment of the fruits. Further statistical analysis leveled out again when taking into account the individual fruit
shows that the mean I content determined for the different weights, which in this case were higher for apples (Table 4).
I doses and forms were predominantly significantly different Without I supply – in the controls and in the stand-alone KNO3
(Supplementary Tables 1, 2). The application of I− resulted, foliar fertilization treatments – the I content of the fruits was
averaged over both fruit species, in an I content that was 2.5 about 1.0 µg (100 g FM)−1 . During the three-monthly cold
times higher than a corresponding supply of IO3 − . However, the storage the I content in I-sprayed apples decreased by 20%. In
I enrichment of I− -treated fruits, especially at the highest supply the case of pears, however, fruit storage had no significant effect
rate, varied much more than when using the oxidized I form. on the I content.
Frontiers in Plant Science | www.frontiersin.org 6 February 2021 | Volume 12 | Article 638671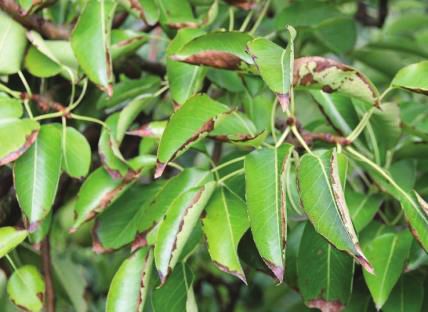
Budke et al.                                                                                                                     Iodine Biofortification Apples and Pears

TABLE 4 | Iodine amount in a whole washed fruit including core and individual fruit weight of apples and pears from the first and the second field experiment as affected
by the spray solution.

                                                                                            Apple                                               Pear

                             Treatment1)                                  Iodine amount             Individual fruit       Iodine amount               Individual fruit
                                                                          per fruit [µg]            weight [g]             per fruit [µg]              weight [g]

First field trial      1      Control                           0             4.7 ± 0.2     a        206.8 ± 13.6      a       2.7 ± 1.5    a           230.9 ± 26.8      a

                       2      KI                               0.25         31.3 ± 4.7      b        195.2 ± 22.1      a      30.9 ± 10.2   b           238.8 ± 5.0       a
                       3                                       1.0         170.9 ± 23.5     d        210.9 ± 5.8       a    172.4 ± 45.9    d           232.0 ± 37.2      a
                                                              1.52)            294.1                                             274.6
                       4                                       2.5         508.0 ± 198.7 e           194.0 ± 13.2      a    467.4 ± 215.8 e             239.7 ± 33.7      a

                       5      KIO3                             0.25         28.8 ± 8.2      b        199.4 ± 11.2      a      29.4 ± 12.1   b           246.2 ± 63.8      a
                       6                                       1.0          65.2 ± 10.7     c        196.2 ± 8.6       a      59.3 ± 22.5   bc          227.5 ± 33.3      a
                                                              1.52)            105.5                                             71.7
                       7                                       2.5         173.9 ± 22.1     d        191.2 ± 28.8      a    107.3 ± 47.9    cd          219.6 ± 28.4      a

Second field trial     1      Control                           0             1.6 ± 0.4     a        211.2 ± 39.7      a       1.8 ± 1.0    a           166.8 ± 18.0      a

                       2      KNO3                              0             1.6 ± 0.7     a        214.2 ± 31.1      a       1.9 ± 0.7    a           154.5 ± 30.4      a
                       3      KIO3                             1.5         102.7 ± 10.8     b        209.0 ± 21.9      a      79.9 ± 6.2    b           157.1 ± 11.6      a
                       4      KIO3 + KNO3                      1.5          89.7 ± 14.4     b        204.5 ± 37.8      a      87.8 ± 11.2   b           150.7 ± 7.1       a
                       5      KIO3 + Na2 SeO4 + KNO3           1.5          84.0 ± 13.5     b        194.2 ± 31.2      a      85.7 ± 13.8   b           143.0 ± 18.1      a

Means ± standard deviation (n = 4, except ‘Fuji’ apples second field trial n = 6). Means with same letters in one column for one field trial do not differ according to
Tukey-HSD test at α = 0.05.
1) Iodine application rate expressed in kg (ha · m CH)−1 . 2) Values calculated for comparison purposes are based on the regression equations indicated in Figure 2.

    In the fruit peel of I-sprayed, washed apples and pears, the                        CH)−1 increased the Se content in washed fruit segments to
I content at harvest was 6.6 and 17.1 times higher, respectively,                       2.7 µg (100 g FM)−1 and 2.1 µg (100 g FM)−1 , respectively
than in the fruit flesh. In the case of apples, this difference                         (Figures 4B,D). Cold storage of the fruits had no effect
decreased after cold storage, as the I content in the fruit peel                        on the Se content.
decreased by 45% and simultaneously increased by 14% in the                                The foliar-applied Se was enriched in the fruit peel of apples
fruit flesh (Table 5). For the pear, however, no significant change                     and pears by a factor of 7.8 and 2.2, respectively, more than in the
in this respect was observed.                                                           fruit flesh (Table 5). Washing and peeling reduced the Se content
    Washing the fruit segments of I-treated apples and pears                            in these pome fruits 15% and 38%, respectively (Figure 5). At
under running deionised water reduced their I content at                                harvest time these losses were lower for pears than for apples.
harvest time by 13% and 11%, respectively, which is in a                                After storage, no differences were observed in this respect.
similar order of magnitude to that observed in the first                                   Apple leaves of the control treatments contained 1.9 ± 0.4 µg
field experiment. In peeled fruit segments the I content                                Se (100 g FM)−1 in the unwashed and 1.2 ± 0.6 µg Se (100 g
was reduced by 51% and 73%, respectively (Figure 5). In                                 FM)−1 in the washed state. Selenium fertilization increased the
stored apples the I losses due to peeling were lower, as                                Se content to 303.6 ± 65.4 µg (100 g FM)−1 in unwashed and
expected, due to the previously reported decrease of I content                          309.3 ± 57.2 µg (100 g FM)−1 in washed leaves.
in the apple peel.
    Leaves accumulated considerably more I than fruit, as                               Phytotoxicity Symptoms on Leaves
exemplary analyses on apple trees revealed. Unwashed apple                              The spraying of I-containing solutions on apple and pear trees
leaves not sprayed with I contained 166 ± 67 µg I (100 g FM)−1 .                        resulted in leaf necrosis, starting at the leaf margins and at the
As a result of a KIO3 foliar application, the I content increased                       leaf tip. The intensity of these symptoms increased as the number
to 10,924 ± 1,712 µg (100 g FM)−1 . In washed leaves, this                              of applications increased and the growing season progressed
was at a similar level with 11,082 ± 1,778 µg (100 g FM)−1 .                            (Figure 6). In the first field trial, the leaves of pear trees showed
The mean dry matter content of apple leaves was 37%. The                                more severe damage, while in the second field trial the leaves of
aforementioned I content on fresh matter basis thus corresponds                         apple trees were more affected (Table 6). The degree of damage
to 300 mg (kg DM)−1 .                                                                   increased with increasing concentration of I in the spray solution.
                                                                                        Iodine fertilizer form had no consistent influence on the leaf
Selenium Content of Fruits and Leaves                                                   damage. Likewise, the co-application of KNO3 and Na2 SeO4
The native Se content of apples and pears was 0.4 µg (100 g                             with I had no effect on damage pattern. When only KNO3 was
FM)−1 and 0.1 µg (100 g FM)−1 , respectively. Repeated                                  sprayed, the leaves remained undamaged as in the controls. After
foliar sprays of Na2 SeO4 with a total of 50 g Se (ha · m                               harvesting, accelerated leaf senescence and premature leaf fall was

Frontiers in Plant Science | www.frontiersin.org                                    7                                        February 2021 | Volume 12 | Article 638671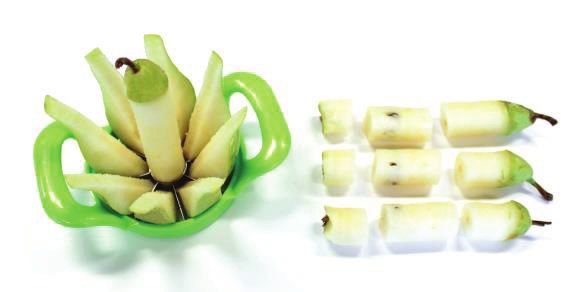
Budke et al.                                                                                                                     Iodine Biofortification Apples and Pears

                                                                  Fruit peel            Fruit flesh         Fruit core
                     A                                                                  Apple
                                        100%
                                        90%
                                        80%
                in an apple fruit [%]
                 Iodine distribution

                                        70%
                                        60%
                                        50%
                                        40%
                                        30%
                                        20%
                                        10%
                                         0%
                                                 0.0     0.25          1.00              2.50            0.25             1.00              2.50
                                                                        KI                                                KIO3
                                               Control                     Foliar spray treatment [kg I (ha · m CH)-1]

                     B                                                                   Pear
                                        100%
                                        90%
                                        80%
                Iodine distribution
                in a pear fruit [%]

                                        70%
                                        60%
                                        50%
                                        40%
                                        30%
                                        20%
                                        10%
                                         0%
                                                 0.0     0.25          1.00              2.50            0.25             1.00              2.50
                                                                         KI                                               KIO3
                                               Control                     Foliar spray treatment [kg I (ha · m CH)-1]

  FIGURE 3 | Iodine distribution in washed apples cv. ‘Jonagold’ (A) and pears cv. ‘Alexander Lucas’ (B) at harvest time as affected by the dose and form of iodine
  foliar sprays in the first field experiment.

observed in the I-sprayed treatments. These effects also increased                     DISCUSSION
with increasing I supply (Figure 7).
                                                                                       Biofortification With Straight Iodine
Fruit Development and Content of Total                                                 Foliar Sprays
Soluble Solids                                                                         By applying I-containing foliar fertilizers in an orchard, it
No damage was observed on the fruits in any of the foliar                              was possible to enrich apples and pears significantly with I.
fertilization treatments tested, neither at the time of harvest nor                    While washed fruit segments of the control treatments had
after storage. In all treatments the individual fruit weight was at                    an I content of ≤ 1.5 µg (100 g FM)−1 , this was increased
the same level as in the controls (Table 4). KIO3 sprays did not                       by a factor of 10 – 193 in the I-fertilized treatments and
affect the total soluble solids content of fruits. However, repeated                   reached more than 200 µg (100 g FM)−1 at the highest
applications of KNO3 promoted the accumulation of soluble                              supply rate [2.5 kg I (ha · m CH)−1 ] for both fruit species.
solids. At harvest time the concentration of soluble solids was                        A linear relationship between I fertilizer amount and I fruit
increased by 1.0 ◦ Brix in apples and 0.9 ◦ Brix in pears compared                     enrichment was observed (Figure 2). The increase was 2.5
to the control (Figure 8). Even with simultaneous application of                       times higher with I− -supply than with IO3 − -supply. Similar
KIO3 and KNO3 , apples still showed a correspondingly increased                        effects on the influence of the level and form of I supply
◦ Brix value. After cold storage of the fruits the above-mentioned                     were described in studies on the biofortification of strawberries
differences in total soluble solids content remained.                                  (Li et al., 2017) and various vegetable and cereal crops

Frontiers in Plant Science | www.frontiersin.org                                   8                                        February 2021 | Volume 12 | Article 638671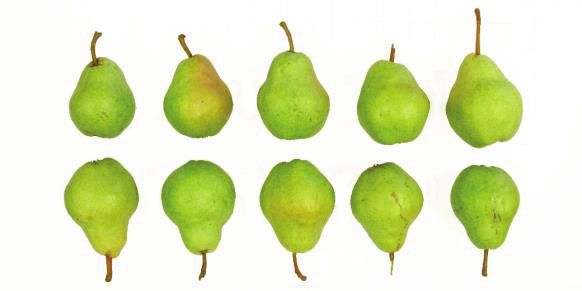
Budke et al. Iodine Biofortification Apples and Pears
Apple
A B
100 10
fruit segments [µg (100 g FM) ]
fruit segments [µg (100 g FM) ]
90 At harvest After storage 9
-1
At harvest
-1
Selenium content in washed
Iodine content in washed
80 8 After storage
*
70 * 7
B
60 B B 6
b
b
50 b 5
40 4 b
B
30 3
20 2
10 1 A a
A a A a
0 0
Control KNO3 KIO3 KIO3 KIO3 + Control KIO3 +
+ KNO3 Na2SeO4 Na2SeO4
+ KNO3 + KNO3
Foliar spray treatment Foliar spray treatment
Pear
C D
120 At harvest After storage 10
fruit segments [µg (100 g FM) ]
fruit segments [µg (100 g FM) ]
b 9 At harvest
-1
-1
Selenium content in washed
100 b
Iodine content in washed
8 After storage
b
B 7
80 B
B
6
60 5
4
40 B b
3
2
20
1 a
A a A a A
0 0
Control KNO3 KIO3 KIO3 KIO3 + Control KIO3 +
+ KNO3 Na2SeO4 Na2SeO4
+ KNO3 + KNO3
Foliar spray treatment Foliar spray treatment
FIGURE 4 | Iodine and selenium content in washed fruit segments of apples cv. ‘Fuji’ (A,B) and pears cv. ‘Williams Christ’ (C,D) in the second field experiment as
affected by different foliar spray treatments and fruit storage at 2◦ C for a period of three months. Means ± standard deviation (apple n = 6, pear n = 4). Means not
sharing a letter in one chart or indicated by an asterisk are significantly different according to Tukey-HSD test at α = 0.05.
(Hong et al., 2008; Voogt et al., 2010; Cakmak et al., 2017; will influence the capacity of spray drop deposits to rehydrated
Li et al., 2018). under high RH conditions as affected by temperature and hence
The higher accumulation of exogenously applied I− in plants favor new cycles of I absorption by the fruits and the foliage.
is probably due to its smaller molecular weight and lower valence KI is superior to KIO3 in this respect because it deliquesces at
compared to IO3 − (Mackowiak and Grossl, 1999). Furthermore, much lower RH. The deliquescence phenomena will be more
studies on I uptake by roots indicate that IO3 − enters the prone to occur at night time and also in association with dew
symplast only after reduction to I− (Kato et al., 2013). Iodide on plant organs. In our field experiments spray applications
is absorbed via ion channels or chloride transporters driven were always carried out in the morning hours when RH was
by proton pumps (White and Broadley, 2009; Medrano-Macías usually below 94% and the thin spray liquid films formed
et al., 2016). For foliar sprays, however, another aspect is probably on the surface of fruits and leaves dried relatively quickly.
of great importance, namely the difference in the point of As a result, the dissolved salt can be converted to the solid,
deliquescence (POD) of the applied salts. The POD describes the crystalline state. The RH at which this phase transformation
relative humidity (RH) at which hygroscopic salts absorb enough begins is defined as the point of efflorescence (POE). The POE
water from the air to form a liquid solution. At a temperature is usually below that of the POD (Freney et al., 2009). Recently,
of 20◦ C, the POD for KI is 69% RH and for KIO3 93% RH the importance of the POE of fertilizer salts for spray drop
(Greenspan, 1977; Apelblat and Korin, 1998). This difference drying has been highlighted (Fernández et al., 2020). To the
Frontiers in Plant Science | www.frontiersin.org 9 February 2021 | Volume 12 | Article 638671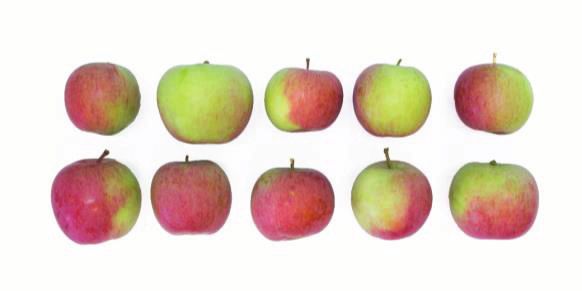
Budke et al.                                                                                                                       Iodine Biofortification Apples and Pears

TABLE 5 | Iodine and selenium content in fruit peel and flesh of washed apples cv. ‘Fuji’ and pears cv. ‘Williams Christ’ in the second field experiment as affected by
different foliar spray treatments and a fruit storage at 2◦ C for a period of three months.

                  Apple                                                                    Iodine content [µg (100 g FM)−1 ]

                                                                      At harvest                                                      After storage

               Treatment                               Fruit peel                        Fruit flesh                     Fruit peel                      Fruit flesh

1          Control                                   2.1 ± 0.2      aA               0.5 ± 0.2         aA             2.3 ± 0.1       aA                0.5 ± 0.1         aA
2          KNO3                                      2.3 ± 0.4      aA               0.5 ± 0.4         aA             2.0 ± 0.5       aA                1.0 ± 0.5         aA
3          KIO3                                    219.2 ± 53.2     bA              26.7 ± 8.3         bA           125.3 ± 75.4      bB              29.9 ± 6.5          bA
4          KIO3 + KNO3                             172.8 ± 62.7     bA              27.1 ± 3.9         bA            84.0 ± 60.0      bB              28.8 ± 10.5         bA
5          KIO3 + Na2 SeO4 + KNO3                  157.2 ± 79.6     bA              29.0 ± 6.9         bA            92.3 ± 49.9      bA              36.1 ± 8.9          bA

                                                                                          Selenium content [µg (100 g    FM)−1 ]

1          Control                                   0.5 ± 0.2      aA               0.4 ± 0.1         aA             0.9 ± 0.4       aA                0.4 ± 0.2         aA
5          KIO3 + Na2 SeO4 + KNO3                   10.9 ± 3.2      bA               1.4 ± 0.4         bA             7.2 ± 5.3       bA                2.0 ± 0.7         bA

                  Pear                                                                     Iodine content [µg (100 g FM)−1 ]

                                                                      At harvest                                                      After storage

               Treatment                               Fruit peel                        Fruit flesh                     Fruit peel                      Fruit flesh

1          Control                                   3.4 ± 0.7      aA               0.7 ± 0.7         aA             1.3 ± 0.8       aB                1.0 ± 0.8         aA
2          KNO3                                      4.8 ± 0.5      aA               0.8 ± 0.5         aA             4.1 ± 0.3       aA                0.4 ± 0.3         aB
3          KIO3                                    304.9 ± 17.4     bA              17.9 ± 3.3         bA           406.1 ± 145.9     bA              16.5 ± 5.3          bA
4          KIO3 + KNO3                             356.3 ± 78.7     bA              19.7 ± 4.1         bA           366.7 ± 136.0     bA              35.2 ± 6.9          bA
5          KIO3 + Na2 SeO4 + KNO3                  355.0 ± 52.0     bA              22.0 ± 7.8         bA           331.8 ± 97.2      bA              21.5 ± 8.7          bA

                                                                                          Selenium content [µg (100 g FM)−1 ]

1          Control                                   0.4 ± 0.0      aA               0.1 ± 0.1         aA             0.5 ± 0.4       aA                0.1 ± 0.0         aA
5          KIO3 + Na2 SeO4 + KNO3                    4.3 ± 2.1      bA               2.0 ± 0.5         bA             6.5 ± 5.2       bA                1.6 ± 0.7         bA

Means ± standard deviation (apple n = 6, pear n = 4). Means not sharing a lower case letter in one column or an upper case letter for same type of fruit sample in one
row are significantly different according to Tukey-HSD test at α = 0.05.

best of our knowledge, POE values for KI and KIO3 have not                               achieved when apple trees cultivated under protected conditions
yet been published and thus should be determined in further                              in a plastic tunnel were sprayed with I (Budke et al., 2020a).
investigations. The translocation of I from the fruit peel to the                        This is surprising, since in an orchard it can be expected that
fruit flesh was also affected by the I form as well as by the                            exogenously applied I will be partially washed off the fruit
type of fruit. In the case of IO3 − supply, 14% and 44% of the I                         trees by rain. In the second field experiment, the amount of
were found in the fruit flesh of the pear and apple, respectively,                       precipitation that fell in the period from the first foliar spray
while in the case of I− supply the figures were 27% and 51%,                             to the harvest of fruits was 78.2 mm (over 75 days) for apples
respectively (Figure 3).                                                                 and 100 mm (over 63 days) for pears. However, no or very low
   Despite the higher absorption and translocation of I− , the I                         precipitation (< 3 mm) was observed in the first two days after
content in single pome fruits was subject to greater fluctuations                        application. In the first field experiment, however, about 6 mm
within the treatments compared to IO3 − , especially at high I                           of precipitation fell one day after the treatment of the apple trees.
supply. Likewise, in other published field experiments IO3 − led                         Nevertheless, the apples investigated here were also enriched with
to a more uniform result when applied at different locations and                         I to an extent similar to the described plastic tunnel experiment.
under varying environmental conditions (Lawson et al., 2016;                             Obviously, rainfall in the range mentioned did not result in
Cakmak et al., 2017). This is advantageous for the practical                             noteworthy wash-off losses even if the I sprayed on the fruit was
implementation of agronomic biofortification, where the aim is                           probably not absorbed completely within one day. Investigations
to achieve the desired level of I biofortification in a way that is                      on butterhead lettuce showed that after one day only about half
as reproducible as possible. For this reason, we selected KIO3 as                        of the I deposited on leaves via foliar fertilization was absorbed
I salt for our second field experiment. With an application rate                         by the leaves (Lawson et al., 2016). In fruits, especially those
of 1.5 kg I (ha · CH)−1 it was possible to increase the I content                        with a thicker wax layer on the surface, the uptake of I is likely
in washed fruit segments to about 50–60 µg (100 g FM)−1                                  to proceed much more slowly, although this has not yet been
(Figure 4). An I enrichment of the same order of magnitude was                           investigated. Studies on calcium uptake in apples of the ‘Cox

Frontiers in Plant Science | www.frontiersin.org                                    10                                         February 2021 | Volume 12 | Article 638671
Budke et al. Iodine Biofortification Apples and Pears
FIGURE 5 | Cumulative decrease of the iodine and selenium content in fruit segments by washing and peeling of apples cv. ‘Fuji’ (A,B) and pears cv. ‘Williams Christ’
(C,D) in the second field experiment at harvest time and after fruit storage at 2◦ C for a period of three months. Means ± standard deviation (apple n = 6, pear n = 4).
Orange’ variety showed that within 2 to 7 days a maximum of rather result in a lower uptake rate of I sprayed on the fruit.
7% and 25%, respectively, of the radioisotope 45 Ca2+ applied to On the other hand, the surface area of growing fruits increases
the fruit surface penetrated to a depth of 1 mm into the fruit during the season. Thus, more I is retained by the fruit if the
(van Goor, 1973). application date is late. Taken together it can be assumed that
When evaluating I biofortification of apples and pears, fruit these two opposing effects compensated each other and therefore
size must be taken into account. As the fruit weight increases, the different treatment dates in the field experiments performed
the I absorbed into the fruit becomes increasingly diluted (Budke had no influence on fruit I accumulation.
et al., 2020a). Accordingly, a higher I fertilizer application was Preferential uptake routes for dissolved ionic solutes into the
required for bigger pears of the ‘Alexander Lucas’ variety in fruit are fine cracks in the cuticle and lenticels (Harker and
order to achieve an I content comparable to that of the smaller Ferguson, 1988). The occurrence of these epidermal structures
‘Williams Christ’ pears. With regard to the total amount of I can vary considerably depending on the variety. ‘Williams Christ’
contained in the pears, only minor differences between both pears, for example, have more than three times as many lenticels
pear varieties were found. At a KIO3 application rate of 1.5 kg I as ‘Alexander Lucas’ pears (Durić et al., 2015). In our experiments,
(ha · CH)−1 , pears of the ‘Williams Christ’ variety still contained this may have additionally favored the I enrichment in the smaller
about 10% more I than determined for ‘Alexander Lucas’ by fruiting ‘Williams Christ’ variety. ‘Fuji’ apples are known to have
calculation (Table 4). significantly more lenticels on the fruit surface than ‘Jonagold’
The apple varieties ‘Fuji’ and ‘Jonagold’ hardly differed in fruit apples (Guan et al., 2015). However, in contrast to pears, these
size and showed a similar I accumulation patterns in the fruits at differences in variety did not affect the I uptake of apples.
the same KIO3 application rate. The thickness of the epicuticular Thus, from our data we cannot conclude that lenticels play an
wax layer of the two apple varieties is also comparable and is important role for I fruit absorption.
in the middle to higher range for apples at harvest time with Even though foliar sprays with I-containing fertilizers have
approx. 1.5 µm. In general, the wax deposition on the apple peel proven to be suitable for production of biofortified pome fruits
increases as the fruit develops (Guan et al., 2015). Therefore, a late with increased I content, the efficiency of this measure is relatively
foliar application date, as set in the first field experiment with the low. In a normal orchard with a tree height of 2.5–3.0 m and
variety ‘Jonagold’ (treatment two weeks before harvest), would a fruit yield of 40 t ha−1 , no more than about 0.5% of the
Frontiers in Plant Science | www.frontiersin.org 11 February 2021 | Volume 12 | Article 638671Budke et al. Iodine Biofortification Apples and Pears
Before the After the 1st After the 2nd At harvest
first treatment treatment treatment
(Jul. 24) (Aug. 03) (Sep. 07) (Oct. 08)
C
1 3 5 7
A D
Score value
After the 3rd
Before the After the 1st After the 2nd treatment /
first treatment treatment treatment at harvest
(Jun. 18) (Jun. 25) (Aug. 01) (Aug. 20)
E
1 3 5 5
B F
Score value
FIGURE 6 | Development of leaf damage during the growing season until fruit harvest in the second field experiment. Images of scanned leaves of apple trees cv.
‘Fuji’ (A) and pear trees cv. ‘Williams Christ’ (B) from treatment no. 5 consisting of a combined foliar spray with KNO3 , KIO3 and Na2 SeO4 . Score values indicate the
degree of the damage (Score value 1 = no damage, 3 = slight damage 5 = moderate damage, 7 = severe damage, 9 = very severe damage). Detail view of ‘Fuji’
apple trees (C,D) and ‘Williams Christ’ pear trees (E,F) in the second field experiment at harvest time. Picture C and E: treatment no. 1 (control). Picture D and F:
treatment no. 5 (spray solution composition as described above).
applied I enters the fruits if their I content averages 50 µg (100 g than 10 times larger than the fruits growing on the tree (Knoche
FM)−1 . This calculation is based on a fertilization of 1.5 kg and Petracek, 2014). The I content measured in apple leaves was
I (ha · m CH)−1 in the form of KIO3 . When using KI, the more than 200 times higher than the fruits. The main reason
proportion of I transferred into the fruits can increase up to for this is certainly the larger surface area-to-volume ratio of
1.1%, since a lower amount of I fertilizer is required for the the leaves, which means that the increase in concentration is
same I enrichment. higher for the same amount of solutes per unit of area. In
It may be possible to increase the efficiency of I foliar addition, the epidermis of the leaves is covered by a thinner
fertilization by using an air-blast orchard sprayer, which is wax layer than that of the fruits (Fernandes et al., 1964) and
commonly used in commercial fruit growing. This application stomata are available as additional uptake routes for ionic solutes
technique is likely to be superior to the handheld sprayers used (Eichert and Fernández, 2012).
in the experiment, especially with regard to sufficient wetting of
the fruits covered by leaves inside the tree. This is important
because they must be hit directly by the spray solution in order Biofortification With Leaf Fertilizer
to be significantly biofortified. The translocation of I from leaves Mixtures
to fruits in apple trees was found to be negligible, which is The addition of KNO3 to a spray solution containing KIO3 had
attributed to a low phloem mobility of I in apple trees (Budke no effect on the I content of the fruits, neither for apple nor
et al., 2020a). Most of the I applied by foliar fertilization is for pear (Figure 4). In contrast, Cakmak et al. (2017) found
probably found in the foliage, which has a surface area more in a study on wheat plants that the uptake of foliar-applied
Frontiers in Plant Science | www.frontiersin.org 12 February 2021 | Volume 12 | Article 638671Budke et al. Iodine Biofortification Apples and Pears
TABLE 6 | Score values of leaf damage on trees of apples cv. ‘Jonagold’ and ‘Fuji’ point with 95% RH (Fernández et al., 2013). Stronger hygroscopic
and pears cv. ‘Alexander Lucas’ and ‘Williams Christ’ from the first and the
salts such as CaCl2 (deliquescence point of 33% RH), on the
second field experiment as affected by the spray solution.
other hand, can fulfill this purpose and thus promote I uptake
Score values of leaf into the plant tissue (Lawson et al., 2016). Further investigations
damage [1–9] must reveal whether such tank mixtures are also useful for the I
Treatment1)
fertilization of fruit crops.
Apple Pear
The addition of Na2 SeO4 to a spray solution containing IO3 −
First field trial 1 Control 0 1.0 ± 0.0 1.0 ± 0.0 did not affect the I content of the treated pears and apples. This
confirms results from previous studies on apple trees (Budke
2 KI 0.25 3.0 ± 0.0 5.0 ± 0.0 et al., 2020a). Likewise, in studies on the biofortification of
3 1.0 3.2 ± 0.5 7.2 ± 0.5 lettuce and rice, no interactions between IO3 − and SeO4 2− were
4 2.5 5.7 ± 1.5 7.7 ± 1.0 found with regard to the uptake of both trace elements (Smoleń
et al., 2014, 2016b; Prom-u-thai et al., 2020). In contrast, in
5 KIO3 0.25 2.4 ± 0.6 5.0 ± 0.0
field experiments with carrots and wheat, a slight reduction of
6 1.0 3.7 ± 1.0 6.5 ± 1.0
I accumulation in the edible plant parts was observed when
7 2.5 6.7 ± 1.5 9.0 ± 0.0
Se was simultaneously applied to the soil or Se and other
Second field trial 1 Control 0 1.0 ± 0.0 1.0 ± 0.0 micronutrients to the leaf (Smoleń et al., 2016a; Zou et al., 2019).
However, the effects were not consistent, but varied depending on
2 KNO3 0 1.0 ± 0.0 1.0 ± 0.0 year and location.
3 KIO3 1.5 6.0 ± 1.1 3.5 ± 1.0 The combined foliar fertilization of KIO3 , KNO3 and Na2 SeO4
4 KIO3 + KNO3 1.5 5.7 ± 1.0 4.0 ± 1.2 increased the Se content in the fruits 6 times compared to
5 KIO3 + Na2 SeO4 + KNO3 1.5 5.7 ± 1.0 4.0 ± 1.2
the control in apples and 21 times in pears. However, the
Score value 1 = no damage, 3 = slight damage 5 = moderate damage, 7 = severe maximum accumulation remained below 3.0 µg Se (100 g
damage, 9 = very severe damage. Means ± standard deviation (n = 4, except ‘Fuji’ FM)−1 and was thus of a similar order of magnitude as
apples second field trial n = 6).
1) Iodine application rate expressed in kg (ha · m CH)−1 . previously determined for apples with a combined KI and
Na2 SeO3 foliar spray (Budke et al., 2020a). In both studies, the
IO3 − is significantly increased by KNO3 . It is not yet clear what total Se fertilization rate applied was 50 g (ha · m CH)−1 .
this positive effect was due to. An effect as humectant is not From a human nutritional point of view, the optimal molar
considered here, since KNO3 has a relatively high deliquescence I/Se ratio in foods is about 6:1 (Lyons, 2018). For example,
0.25 kg I 1.00 kg I 2.50 kg I
Pear (ha · m CH)-1 (ha · m CH)-1 (ha · m CH)-1
'Alexander
Lucas'
Control KI
KIO3
FIGURE 7 | Appearance of pear trees cv. ‘Alexander Lucas’ in the first field experiment 19 days after harvest (Oct. 13) as affected by the dose and form of iodine
foliar sprays applied two weeks before fruit harvest.
Frontiers in Plant Science | www.frontiersin.org 13 February 2021 | Volume 12 | Article 638671Budke et al. Iodine Biofortification Apples and Pears
Control KNO3 KIO3 KIO3 + KNO3 KIO3 + Na2SeO4 + KNO3
Apple
At harvest After storage
17
Total soluble solids [° Brix]
A B c
16 b bc
b b abc
ab
15 ab
a a
14
13
12
11
10
1 2 3 4 5 1 2 3 4 5
Foliar spray treatment Foliar spray treatment
Pear
At harvest After storage
17
Total soluble solids [° Brix]
C D
16
15
c bc
b ab ab ab abc
14 ab a
a
13
12
11
10
1 2 3 4 5 1 2 3 4 5
Foliar spray treatment Foliar spray treatment
FIGURE 8 | Total soluble solid content in fruit segments of apples cv. ‘Fuji’ (A,B) and pears cv. ‘Williams Christ’ (C,D) in the second field experiment as affected by
different foliar spray treatments and fruit storage at 2◦ C for a period of three months. Means ± standard deviation (apple n = 6, pear n = 4). Means with same letters
for one fruit group and one time of measurement do not differ according to Tukey-HSD test at α = 0.05.
at a content of 50 µg I (100 g FM)−1 , the target value for fruit flesh. However, after storage this difference was reduced to
Se would be 5.2 µg (100 g FM)−1 . In a study by Groth about half.
et al. (2020), Se content of this level was achieved in apples In I-biofortified nectarines, which were stored at 5◦ C for
by a foliar spray of 150 g Se (ha · m CH)−1 , regardless two weeks, the I content also remained unchanged (Caffagni
of whether SeO3 2− or SeO4 2− was applied. Further field et al., 2012). Gaseous emissions associated with the activity of
experiments are needed to examine the effects of appropriately methyltransferases have been detected in numerous plant species.
increased Se fertilization rate in combination with I. In the These enzymes catalyze the formation of methyl iodide (CH3 I), a
leaves of the apple trees we examined, the Se content was volatile compound, which can escape into the atmosphere (Itoh
several times higher than in the fruits, as already observed et al., 2009). Besides a role in plant defense, this mechanism
with I. Translocation of I and Se from leaves to seeds in may serve to prevent toxic levels of I accumulation in higher
wheat is mainly through phloem transport (Cakmak et al., plants (Gonzali et al., 2017). Additionally, I volatilization can
2017; Prom-u-thai et al., 2020), while our findings indicate be catalyzed by vanadium-dependent haloperoxidase, leading
that this route does not seem important for biofortification to synthesis of volatile hydrogen halides. Recently, activity of
of pome fruits. these enzymes in relation to I uptake has been demonstrated
for lettuce (Smoleń et al., 2020). In brown alga Laminaria
Effects of Fruit Storage digitata volatilization of cellular I by vanadium-dependent
Cold storage of I-sprayed apples at 2◦ C for three months reduced haloperoxidases is thought to be a potential tool in defense
the I content of the fruit by about one fifth. In contrast, no against pathogens and I volatilization is important to maintain
statistically significant changes were observed in pears (Figure 4). osmotic balance (Verhaeghe et al., 2008). However, to the best of
In the apples, the storage-related reduction of the I content our knowledge the activity of I-specific halide methyltransferases
was limited to the fruit peel, while the content in the fruit or haloperoxidase in pome fruits has not been studied.
flesh remained relatively stable (Table 5). At harvest time, the Fruit storage did not affect the Se content of apples or pears
I content in the fruit peel was 6.6 times higher than in the (Figure 4). Nevertheless, it is known that plants are able to form
Frontiers in Plant Science | www.frontiersin.org 14 February 2021 | Volume 12 | Article 638671You can also read