Indonesian Throughflow as a preconditioning mechanism for submarine landslides in the Makassar Strait - Geological Society, London, Special ...
←
→
Page content transcription
If your browser does not render page correctly, please read the page content below
Downloaded from http://sp.lyellcollection.org/ by guest on September 21, 2021

Indonesian Throughflow as a preconditioning mechanism
for submarine landslides in the Makassar Strait
Rachel E. Brackenridge1,2, Uisdean Nicholson1*, Benyamin Sapiie3,
Dorrik Stow1 and Dave R. Tappin4,5
1
  School of Energy, Geoscience, Infrastructure and Society, Heriot-Watt University,
  Edinburgh EH14 4AS, UK
2
  School of Geosciences, University of Aberdeen, Aberdeen AB24 3FX, UK
3
  Faculty of Earth Sciences and Technology, Institut Teknologi Bandung, Indonesia
4
  British Geological Survey, Keyworth, Nottingham NG12 5GG, UK
5
  Department of Earth Sciences, University College London (UCL), London, UK
    REB, 0000-0002-0572-314X; UN, 0000-0003-0746-8549;
DRT, 0000-0003-3186-8403
*Correspondence: U.Nicholson@hw.ac.uk

Abstract: The Makassar Strait is an important oceanic gateway, through which the main branch of the
Indonesian Throughflow (ITF) transports water from the Pacific to the Indian Ocean. This study identifies a
number of moderate (.10 km3) to giant (up to 650 km3) mass transport deposits within the Makassar North
Basin Pleistocene–Recent section. The majority of submarine landslides that formed these deposits originated
from the Mahakam pro-delta, with the largest skewed to the south. We see clear evidence for ocean-current
erosion, lateral transport and contourite deposition across the upper slope. This suggests that the ITF is acting
as an along-slope conveyor belt, transporting sediment to the south of the delta, where rapid sedimentation rates
and slope oversteepening results in recurring submarine landslides. A frequency for the .100 km3 failures is
tentatively proposed at 0.5 Ma, with smaller events occurring at least every 160 ka. This area is therefore
potentially prone to tsunamis generated from these submarine landslides. We identify a disparity between his-
torical fault rupture-triggered tsunamis (located along the Palu-Koro fault zone) and the distribution of mass
transport deposits in the subsurface. If these newly identified mass failures are tsunamigenic, they may represent
a previously overlooked hazard in the region.

The Indonesian Archipelago is seismically active due            surges and widespread onshore liquefaction due to
to its location at the intersection of four major tectonic      seismic shaking (Sangadji 2019). The Palu event
plates. Earthquakes, volcanic eruptions and tsunamis            was closely followed in December 2018, by the
represent significant geological hazards across the              Anak Krakatau tsunami, where flank collapse, prob-
island nation. Of these natural hazards, tsunamis               ably triggered by the erupting volcano, resulted in
pose a specific risk to the sustainability and resilience        tsunami run-up of 30 m and over 400 fatalities on
of coastal communities. There have been a number of             the local coasts of Java and Sumatra (NGDC/WDS;
devastating Indonesian tsunamis over the last 15                Grilli et al. 2019). The high number of fatalities of
years, triggered by various mechanisms. The 2004                these two events has been attributed to the limited
megathrust earthquake and tsunami offshore Sumatra              understanding of tsunami generation from mecha-
resulted in over 220 000 fatalities across the Indian           nisms other than fault rupture and the lack of an effec-
Ocean region, 165 000 of these on Sumatra, making               tive tsunami warning system for non-seismic events
it one of the worst natural disasters of the last 100           (Yalciner et al. 2018; Williams et al. 2019).
years (National Geophysical Data Center/World                       The Makassar Strait has the highest frequency
Data Service, NGDC/WDS). The mechanism of                       of tsunamis in Indonesia (Prasetya et al. 2001). His-
the Palu tsunami (September 2018) is still uncertain            torical records show that most are caused by
but is proposed as a result of a combination of                 earthquake-generated fault rupture of the seafloor,
earthquake-related seafloor rupture and subaerial/               with the exception of the September 2018 Palu
submarine landslides (Carvajal et al. 2019; Takagi              event, which probably had a landslide component
et al. 2019). Two surges, with maximum wave                     (Jamelot et al. 2019). However, there are numerous
heights of over 10 m (NGDC/WDS), were recorded.                 other factors in the Strait that could make it suscepti-
Over 4000 fatalities occurred as a result of tsunami            ble to submarine landslide-triggered tsunamis,

From: Georgiopoulou, A., Amy, L. A., Benetti, S., Chaytor, J. D., Clare, M. A., Gamboa, D., Haughton, P. D. W.,
Moernaut, J. and Mountjoy, J. J. (eds) 2020. Subaqueous Mass Movements and their Consequences: Advances in Process
Understanding, Monitoring and Hazard Assessments. Geological Society, London, Special Publications, 500, 195–217.
First published online April 1, 2020, https://doi.org/10.1144/SP500-2019-171
© 2020 The Author(s). This is an Open Access article distributed under the terms of the Creative Commons Attribution
License (http://creativecommons.org/licenses/by/4.0/). Published by The Geological Society of London.
Publishing disclaimer: www.geolsoc.org.uk/pub_ethics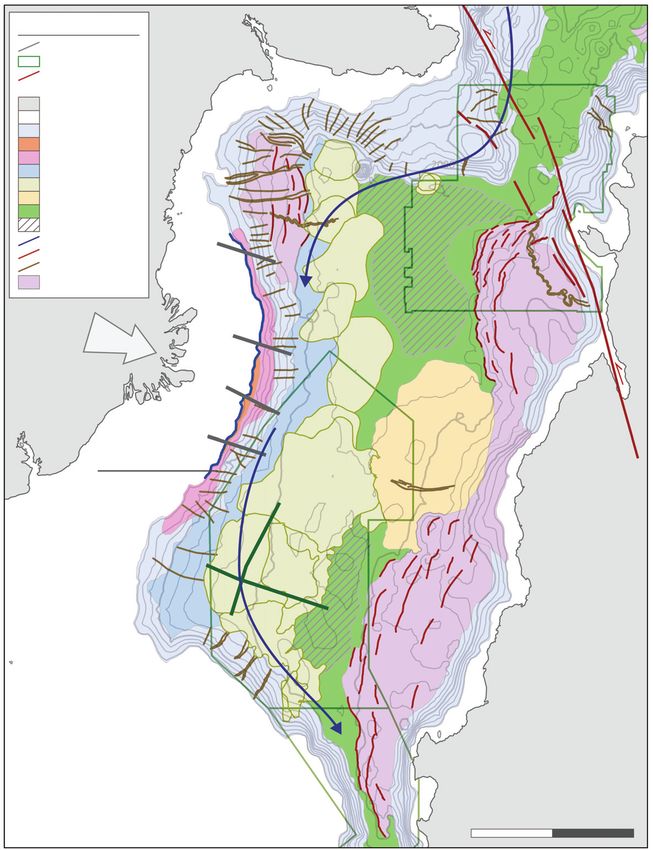
Downloaded from http://sp.lyellcollection.org/ by guest on September 21, 2021
196 R. E. Brackenridge et al.
including oversteepening of the continental slope due distribution of mass transport deposits (MTDs) that
to carbonate growth and faulting, or sediment influx result from submarine landslides will allow us to
from the Mahakam Delta. The Strait is also the identify specific regions of hazard and risk should
main channel for the Indonesian Throughflow these landslides be tsunamigenic. This has important
(ITF), a strong current that transports 10–15 million implications for hazard mitigation and early warning
Sverdrups (where 1 Sverdrup (Sv) = 1 × 10⁶ m3 systems across coastal regions of the Makassar Strait.
s−1) of water from the Pacific into the Indian Ocean
(Kuhnt et al. 2004). Elsewhere, it has been shown
that ocean currents and their associated deposits can Geographical and oceanographic setting
precondition the slope for failure through rapid sedi- Regional tectonic setting
ment deposition and erosion (Laberg and Camerlen-
ghi 2008; Nicholson et al. 2020). The Makassar Strait separates the Indonesian islands
This study evaluates slope stability in the Makas- of Kalimantan (Borneo) and Sulawesi in SE Asia
sar Strait, specifically the role of the ITF in precon- (Fig. 1). It sits within a highly complex and dynamic
ditioning the slope for failure. Understanding the plate tectonic setting (Daly et al. 1991), located at
(a) PHILIPPINE SEA
PLATE PACIFIC
Legend (b) Celebes Sea
Bathymetry (m)
SOUTH PLATE 0
CHINA M
SEA an
-3000 g
EURASIAN Structural Features Hi kalih
gh at
e A rc
PLATE Major Fault
PACIFIC
S angih
CELEBES
OCEAN
Sa
SEA Foldbelt
ng
ku
Other lineament
MTF
Su
l
iri
Earthquake Magnitude
nd
ng
Ar
a
c 2-4 5-6
FZ
4-5 6 -8
INDIAN B a n d a A rc Palu 2018
OCEAN Historical Tsunamis
Wave Height (0 - 15 m)
Tsunami
Delta
1000 km
INDO-AUSTRALIAN PLATE NSP
Samarinda
am
Legend (c) Celebes Sea
Makassar
ak
MTF Flow Rate
Palu
ah
Low North Baisn
Balikpapan
M
CSP
High
100
m Delta
KALIMANTAN 0 Palu-K
SSP
Pa W Sulawesi
te
o
r no Foldbelt
ro FZ
a
ste
00
ak
20
r
ah
FZ
M
Paternoster
Labani Channel
SULAWESI
Makassar
Paternoster South Baisn
Labani Channel
Makassar
100 km
9 Sv Dewakang
Sill
Dewakang Sill
100 km
1.7 Sv 7 Sv
Fig. 1. (a) Regional tectonic and oceanographic setting. Study area indicated in red. MTF, Makassar Throughflow.
(b) Structural features of the Makassar Strait from Puspita et al. (2005) (NSP, CSP, SSP refer to the Northern, Central
and Southern structural provenances) and Cloke et al. (1999). SRTM30_PLUS Global Bathymetry Data from Becker
et al. (2009). Historical earthquakes from the United States Geological Survey Earthquake Catalog (https://
earthquake.usgs.gov/earthquakes). Historical tsunami data from the National Geophysical Data Center/World Data
Service (NGDC/WDS) Global Historical Tsunami Database (NGDC/WDS). (c) Simulated daily average of
Sv (Sv = 1 × 10⁶ m3 s−1) for the main Makassar Throughflow jet between 52 and 420 m (Mayer and Damm 2012).
Sv values from Kuhnt et al. (2004).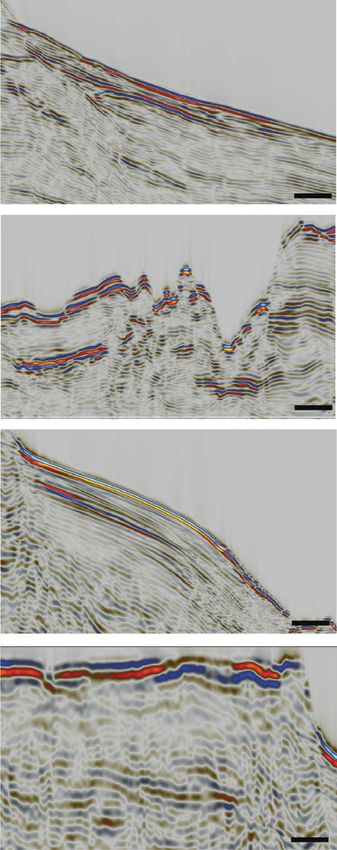
Downloaded from http://sp.lyellcollection.org/ by guest on September 21, 2021

                                 Submarine landslides in the Makassar Strait                               197

the intersection between four major lithospheric        Makassar Basin shows a similar range of water
plates (Fig. 1a). The Indo-Australian Plate, located    depths, is 300 km long, 100 km wide and NE–SW
to the south of the Makassar Strait, is colliding       trending. The margins of the Makassar Strait show
with the Eurasian Plate in a northwards direction       contrasting characteristics. To the west, the Paternos-
and is subducting below Sumatra and Java at a rate      ter Platform forms a wide shelf less than 200 m deep.
of c. 7 cm a−1 (Bergman et al. 1996; Koop et al.        This shelf has been periodically exposed during gla-
2006). To the east, the large Pacific Plate interacts    cial conditions to form part of the Sundaland land-
with the NW-moving (and clockwise-rotating)             mass, connecting Kalimantan, Java and Sumatra
Philippine Sea Plate (Hall et al. 1995). As a result    with the Asian continent (Bird et al. 2005; Hall
of plate interactions, a complex system of subduc-      2009).
tion, back-arc-thrusting, extension and major trans-        In the east of the Makassar Strait two fold belts
form zones has developed (Hall 1997; Prasetya           are expressed as topographic features on the seabed
et al. 2001) (Fig. 1a). The region is extremely sus-    (Fig. 1b). Puspita et al. (2005) define a Northern
ceptible to seismic activity and volcanic arcs line     (NSP) and Southern (SSP) fold belt separated by a
the compressional plate boundaries, including the       Central Structural Province (CSP). They note the dif-
Sunda Arc and Banda Arc to the south and the            ferent characteristics of the two fold belts, with the
Sangihe Arc to the NE (Katili 1975).                    northern showing a steep western deformation front
    Due to its active plate tectonic setting, earth-    and a chaotic internal seismic character, whereas
quakes are common across the Indonesian archipel-       the southern shows well-developed thin-skinned
ago, with some associated with tsunamis. Along          fold-and-thrust deformation. These differences are
the Sunda Arc, historical tsunamis are generally gen-   attributed to interaction with basement structures
erated by megathrust earthquakes. The mechanisms        and sediment supply, with the NSP likely consisting
for these events are well understood and have been      of muddier sediment (Puspita et al. 2005).
studied extensively following the devastating 2004          Studies of the active sedimentary systems within
Indian Ocean tsunami (e.g. McCloskey et al. 2008;       the Makassar Strait are limited but reveal a com-
Okal and Synolakis 2008). Prasetya et al. (2001)        plex distribution of different depositional systems.
show that the high frequency of historical tsunamis     Shallow-water sedimentation along the margins of
within the Makassar Strait, which is located away       the Makassar South Basin is largely carbonate
from any major subduction zone, is the result of        dominated. The Paternoster Platform in the SW of
shallow-depth earthquakes along the Palu-Koro           the Strait forms a c. 40 000 km2 medium- to coarse-
transform fault zone (Fig. 1b).                         grained carbonate sand sheet made up of bioclasts
                                                        close to reefal build-ups, and benthic foraminifera in
Geological framework                                    open marine regions (Burollet et al. 1986). The acti-
                                                        vely prograding Mahakam Delta is a major source of
The Makassar Strait forms a deep seaway that sepa-      clastic sediment to the study area, with an estimated
rates Kalimantan from Sulawesi. It varies in width      annual sediment discharge rate of 8 × 10⁶ m3 a−1 of
from 100 to 200 km and is c. 600 km in length.          clay, silt and sand-rich sediments (Roberts and
It formed in the middle Eocene, when rifting and        Sydow 2003). Outboard and north of the delta
seafloor spreading was initiated (Hall et al. 2009).     front, carbonate deposition is found on the shelf
The onset of compression in the Late Miocene to         edge, where a number of bioherm and shelf-edge
Pliocene resulted in fold-and-thrust belt develop-      build-ups are identified on bathymetry and seismic
ment along the margins of the Makassar Strait basins    data (Roberts and Sydow 2003).
(Bergman et al. 1996). At present, far-field stresses        The continental slopes surrounding the Makassar
and resulting faulting generate topographic features    Basins are locally fault-controlled (Guntoro 1999;
on the seabed, particularly in the east where Mio-      Prasetya et al. 2001). Canyons are present on the
cene–Pliocene compression has generated the West        steepest slopes, particularly in areas where sediment
Sulawesi Fold Belt (Puspita et al. 2005). The Palu-     input into the basin is restricted. MTDs are identified
Koro fault zone is a NNW–SSE-trending strike-slip       at the foot of the slope and are generated by sediment
fault and connects with the North Sulawesi Trench       failure (Saller and Dharmasamadhi 2012). Outboard
in the Celebes Sea. It crosses the Makassar Strait      of the Mahakam Delta, high sediment influx onto the
at its narrow northernmost opening, separating it       slope has formed sinuous channel-levee complexes
from the Celebes Sea (Prasetya et al. 2001). The        (Saller and Dharmasamadhi 2012).
NW–SE-trending Eocene Paternoster fault zone                The Makassar Basin floor is smooth, with no evi-
acts as a topographic barrier separating the North      dence of tectonic disturbance (Puspita et al. 2005).
and South Makassar basins (Fig. 1b).                    Seismic mapping at the base of the slope in front
    The North Makassar Basin is north–south trend-      of the Mahakam Delta shows a large number of
ing, 340 km long and 100 km wide, with water            deep-water depositional features, including turbidite
depths of 200–2000 m (Fig. 1b). The South               channels, levees and splays, as well as significant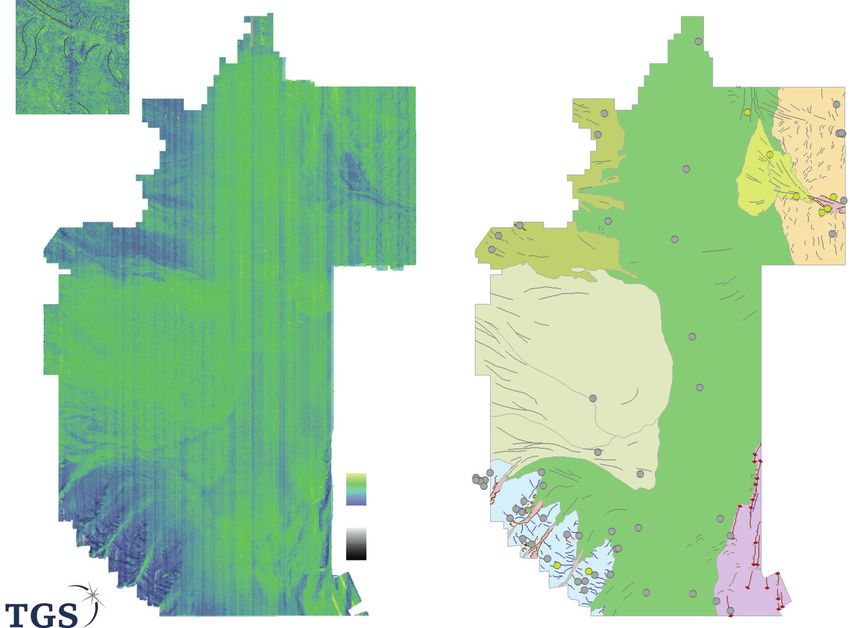
Downloaded from http://sp.lyellcollection.org/ by guest on September 21, 2021

198                                          R. E. Brackenridge et al.

MTDs (Posamentier and Meizarwin 2000). Sedi-                            Legend
ment waves are a common feature, with Decker                   Seismic                                     TGS_MakN
et al. (2004) attributing those along the Sulawesi                  MCG-1051
                                                                    MCG-1251
Slope Apron to non-channelized hyperpycnal or tur-             Bathymetry

bidite flows triggered by storm events.
                                                                     TGS Survey Extent
                                                                    -100
                                                                   -3000
                                                               Shaded Relief
                                                                    254
Oceanographic setting                                               0

                                                                        Samarinda
The ITF is made up of numerous branches sourced              KALIMANTAN                                               Palu
from the Pacific Ocean. The main branch, the Makas-             Balikpapan
                                                                                                TGS_MakS
sar Throughflow (MTF), constitutes around 80% of                                MCG-
water transfer (Fig. 1a) (Gordon et al. 2008) making                           1051
                                                                                                                 SULAWESI
the Makassar Strait the main location for water and
heat exchange between the two oceans. The MTF                                            MCG-
exits the North Pacific between the Philippines and                                       1251
New Guinea and enters the Makassar Strait via the
Celebes Sea (Tillinger 2011), where an average of
                                                                                                  t
9.3 + 2.5 Sv of water are transferred (Kuhnt et al.                                           S_
                                                                                                Pa
2004) (Fig. 1c). It then splits into two branches, one                                     TG

of which flows through the Lombok Strait, between
the islands of Bali and Lombok, and the other
through the Timor Sea, between Timor and Australia
(Fig. 1a, c) (Kuhnt et al. 2004). The Makassar Strait is                                                        Makassar
the only low-latitude ocean gateway in the global
ocean ‘conveyor belt’ of thermohaline circulation                100 km
and is, therefore, a critical regulator of global oceanic
energy exchange (Gordon and Fine 1996; Kuhnt et al.         Fig. 2. Data used in the study. SRTM30_PLUS Global
2004; Rahmstorf 2007).                                      Bathymetry Data from Becker et al. (2009).
    Within the Makassar Strait, moorings (Susanto
and Gordon 2005) and modelling (Mayer and
Damm 2012) show the MTF to act as a western boun-           Geosurvey on behalf of TGS, for their Indonesian
dary current along the Kalimantan continental slope.        Frontier Basins programme. The TGS_MakN,
The flow of the surface 50 m is primarily wind-driven,       TGS_MakS and TGS_Pat surveys (Fig. 2) were
with average velocities of 0.5 m s−1 (Gordon et al.         acquired between December 2006 and February
2008). Velocities increase with depth, reaching a           2007 and cover around 60 000 km2 in total. The
maximum of around 1 m s−1 within a subsurface ‘jet’         multibeam echosounder data have been gridded at
extending down to 300 m, with a core corresponding          25 × 25 m resolution, with features enhanced by a
to the thermocline, at about 100–150 m (Mayer and           shaded relief map (0° azimuth, 45° angle). Backscat-
Damm 2012). Below 300 m, velocities reduce to               ter data, at 5 m resolution, were also used to inform
under 30 cm s−1 (Tillinger 2011). The depth and             interpretation. These data cover the shelf edge, at
speed of this high-velocity water mass varies season-       around 200 m depth, to the basin floor, at over
ally in response to monsoonal forcing. It shallows          3000 m water depth.
and intensifies during the SE and NW monsoon sea-                Additional bathymetric data, used for regio-
sons (March–April and August–September) (Gor-               nal mapping (Fig. 2), include the Global Multi-
don et al. 2008). Locally in the Makassar Strait, the       Resolution Topography synthesis (Ryan et al. 2009)
MTF exerts a control on sedimentation. Seismic map-         and the SRTM30_PLUS Global Bathymetry Data
ping of the Mahakam Delta by Roberts and Sydow              at 30 arc seconds resolution (Becker et al. 2009).
(2003) shows the fine-grained prodelta (at c. 40 m               Slope gradient maps were extracted from bathy-
water depth) is deflected to the south due to inter-         metric data and depth profiles generated to aid inter-
action with the MTF, which can reach velocities of          pretation of physiographical domains. Structural
80 cm s−1 at the delta front.                               lineations and depositional bodies were interpreted
                                                            using bathymetric, slope and backscatter data to gen-
                                                            erate environment of deposition maps.
Data and methodology
Bathymetric data                                            Seismic data
This study is based on three multibeam echo-                Two 2D seismic surveys from Multiclient Geophys-
sounder bathymetry surveys, acquired by Gardline            ical were interpreted in this study. The Makassar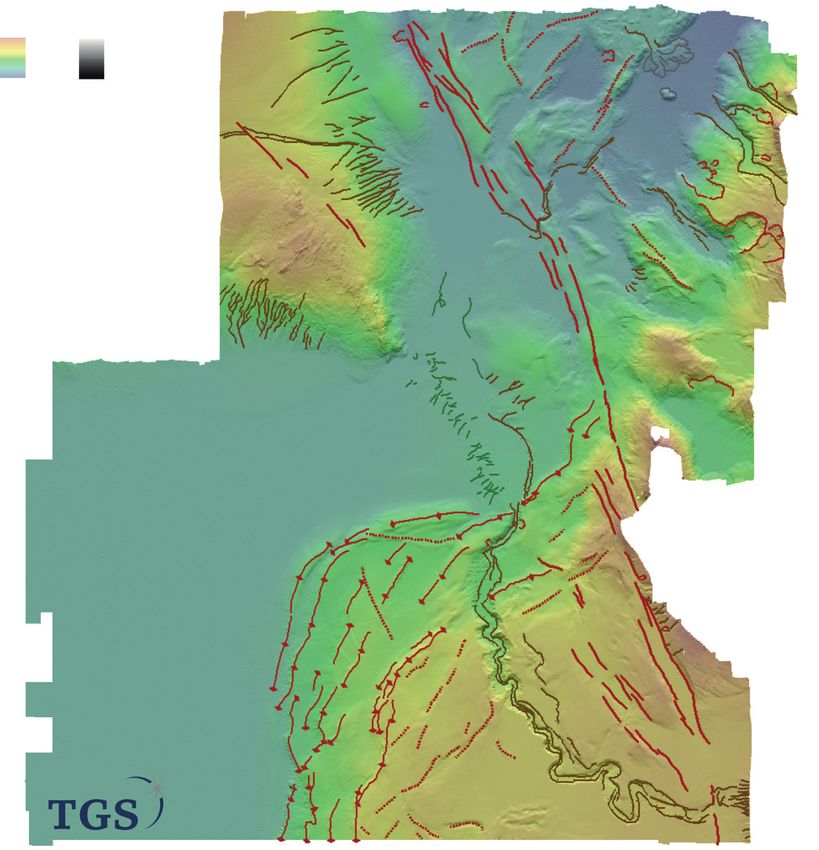
Downloaded from http://sp.lyellcollection.org/ by guest on September 21, 2021

                                 Submarine landslides in the Makassar Strait                                199

Regional Super-Tie MCG2D Survey (MCG-1051)               were acquired within the region of the bathymetry
provides regional coverage of the Makassar North         survey (Fig. 2) in 2017 by TDI-Brooks International
Basin (Fig. 2) with 21 2D pre-stack time migra-          for geochemical analysis. From the cores over 600
tion (PSTM) seismic lines totalling c. 5000 km line      samples were analysed for hydrocarbon indications.
length. The data were acquired in 2010 and pro-          Shear strength measurements and basic sedimentary
cessed by CGG Veritas in early 2011. The                 information were also available for each sample.
MCG-1051 survey was followed in 2012 by an                   Historical earthquake data were compiled from
infill survey (MCG-1251). The Makassar Infill 2D           the United States Geological Survey Earthquake
PSTM (Fig. 2) consists of 27 lines with a total of       Catalog (USGS; https://earthquake.usgs.gov/earth
c. 2400 km line length. Both seismic surveys are         quakes, accessed May 2019). These records extend
high resolution in the upper few seconds below the       back to 1900 and list earthquake date, time, magni-
seabed, which is the main section of interest in         tude and epicentre depth. Historical tsunami data
this study.                                              were downloaded from the National Geophysical
    From the seismic data, we map Quaternary sedi-       Data Center/World Data Service Global Historical
ments deposited in the Makassar North Basin. Pre-        Tsunami Database (NGDC/WDS), which docu-
cise age constraints were not possible because of        ments source location, date, time, event magnitude,
the lack of well control; however, a Top Pliocene        maximum water height, total number of deaths,
horizon was interpreted based on del Negro et al.        injuries and damage for each event.
(2013). This allows us to date the age of the youngest       Additional information was compiled from the
sedimentary sequence at ,2.6 Ma. Seismic data            literature where data coverage was unavailable for
were interpreted using standard seismostratigraphic      this study. Specifically, modelled routing of the
methods, and seismic facies (SF) were used to dis-       MTF was georeferenced and digitized from Mayer
tinguish the different environments of deposition.       and Damm (2012). Additional information about
Reflection terminations were used to identify key         the features on the seafloor were gathered from stud-
seismic stratigraphic surfaces, including tops and       ies by Fowler et al. (2004), Saller and Dharmasa-
bases of individual MTDs. Due to the spacing of          madhi (2012) and Frederik et al. (2019).
the 2D seismic data (17–40 km) only MTDs larger
than c. 80 km2 and 60 ms (c. 110–130 m thick)
were mapped. Events smaller than 100 km3 are
under-represented due to limitations in spatial cover-   Results and interpretation
age of the 2D seismic survey, and the resolution         Surface bathymetry interpretation
for imaging thinner events. Seismic resolution dete-
riorates with depth; therefore, accurate mapping of      Physiographic domains. The main physiographic
MTDs was limited to the Pleistocene–Recent sec-          domains of the Northern Makassar Basin were
tion. The volume of each MTD was calculated and          mapped regionally on the SRTM30_PLUS Global
converted to depth using a velocity of 2000 m s−1,       Bathymetry Data (Becker et al. 2009). The continen-
based on well velocity data gathered from MTDs           tal shelf-slope break is defined by a change in slope
of similar depositional character and burial depths      gradient from less than 0.2° across the shelf, to slope
in the Falkland Basin (Nicholson et al. 2020).           gradients of 3–23° (Fig. 3). The shelf break occurs
An uncertainty range of 20% has been added to            at c. 200 m water depth and varies significantly
capture possible MTD velocities between 1800             with distance from the coastline. To the west of the
and 2200 m s−1. The total number of mapped land-         basin, a broad shelf of around 30–50 km extends
slides over the last c. 2.6 Ma was used to derive        out in front of the Mahakam Delta. This is signifi-
an average frequency for events of different vol-        cantly wider than the eastern shelf, which reaches a
umes. As a result of the low seismic imaging resolu-     maximum width of 10–15 km and where a narrow,
tion and line spacing, estimates of the frequency        and locally very steep (up to 24°) continental slope
of smaller events (,100 km3) are considered to be        grades to the basin floor (Fig. 3). The northern and
conservative.                                            southern limits of the basin are defined by structural
                                                         highs (the Mangkalihat High and the Paternoster
Additional data                                          Platform respectively) which are bisected by deep,
                                                         narrow channels. The deep Southern Makassar
As part of the TGS-NOPEC Indonesian Frontier             Basin is significantly smaller than the Northern
Basins programme, a number of additional datasets        Basin at approximately 180 km wide and 200 km
were acquired to complement the multibeam echo-          in length (Fig. 3). This is a result of the extensive
sounder data used in the study. These data include       Paternoster Platform extending out from the Sula-
gravity and magnetics acquired during the bathyme-       wesi Margin. Two channels connect the Southern
try survey, as well as regional gravity data compiled    Makassar Basin over the Dewakang Sill, to the
by Sandwell et al. (2014). Also, 234 piston cores        Flores Sea in the South.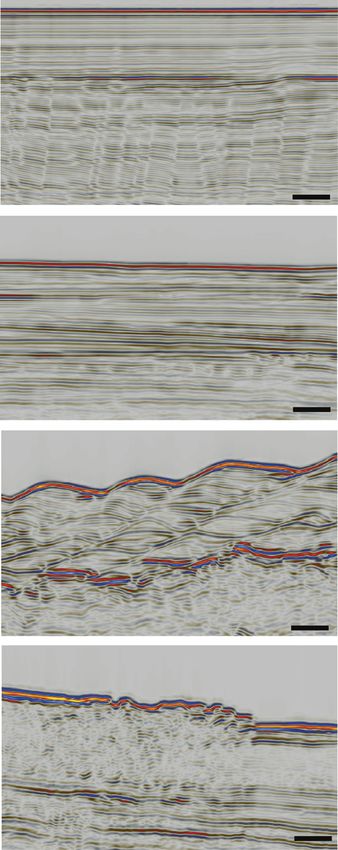
Downloaded from http://sp.lyellcollection.org/ by guest on September 21, 2021

200                                                             R. E. Brackenridge et al.

              Legend
                                          Ma                           Celebes
                                            ng                           Sea
   Slope Gradient (degrees)                 Higkalih
         25                                    h at
                                                                (a)
                                                                                      (a)
         0
                                                              (b)

                                                   Makassar
                                                    North
                        Mahakam
                                                    Basin
                         Delta                                                        (b)                                                  Velocity
                                                                                                                                               -1
                                                                                                                                               (ms )
  KALIMANTAN                                       (c)                                                     300 m                         0.0           0.8
                                                                                                           Depth of MTF
                                            2000

                                                                                                                                 200
                                     0
                                  100

                                                                                                                     Depth (m)
                                                                                      (c)
                                                                    SULAWESI                                                     400
                       Paternoster
                                    (d)                   Labani Channel
                                                                                                                                 600

                                                                                      (d)

                                          (e)                       Makassar
                                                                     South
                                                                     Basin

                                                                                      (e)

                              (f)

                                                                                                                                           100 km

                                                                                                                                  1 km
      100 km
                                                                                      (f)

Fig. 3. Slope map extracted from the regional bathymetry RTM30_PLUS Global Bathymetry Data (Becker et al.
2009). Bathymetry contours at 250 m spacing). (a–f) Depth profiles across the Strait showing the main basin and
channel features. Depth of Makassar Throughflow (MTF) indicated in blue. Velocity–depth profile shows average
velocity profile for years 2004–09 (Susanto et al. 2012).

Structural features. The resolution of the                                       imaged on the seafloor (Fig. 4). Puspita et al. (2005)
SRTM30_PLUS Global Bathymetry Data (Becker                                       define two distinct fold-and-thrust belts named the
et al. 2009) is insufficient to identify structural and                           Northern and Southern Structural Provinces (Fig. 1).
sedimentary features in detail. However, the active
tectonic nature of this region is evidenced by a num-                            Sedimentary features. There is evidence for multiple
ber of features mapped on the high resolution TGS                                downslope systems transporting sediment into the
bathymetric surveys (Figs 4–6). Most notably, struc-                             Makassar North Basin. From the backscatter data
tural features include: (1) major strike-slip fault                              we interpret subtle sedimentary features, distinguish-
zones; and (2) fold-and-thrust complexes. The Palu-                              ing bedrock or carbonates of high acoustic reflectivity
Koro fault zone is clearly imaged in the bathymetry                              (strongly negative values) from medium reflectivity
data (Fig. 4). It extends from Palu Bay, Sulawesi,                               sands and low reflectivity mud-dominated deposition
northwestwards to the northern edge of the Mangka-                               (values close to zero) (Fig. 5). Dominant sedimentary
lihat High. On the high-resolution TGS_MakN sur-                                 features include: (1) slope canyons; (2) basin floor
vey, the details of this fault zone can be mapped                                fans; (3) slope failure scarps; and (4) and deep-water
(Fig. 4). It is made up of multiple individual left-                             turbidite channels.
lateral strike-slip faults with both transtensional                                  The TGS_MakN bathymetric survey, on the east-
pull-apart and transpressional pop-up structures evi-                            ern margin of the Makassar North Basin, images
dent along the fault zone. The faults generate topog-                            a deep-water channel in the northern fold belt
raphy on the seabed of 250–300 m. The basin floor is                              (Fig. 4). The channel is sourced from the mouth of
modified in the east of the Makassar Strait where two                             Palu Bay, which incises to a depth of 300 m in the
fold-and-thrust belts are evident on the bathymetry,                             upper slope, down to 600 m deep in its distal portion.
and a series of thrust-cored anticlines are clearly                              The channel profile shows steep, erosive flanks,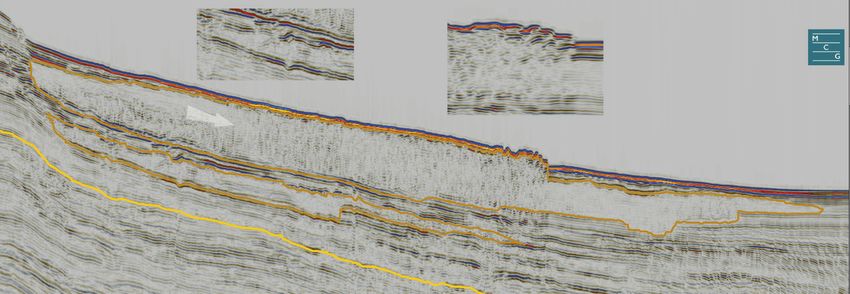
Downloaded from http://sp.lyellcollection.org/ by guest on September 21, 2021

                                  Submarine landslides in the Makassar Strait                                     201

Fig. 4. Bathymetry data interpretation of the Makassar North TGS survey. Bathymetry data overlaying a shade map
with interpretation of structural and sedimentary features. Survey location indicated on Figure 2.

bordering a flat channel axis. The channel shows a              Where sinuous channels and sediment waves
moderate sinuosity of 1.4, which is modified by             dominate the eastern margin of the basin, v-shaped
thrust-cored anticlines in the outer part of the fold      and straight canyons dominate on the northern,
belt. There is no evidence for an associated deposi-       western and southern margins. High-resolution
tional fan on the basin floor.                              bathymetric data only cover a small portion of the
    A downslope (turbidite) depositional fan is seen       continental slope of the Mangkalihat High and the
in the TGS_MakS bathymetric survey, where an               Paternoster Platform. Both these continental margins
extensive sediment wave field has developed along           show canyon systems of very different characteris-
the eastern side of the basin. The Makassar South          tics. The Mangkalihat High canyons are tightly
backscatter data image a small downslope channel           spaced, straight, v-shaped downslope canyons that
c. 2.5 km wide, 200 m deep on the eastern continen-        range between 40 and 80 m deep (Fig. 4). The
tal slope, which feeds a sediment fan with low back-       TGS_MakS bathymetric data cover a number of
scatter values compared to the surrounding basinal         canyons fed from the Paternoster Carbonate Plat-
sediment (Fig. 5). The sediment wave field suggests         form. Here, four large v-shaped canyons (over
periodic unconfined flow across the continental mar-         5 km wide, 400–700 m deep) are separated by slope-
gin between the two fold-and-thrust belts. Wave            perpendicular ‘spurs’ (Fig. 5). This change in charac-
crests are orientated parallel or slightly oblique to      ter may be due to clastic v. carbonate-dominated
the continental slope. The sediment waves are sinu-        sedimentation and erosive processes in the north
ous with wave lengths of 0.5 to 1 km, and heights          and south, respectively. We do not have access to
of 5–30 m. Backscatter data show higher values on          high-resolution bathymetric data over the western
the lee slide of waves.                                    continental slope of the Makassar North Basin;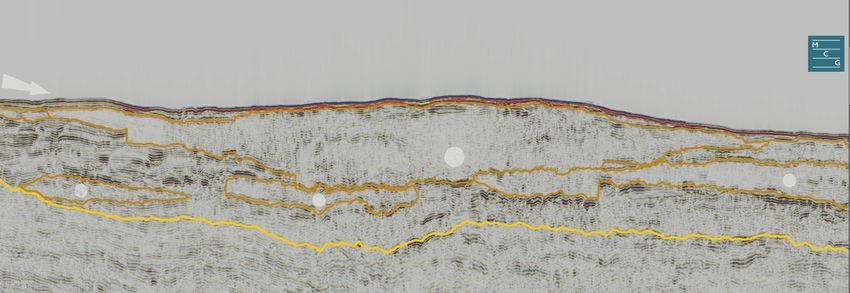
Downloaded from http://sp.lyellcollection.org/ by guest on September 21, 2021

202                                          R. E. Brackenridge et al.

                                     (a)                                                       (b)

Fig. 5. Bathymetry data interpretation from the Makassar South TGS survey. (a) Backscatter overlaying a shade map.
Highly negative values (indicated in blues) represent bed rock, carbonates or sands. Greens indicate mud-dominated
deposition. Insert shows zoom-in of sediment wave crests. (b) Interpretation of sedimentary and structural features
with seabed facies from piston cores. Survey location indicated on Figure 2.

however, published studies suggest that downslope           Immediately south of the Labani Channel, a scal-
canyons and associated slope apron fans are wide-           loped, scour-like feature is imaged at 1300 m water
spread (e.g. Fowler et al. 2004; Saller et al. 2008).       depth (Fig. 6a). The feature is orientated perpendic-
    Small failure scarps (,5 km2) are a common fea-         ular to the slope, with a steep lee and shallow stoss
ture of the forelimbs of thrust belt anticlines (Fig. 6)    side; all characteristic of formation by alongslope
and in the TGS_MakN bathymetric data to the                 erosion. To the south, there is an erosional terrace
north of the Palu-Koru Fault zone (Fig. 4). The             across the upper slope at 200 m water depth
backscatter imaging over the TGS_MakS bathymet-             (Fig. 6b). This terrace is 700–800 m wide and is elon-
ric survey highlights a region of mass-transport dep-       gated alongslope for c. 10 km. It is formed along the
osition (Fig. 5). These deposits are characterized by       north side of a large embayment. On the south side of
low backscatter values, suggesting low acoustic             this embayment, a mounded topographic feature
reflectivity and therefore high mud content. Kine-           around 500 m high is seen at the base of the slope.
matic indicators, expressed as lineaments on the            It is elongated alongslope, (Fig. 6a) and tentatively
seafloor (Fig. 5b), suggest a flow direction from             interpreted as a contourite mounded drift; however,
the west. Evidence for slope failure is also seen in        further geophysical data are required to confirm
the TGS_Pat bathymetric survey (Fig. 6). Large              this interpretation.
blocks (reaching 20–35 m in diameter) are distribu-
ted at the base of slope along the western margin           Subsurface seismic interpretation
of the Paternoster Platform in the Makassar South
Basin (Fig. 6b).                                            Seismic tectonostratigraphy. The Top Pliocene was
    The TGS_Pat bathymetric survey data image a             interpreted across the entire seismic survey and an
number of features that we interpret as contourites.        isochron thickness map of the seabed to Pliocene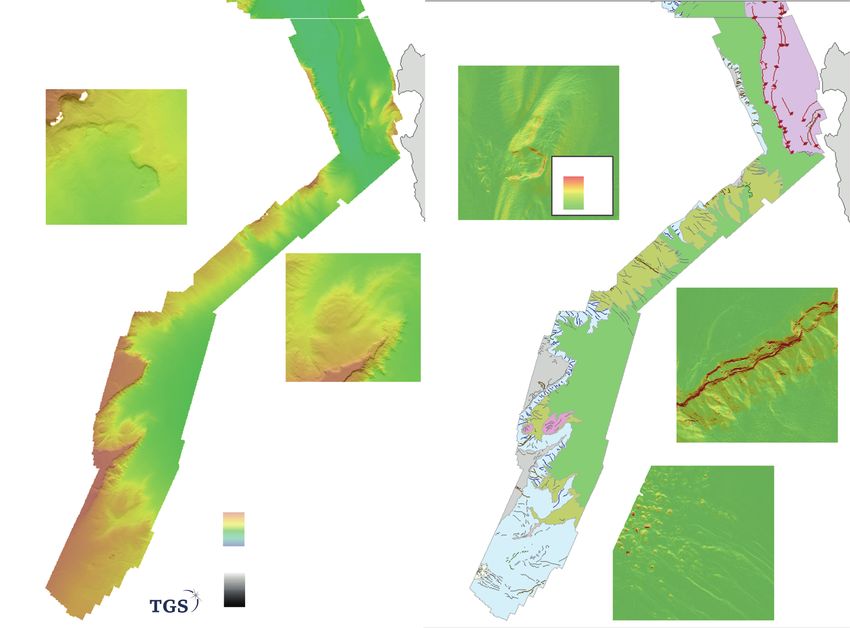
Downloaded from http://sp.lyellcollection.org/ by guest on September 21, 2021
Submarine landslides in the Makassar Strait 203
(a) (b)
Fig. 6. Bathymetry data interpretation from the Paternoster TGS survey. (a) Bathymetry overlaying a shade map.
MTF (inserts) indicates the direction of the Makassar Throughflow. (b) Interpretation of sedimentary and structural
features. Inserts show slope gradient. Survey location indicated on Figure 2.
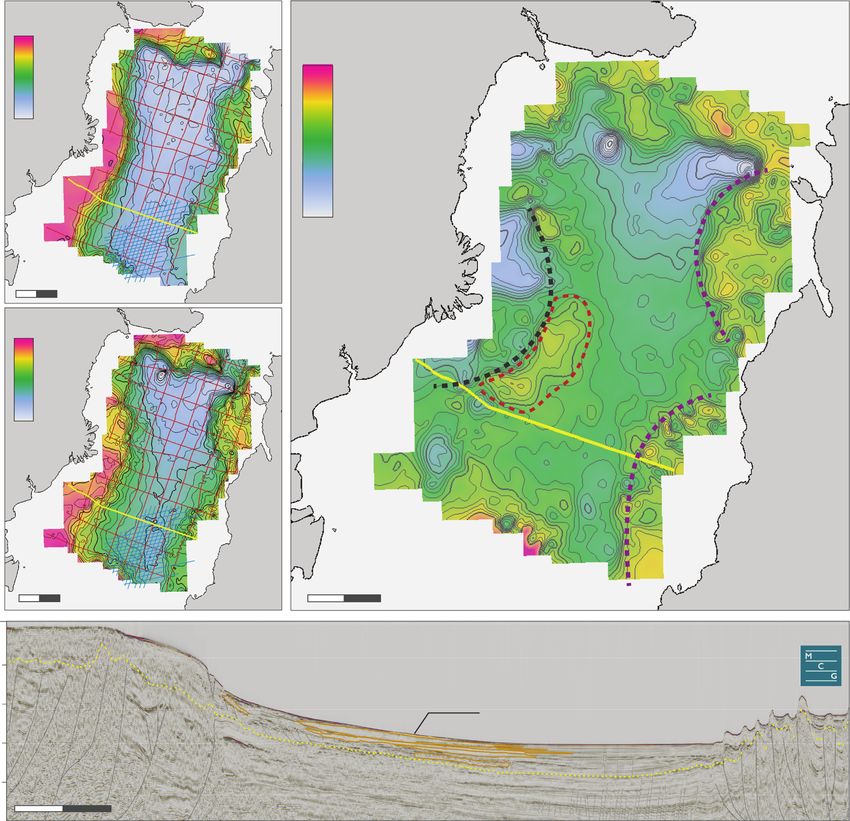
sequence generated to show depositional trends reflections are offset due to densely spaced high-
in Pleistocene–Recent sediments of the Makassar angle extensional faulting (Fig. 9 I). These faults
North Basin (Fig. 7). The isochron thickness map are characteristic of sediment compaction and fluid
reveals a basin depocentre in the north, with a gene- expulsion from fine-grained biosiliceous sediments
ral thinning to the south. An additional depocentre is (e.g. Davies and Ireland 2011). These facies are asso-
identified in the west on the edge of the data in front ciated with a prominent bottom-simulating reflector
of the Mahakam Delta (Fig. 7). (BSR). Based on the polarity reversal of this BSR,
and the polygonally faulted nature of the associated
Seismic facies and environment of deposition. SF facies, we interpret this as a diagenetic Opal A/CT
interpretation identifies eight dominant facies (I– boundary zone within highly siliceous pelagic
VIII) (Figs 8 & 9; Table 1). Each facies is character- sediments (Lee et al. 2003). Polygonal faulting
ized from its internal reflection character, continuity, and a strong Opal A/CT transition suggest a high
amplitude and frequency, in addition to external silica content, implying a lack of terrigenous
morphology and/or bounding relationships sediments (turbidites, hemipelagic mud), allowing
(Table 1). The regional extent of each of the facies us to distinguish this facies from hemipelagites (see
was mapped (Fig. 8). These observations were com- SF II).
bined with those from the bathymetric mapping to
interpret an environment of deposition for each SF II. High-amplitude, high-frequency, laterally
facies (Table 1). continuous reflections with draping morphology
are interpreted as hemipelagic facies (Fig. 9 II).
SF I. Two regions of polygonally faulted pelagic SF II transitions towards the basin centre into
sediments (SF I) are located in the deepest part of SF I. Based on the lack of polygonal faulting and
the basin, directly in front of the two fold-and-thrust BSR, we interpret this facies as less biosiliceous,
belts (Fig. 8). Here, high-amplitude, high-frequency but still very fine-grained, hemipelagites.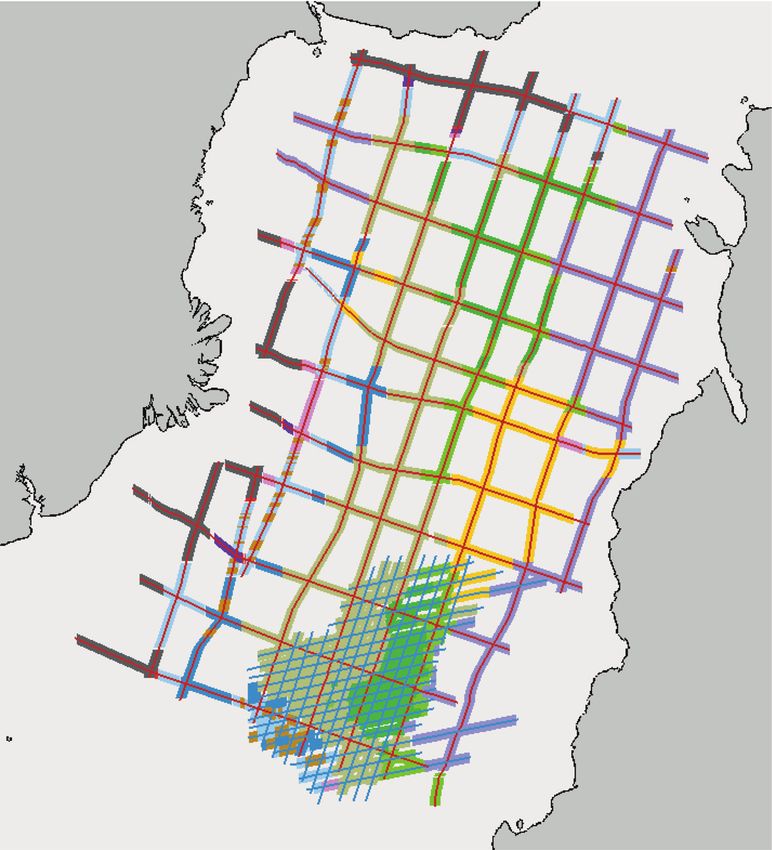
Downloaded from http://sp.lyellcollection.org/ by guest on September 21, 2021

204                                                                      R. E. Brackenridge et al.

            (a)         Seabed                    (c)               Pliocene Isochron
                        0                                           Thickness Map
             TWT (ms)

                                                                          0

                                                    Thickness (ms TWT)
                        3500

                                                                                                             Makassar
                                                                          2000                              North Basin
                                                                                                                           Northern
                                                   KALIMANTAN                                                               Fold &
              50 km                                                                                                       Thrust Belt
                                                                                  Mahakam Delta
            (b)         Top Pliocene                                               Depocentre              Submarine
                        500                                                                                 Landslide
             TWT (ms)

                                                                                                          Failure Zone?

                        5500
                                                                                                     Line
                                                                                                          569
                                                                                                                    Southern
                                                                                                                    Southern-
                                                                                                                      Fold &
                                                                                   Paternoster                      Thrust Belt
                50 km                                                    50 km      Plaorm                                 SULAWESI

             Mahakam                                                                                        (d) MCG_1051 Line 569
  1           Delta

  2                                                                                   MTDs
  3
                                                Top Plioc                                                                        Fold &
                                                          ene
TWT (sec)

                                                                                                                               Thrust Belt
                        200 km                                                                       Polygonal Faulng

Fig. 7. (a)–(c) Seabed to Pliocene mapping and (d) example regional seismic line from the MCG-1051 survey.

   SF III. Sediment waves are found locally on the                                        SF IV. Dominating the Pleistocene basin fill are
western basin margin and an extensive sediment                                         numerous MTDs, clearly identifiable from their semi-
wave field dominates the eastern margin, between                                        transparent and chaotic seismic signature (SF IV).
the two fold-and-thrust belts (Fig. 8). The waves                                      The MTDs are characteristically deformed, chaotic,
are characterized by hummocky, subparallel, semi-                                      discontinuous and low amplitude (Fig. 9 IV).
continuous reflections (SF III) (Fig. 9 III). The                                       Rare internal reflections show extension in their
package is 200–400 ms two-way travel time                                              proximal portions, and imbrication and compression
(TWT) in thickness and affects the seafloor bathyme-                                    in their distal parts (Fig. 10). Individual MTDs are
try as seen in the Makassar North Basin (Fig. 5). The                                  mappable because they form lenticular bodies with
base of this seismic package is a high amplitude                                       erosional bases of negative acoustic impedance
reflection showing opposite polarity to the seafloor.                                    (AI), and a strong positive AI upper surface onto
This is likely a BSR associated with gas hydrates                                      which younger stratigraphy onlaps (Fig. 10). MTDs
that could have promoted gravitational movement                                        thin and pinch out, upslope and laterally. Their
(creep) downslope. The seabed topography gener-                                        downslope extent is either thinning (e.g. Fig. 10), or
ated by such a process appears to have promoted                                        shows an abrupt, stepped change in facies. SF IV is
the growth of upslope-migrating sediment waves                                         predominantly distributed along the western side of
that have likely been deposited by unconfined down-                                     the basin, with the largest events clustered in the
slope (turbiditic) processes.                                                          SW (Fig. 8).
Downloaded from http://sp.lyellcollection.org/ by guest on September 21, 2021
Submarine landslides in the Makassar Strait 205
Fig. 8. Mapped seismic facies. Yellow boxes (I–VIII) indicate location of seismic sections shown in Figure 9.
SF V. Upslope of the MTDs and basin floor, SF V contourites. The external morphology is distinctly
is characterized by subparallel and semi-continuous convex up, with evidence of alongslope elonga-
reflections (Fig. 9 V). Locally, this facies shows a tion (despite limited 2D data coverage). The upslope
mounded external morphology and thinning upslope. progradation of internal seismic reflections, com-
Reflections dip basinward but are at a lower angle bined with their external morphology, is typical of
than the seabed forming the upper continental contourite-plastered drifts (Rebesco et al. 2014).
slope. This facies is interpreted as a turbidite-
dominated slope apron consisting of sediment fans SF VIII. Characterized by horizontal to basinward-
and channel-levee systems. dipping, semi-parallel, discontinuous reflections, SF
VIII is confined to the continental shelf (Fig. 9 VIII).
SF VI. The upper slope shows varying seis- Internal reflections are low amplitude, compared to
mic reflection amplitudes. Internally reflections are the seabed reflection horizon (which locally is high
laterally semi-continuous, but commonly are trun- amplitude), particularly in the north of the study
cated by downcutting, erosive canyons (Fig. 9 VI). area. Locally on the shelf or at the shelf break, iso-
Basinward-dipping reflections are seen in addition lated build-ups (Fig. 11a, b) are interpreted as bioher-
to mounded morphologies. Rare BSR reflections mal carbonates (Roberts and Sydow 2003). These
are also identified within SF VI. suggest that the locally high amplitude seabed seis-
mic reflections are due to carbonate deposition.
SF VII. On the upper slope in the SW of the Makas- Combining the observations and interpretations
sar North Basin (Fig. 8), the SF is characterized from the bathymetric and seismic mapping, an envi-
by basinward-dipping, parallel, semi-continuous ronment of deposition map for the Quaternary has
internal reflections (Fig. 9 VII), interpreted as been compiled (Fig. 12).Downloaded from http://sp.lyellcollection.org/ by guest on September 21, 2021 206 R. E. Brackenridge et al. Fig. 9. Seismic facies of the Makassar Strait. Locations indicated on Figure 8. MTDs. In total, 19 individual MTD deposits were of the basin. Smaller (,50 km3) events are sourced mapped in detail (Table 2; Fig. 12), with volumes from the Mangkalihat High in the north and the ranging from 5 km3 to over 600 km3 (Table 2). Paternoster Platform in the south. No significant vol- Five MTDs are over 100 km3 in volume, with the ume MTD events are identified in the fold-and-thrust three largest located at the base of the continental belt – although numerous smaller events (,5 km3) slope in the SW of the Makassar North Basin, associated with thrust-cored anticlines are evident south of the Mahakam Delta (Fig. 13). Mapping in the bathymetric data (e.g. Fig. 6b). of internal and top-surface directional indicators Based on their internal and external characteris- (imbrications and lineations) reveals that the largest tics, the MTDs mapped in this study, are interpreted MTDs are sourced from the southwestern margin as deposited from translational submarine
Downloaded from http://sp.lyellcollection.org/ by guest on September 21, 2021

                                    Submarine landslides in the Makassar Strait                                   207

Table 1. Pliocene–Recent seismic facies (SF) across the Makassar Strait MCG surveys

SF      Configuration and            Amplitude and           Bounding relationship                  Depositional
        continuity                  frequency                                                      environment

I       Horizontal, parallel,       High amplitude,         Fault-plane truncations. Laterally,    Pelagic with
          discontinuous               high frequency          merging with SF II                     polygonal
                                                                                                     faulting
II      Horizontal, parallel,       High amplitude,         Laterally continuous, draping          Hemipelagic
          laterally continuous        high frequency          morphology
III     Hummocky, subparallel,      High amplitude,         Laterally continuous, onlapping        Sediment waves
          semi-continuous             low frequency           upslope
IV      Deformed – chaotic,         Low amplitude, low      Lenticular, basal erosional            MTDs
          discontinuous               frequency               truncations and steps
V       Dipping, subparallel,       Varied amplitude,       Localized mounded morphology.          Slope apron/
          semi-continuous             mod. frequency          Thinning towards slope                 turbidite
VI      Dipping, subparallel,       Varied amplitude,       Canyon downcutting results in          Continental slope
          semi-continuous             low frequency           erosional truncation                   with canyons
VII     Dipping, parallel,          High amplitude,         Convex-upward lenticular.              Contourite
          semi-continuous             high frequency          Elongate alongslope
VIII    Horizontal,                 Low amplitude, low      High-amplitude top reflection           Continental shelf
          semi-parallel,              frequency               with localized build-ups
          discontinuous

landslides. The isochron thickness map identifies             (Fig. 7c). This suggests that the submarine landslides
a thin Pleistocene–Recent sequence in the upper              were initiated in the upper- to middle-continental
slope which could be a possible failure zone                 slope between water depths of 500 and 1250 m.

                                                                                            (a)

                                                                                           (b)

Fig. 10. Seismic character of MTDs in (a) dip and (b) strike. Location of section indicated in Figure 12. Red
triangles indicate intersection. Flow direction in (b) towards the reader.
Downloaded from http://sp.lyellcollection.org/ by guest on September 21, 2021
208 R. E. Brackenridge et al.
0.0 0
Carbonate (a)
0.5
500
Erosional Scarp
1.0
Plastered Dri
Salinity (psu)
34.6
Slope Failure 1000
1.5
34
0
0 1 ms-1
Shelf-edge Build-up 20° y
(b)
3° cit
0.5 lo
e
Erosional Scarp
FV
500
MT
1.0
Plastered Dri 15°
Temp (degC)
17.5
1000
1.5 Slope Failure
0
0
15° 0 1 ms-1
(c)
Erosional Scarp 1.5° cit
y
0.5 lo
e
FV
Contourite Terrace 4° 500
MT
Salinity (psu)
34.6
1.0
Plastered Dri
14°
34 1000
1.5
Slope Failure
0
(d)
Shelf
0.5
500
Plastered Dri
Water Depth (m)
1.0 a
ODV
Temp (degC)
b 17.5
TWT (secs)
c Slope Failure
d
5 km
0
Fig. 11. Seismic character of the contourite depositional system across seismic line (a)–(d) indicated in inset map.
Temperature and salinity data from Ocean Data View (ODV) section indicated (Schlitzer 2020). Slope gradients
annotated in sections (b) and (c). Line locations indicated on Figure 12. Velocity–depth profile shows average velocity
profile 2004–09 (Susanto et al. 2012).
Contourite features. On the upper slope, erosional upper slope (1.5°) before a second shelf-slope
and depositional contourite features are interpreted. break at 450 ms TWT (c. 300 m water depth). This
Along the western edge of the Northern Basin, out- is seen clearly on seismic line MCG_1051 L639
board of the shelf break there is a steep (15–20°) ero- (Fig. 11b) where the ‘step’ in the upper slope corre-
sional escarpment that correlates well with the sponds to the average water depth of the base MTF at
maximum velocity core of the MTF at 100–150 m 300 m (Mayer and Damm 2012). It is therefore inter-
water depth (Gordon et al. 2008). Locally, the base preted as a contourite terrace, formed by MTF ero-
of this steep scarp is associated with a low gradient sion. The mechanisms for contourite terraceDownloaded from http://sp.lyellcollection.org/ by guest on September 21, 2021
Submarine landslides in the Makassar Strait 209
Fig. 12. Map of the environment of deposition of the Makassar North Basin. TGS bathymetry data extent indicates
areas of high-resolution data. Additional information gathered from Fowler et al. (2004); Saller and Dharmasamadhi
(2012); and Frederik et al. (2019). CDS, contourite depositional system.
formation are poorly understood (Hernández-Molina drifts. In the Makassar South Basin, the Paternoster
et al. 2008); however, the association between ter- bathymetric data (Fig. 6) show a number of addi-
race depth and the base of the MTF suggests the tional features that could represent contourites
possibility of enhanced current energy or internal including: (1) an erosional scour orientated perpen-
wave-related erosion at the thermocline or pycno- dicular to the Paternoster margin (Fig. 6a insert) –
cline. The presence of an erosional scarp upslope these scours are characterized by steep lee and shal-
of the terrace shows that this western boundary cur- low stoss sides, and are interpreted as formed by bot-
rent is highly erosive in nature along much of the tom current turbulence within the MTF on exiting
western margin of the Makassar North Basin. the Labani Channel, similar to features described
Downslope of the erosional features, SF VII shows by Nicholson and Stow (2019); (2) a contourite
a distinctly convex-upwards slope morphology, terrace similar to that seen in the Makassar North
alongslope elongation and upslope progradation of Basin (Fig. 6b); and (3) a potential mounded
internal reflections (Fig. 9) – all features diagnostic drift within an embayment (Fig. 6a). However, addi-
of contourites (Nielsen et al. 2008). We interpret tional seismic data are required to corroborate
these depositional features as plastered contourite this interpretation.Downloaded from http://sp.lyellcollection.org/ by guest on September 21, 2021
210 R. E. Brackenridge et al.
Table 2. Measurements from mapped MTDs and morphology, makes them susceptible to mass fai-
their calculated volumes lure (Hampton et al. 1996). Carbonates are present
across the western margin of the Makassar Strait,
MTD Area Volume km3 at Uncertainty both as isolated biohermal build-ups along the NW
(km2) (TWT) 2000 m s−1 (km3) continental shelf, and more extensively across the
range + Paternoster Platform in the SW. Based on kinematic
indicators and gross morphology, a number of mod-
A 3410 616.47 616.47 123.29
erate size (,50 km3) MTDs are sourced from the
B 938 53.88 53.88 10.78
C 3891 422.99 422.99 84.60 Paternoster Platform (Fig. 13). However, the largest
D 1482 110.60 110.60 22.12 MTDs are sourced from the western continental
E 1313 137.06 137.06 27.41 margin where clastic sedimentation from the Maha-
F 444 26.32 26.32 5.26 kam Delta dominates (Fig. 13), rather than the car-
G 3959 212.19 212.19 42.44 bonate platform margin. It is therefore unlikely that
H 230 41.87 41.87 8.37 oversteepening of carbonate slopes is a driver for
I 193 5.85 5.85 1.17 large-scale submarine landslides in the Makassar
J 882 50.57 50.57 10.11 North Basin.
K 249 12.71 12.71 2.54
L 660 58.64 58.64 11.73
M 523 36.81 36.81 7.36 Seismic activity. There is historical evidence for
N 865 57.56 57.56 11.51 earthquake rupture of the seabed causing tsunamis
O 963 75.64 75.64 15.13 (NGDC/WDS) and seismic activity is frequent
P 659 42.48 42.48 8.50
Q 680 44.48 44.48 8.90
across the Makassar Strait region (Fig. 1) (https://
R 86 4.91 4.91 0.98 earthquake.usgs.gov/earthquakes), particularly in
S 130 8.14 8.14 1.63 Sulawesi where earthquakes of up to Mw 8 are
associated with the left lateral Palu-Koro fault zone
20% uncertainty range applied to allow for acoustic velocities (Fig. 1b). There are historical earthquakes along
between 1800 and 2200 m s−1. the eastern margin of the Makassar Strait; however,
our mapping shows that the MTDs are sourced
from the western margin. It is therefore unlikely
Discussion that seismic activity and related seafloor fault rupture
Drivers for slope instability is the primary driver for these. Nevertheless, with
the narrow Makassar Strait c. 300 km in width, it is
There are a number of factors that contribute to possible that far-field seismic shaking is the trig-
instability of continental slopes: (1) seismic activity, gering mechanism for submarine landslides of the
including seismic loading and earthquake-related Kalimantan continental margin. The distribution of
shaking; (2) slope oversteepening, due to erosion, the largest MTDs in the SW of the Makassar North
carbonate build-up, faulting or diapirism; (3) load- Basin, away from historical earthquake epicentres,
ing, from water, sediments or ice – this can occur suggests that there is an additional preconditioning
over various timescales, for example short-lived mechanism in this region for the generation of large-
cyclic loading during storm events, or longer-term volume MTDs.
sea-level changes; (4) rapid accumulation and
underconsolidation that can result in elevated pore
Deltaic deposition and sediment loading. A promi-
pressures; and (5) gas hydrate disassociation (Locat
nent sedimentary feature of the Kalimantan margin
and Lee 2002). All these processes act to either
is the Mahakam Delta. With an estimated annual
reduce the shear strength of continental slope
sediment discharge of 8 × 10⁶ m3 a−1 (Roberts and
sediments, or increase the stress acting upon them
Sydow 2003), the Mahakam River provides signifi-
(Hampton et al. 1996). In addition, settings that
cant volumes of sediment to this actively prograding
result in steep seabed morphology such as fjords,
delta. Delta fronts studied elsewhere (Hampton et al.
volcanoes and carbonate build-ups are particularly
1996) are known to be vulnerable to collapse due to
susceptible to failure (Hampton et al. 1996). Here
the interplay of various factors. For example, in the
we discuss the possible drivers for slope failure in
case of the Mississippi Delta, high sedimentation
the Makassar Strait.
rates result in under-consolidated sediment accumu-
lations and frequent failure (Coleman et al. 1993).
Carbonate build-up. Carbonate slopes are capable Furthermore, these deltaic sediments are generally
of reaching gradients that far exceed that of their sil- fine grained with high organic content and gas
iciclastic counterparts (Schlager and Camber 1986). charge, which acts to reduce sediment shear strength.
This ability to reach gradients of up to 29°, combined As a result, such sediments are preconditioned for
with their capacity to form a concave-upward slope failure.Downloaded from http://sp.lyellcollection.org/ by guest on September 21, 2021
Submarine landslides in the Makassar Strait 211
Celebes Sea
Legend Frequent
Historical Tsunami Data earthquake-
induced
Wave height (up to 15 m)
Structural Features
tsunamis
Major Fault
Bathymetry MTD vol (km3)
0 5-8
8 - 12
-3000
12 - 25
Earthquake Mag.
25 - 50
2-4
50 - 75
4-5
75 - 140
5-6
140 - 210
6-8 210 - 600
Samarinda
KALIMANTAN Palu
50 km
Balikpapan
infrequent
catastrophic
submarine
landslide-induced
tsunamis
15
0k
m SULAWESI
Source of
largest Frequent
25 submarine earthquake-
0k induced
m landslides
tsunamis
100 km
Fig. 13. Risk map showing the Makassar Throughflow. MTDs colour-coded with respect to their volume. Coastlines
at risk of infrequent and catastrophic submarine landslide-induced tsunamis are indicated in red.
In the case of the Mahakam Delta, similar pro- Slope failure preconditioning by the ITF. Mapping
cesses to those on the Mississippi Delta may promote the present-day route of the MTF (Fig. 1c) shows
mass failure of the continental slope. The Makassar that this western boundary current is interacting
Strait is a major oil and gas province, and sediments with the Kalimantan margin and the Mahakam
supplied to the delta are high in organic content Delta. Detailed mapping of the delta front shows
(Saller et al. 2006) and therefore are likely to be the fine-grained prodelta (at c. 40 m water depth) is
low in shear strength. In addition, microbial con- deflected to the south due to interaction with the
sumption of organic matter and thermogenic matu- MTF (Roberts and Sydow 2003). Regional gravity
ration of kerogens is likely to result in methane and depth to basement mapping (Cloke et al. 1999;
production, which could reduce stability. Detailed Moss and Chambers 1999; Sandwell et al. 2014)
interpretation of the seismic, bathymetry and gravity demonstrate that the Mahakam depocentre has a
cores offshore the Mahakam Delta (Roberts and marked asymmetry from north to south. Oceano-
Sydow 2003) reveals that during Pleistocene low- graphic measurements show the MTF current reaches
stand conditions, delta growth occurred along the 1 m s−1 within a subsurface ‘jet’ extending down to
shelf-slope transition. This would have provided 300 m below the sea surface with a high velocity
sediment directly to the upper slope, causing over- core at 100–150 m (Mayer and Damm 2012). Cur-
steepening and sediment loading, resulting in the rents of this strength are sufficient to erode and
slope being highly susceptible to failure. This situa- transport sediments (Stow et al. 2008), as evidenced
tion explains why MTDs are distributed only along by the distribution of contourite erosional and
the western slope of the basin, unlike the eastern depositional features across the upper slope of the
margin, where there is no comparable sediment Kalimantan margin, herein named the Makassar
influx. However, this observation does not explain Contourite Depositional System (CDS) (Fig. 11).
the distribution of the largest mapped MTDs Previous authors have highlighted that contourite
clustered to the SW of the Mahakam Delta (Fig. 13). deposition is often associated with slope instabilityDownloaded from http://sp.lyellcollection.org/ by guest on September 21, 2021
212 R. E. Brackenridge et al.
along continental margins (Laberg and Camerlenghi dipping slope, of around 15°. We propose these
2008; Stow et al. 2012; Miramontes et al. 2018; regions as the main source of mass transport sedi-
Nicholson et al. 2020). Along the NW European ments to the deep basin. It is noted that the plastered
margin, the giant (c. 3500 km3) Storegga Slide is, contourite drifts identified in this study are signifi-
in part, a result of the reduced shear strength within cantly smaller than examples seen along other passive
the basal failure plane comprising clay-rich contour- continental margins (Hernández-Molina et al. 2008).
ites (Bryn et al. 2005). In the South Falkland Basin, We propose this to be a result of regular removal of
an over-steepened and basinward-dipping contourite material from the drifts during submarine
drift on the Burdwood Bank has regularly failed due landslide events.
to upper-slope deposition and lower-slope erosion The MTF is likely to have varied significantly in
within a contourite moat (Nicholson et al. 2020). response to Quaternary climatic fluctuations, which
Along the East Canadian margin, MTDs are associ- may further play a role in controlling slope instabil-
ated with shallow-water contourites (Rashid et al. ity. The resolution of the data in our study, and the
2017). A geotechnical review of these sediments lack of well control, do not allow detailed evaluation
concludes that their high fluid content, together of the timescales and the control of sea-level or cli-
with the highly cyclical nature of the sediments mate on triggering these events, but it is expected
resulting in failure surfaces throughout the succes- that climate exerts a strong control on slope stability
sion, may promote liquefaction from seismic shak- by controlling the depth, velocity and nature of the
ing (Rashid et al. 2017). In these three regions, the MTF. The evidence from previous studies, however,
cause of sediment failure is attributed to the nature is conflicting. During glacial lowstands, much of
and morphology of contourite sediments. the Paternoster Platform and the continental shelf
Thus, three key factors make contourites suscep- was exposed (Hall 2009; Roberts and Sydow
tible to mass transport failure. Firstly, the ano- 2003), and the width and cross-sectional area of
malously high sedimentation rates of contourite the Makassar Strait was considerably reduced. As a
drifts reaching 60 cm ka−1 (Howe et al. 1994) can result, the MTF may have initially been accelerated
lead to high fluid content and elevated pore pressures due to flow constriction (Hall 2009). However,
upon burial. Secondly, the fine muddy nature of con- ocean-current velocity proxies suggest that the
tourite sediments makes then likely to have low MTF was significantly reduced, or even switched
internal shear strength (Laberg and Camerlenghi off during glacial conditions (Gingele et al. 2002;
2008). Finally, their convex-upwards external mor- Holbourn et al. 2011), due to the reduced exchange
phology can locally result in high gradients on the between the Pacific and South China seas (Godfrey
continental slope making failure more likely (Stow 1996) and reduced Atlantic meridional overturning
et al. 2012; Miramontes et al. 2018). Laberg and (Hendrizan et al. 2017). Modelling of the response
Camerlenghi (2008) note that there is often an asso- of ocean currents to fluctuating sea-level in SE
ciation between gas hydrate accumulation and con- Asia is further complicated by the effect of mon-
tourite deposition due to the elevated pore space in soonal conditions on the region. Although the inter-
these rapidly deposited sediments and may be an play between sea-level-induced restriction of the
additional factor making contourites susceptible MTF and changes in velocity profile are not well
to failure. understood, it is probable that sea-level fluctuations
In the case of the Makassar CDS, the high veloc- resulting from Pleistocene glacial–interglacial
ity MTF jet correlates well with the formation of a cyclicity affected slope instability. Further work is
steep (20°) erosional scarp and relatively flat (1.5°) required to constrain variations in the timing and fre-
contourite terrace on the upper slope directly to the quency of slope failure events to reveal the drivers.
north and east of the Mahakam Delta (Fig. 11). This
is evidence for the erosion and removal of sediments
from this area, which are then transported and depos- Tsunamigenic risk
ited downslope and downcurrent. This winnowing of
sediments from the north results in enhanced sedi- MTDs of the scale and volume mapped in this
mentation on the slope to the SE of the delta, directly study in the Quaternary section of the Makassar
above the region where the largest Quaternary MTDs North Basin, by analogy with other locations,
have been mapped (Figs 12 & 13). Contourite- would be expected to generate hazardous tsunamis
plastered drifts are identified along the margin, gener- (e.g. Harbitz et al. 2006; Tappin et al. 2008, 2014;
ally directly below the base of the MTF at 300 m Parsons et al. 2014) (Table 3). Many past large vol-
water depth (Fig. 11). These regions of enhanced sed- ume landslide tsunamis, such as Storegga, are prehis-
imentation are vulnerable to failure due to high fluid toric, and are recognized and mapped from their
content, the high organic content of the Mahakam palaeo-record preserved in sediments (e.g. Dawson
Delta sediments, and their convex-upwards morphol- et al. 1988; Bondevik et al. 1997). There is no histor-
ogy which results in an oversteepened, basinward- ical evidence for tsunamis originating in theYou can also read


