MiR-379 deletion ameliorates features of diabetic kidney disease by enhancing adaptive mitophagy via FIS1 - Nature
←
→
Page content transcription
If your browser does not render page correctly, please read the page content below
ARTICLE
                  https://doi.org/10.1038/s42003-020-01516-w                OPEN

                  miR-379 deletion ameliorates features of diabetic
                  kidney disease by enhancing adaptive mitophagy
                  via FIS1
1234567890():,;

                  Mitsuo Kato 1,8 ✉, Maryam Abdollahi 1,8, Ragadeepthi Tunduguru1, Walter Tsark2, Zhuo Chen 1,
                  Xiwei Wu3, Jinhui Wang3, Zhen Bouman Chen 1,4, Feng-Mao Lin1, Linda Lanting1, Mei Wang1, Janice Huss5,
                  Patrick T Fueger 5,6, David Chan7 & Rama Natarajan 1,4 ✉

                  Diabetic kidney disease (DKD) is a major complication of diabetes. Expression of members of
                  the microRNA (miRNA) miR-379 cluster is increased in DKD. miR-379, the most upstream
                  5′-miRNA in the cluster, functions in endoplasmic reticulum (ER) stress by targeting EDEM3.
                  However, the in vivo functions of miR-379 remain unclear. We created miR-379 knockout
                  (KO) mice using CRISPR-Cas9 nickase and dual guide RNA technique and characterized their
                  phenotype in diabetes. We screened for miR-379 targets in renal mesangial cells from WT vs.
                  miR-379KO mice using AGO2-immunopreciptation and CLASH (cross-linking, ligation,
                  sequencing hybrids) and identified the redox protein thioredoxin and mitochondrial fission-1
                  protein. miR-379KO mice were protected from features of DKD as well as body weight loss
                  associated with mitochondrial dysfunction, ER- and oxidative stress. These results reveal a
                  role for miR-379 in DKD and metabolic processes via reducing adaptive mitophagy. Strate-
                  gies targeting miR-379 could offer therapeutic options for DKD.

                  1 Department  of Diabetes Complications and Metabolism, Diabetes and Metabolism Research Institute, Beckman Research Institute of City of Hope, 1500
                  East Duarte Road, Duarte, CA 91010, USA. 2 Transgenic Mouse Facility, Center for Comparative Medicine, Beckman Research Institute of City of Hope, 1500
                  East Duarte Road, Duarte, CA 91010, USA. 3 Integrative Genomics Core, Beckman Research Institute of City of Hope, 1500 East Duarte Road, Duarte, CA
                  91010, USA. 4 Irell and Manella Graduate School of Biological Sciences, Beckman Research Institute of City of Hope, 1500 East Duarte Road, Duarte, CA
                  91010, USA. 5 Department of Cellular and Molecular Endocrinology, Diabetes & Metabolism Research Institute, Beckman Research Institute of City of Hope,
                  Duarte, CA, USA. 6 Comprehensive Metabolic Phenotyping Core, Beckman Research Institute of City of Hope, 1500 East Duarte Road, Duarte, CA 91010,
                  USA. 7 Division of Biology and Biological Engineering, Caltech, 1200 East California Boulevard, Pasadena, CA 91125, USA. 8These authors contributed equally:
                  Mitsuo Kato, Maryam Abdollahi. ✉email: mkato@coh.org; RNatarajan@coh.org

                  COMMUNICATIONS BIOLOGY | (2021)4:30 | https://doi.org/10.1038/s42003-020-01516-w | www.nature.com/commsbio                                                1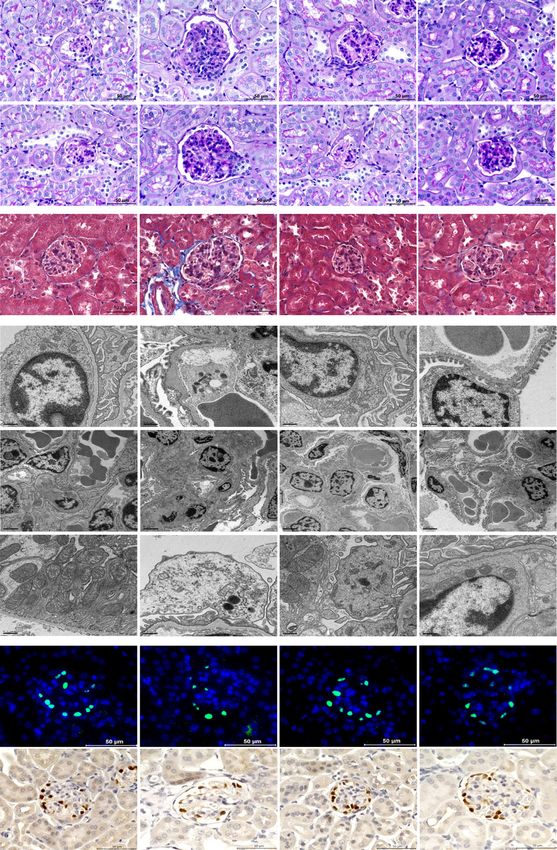
ARTICLE                                                             COMMUNICATIONS BIOLOGY | https://doi.org/10.1038/s42003-020-01516-w

B
       oth type 1 and type 2 diabetes (T1D and T2D) are                    oxidative stress, ER stress, and mitochondrial dysfunction using
       associated with significantly accelerated complications,             the unbiased AGO2-CLASH technique19 by comparing mouse
       including renal disease, known as diabetic kidney disease           glomerular mesangial cells (MMCs) isolated from wild-type (WT)
(DKD)1–5. To date, there are very few effective drugs for DKD              and miR-379KO mice. We validated the expression of these new
and affected individuals often succumb to end-stage renal disease          targets in vivo using WT and miR-379KO mice. MMC from miR-
needing dialysis or renal replacement, underscoring the urgent             379KO mice depicted protection from high-glucose (HG)-
need to explore better drug targets. Key features of DKD include           induced metabolic and mitochondrial dysfunction through
renal fibrosis and hypertrophy due to accumulation of extra-                enhanced adaptive mitophagy. Importantly, we showed that, in a
cellular matrix (ECM) proteins such as collagens and fibronectin            streptozotocin (STZ)-injected model of T1D, miR-379KO mice
in renal glomerular and tubular compartments, as well as albu-             were protected from key features of DKD, including renal dys-
minuria and podocyte dysfunction1–5. Metabolic alterations,                function, glomerular expansion, renal fibrosis, and glomerular
including mitochondrial dysfunction and oxidative stress, in most          basement membrane (GBM) thickening, compared to corre-
renal cells, including tubular epithelial, glomerular mesangial and        sponding diabetic WT mice.
podocytes, are associated with progressive DKD3,5,6.
   Non-coding RNAs such as microRNAs (miRNAs) and long-
                                                                           Results
non-coding RNAs (lncRNAs) regulate gene expression via post-
                                                                           Generation of miR-379KO mice by CRISPR-Cas9 genome
transcriptional and epigenetic mechanisms. miRNAs are short
                                                                           editing. Figure 1a shows the schematic genome structure of the
non-coding RNAs that target about 60% of the genome and alter
                                                                           mouse lncMGC region which hosts the miR-379 megacluster, in
gene expression by base-pairing with complementary “seed”
                                                                           which miR-379 is the most 5′-miRNA within the cluster and
sequences in the 3′-untranslated region (3′-UTR) of their target
                                                                           miR-882 is outside. For CRISPR-Cas9-mediated generation of
genes7. lncRNAs are longer transcripts such as messenger RNAs
                                                                           miR-379KO in mice, we designed guide RNAs as described in the
(mRNAs) but lack protein-coding (translation) potential8,9.
                                                                           “Methods.” The guide RNAs (Fig. 1b) were first verified for
miRNAs and lncRNAs regulate cellular functions and patho-
                                                                           cleavage activity in vitro using the TCMK1 mouse kidney cell line
physiological conditions associated with human disease including
                                                                           (see “Methods”). We then created miR-379KO mice by injecting
kidney dysfunction and DKD3,10. We and others have used
                                                                           fertilized eggs from C57BL/6J mice with guide RNAs and RNA
in vitro mechanistic and in vivo models to describe the functional
                                                                           encoding CRISPR-Cas9 nickase. We sequenced the PCR frag-
roles and actions of several miRNAs, e.g., miR-192, miR-21, miR-
                                                                           ments from mouse genomic DNA samples to confirm that several
93, miR-200, miR-29, as well as various lncRNAs in the patho-
                                                                           surviving mice showed the 36 bp deletion of the miR-379 region
genesis of DKD, and also evaluated the translation potential of
                                                                           (Fig. 1c). We crossed the third generation of these founder mice
targeting them as treatment options for DKD3,10–12.
                                                                           with WT C57BL/6J mice and obtained homozygous miR-379KO
   We recently established that a megacluster of miRNAs
                                                                           mice (homozygotes, −/−) by intercrossing germline-transmitted
(including miR-379 and others), along with its host lncRNA
                                                                           heterozygous mice (heterozygotes, +/−) (Fig. 1c). We confirmed
(lncMGC), is upregulated via endoplasmic reticulum (ER) stress
                                                                           significant reduction of miR-379 in glomeruli isolated from kid-
in the kidneys of diabetic mice and induces early features of DKD
                                                                           neys of miR-379KO mice compared to WT mice (Fig. 1d, P <
such as hypertrophy and fibrosis13. To inhibit lncMGC, we
                                                                           0.0001). The miR-379KO mice appeared normal and did not
designed a GapmeR (locked nucleic acid and phosphorothioate-
                                                                           depict any overt defects or abnormalities.
modified antisense oligonucleotide), which efficiently inhibited
expression of the miR-379 cluster and lncMGC, and attenuated
features of early DKD in mice13. We also showed that miR-379,              AGO2-IP-CLASH screening identifies novel targets of miR-
the first miRNA (5′-end) in the megacluster, targets and down-              379. The AGO-CLASH technique allows unbiased high-
regulates the ER degradation enhancer, mannosidase α-like 3                throughput identification of miRNA targets by ligation and
(EDEM3)13,14, in glomerular mesangial cells, suggesting it may             sequencing of miRNA-target RNA duplexes associated with
have metabolic functions in the kidney.                                    AGO2 protein, a key component of the RISC complex. We per-
   We designed the present study to delineate the in vivo func-            formed AGO2-CLASH as described19,20 (see “Methods” and
tional role of miR-379 in the kidney under diabetic conditions             Supplementary Fig. 1) using MMC isolated from WT and miR-
and the putative DKD-related functions of its targets. Transgenic          379KO mice. We also immunoprecipitated the AGO2 RISC
and genetic knockout (KO) mutant mice provide useful models                complex with anti-mouse AGO2 beads. After phosphorylation of
for studying diabetes and diabetic complications. Generation of            the RNA 5′-ends and ligation using T4 RNA ligase, we extracted
mutant mice has become much faster and more efficient with the              the ligated RNAs and subjected them to RNA-seq. To identify
CRISPR-Cas9 editing method. We therefore created miR-379KO                 bona fide targets of miR-379, we compared RNA-seq data from
mice using the CRISPR-Cas9 nickase technique15. Although                   total RNAs, AGO2-IP RNAs, and AGO2-IP-CLASH RNAs
miRNA targets are typically predicted by matching seed                     between WT and miR-379KO MMCs (Supplementary Fig. 1).
sequences and flanking sequences using in silico techniques7,16,17,         From data analyses, we found several promising candidate targets
additional targets have recently been identified more reliably by           of miR-379 (i.e., reads highly enriched at their respective 3′-UTRs
experimental methods that examine direct interaction of miRNAs             in WT cells but decreased in miR-379KO cells). One of these was
and target RNAs in living cells using a strategy that combines             Fis1, because we identified sequences at the 3′-UTR of Fis1, which
immunoprecipitation (IP) of components of the RNA-induced                  hybridized with miR-379 following AGO2-IP in WT but not in
silencing complex [RISC; e.g., argonaute (AGO) proteins], liga-            miR-379KO MMC (Fig. 2a and Supplementary Table 1). We
tion of AGO-associated RNA–RNA duplexes to form chimeric                   observed extensive sequence complementarity between miR-379
RNAs, and subsequent RNA sequencing (RNA-seq)18–20. As                     and the Fis1 3′-UTR (Fig. 2b). We also detected significant
analysis of data from such CLASH (cross-linking, ligation, and             enrichment of RNA-seq reads at the Fis1 3′-UTR following
sequencing of hybrids) method does not rely on bioinformatics              AGO2-IP in WT but not miR-379KO MMC (Fig. 2c). We con-
prediction algorithms, the miRNA targets identified in this                 firmed the absence of miR-379 following AGO2-IP in miR-
unbiased manner from AGO-IP can be further evaluated as                    379KO MMC using quantitative PCR (qPCR) (Fig. 2d) and,
therapeutic targets for various human diseases, including DKD.             conversely, we observed a significant increase in Fis1 gene
In this study, we identified new miR-379 targets related to                 expression in miR-379KO MMC compared to WT MMC

2                        COMMUNICATIONS BIOLOGY | (2021)4:30 | https://doi.org/10.1038/s42003-020-01516-w | www.nature.com/commsbio
COMMUNICATIONS BIOLOGY | https://doi.org/10.1038/s42003-020-01516-w                                                                                               ARTICLE

                  a                                                                       d
                                                                         chr12qF1                                              Glomeruli
                                                                                                                         1.5
                                                                                                                                p=0.0001

                                                                                                 miR379 RNA expression
                                         miRNA mega-cluster

                                                                                                     Fold over WT
                                         (miR-379-3072)                                                                  1.0

                                  Inc MGC
                                                        5 7 72
                      882                    37
                                                  9   49 37 30                                                           0.5
                                                                         WT
                        TSS
                                                                                                                         0.0
                                                                                                                               WT      KO
                                  Inc MGC                  7 72
                                                        5
                      882                             49 37 30
                                                                         miR-379KO
                            TSS

                  b        Sense guide RNA
                 WT    CCUGAAGAGAUGGUAGACUA
                                                                     Precursor miR-379
                 GGTTCCTGAAGAGATGGTAGACTATGGAACGTAGGCGTTATGTTTTTGACCTATGTAACATGGTCCACTAACTCTCAGTATCCAATC
                 CATCCTCG           Mature miR-379
                                                                                                                                       GAUUGAGAGUCAUAGGUUAG
                 KO                                                                                                                         Antisense guide RNA
                 GGTTCCTGAAGAGATGGTAG—36bp deletion--AACATGGTCCACTAACTCTCAGTATCCAATCCATCCTCG

                             c       M      WT 31F (+/-)              +/- -/- -/- -/- +/+ +/+ +/- +/- +/- M

                                                           WT
                                                           deletion
                                                           (36bp)

Fig. 1 Generation of miR-379 knockout (KO) mice by CRISPR-Cas9 editing. a Schematic genomic location of the miR-379 megacluster (MGC) of miRNAs
(miR-379-3072) and structure of wild-type (WT) and miR-379 knockout (KO) mice. The miR-379 MGC is located on mouse chromosome 12 within the
host lncRNA (lncMGC) and consists of ~40 miRNAs. miR-379 is the most 5′-miRNA, miR-495, miR-377, and miR-3072 are in the middle, and miR-882 is
located far upstream of cluster. b Sequences of miR-379 genomic regions WT (upper) and KO (lower, 36 bp deletion). Positions of guide RNAs used for
editing by CRISPR-Cas9 approach are shown by arrows. Sequences of mature miR-379 are represented in blue and the precursor miR-379 in pink. PAM
sequences (NGG) are underlined. c Left, genotypes of WT and a founder (31F) mouse from tail DNA samples. The founder [31F (+/−), left panel] shows a
36 bp shorter PCR fragment (i.e., deletion of miR-379). Lane M: molecular weight markers. Right, germline transmission of miR-379 deletion. The female
founder heterozygote (31F+/−) was crossed with a WT male and the deletion was transmitted to the next generation; multiple heterozygotes (+/−), WT,
and/or miR-379 deletion are shown. Homozygotes (−/−, miR-379 deletion) were obtained by crossing heterozygous mice. The miR-379KO mouse colony
was expanded by crossing the homozygous mice. d Significant decrease of glomerular miR-379 RNA expression in miR-379KO mice compared to WT mice
(n = 5–6/group). Statistical analyses for two groups were performed by Student’s t-test. Data are presented as mean ± SEM.

(Fig. 2e), suggesting Fis1 is a bona fide target of miR-379. This                     differentially expressed genes between WT and miR-379KO
was of interest, because FIS1 is a key mitochondrial protein21,22.                   MMC (Supplementary Fig. 3a, b). These data suggest that the
We next performed luciferase reporter assays using a psiCheck2                       targets of miR-379 are involved in processes related to
vector in which we cloned the 3′-UTR of Fis1, which demon-                           mitochondrial and renal function.
strated that Fis1 3′-UTR luciferase activity was significantly                           We further validated Txn1, because it encodes a redox protein,
decreased in MMCs treated with miR-379 mimic oligonucleotides                        thioredoxin, and we also detected significant enrichment of RNA-
(oligos) compared to negative control (NC) oligos in WT MMC                          seq reads at the Txn1 3′-UTR following AGO2-IP in WT but not
(Fig. 2f). This decrease was not observed in cells transfected with                  miR-379KO MMC (Fig. 2g). We again performed luciferase
the Fis1 3′-UTR vector harboring a mutation in the miR-379                           reporter assays using a psiCheck2 vector harboring the Txn1 3′-
binding site, further confirming Fis1 to be a target of miR-379                       UTR, which showed that Txn1 3′-UTR luciferase activity was
(Fig. 2f).                                                                           significantly decreased by miR-379 mimic oligos compared to NC
   From comparisons of AGO2-IP RNAs, besides Fis1 (Fig. 2c)                          in WT MMC. In contrast, we detected no change in cells
encoding the mitochondrial fission protein FIS122–24, we also                         transfected with a miR-379-binding site mutant Txn1 3′-UTR
examined other candidate targets of miR-379 with putative                            reporter luciferase vector, further confirming that Txn1 is a real
functions related to kidney disease. We confirmed Edem3 as a                          target of miR-379 (Fig. 2h). We also further validated the RNA-
target, which we previously identified13, and also identified                          seq data from AGO2-IP RNAs by performing qPCR validations,
interesting new candidate miR-379 target genes, including those                      which confirmed the significant decrease in enrichments of
encoding the redox protein Txn1 (Fig. 2g), the growth factor                         Edem3, Fis1, Txn1, Clta, Vegfβ, Ap3s1, and Hnrnpc, but not
Vegfb, the transporter protein Slc20a1, the RNA-binding protein                      Slc20a1 or NCs, in AGO2-IP from miR-379KO MMC compared
Hnrnpc, the clathrin protein Clta, and the adapter protein Ap3s1                     to WT (Fig. 2i), verifying they are valid targets of miR-379.
(Supplementary Fig. 2a–e and Supplementary Table 2a, b).                             Among these, EDEM3 has a key role in regulating ER stress14,
   Interestingly, Ingenuity pathway analyses (IPAs) of the RNA-                      FIS1 functions in mitochondrial fission and quality control,
seq data revealed pathways related to mitochondrial function                         including mitophagy22,25, and TXN1 has several roles, including
(mitochondrial depolarization, transition, and permeability of                       antioxidant functions, all factors related to DKD26. Therefore,
mitochondria), as well as renal injury (renal ischemia, acute renal                  increased ER stress, mitochondrial dysfunction, and oxidative
failure, glomerular injury, hypertrophy) were enriched in the                        stress resulting from miR-379-mediated inhibition of its target

COMMUNICATIONS BIOLOGY | (2021)4:30 | https://doi.org/10.1038/s42003-020-01516-w | www.nature.com/commsbio                                                              3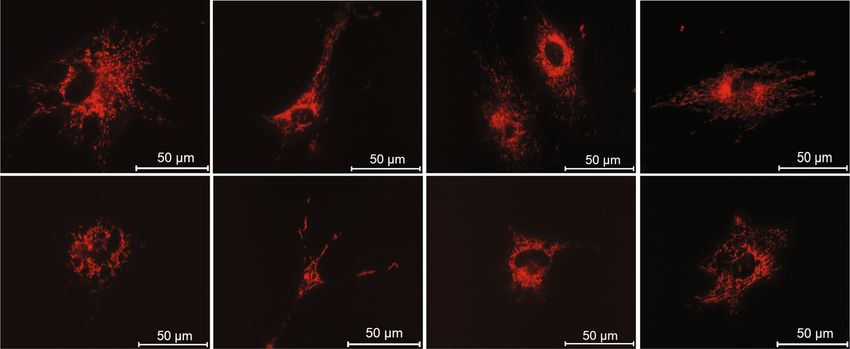
ARTICLE COMMUNICATIONS BIOLOGY | https://doi.org/10.1038/s42003-020-01516-w
a mmu-miR-379-5p b
5`- AACTTCATTAGAGACTGGTAGACTATGGAACGTAGGGTAAGGAGTGCTCCTGCCCTCTAGTG miRNA (mmu-miR-379)
GCTAGAGTTTAGGGTTGCAGTCTCTCCTGCACCCCTGTAGTCTACCT- 3 ` 3’ggaugcaaGGUAUCAGAUGGu 5‘
Fis1 mRNA site : II I II II I I
5’cugcacccCUGUAGUCUACCu 3’
mRNA (Fis1)
c d MMC e 2.5 MMC
2.0 p=0.012
WT-A-IP p=0.0131
Enrichment of miR379
Fis1 gene expression
2.0
1.5
Fold over WT
WT-B-IP
in Ago2IP
1.5
379KO-A-IP 1.0
1.0
379KO-B-IP
0.5
0.5
Refseq
genes
0.0 0.0
miR-379 target site in Fis1 WT miR-379KO WT miR-379KO
f g
SV40P luciferase Fis1 3’ UTR
p=0.0004
1.5 WT-A-IP
Normalized luc activity
WT-B-IP
1.0
Fis1 3UTR
379KO-A-IP
0.5 379KO-B-IP
Refseq
genes
0.0
NC miR-379 NC miR-379 miR-379 target site in Txn1
WT Mutant
h i
SV40P luciferase Txn1 3’ UTR
2.0 WT miR-379KO
2.0
Normalized luc activity
p=0.0015 * *
Normalized RNA
1.5 * *
**
in Ago2IP
1.5 ** *
Txn1 3UTR
1.0
1.0
0.5
0.5 0.0
3 1 1 a b c e
em Fis Txn Clt Vegf p3s1 lc20aHnrp ab14Snrp cea1 mgb1
Ed A S R T H
0.0
NC miR-379NC miR-379 miR379 Targets Negative controls
WT Mutant
Fig. 2 Identification of miR-379 targets. a Example of hybrid sequence of miR-379 in pink and Fis1 in blue. b Alignment of miR-379 and its target site in the
Fis1 3′-UTR (miRanda; microRNA.org). c Enrichment of AGO2 IP-seq RNA reads at miR-379 target site in Fis1 3′-UTR in WT mouse mesangial cells
(MMC), with notable reduction in miR-379KO MMC. Two independent samples (A and B) from WT MMC (WT-A-IP and WT-B-IP) and miR-379KO
MMC (379KO-A-IP and, 379KO-B-IP) were examined. d Enrichment of miR-379 RNA in AGO-IP in MMC isolated from kidney glomeruli of WT mice and
significant reduction in miR-379KO MMC (n = 3/group). e Significant increase of Fis1 gene expression in miR-379KO MMC compared to WT MMC,
suggesting Fis1 is a target of miR-379 (n = 6/group). f Significant decrease of WT Fis1 3′-UTR luciferase reporter activity by transfection with miR-379
mimic oligonucleotide, compared to mutant Fis1 3′-UTR reporter under similar conditions, further supporting Fis1 3′-UTR to a true target of miR-379.
g Enrichment of AGO2 IP-seq RNA reads at the 3′-UTR of Txn1 gene in WT MMC and its significant reduction in miR-379KO MMC. Two independent
samples (A and B) from WT MMC (WT-A-IP and WT-B-IP) and miR-379KO MMC (379KO-A-IP and 379KO-B-IP) were examined. h Significant decrease
of WT Txn1 3′-UTR luciferase reporter activity induced by miR-379 mimics, compared with no change in mutant Txn1 3′-UTR reporter by miR-379 mimics.
NC, negative control mimic; miR-379, miR-379 mimic. i RT-qPCR validation of the expression of enriched candidate genes identified by AGO2 IP-seq. RNA
expression of all eight candidate miR-379 targets tested was decreased in AGO2-IP from miR-379KO MMC compared to WT MMC. Rab14, Snrpe, Tcea1,
and Hmgb1 were used as negative controls because their enrichments in AGO2 IP-seq were not significantly changed between miR-379KO and WT MMC.
Each dot indicates one biological repeat. Statistical analyses for two groups were performed by Student’s t-test, and for multiple comparisons one-way
ANOVA with Tukey’s post hoc test was used. *P < 0.05, **P < 0.01. All data are presented as mean ± SEM.
4 COMMUNICATIONS BIOLOGY | (2021)4:30 | https://doi.org/10.1038/s42003-020-01516-w | www.nature.com/commsbio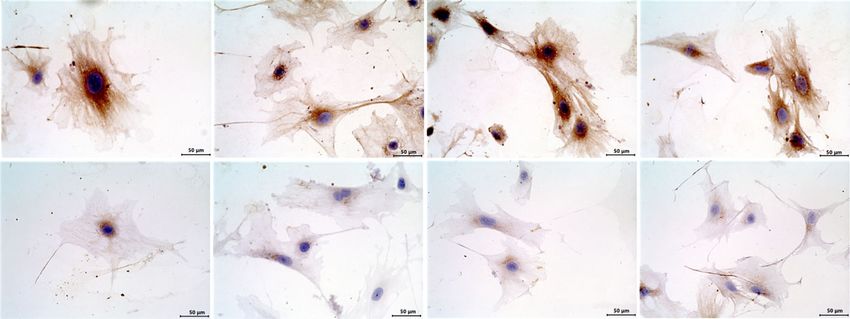
COMMUNICATIONS BIOLOGY | https://doi.org/10.1038/s42003-020-01516-w ARTICLE
genes Edem3, Fis1, and Txn1, respectively, may significantly whether a loss of FIS1 (by HG or Fis1 siRNA treatment) affects
contribute to DKD. mitochondrial quality and health. We transfected WT MMC with
siRNA-targeting Fis1 (si-Fis1) and verified reduction in FIS1
protein levels by immunohistochemical (IHC) staining relative to
miR-379KO MMC are protected from HG-induced mito- NC siRNA (Fig. 3c). Significant reduction of FIS1 by the Fis1
chondrial dysfunction. As we identified the mitochondrial pro- siRNA was observed in both WT and miR-379KO MMC (Fig. 3c,
tein FIS1 as a miR-379 target, we compared mitochondrial d, si-Fis1). We found that FIS1 expression was also significantly
function between WT and miR-379KO MMC using a Seahorse decreased in WT MMC treated with HG (Fig. 3c, d, WT MMC),
XF Cell Mito Stress test. In WT MMC treated with HG (25 mM), further supporting Fis1 as a target of miR-379 and this is in line
we observed a significant decrease in oxygen consumption rate with our earlier data showing miR-379 is upregulated by HG13. On
(OCR) at basal respiration, ATP production rate, and maximal the other hand, no significant decrease of FIS1 was detected in
respiration compared to WT MMC treated with normal glucose miR-379KO MMC treated with HG (miR-379KO HG-NC), as
(NG; 5.5 mM) (Fig. 3a, b). Interestingly, miR-379KO MMCs were compared to WT MMC HG-NC vs. the respective NG-treated cells
significantly protected from this HG-induced decrease of mito- (Fig. 3c, d). These results are consistent with the Seahorse results
chondrial function. showing that mitochondrial activity is maintained at higher levels
As we previously showed miR-379 is upregulated by HG in in miR-379KO MMC even under HG conditions (Fig. 3a, b).
MMC13, we next tested whether HG treatment reduces levels of To strengthen the results in Fig. 3a, b demonstrating the effects
the miR-379 target, namely the mitochondrial protein FIS1 and miR-379-mediated loss of FIS1 on mitochondrial function, we
****
a b
150 **** ****
Maximal WT-NG
OCR (pmol/min/20000)
250
respiration WT-HG
OCR (pmol/min/20000)
200 miR-379KO-NG **** WT-NG
100 WT-HG
Basal miR-379KO-HG
150 respiration miR-379KO-NG
ATP miR-379KO-HG
100 production 50
50
0 0
Basal SRC
0 20 40 60 80
Time (min)
WT-MMC miR-379KO-MMC
c NG HG NG HG
NCsi-Fis1
d
2.0
****
FIS1 positive area
**
fold over NC
1.5 ****
****
1.0
0.5
0.0
is 1
is 1
is 1
is 1
si C
si C
si C
si C
N
N
N
N
-F
-F
-F
-F
NG HG NG HG
WT-MMC miR-379KO-MMC
Fig. 3 Mitochondrial function assays in MMC under normal and high-glucose conditions. a Seahorse XF Cell Mito Stress test for mitochondrial function
at basal conditions, ATP production, and maximal respiration levels using MMC from WT or miR-379KO mice cultured with normal glucose (NG, 5.5 mM)
or high glucose (HG, 25 mM) for 72 h. b Oxygen consumption rates (OCRs) were calculated in basal and spare respiratory capacity (SRC) levels in NG and
HG condition (20,000 cells per well of 96-well assay plate). c Representative images of IHC staining to detect FIS1 expression (brown color) in negative
control (NC) and Fis1 siRNA (si-Fis1)-transfected MMC from WT or miR-379KO mice cultured with NG or HG. d Bar graph quantifications showing
significant reduction in FIS1 levels in si-Fis1-transfected NG- or HG-treated WT and miR-379KO MMC compared to NC, and significant decrease in FIS1
levels in HG-treated WT MMC but not miR-379KO MMC (n = 15 cells/group). The in vitro experiments were performed with at least three biological
replicates. One-way ANOVA with Tukey’s post hoc test for multiple comparisons. **P < 0.01, ****P < 0.0001. All data are presented as mean ± SEM. NC,
negative control siRNA. si-Fis1, Fis1 siRNA.
COMMUNICATIONS BIOLOGY | (2021)4:30 | https://doi.org/10.1038/s42003-020-01516-w | www.nature.com/commsbio 5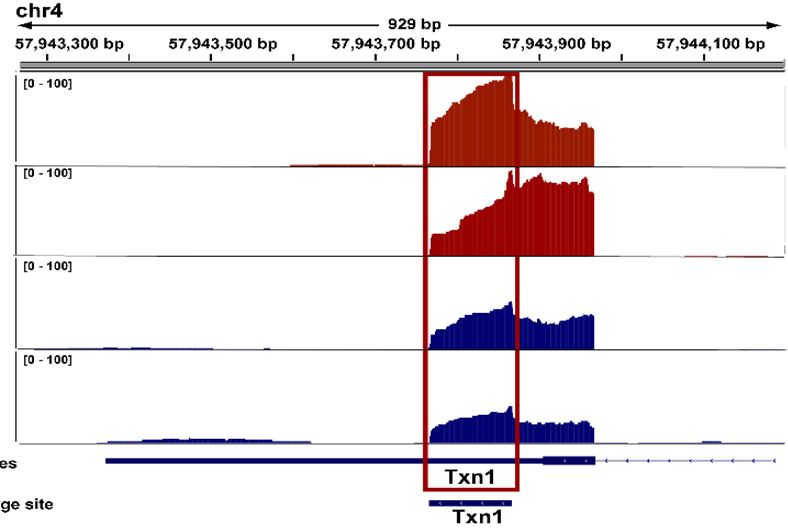
ARTICLE COMMUNICATIONS BIOLOGY | https://doi.org/10.1038/s42003-020-01516-w
WT-MMC miR-379KO-MMC
a NG HG NG HG
NC
si-Fis1
b WT-MMC miR-379KO-MMC
NG HG NG HG
NC
si-Fis1
c d
250 60
*
*
200 *
*
(Integrated Density)
Cell fluorescence
40 ** ****
150
% of cells
**** **** * ****
100
20
50
0 0
1
1
1
1
C
C
C
C
1
1
1
1
C
C
C
C
is
is
is
is
is
is
is
is
N
N
N
N
N
N
N
N
-F
-F
-F
-F
-F
-F
-F
-F
si
si
si
si
si
si
si
si
NG HG NG HG NG HG NG HG
WT-MMC miR-379KO-MMC WT-MMC miR-379KO-MMC
transfected WT and miR-379KO MMC with the DsRed2-Mito-7 further support the notion that miR-379-mediated loss of Fis1
plasmid, which fluorescently labels mitochondria with red promotes mitochondrial dysfunction.
emission spectra (Fig. 4a and quantification in Fig. 4c). The Increasing evidence shows that, although FIS1 is a mitochon-
MMC were also transfected with a NC siRNA or si-Fis1. Under drial fission protein, FIS1 can promote adaptive mitophagy to
HG conditions, mitochondrial signal intensity was significantly clear damaged mitochondria and is thus important for preserving
reduced compared to NG conditions in both WT-MMC and mitochondrial function and health23,24,27. As miR-379 deficiency
miR-379KO MMC. However, the degree of reduction of improved mitochondrial function in MMC and, conversely,
mitochondrial signal intensity was much lesser in miR-379KO siRNA-induced reduction of its mitophagy-related target Fis1
MMC (Fig. 4a, NC, upper panel, and Fig. 4c). Moreover, although appeared to worsen mitochondrial function, we next examined
Fis1 siRNA reduced mitochondrial signal intensity significantly in whether MMC from miR-379KO mice display better mitochon-
WT MMC in NG and HG, Fis1 siRNA elicited more significant drial quality and health through adaptive mitophagy under
changes in miR-379KO MMC in HG than in NG (Fig. 4a, si-Fis1 diabetic conditions, compared to WT. Tandem fluorescent-tagged
lower panel, and Fig. 4c). These results demonstrate that a inner mitochondrial membrane protein COX8 (Cox8-GFP-
combination of HG and si-Fis1 promotes more mitochondrial mCherry) reporter monitors mitophagy-based on different pH
dysfunction in miR-379KO MMC, unlike in WT MMC, and stability of green fluorescent protein (GFP) and mCherry
6 COMMUNICATIONS BIOLOGY | (2021)4:30 | https://doi.org/10.1038/s42003-020-01516-w | www.nature.com/commsbio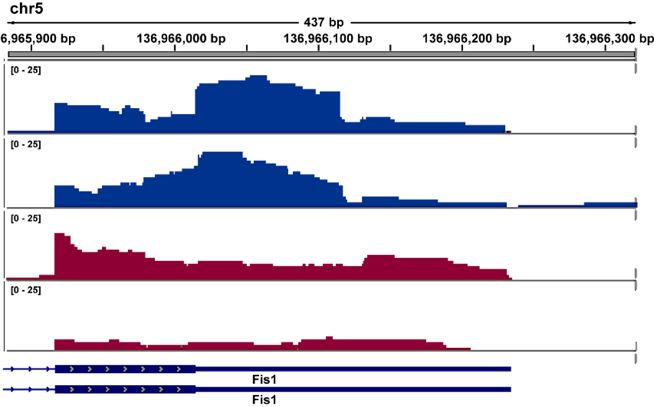
COMMUNICATIONS BIOLOGY | https://doi.org/10.1038/s42003-020-01516-w                                                                     ARTICLE

Fig. 4 Mitochondrial dysfunction and mitophagy assays in MMC under normal and high-glucose conditions. a Representative images of WT and miR-
379KO MMC transfected with the DsRed2-Mito-7 plasmid, which fluorescently labels mitochondria with red emission spectra (quantification in c). WT
and miR-379KO MMC treated with NC siRNA or Fis1 siRNA were transfected with DsRed2-Mito-7 reporter. Upper panel (with NC siRNA): in HG
conditions (25 mM glucose), mitochondrial signal intensity (red fluorescence) was significantly reduced compared to NG (5.5 mM glucose) conditions in
both WT and miR-379KO MMC, but to a lesser extent in miR-379KO MMC. Lower panel: with si-Fis1: WT-MMC cells treated with si-Fis1 show decreased
intensity in mitochondrial fluorescent signals in NG and HG conditions. miR-379KO MMC with si-Fis1 under HG conditions depicted more significant
changes than under NG conditions. The degree of reduction of fluorescence (mitochondrial quality) under HG conditions was much lower in miR-379KO
MMC compared to WT MMC. b Representative images showing adaptive mitophagy in MMC examined by expressing the pCLBW-cox8-EGFP-mCherry
reporter (quantification in d). WT and miR-379KO MMC MMC treated with NC siRNA or Fis1 siRNA were transfected with pCLBW-cox8-EGFP-mCherry
and then treated with HG (25 mM) or NG (5.5 mM) for 5 days at 37 °C and 5% CO2. Upper panels (with NC siRNA): adaptive mitophagy shows marked
decrease in WT-MMC after 5 days of HG treatment (decrease in red mCherry fluorescence) but not in NG; lower panels (with si-Fis1): Fis1 siRNA
significantly reduced mitophagy in WT MMC in NG and HG conditions, but no significant changes were detected in miR-379KO MMC even under HG
conditions. Adaptive mitophagy was significantly reduced only in miR-379KO MMC treated with Fis1 siRNA in HG conditions relative to NC under NG
conditions. c Bar graph quantification of DsRed2-Mito-7 staining data (shown in a) based on analysis of integrated density (n = 6 cells/group). d Bar graph
of quantitative analysis of the number of red-only puncta per cell from data in b (n = 3–8 cells/group). These in vitro experiments in MMC were performed
with at least three biological replicates. One-way ANOVA with Tukey’s post hoc tests for multiple comparisons in panels c and d. *P < 0.05, **P < 0.01,
****P < 0.0001. All data are presented as mean ± SEM. NC, negative control siRNA. si-Fis1, Fis1 siRNA. Scale bar, 50 µm.

fluorescent proteins23,27. Under steady normal states, cells depict             compared to nondiabetic WT mice, but these differences were
yellow signals in mitochondrial regions, i.e., red (mCherry) plus              not observed in diabetic miR-379KO mice vs. corresponding
green (GFP) fluorescence. Under conditions triggering mito-                     nondiabetic miR-379KO mice.
phagy, mitochondria are delivered to acidic lysosomes (adaptive                   Taken together, these results indicate that autophagy and
mitophagy) where GFP signal is reduced due to its sensitivity to               related adaptive mitophagy are decreased in MMC from diabetic
the acidic environment, but mCherry fluorescence remains stable.                WT mice relative to diabetic miR-379KO mice. Increased miR-
To monitor the role of Fis1 in adaptive mitophagy (to clear                    379 under diabetic conditions may promote mitochondrial
damaged mitochondria), WT and miR-379KO MMC that were                          dysfunction, at least in part by the reduction of its newly
again transfected with either a NC siRNA or Fis1 siRNA were                    identified target Fis1.
transfected with the pCLBW-Cox8-EGFP-mCherry (reporter for
mitophagy) and treated with HG (25 mM) or NG (5.5 mM) for
5 days and monitored on day 5. Upper panel in Fig. 4b (NC) and                 miR-379KO mice are protected from diabetes-induced weight
bar graph quantification in Fig. 4d show that, relative to NG                   loss. To next characterize the in vivo role of miR-379 in diabetes,
conditions, adaptive mitophagy (red fluorescence) was signifi-                   we used STZ injections to induce insulin-dependent diabetes in
cantly decreased in WT-MMC after 5 days of HG treatment.                       male WT and miR-379KO mice according to protocols of the
However, no significant decrease of mitophagy was detected in                   NIDDK DiaComp consortium28 (Supplementary Fig. 5), and
the miR-379KO MMC treated with HG vs. NG (Fig. 4b, NC,                         then measured various metabolic parameters of diabetes at 1, 6,
upper panel, and quantification in Fig. 4d). The lower panel of                 and 24 weeks after diabetes onset (Fig. 5). Male mice were used
Fig. 4b (si-Fis1) and quantification in Fig. 4d show that, although             because female mice do not consistently develop diabetes with the
Fis1 siRNA significantly reduced mitophagy in WT MMC in both                    multiple low dose STZ injection protocol used29,30. Blood glucose
NG and HG (vs. corresponding NC siRNA), no significant                          levels were monitored and measured at regular intervals (Sup-
changes were detected in miR-379KO MMC with si-Fis1 vs. NC                     plementary Fig. 5b) and mice were killed at 1, 6, or 24 weeks post
siRNA (maintaining high levels of mitophagy). Thus, mitophagy                  diabetes. There was no significant difference in the incidence of
was significantly reduced in WT MMC under HG conditions vs.                     diabetes between WT and miR-379KO mice. Non-fasting blood
NG with or without Fis1 siRNA. On the other hand, adaptive                     glucose levels were significantly higher at individual time points
mitophagy was reduced only in miR-379KO MMC treated with                       in both WT and miR-379KO diabetic mice compared to their
Fis1 siRNA in HG conditions but not in NG conditions,                          respective nondiabetic controls (Fig. 5a). The average body weight
demonstrating that only a combination of Fis1 siRNA and HG                     over the period of 24 weeks of diabetes was significantly lower in
reduces adaptive mitophagy in miR-379KO MMC (Fig. 4b, d).                      WT-STZ mice compared to WT nondiabetic controls (Fig. 5b).
Thus, miR-379KO MMC are more resistant to HG treatment                         On the other hand, despite persistent hyperglycemia, body weight
than WT MMC and maintain good quality of mitochondria.                         loss observed in the WT-STZ mice was significantly ameliorated
Together, these results suggest that adaptive mitophagy is                     in miR-379KO-STZ mice, their weights being significantly higher
regulated through Fis1 targeted by miR-379 in MMC, and that                    compared to WT-STZ mice at 1, 6, and 24 weeks (Fig. 5b). We
reduction of adaptive mitophagy due to increased miR-379 in                    performed body composition analysis, which showed that both
diabetes leads to reduced mitochondrial quality and contributes                total body fat and lean mass were significantly reduced over time
to mitochondrial dysfunction.                                                  in WT-STZ mice compared to nondiabetic controls; in contrast,
   In addition to these parameters of mitophagy and mitochon-                  miR-379KO-STZ mice did not display significant reduction in
drial quality/function, we also measured some parameters of                    body fat and lean mass (Fig. 5c, d). This protection from diabetes-
autophagy, which is associated with mitophagy. We measured                     induced loss of muscle mass in the miR-379KO-STZ mice sug-
protein expression of ATG5 and P62 (autophagy-related                          gests a key role of miR-379 also in diabetes-induced muscle
proteins) in mouse kidney glomeruli using IHC staining                         atrophy.
(Supplementary Fig. 4). ATG5 levels were significantly lower in                    We next measured metabolic parameters (food, water intake,
glomeruli from diabetic WT mice compared to nondiabetic WT                     and movement) and found that they were not significantly
mice, whereas no significant changes were observed in miR-                      different between WT and miR-379KO mice (Supplementary
379KO mice (diabetic vs. nondiabetic). P62 levels were                         Fig. 6a–c), suggesting that weight loss in WT-STZ mice may not
significantly higher in glomeruli from diabetic WT mice                         be because of any altered behavior (eating, drinking, or moving).

COMMUNICATIONS BIOLOGY | (2021)4:30 | https://doi.org/10.1038/s42003-020-01516-w | www.nature.com/commsbio                                              7
ARTICLE COMMUNICATIONS BIOLOGY | https://doi.org/10.1038/s42003-020-01516-w
a **** **** b c **
800 40 4
** *
**** **** 35 * *** **
3
Total body fat (g)
Body weight (g)
600
**** ***
BGL (mg/dl)
30
400 **** 2
25
200 1
20
0 15 0
1 6 24 1 6 24 1 6
Weeks of diabetes Weeks of diabets Weeks of diabetes
d ** e f
* 200 250
30 **** ****
****
Total lean mass (g)
**** 200
Albumin (μg/ml/day)
28 150
ACR (μg/mg)
150
26 100
**
100
24 50
50
22 0 0
Con STZ Con STZ Con STZ Con STZ Con STZ Con STZ
WT miR-379KO WT miR-379KO WT miR-379KO
WT-Con WT-STZ miR-379KO-Con miR-379KO-STZ
Fig. 5 Physiological parameters of diabetic and nondiabetic mice. a Diabetes was induced in WT and miR-379KO mice by STZ injections as described in
the “Methods.” Non-fasting blood glucose levels (BGL) in WT and miR-379KO mice at indicated time periods during 24 weeks after diabetes onset
compared to control (Con) (n = 5/group). b–d, Body weights and body composition analysis using Echo/MRI system. b Body weight (n = 8/group, n =
6–9/group, and n = 5–6/group for 1, 6, and 24 weeks post diabetes onset, respectively). c Total body fat (n = 8 and n = 4 for 1 and 6 weeks of diabetes,
respectively). d Total lean mass (n = 4 for 6 weeks of diabetes). e, f Kidney function (urine albumin excretion) was examined using ELISA in 24 h urine
collections after 24 weeks of diabetes. e Urine albumin level (n = 4–5/group). f Albumin/creatinine ratio (ACR) (n = 4–5/group). Each dot indicates the
value from each mouse. One-way ANOVA with post hoc Tukey’s test for multiple comparisons. *P < 0.05, **P < 0.01, ***P < 0.001, ****P < 0.0001. All data
are presented as mean ± SEM.
There were also no significant differences in oxygen consumption significantly attenuated in miR-379KO-STZ mice (Fig. 5e).
(VO2) or CO2 production (VCO2) (Supplementary Fig. 6d, e). We Consistent with this, at 24 weeks, ACR was ~8-fold higher in
measured respiratory exchange rates (RERs) to determine the fuel WT-STZ mice than in nondiabetic controls and this increase was
source in all the four groups of mice, which indicated that fat is significantly attenuated in miR-379KO-STZ mice compared to
the pre-dominant fuel source in both diabetic WT and miR- WT-STZ mice (Fig. 5f).
379KO mice, as they had lower RER compared to their
nondiabetic controls (Supplementary Fig. 6f). However, there miR-379KO mice are protected from diabetes-induced glo-
were no differences between WT and KO mice. Altogether, these merular hypertrophy and ECM accumulation. Glomerular
data suggest that miR-379 may contribute to metabolic lesions and early glomerular hypertrophy are among the most
abnormalities, because miR-379KO mice were protected from significant alterations in both early and late stages of DKD. As
body weight loss and muscle atrophy in diabetes. miR-379KO mice were protected from diabetes-induced albu-
minuria, to further define the relationship to renal histology, we
miR-379KO mice are protected from diabetes-associated prepared kidney cortical sections from STZ-injected and control-
albuminuria. As the targets of miR-379 have potential reno- vehicle injected WT and miR-379KO mice. We used Periodic
protective properties, we next examined whether miR-379KO Acid–Schiff (PAS) staining to detect ECM accumulation and
mice exhibit renal protection in diabetes. To examine the effects Masson’s Trichrome staining to assess kidney fibrosis. WT-STZ
of miR-379 loss on kidney function, we measured albumin and mice showed significant increase in mesangial matrix expansion
creatinine levels in 24 h urine samples collected from control and compared to nondiabetic controls at 6 and 24 weeks of diabetes
STZ-injected diabetic WT and miR-379KO mice at 6 and onset (Fig. 6a, b). Moderate glomerular tuft and tubulointerstitial
24 weeks after diabetes onset. Increased albumin excretion is fibrosis were observed in WT-STZ mice after 24 weeks of diabetes
widely considered to reflect underlying glomerular dysfunction in onset (Fig. 6c). Notably, all these increases related to DKD were
diabetic mice; measures of the albumin/creatinine ratio (ACR) ameliorated in miR-379KO-STZ mice (Fig. 6a–c). These results
control for variations in urine flow. At 6 weeks post diabetes show that diabetic miR-379KO-STZ mice experience reduced
induction, there were no differences in albuminuria or creatinine severity in key features of early DKD, suggesting miR-379KO
levels among any groups of mice, as expected in this C57BL6 mice are protected from DKD.
mouse model. However, at 24 weeks post diabetes induction,
average urine albumin levels were significantly increased in WT- miR-379KO mice are protected from diabetes-associated GBM
STZ mice compared to nondiabetic controls and this was thickening and podocyte foot process effacement. We next used
8 COMMUNICATIONS BIOLOGY | (2021)4:30 | https://doi.org/10.1038/s42003-020-01516-w | www.nature.com/commsbioCOMMUNICATIONS BIOLOGY | https://doi.org/10.1038/s42003-020-01516-w ARTICLE
WT miR-379KO
a Control STZ Control
b **
Glomerular PAS positive area
2.0 **** ****
****
6WKS
**
Fold over WT-Con
1.5
1.0
24WKS
0.5
0.0
6 24
Weeks of diabetes
c e 2.5 **
24WKS
****
2.0
Fold over WT-Con
GBM thickness
**
1.5
d 1.0
24WKS
0.5
0.0
Con STZ Con STZ
h WT miR-379KO
2.5
f
Mitochondrial area
Fold over WT-Con
*
24WKS
2.0
1.5
1.0
g
0.5
24WKS
0.0
WT STZ Con STZ
WT miR379KO
i j 20 ***
***
P57 expressing podocytes
24WKS
per glomerulus 15
10
k
5
24WKS
0
Con STZ Con STZ
WT miR-379KO
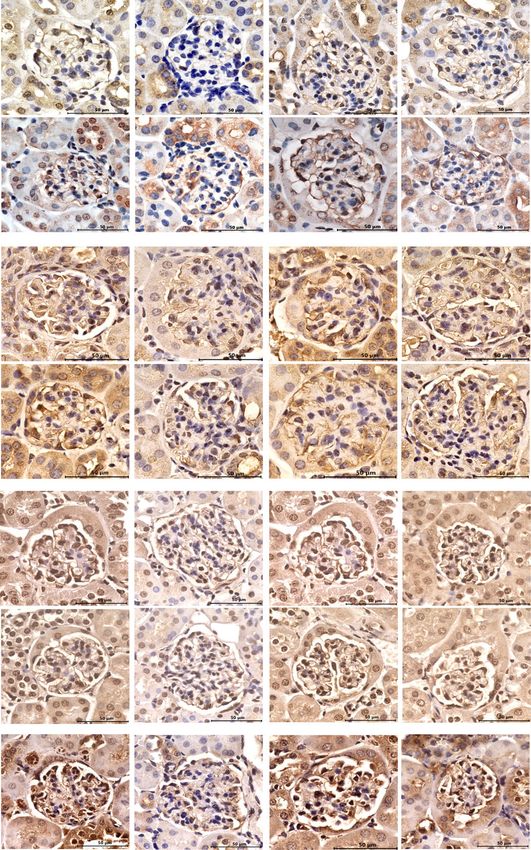
Fig. 6 Histological evaluation of kidney cortex samples from WT and miR-379KO mice (control and diabetic). a PAS (Periodic acid–Schiff stain) staining
in control mice and diabetic mice at 6 and 24 weeks after diabetes onset. Representative images show glomerular mesangial area and extracellular matrix
(ECM) accumulation. b Quantitative analysis of PAS-positive glomerular areas at 6 and 24 weeks post diabetes induction (n = 30 glomeruli/group).
c Masson’s trichrome staining to detect fibrosis in WT and miR-379KO mice 24 weeks after diabetes onset. Representative images show fibrosis (blue
color) in WT-STZ mice that is reduced in miR-379KO mice. Scale bar, 50 µm. d Representative images of the glomerular basement membrane (GBM) and
podocyte structure using transmission electron microscopy (TEM). Representative TEM images show GBM thickness (Red arrow) and podocyte foot
process effacement in WT-STZ mice, whereas these were not observed in miR-379KO-STZ mice (intact podocyte foot processes, blue arrow). Scale bar,
2 µm. e Quantitative analysis of GBM (n = 64–100 measurements/group). f Excessive mesangial expansion (white arrows) in WT-STZ mice at 24 weeks
after diabetes onset. Scale bar, 0.5 µm. g Representative transmission electron micrographs of mitochondrial structure at 24 weeks after diabetes onset.
Regular internal structure and elongated mitochondria (blue arrow), mitochondrial disrupted cristae (red arrow). h Quantitative analysis of mitochondrial
area in each condition (n = 40 measurement/group). Scale bar, 0.5 µm. Results are expressed as fold over WT-Con. i Representative images show
immunofluorescence staining to detect glomerular p57-positive podocytes (green) and nucleus (blue) at 24 weeks after diabetes onset. Scale bar, 50 µm.
j Quantitative analysis of p57-positive podocytes at 24 weeks after diabetes onset (n = 30 glomeruli/group). Results are expressed as fold over WT-Con.
k IHC staining for p57-positive podocytes (brown). Scale bar, 50 µm. One-way ANOVA with post hoc Tukey’s test for multiple comparisons. *P < 0.05,
**P < 0.01, ***P < 0.001, ****P < 0.0001. All data are presented as mean ± SEM.
transmission electron microscopy (TEM) to examine glomerular also exhibited normal glomerular structures that were like WT
structure in STZ- and control-treated WT and miR-379KO mice control mice. However, the GBM thickening and podocyte foot
at 24 weeks after diabetes onset. Nondiabetic WT controls process effacement observed in WT-STZ mice were abrogated in
showed uniformly thin GBMs and normal structures of podo- miR-379KO-STZ mice (Fig. 6d). Quantitative analysis confirmed
cytes, and their foot processes; in contrast, WT-STZ mice that the GBM was significantly thinner in miR-379KO-STZ mice
exhibited thickening of the GBM and podocyte foot process than in WT-STZ mice (Fig. 6e). Furthermore, WT-STZ mice
effacement as expected (Fig. 6d). Nondiabetic miR-379KO mice developed excessive mesangial expansion with electron-dense
COMMUNICATIONS BIOLOGY | (2021)4:30 | https://doi.org/10.1038/s42003-020-01516-w | www.nature.com/commsbio 9ARTICLE COMMUNICATIONS BIOLOGY | https://doi.org/10.1038/s42003-020-01516-w
deposits, which was attenuated in miR-379KO-STZ mice at Diabetes-induced reduction in the expression of miR-379 tar-
24 weeks after diabetes onset (Fig. 6f). Our TEM examination also get genes is restored in miR-379KO mice. To determine putative
showed the presence of abnormal mitochondrial structures and connections between the key identified candidate miR-379 target
disrupted mitochondrial cristae in the glomeruli of WT-STZ genes and the phenotypes/gene expression seen in vivo in the
mice, which were ameliorated in miR-379KO-STZ (Fig. 6g). diabetic miR-379KO-STZ mice, we used RT-qPCR to measure
Quantitative analysis also showed that the average mitochondrial the expression of miR-379 target genes in glomeruli isolated from
area was smaller in WT-STZ mice compared to nondiabetic mice, STZ- and control WT and miR-379KO mice. Edem3 gene
but this reduction in area size was not observed in miR-379KO- expression was significantly decreased in WT-STZ mice, but
STZ relative to corresponding nondiabetic mice (Fig. 6h). restored in miR-379KO-STZ mice, compared to their respective
Furthermore, a marker of podocytes (p57) was examined by nondiabetic controls at 6 and 24 weeks after diabetes onset
immunofluorescence (IF) staining at 24 weeks after diabetes onset (Fig. 7g). These results are consistent with our previously pub-
(Fig. 6i). The number of podocytes as detected by nuclear green lished results, which showed decreased Edem3 gene expression in
fluorescent staining (p57) was lower in WT-STZ mice compared STZ-induced and db/db diabetic mice13. In the current study, we
to WT Control, verifying podocyte loss in diabetic mice. identified Fis1 and Txn1 as new targets of miR-379. The
Quantification of the IF data showed this podocyte loss was expressions of both Fis1 and Txn1 were significantly decreased in
significantly attenuated in miR-379KO-STZ mice (Fig. 6j). IHC WT-STZ mice, but not in miR-379KO-STZ mice, compared to
staining of p57 also showed decreased podocyte number in WT- their respective nondiabetic controls at 6 and 24 weeks after
STZ mice compared to WT-Con, which was reversed in the miR- diabetes (for Fis1) and at 1 week post diabetes for Txn1 (Fig. 7h,
379KO mice (Fig. 6k). i). In general, the alterations in the levels of these targets were
relatively mild and not statistically significant at some time
points, likely because the glomeruli are heterogenous and include
Diabetes-induced increase in the expression of Chop and key other cell types, such as podocytes and endothelial cells, besides
cluster miRNAs are reduced in miR-379KO mice. In our pre- mesangial cells.
vious study, we found that miR-379 megacluster consists of about To verify that the differential gene expression is accompanied
40 other miRNAs besides miR-379, which is the first miRNA by differential protein expression of these miR-379 targets in the
located at the 5′-end of the cluster13. Therefore, to determine glomerular compartments, we used IHC. We stained kidney
whether loss of miR-379 affects some of the other downstream cortex sections isolated from STZ- and control WT and miR-
miRNAs in this cluster, we used real-time qPCR (RT-qPCR) to 379KO mice with respective antibodies to detect EDEM3, FIS1,
measure their expression in glomeruli isolated from STZ and and TXN1 at 6 and 24 weeks after diabetes onset (Fig. 8). The
control WT and miR-379KO mice. Compared to WT controls, in average EDEM3-positive glomerular area was significantly
the glomeruli of WT-STZ mice, we found significant increases in smaller in WT-STZ mice compared to nondiabetic controls; this
the expression of candidate megacluster miRNAs, miR-379, miR- decrease was reversed in miR-379KO-STZ mice (Fig. 8a, b). FIS1-
377, and miR-495. In contrast, these miRNAs were not increased positive glomerular area also showed a significant decrease in
in the glomeruli of diabetic miR-379KO-STZ mice at 6 (Fig. 7a) WT-STZ mice, which was attenuated in miR-379KO-STZ mice
or 24 weeks (Fig. 7b), after the onset of diabetes. (Fig. 8c, d). TXN1 staining was weaker in both the cytoplasm and
We next examined the expression of Chop, which encodes the nucleus in glomeruli of WT-STZ mice compared to WT
ER stress-responsive CHOP [CCAAT/enhancer-binding protein nondiabetic mice, but significantly higher in miR-379KO-STZ
(C/EBP) homologous protein] that we previously identified to than WT-STZ mice (Fig. 8e, f).
control the miR-379 megacluster and its host lncRNA13. We To further evaluate relations to mitochondrial function and
measured Chop gene expression in glomeruli isolated from STZ- biogenesis, we measured glomeruli peroxisomal proliferator-g
and control-treated WT and miR-379KO mice. Chop expression coactivator-1a (PGC-1a) expression using IHC staining. PGC-1a
was upregulated in the glomeruli at 1 and 6 weeks after diabetes is a major regulator or mitochondrial function and biogenesis. The
onset but returned to normal levels at a later stage (24 weeks) results showed a significant decrease in glomerular PGC-1a levels in
(Fig. 7c). This diabetes-induced upregulation of Chop was WT-STZ mice compared to nondiabetic controls. This reduction
however attenuated in miR-379KO-STZ compared to WT-STZ was significantly reversed in miR-379KO-STZ mice (Fig. 8g, h).
at 6 weeks and was even lower than normal at 24 weeks. This As we focused mainly on changes in glomeruli in vivo and in
suggests that deletion of miR-379 may abrogate auto- mesangial cells in vitro, to verify the above observed changes in
upregulation of the miR-379 cluster in a unique fashion through these cells, we isolated MMC from the kidney glomeruli of
the EDEM3–ER stress–CHOP axis13. normal mice and treated them with NG or HG as described in the
“Methods” section. Then, cells were fixed and stained by IF with
antibodies to EDEM3 and FIS1. Results from IF staining
Diabetes-induced expression of profibrotic genes is reduced in confirmed decreased expression of EDEM3 and FIS1 in the
miR-379KO mice. To determine the role of profibrotic genes in WT-MMC treated with HG vs. NG, but this decrease was clearly
the observed phenotype of miR-379KO-STZ mice showing pro- attenuated in miR-379KO-MMC. Notably, basal EDEM3 levels in
tection from fibrosis and ECM accumulation, we next used RT- miR-379KO MMC were significantly higher than WT MMC in
qPCR to measure the expression of Tgf-β1, collagens (Col1α2 and NG conditions (Supplementary Fig. 7a–d).
Col4α1), connective tissue growth factor (Ctgf), and fibronectin To rule out the background and reveal nonspecific binding,
(Fn1) in glomeruli isolated from STZ- and control-treated WT normal kidney cortex sections were stained without primary
and miR-379KO mice. As expected, in WT-STZ mice, diabetes antibodies for EDEM3, FIS1, TXN1, and PGC-1. No significant
increased the expression of these profibrotic genes at 1, 6, and staining was detected without primary antibody (Supplementary
24 weeks (Fig. 7d–f) after diabetes onset. This upregulation Fig. 8).
was significantly attenuated in miR-379KO-STZ mice at these Taken together, all these results indicate that deletion of miR-
time points (Fig. 7d–f). These results suggest that the genetic 379 in mice plays a significant role in protecting renal glomerular
deletion of miR-379 attenuates glomerular fibrosis and ECM cells (and possibly tubular cells) from mitochondrial dysfunction,
accumulation due to downregulation of key profibrotic genes in ER and oxidative stress, and also in attenuating key features DKD
diabetic mice. progression, as well as weight loss in STZ-injected diabetic mice.
10 COMMUNICATIONS BIOLOGY | (2021)4:30 | https://doi.org/10.1038/s42003-020-01516-w | www.nature.com/commsbioCOMMUNICATIONS BIOLOGY | https://doi.org/10.1038/s42003-020-01516-w ARTICLE
a b c
24WK
Glomerular Chop expression
5 * 6WK 3 **** 3 * *
Glomerular miRs expression
Glomerular miRs expression
****
*** *
Fold over WT-Con
4
Fold over WT-Con
Fold over WT-Con
**** *** **
2 ** 2 *** **
3 **** ** ***
* *
2 * *
1 1
1
0 0 0
-3 79 -3 77 -4 95 -3 79 -3 77 -4 95 1 6 24
miR miR miR miR miR miR Weeks of diabetes
d *** e f
**
10 1WK **** 4 * * 6WK 5 ** 24WK
**
Fold over WT-Con
Fold over WT-Con
Fold over WT-Con
8 * 4
3
**** *** *
6 **** * 3 **
*** ** **** *
**** 2 * ** **
**** * **
4 **** 2
1
2 1
0 0 0
1 2 1 gf 1
2
2
D l4D
1
1
1
1
D1
1
β
gf
β
gf
f-β Ct Fn
l1D
l4D
D
Fn
Fn
l1
Ct
Ct
ol1
ol4
f-
-
Tg Co Co
gf
Tg
Co
Co
T
C
C
g h i
1.5 2.0 2.0
Glomerular Fis1 expression
Glomerular Txn1 expression
Glomerular Edem3 expression
* * *
* *
Fold over WT-Con
Fold over WT-Con
1.5 * 1.5
Fold over WT-Con
1.0
1.0 1.0
0.5
0.5 0.5
0.0 0.0 0.0
1 6 24 1 6 24 1 6 24
Weeks of diabetes Weeks of diabetes Weeks of diabetes
WT-Con WT-STZ miR-379KO-Con miR-379KO-STZ
Fig. 7 Glomerular expression of cluster miRNAs, profibrotic genes, and miR-379 target genes in WT and miR-379KO mice. a, b Expression of indicated
miRNAs (miRs) in control and STZ-treated WT and miR-379KO mice at a, 6 and b, 24 weeks after diabetes onset (n = 4–6/group). c Expression of
glomerular Chop, an ER stress-responsive transcription factor (n = 5–8/group, n = 6–8/group, and n = 5–6/group for 1, 6, and 24 weeks of diabetes,
respectively). Results are expressed as fold over WT-Con, after normalization with internal control U6. d–f Glomerular expression of profibrotic genes, Tgf-
β1, Col1a2, Col4a1, Ctgf, and Fn1 at 1, 6, and 24 weeks (d–f) after diabetes onset (n = 5–8/group, n = 5–8/group, and n = 5–6/group for 1, 6, and 24 weeks of
diabetes, respectively). g–i Glomerular expression of miR-379 target genes. g Edem3, h Fis1, and i Txn1 were measured in WT and miR-379KO mice (n =
5–8/group, n = 6–8/group, and n = 5–6/group at 1, 6, and 24 weeks of diabetes, respectively). Results are expressed as fold over WT-Con, after
normalization with internal control Cypa. Each dot indicates the value from each mouse. Statistical analyses were performed by one-way ANOVA with post
hoc Tukey’s test for multiple comparisons. *P < 0.05, **P < 0.01, ***P < 0.001, ****P < 0.0001. All data are presented as mean ± SEM.
Discussion mice31,32, which may be because deletion of one miRNA does not
miR-379 is the most upstream miRNA in the miR-379 mega- critically affect embryonic or tissue development (due to com-
cluster of miRNAs hosted by the lncRNA, lncMGC, which plays a pensation by other miRNAs/processes) but is however important
role in early DKD13. In this study, we examined the in vivo role of for kidney disease progression likely due to functions of critical
miR-379 in the pathogenesis of DKD by studying the phenotype targets of the specific miRNA (miR-379).
of miR-379KO mice, which we created using CRISPR-Cas9 Using an AGO2-CLASH strategy in MMC from WT and miR-
editing. Although miR-379KO mice showed no apparent defects 379KO mice, we identified several new targets of miR-379, while
or detectable phenotypes under normal conditions, however, also confirming a previously identified target, Edem313. We
when rendered diabetic, they depicted protection from features of observed that the levels of key targets of miR-379 such as Edem3,
DKD, including albuminuria, glomerular hypertrophy, and Fis1, and Txn1 were significantly reduced in WT diabetic mice
fibrosis. It is interesting that the miR-379KO mice exhibited compared to nondiabetic mice. However, their levels were
phenotypic variation only in response to a challenge (diabetes in restored in miR-379KO diabetic mice. EDEM3 is implicated in
this setting). This has also been seen in other single miRNA KO protection from ER stress14, FIS1 can promote adaptive
COMMUNICATIONS BIOLOGY | (2021)4:30 | https://doi.org/10.1038/s42003-020-01516-w | www.nature.com/commsbio 11ARTICLE COMMUNICATIONS BIOLOGY | https://doi.org/10.1038/s42003-020-01516-w
a WT miR-379KO b
Glomerular EDEM3 positive area
Control STZ Control STZ
2.5
**
Fold over WT-Con
2.0 **** **
6WKS
**** ****
24WKS EDEM3 1.5
1.0
0.5
0.0
6 24
Weeks of diabetes
d
Glomerular FIS1 positive area
*
Fold over WT-Con
3.0
c
****
2.0
6WKS
1.0
24WKS FIS1
0.0
6 24
Weeks of diabetes
f
Glomerular TXN1 positive area
2.0 **** ****
Fold over WT-Con
** ****
e 1.5 *
1.0
6WKS
0.5
TXN1
0.0
6 24
Weeks of diabetes
h Glomerular PGC-1Dpositive area
24WKS
2.0
Fold over WT-Con **** ****
****
1.5
g
1.0
24WKS PGC-1D
0.5
0.0
Con STZ Con STZ
WT miR-379KO
Fig. 8 Immunohistochemical staining and quantitative analysis of miR-379 target proteins. a, b EDEM3 (n = 32 and 50 glomeruli/group for 6 and
24 weeks, respectively), c, d FIS1 (n = 50 glomeruli/group), e, f TXN1 (n = 30 and 50 glomeruli/group for 6 and 24 weeks, respectively), and g, h PGC-1a
(n = 50 glomeruli/group) protein in kidney cortex sections from WT and miR-379KO mice at 6 and 24 weeks after diabetes onset. Scale bar, 50 µm. Bar
graph results are expressed as fold over WT-Con. Statistical analyses were performed by one-way ANOVA with post hoc Tukey’s test for multiple
comparisons. *P < 0.05, **P < 0.01, ****P < 0.0001. All data are presented as mean ± SEM.
mitophagy to preserve mitochondrial health22, whereas TXN1 is a We also mined the Nephroseq database (https://www.
known antioxidant26,33, which binds to and inactivates nephroseq.org) for the expression in human samples of miR-
thioredoxin-interacting protein (TXNIP), a potent pro-oxidant. 379 target genes identified from our CLASH profiling. Intrigu-
Thus, miR-379-mediated downregulation of these protective ingly we found that expressions of EDEM3, FIS1, and TXN1, as
factors could be a mechanism by which miR-379KO mice are well as other candidate targets are significantly decreased in
protected from DKD induced by ER stress, mitochondrial dys- kidney samples from human subjects with diabetic and chronic
function, and oxidant stress (Fig. 9). These results are consistent kidney disease as well as other kidney diseases (Supplementary
with our previous report demonstrating that inhibition of Figs. 9 and 10), suggesting that our results in diabetic mice are
lncMGC (host RNA of the miR-379 megacluster) by GapmeR relevant to human chronic kidney disease.
antisense oligos reduced the expression of miR-379 and protected Notably, our data suggests a protective role for FIS1 in DKD
mice from early features of DKD through prevention of ER for the first time. FIS1 is involved in quality control of mito-
stress13. Our current study provides unequivocal evidence for the chondria via adaptive mitophagy pathways, in which FIS1
pathological role of endogenous miR-379. Importantly, we also interacts with autophagy protein syntaxin17 to trigger mito-
demonstrate how miR-379 may mediate a pro-DKD phenotype phagy25. FIS1 displays different roles depending on which
by directly targeting genes such as Fis1, Txn1 and Edem3. mitophagy pathway is involved25. In general, high levels of FIS1
12 COMMUNICATIONS BIOLOGY | (2021)4:30 | https://doi.org/10.1038/s42003-020-01516-w | www.nature.com/commsbioYou can also read