AAV1 is the optimal viral vector for optogenetic experiments in pigeons (Columba livia)
←
→
Page content transcription
If your browser does not render page correctly, please read the page content below
ARTICLE
                  https://doi.org/10.1038/s42003-020-01595-9                OPEN

                  AAV1 is the optimal viral vector for optogenetic
                  experiments in pigeons (Columba livia)
                  Noemi Rook 1 ✉, John Michael Tuff1, Sevim Isparta                           1,2,   Olivia Andrea Masseck          3,   Stefan Herlitze4,
1234567890():,;

                  Onur Güntürkün1 & Roland Pusch1

                  Although optogenetics has revolutionized rodent neuroscience, it is still rarely used in other
                  model organisms as the efficiencies of viral gene transfer differ between species and com-
                  prehensive viral transduction studies are rare. However, for comparative research, birds offer
                  valuable model organisms as they have excellent visual and cognitive capabilities. Therefore,
                  the following study establishes optogenetics in pigeons on histological, physiological, and
                  behavioral levels. We show that AAV1 is the most efficient viral vector in various brain
                  regions and leads to extensive anterograde and retrograde ChR2 expression when combined
                  with the CAG promoter. Furthermore, transient optical stimulation of ChR2 expressing cells
                  in the entopallium decreases pigeons’ contrast sensitivity during a grayscale discrimination
                  task. This finding demonstrates causal evidence for the involvement of the entopallium in
                  contrast perception as well as a proof of principle for optogenetics in pigeons and provides
                  the groundwork for various other methods that rely on viral gene transfer in birds.

                  1 Department   of Biopsychology, Institute of Cognitive Neuroscience, Faculty of Psychology, Ruhr University Bochum, Universitätsstraße 150, 44801
                  Bochum, Germany. 2 Department of Genetics, Faculty of Veterinary Medicine, Ankara University, Şht. Ömer Halisdemir Blv, 06110 Ankara, Turkey.
                  3 University of Bremen, Synthetic Biology, Leobener Straße 5, 28359 Bremen, Germany. 4 Department of General Zoology and Neurobiology, Ruhr University

                  Bochum, Universitätsstraße 150, 44801 Bochum, Germany. ✉email: noemi.rook@rub.de

                  COMMUNICATIONS BIOLOGY | (2021)4:100 | https://doi.org/10.1038/s42003-020-01595-9 | www.nature.com/commsbio                                         1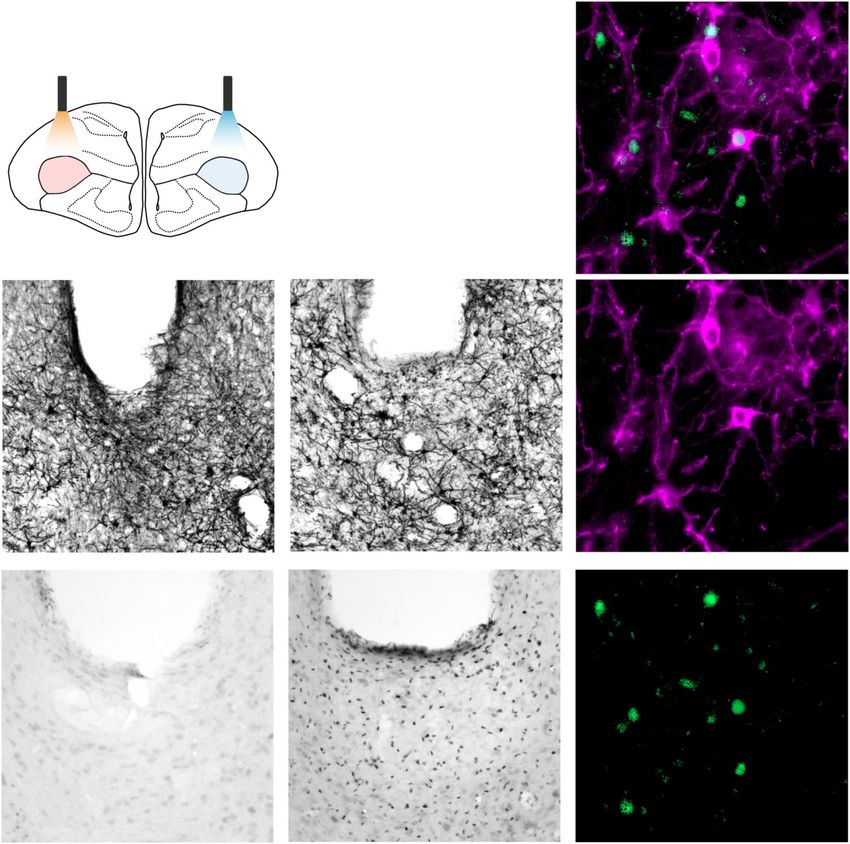
ARTICLE                                                              COMMUNICATIONS BIOLOGY | https://doi.org/10.1038/s42003-020-01595-9

B
       irds are valuable model organisms for comparative neu-               of form, pattern, color, motion, and luminance17,18,21. We
       roscientific research as different avian species provide              employed a grayscale visual discrimination task and found that
       unique research opportunities. While crows have excellent            optogenetic stimulation within this structure resulted in impaired
cognitive abilities that are on par with primates1–3, zebra finches          contrast perception indicated by decreased discrimination accu-
and other songbirds are widely studied as a model for language4–7.          racy. With this study, we provide a proof of principle for opto-
Furthermore, pigeons have outstanding visual capabilities8, navi-           genetics in pigeons as well as further insights into the function of
gational skills9,10, and represent classic animal models for research       the entopallium.
on learning and memory11. Birds are capable of those behaviors
although their brains are organized radically different than those
of mammals12. While the mammalian neocortex is organized in                 Results
six layers, the pallium of birds is structured in a nuclear fashion12.      Comparative transduction analysis of adeno-associated viral
There is, however, cumulative evidence suggesting that, although            vector serotypes 1, 5, and 9 in the avian forebrain. In a first step,
the avian and mammalian brains differ on the macroscopic level,             we wanted to determine the most efficient adeno-associated viral
the local circuitry within their sensory systems is highly com-             vector (AAV) for optogenetic experiments in the visual system of
parable indicating conserved principles in sensory systems orga-            pigeons. For the viral transfection study, we compared the effi-
nization13. Finding those invariant properties can help to establish        ciency of AAV serotype 2 pseudotyped with serotype 1 (here
circuit–function relationships that highlight general principles of         referred to as AAV1), pseudotyped with serotype 5 (here referred
the brain. Thus, comparative research is indispensable to under-            to as AAV5), and pseudotyped with AAV9 (here referred to as
stand how brain functions emerge from structure14.                          AAV9). All serotypes were combined with either the human
   Unfortunately, most of what we know about the function of the            synapsin 1 gene (hSyn) promoter or the chicken beta-actin
avian pallium, especially for the sensory system, comes from                (CAG) promoter and were injected into the entopallium of the
purely correlative methods15,16 or lesion studies that lack spatial         pigeon brain (Fig. 1a, b). Each construct was injected into at least
and temporal precision17–21. However, in order to study the                 five separate hemispheres of three pigeons (for more information
function of neuronal networks, methods that are able to control             see Table 1). After 6 weeks of transfection, pigeons were sacrificed
neuronal activity precisely are mandatory. This ambitious goal              and immunohistochemical stainings against ChR2 were per-
was first achieved with optogenetics, allowing researchers to                formed in all brain slices containing the entopallium. The
activate or silence specific networks with high temporal and                 counterstaining was performed to allow for an equal comparison
spatial resolution through the integration of artificial light-              between the serotypes, as serotypes with the hSyn promoter were
sensitive ion channels into the cell membrane22,23. Optogenetics            tagged with eYFP, whereas serotypes with the CAG promoter
brought a revolution to rodent research24 and has been estab-               were tagged with mCherry. Moreover, the amount of transgene
lished in other species such as primates25, zebra finches7, and              expression can be underestimated when analyzing native fluor-
ferrets26 over the last years. However, the functional imple-               escence, as the signal increases with counterstainings (see Sup-
mentation of optogenetics in other species has been challenging27.          plementary Fig. 1 and Method section for more detail). The
While several studies have been able to show the effects of elec-           efficiency of all six constructs was assessed based on the number
trical microstimulation during decision-making or perception in             of ChR2 expressing somata (Fig. 1a) and the transfected area of
primates28–30, studies using optogenetic stimulation have some-             ChR2 expressing somata, dendrites, and axons in relation to the
times failed to find behavioral effects, despite reporting physio-           size of the entopallium (Fig. 1b).
logical changes25,31–33. One explanation that has been provided                We found that the construct had a significant effect on the
for the absence of behavioral effects is insufficient viral efficiency        number of ChR2 expressing cells (one-way ANOVA with Welch
resulting in low amounts of protein expression25,27. As one key             correction F(4,9.511) = 14.949, p < 0.001, Fig. 1c). While there was
component in optogenetics is the expression of light-sensitive ion          no difference in the number of ChR2 expressing cells between
channels that are typically transferred into the brain via viral            injections of AAV1-hSyn-ChR2 and AAV1-CAG-ChR2 (Bonfer-
vectors, the efficiency of those constructs has to be carefully              roni corrected pairwise comparisons, p = 1.00, Fig. 1c, e, h), both
investigated prior to the application of optogenetics in vivo. Viral        constructs were significantly more efficient than all other serotypes
vector efficiency can vary considerably between brain areas and              including AAV5-hSyn-ChR2 (p ≤ 0.001, Fig. 1c, f), AAV5-CAG-
species highlighting the need for viral transfection studies in             ChR2 (AAV1-hSyn-ChR2: p = 0.003, AAV1-CAG-ChR2: p =
various model organisms34–39. Especially in birds, viral trans-             0.025, Fig. 1c, i) and AAV9-CAG-ChR2 (p ≤ 0.001, Fig. 1c, j, for
fection has proven to be difficult40, possibly due to properties of          mean values and SEM see Table 1). Furthermore, the construct
the immune system41,42. Although optogenetics has been already              had a significant effect on the percentage of ChR2 expressing area
used in some areas of the zebra finch song system7,43,44, the                within the entopallium (one-way ANOVA with Welch correction,
efficiency of different viral constructs was not compared within             F(4,8.515) = 12.791, p = 0.001, Fig. 1d). There was no significant
these and other brain areas such as the visual system. In this              difference in the percentage of the transduced area between
study, we compared the efficiency of six viral constructs in their           injections of AAV1-hSyn-ChR2 and AAV1-CAG-ChR2 (Bonfer-
ability to transduce neurons in the pigeon forebrain and found              roni corrected pairwise comparisons, p = 0.402, Fig. 1d, e, h).
that AAV1 is the optimal viral construct for optogenetic experi-            However, AAV1-CAG-ChR2 resulted in a significantly greater
ments in birds. As it has been complicated to induce behavioral             area expressing ChR2 than all other serotypes including AAV5-
effects with optogenetics in primates due to insufficient protein            hSyn-ChR2 (p < 0.001, Fig. 1d, f), AAV5-CAG-ChR2 (p = 0.001,
expression25,27, we furthermore confirmed that stimulation of                Fig. 1d, i) and AAV9-CAG-ChR2 (p = 0.001, Fig. 1d, j, for mean
channelrhodopsin (ChR2) leads to physiological as well as                   values and SEM see Table 1). Moreover, the ChR2 expressing area
behavioral effects in pigeons. In our study, we have focused on the         was significantly greater for AAV1-hSyn compared to AAV5-hSyn
visual system, as birds are highly visual animals and recent studies        (p = 0.039, Fig. 1d–f). Furthermore, transduction efficiencies of
have indicated that characteristic properties of sensory systems,           the serotypes followed a similar pattern when the ChR2 expressing
such as a columnar and laminar organization, are conserved                  area was compared to the size of the entopallium only in slices
between birds and mammals13. We targeted the entopallium,                   with transduction (see Supplementary Fig. 2). The expression
which is the most important primary visual area in the pigeon               pattern following injections of AAV9 differed from all the other
telencephalon and which has been associated with discrimination             serotypes, as for AAV9-hSyn-ChR2 only two ChR2 expressing

2                         COMMUNICATIONS BIOLOGY | (2021)4:100 | https://doi.org/10.1038/s42003-020-01595-9 | www.nature.com/commsbio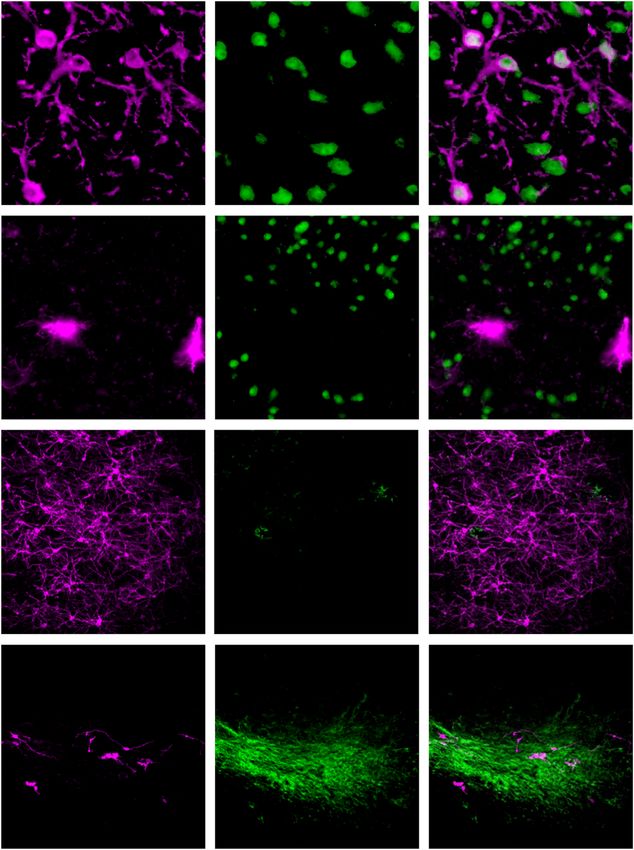
COMMUNICATIONS BIOLOGY | https://doi.org/10.1038/s42003-020-01595-9                                                                                                                                    ARTICLE

                                                                             AAV1                                                                                        AAV1
                                                                             AAV5                                                                                        AAV5
                   a                            Number of ChR2+ Somata
                                                                             AAV9                          b                               Transfected area in %         AAV9

                                                                                    E                                                                                           E

                                                              Somata                           MSt                                                      Density                           MSt
                                                                                  LSt   GP                                                                                 LSt      GP

                   c                                                                                       d                               35
                                            25,000                     ***    **             ***                                                                    *
                                                                       ***    *              ***                                                                   ***    **             **

                                                                                                           Transduced entopallial area %
                                                                                                                                           30
                                                                                                   hSyn                                                                                         hSyn
                   Number of ChR2+ somata

                                            20,000                                                 CAG                                                                                          CAG
                                                                                                                                           25

                                            15,000                                                                                         20

                                                                                                                                           15
                                            10,000

                                                                                                                                           10

                                             5,000
                                                                                                                                           5

                                                     30 µm

                                                             AAV1        AAV5            AAV9                                                          AAV1        AAV5              AAV9

                            e                                  AAV1-hSyn f                                AAV5-hSyn                                      g                          AAV9-hSyn

                        500 µm
                                                                       ChR2                                                                 ChR2                                              ChR2
                               h                               AAV1-CAG i                                 AAV5-CAG                                       j                          AAV9-CAG

                                                                       ChR2                                                                     ChR2                                          ChR2
Fig. 1 Comparative transduction analysis of AAV1, AAV5, and AAV9 in combination with the hSyn and CAG promoters. a Schematic illustration of the
injection area and analysis type. For the first analysis, all somata were counted that displayed ChR2 expression. b Schematic illustration of the injection area
and the analysis type. For the second analysis, the area of ChR2 expressing somata, dendrites, and axons was measured and compared to the total area of
the entopallium. c Quantitative comparison of all tested constructs in their ability to drive transgene expression in somata of the entopallium. AAV1-hSyn-
ChR2, as well as AAV1-CAG-ChR2, were significantly more efficient than all other tested constructs. d Percentage of ChR2 expressing entopallial area for
all tested constructs. AAV1-CAG was significantly more efficient than all other tested constructs. All AAVs with hSyn promoter are depicted in gray and all
AAVs with CAG promoter are depicted in blue. e–j Qualitative pictures of ChR2 expression following injections of e AAV1-hSyn-ChR2 (n = 5), f AAV5-
hSyn-ChR2 (n = 5), g AAV9-hSyn-ChR2 (n = 5), h AAV1-CAG-ChR2 (n = 6), i AAV5-CAG-ChR2 (n = 5), and j AAV9-CAG-ChR2 (n = 5). All scale bars
represent 500 µm. Error bars represent the standard error of the mean (SEM) and dots represent the raw data, ***p < 0.001, **p < 0.01, *p < 0.05.
Abbreviations: AAV adeno-associated viral vector, hSyn human synapsin 1 gene promoter, CAG chicken beta-actin promoter.

COMMUNICATIONS BIOLOGY | (2021)4:100 | https://doi.org/10.1038/s42003-020-01595-9 | www.nature.com/commsbio                                                                                                  3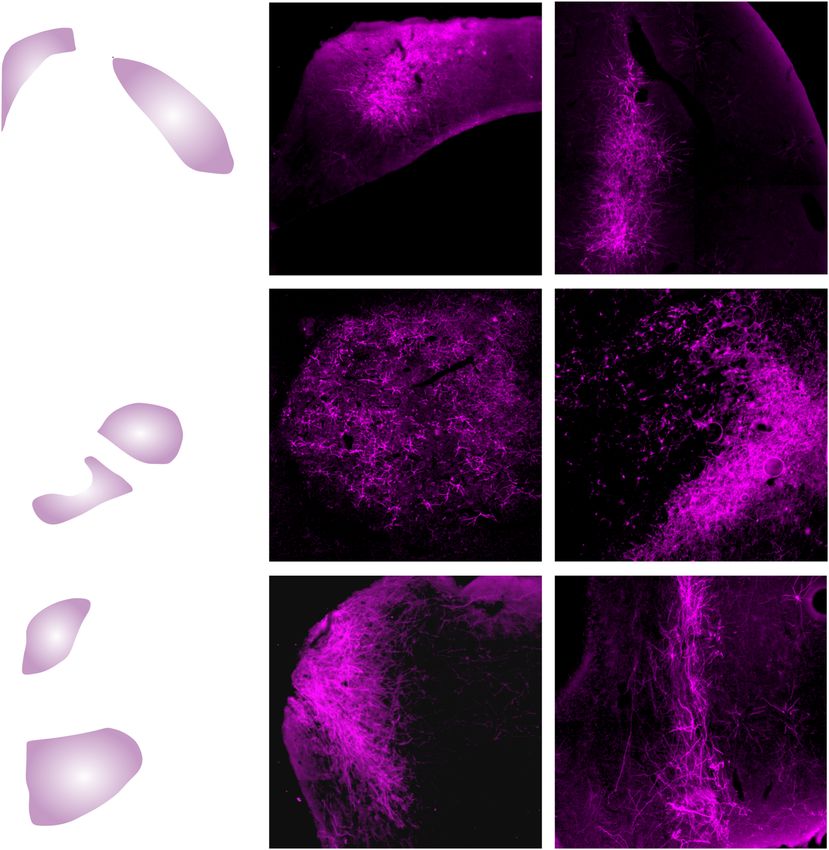
ARTICLE                                                                                       COMMUNICATIONS BIOLOGY | https://doi.org/10.1038/s42003-020-01595-9

 Table 1 Comparative transduction analysis of AAV1, AAV5,                                           cells were found in one of five cases (Fig. 1g), while AAV9-CAG-
 and AAV9 in combination with the hSyn and CAG promoter.                                            ChR2 led to reliable ChR2 expression in all five cases but also to
                                                                                                    neurotoxicity (Fig. 1j, will be discussed in detail later).
                                                                                                       While AAV1-CAG-ChR2 and AAV1-hSyn-ChR2 did not
 Serotype                Number of ChR2                           Transduced entopallial
                         expressing cells                         area in %                         differ in their efficiency to drive ChR2 expression within the
 AAV1-CAG                12405 ± 2230 SEM, n = 6                  15.89 ± 3.17 SEM, n = 6           entopallium, they differed in other properties such as anterograde
 AAV1-hSyn               15028 ± 3170 SEM, n = 5                   9.73 ± 2.62 SEM, n = 5           and retrograde expression of ChR2 in target and input structures
 AAV5-CAG                 3782 ± 690 SEM, n = 5                    2.79 ± 0.81 SEM, n = 5           of the entopallium. We found that AAV1-CAG-ChR2 injections
 AAV5-hSyn                 406 ± 125 SEM, n = 5                    0.18 ± 0.05 SEM, n = 5
 AAV9-CAG                  574 ± 83 SEM, n = 5                     1.67 ± 0.38 SEM, n = 5           into the entopallium (Fig. 2a) resulted in extensive ChR2
                                                                                                    expression in fibers projecting to target structures such as the
 For all serotypes, the mean number of ChR2 expressing cells and the mean ChR2 expressing           ventrolateral mesopallium (MVL, Fig. 2b, d) and nidopallium
 entopallial area in % was assessed for at least five injections into separate hemispheres of at
 least three pigeons.                                                                               intermedium (NI, Fig. 2b, d). In contrast to this, only little ChR2

                                                    AAV1
                                                                              AAV1-CAG                                      AAV1-hSyn

                     a                                        b                        MVL                        c               MVL

                                            MVL

                                  NI
                                              E

                            MSt
                                    GP        LSt

                                                                                  NI                                       NI

                     d                      anterograde
                                                                                                                                 E
                                                                                       E
                                            MVL

                                  NI
                                             E

                            MSt
                                       GP     LSt
                                                                   200 µm
                                                                                                        ChR2                                    ChR2

                     e                      anterograde       f                                                   g

                                             MVL
                                                              E
                                  NI
                                                                                  LSt                                           LSt
                                             E                                                                    E
                            MSt             LSt
                                                                                                                                                 GP
                                   GP
                                                                                                        GP

                                                                                                        ChR2                                    ChR2
                                            retrograde
                     h                                        i                                          TrO     j                                TrO
                          HC

                                                                                                  nRT                                 nRT
                                  Lst

                           nRT                A

                           TrO                                                                          ChR2                                    ChR2
Fig. 2 Anterograde and retrograde ChR2 expression in target and input structures of the entopallium. a Schematic illustration of the injection area in the
entopallium. b Anterograde ChR2 expression in fibers projecting to the NI/MVL following injections of AAV1-CAG-ChR2. c Little anterograde ChR2 expression
following injections of AAV1-hSyn-ChR2. d Schematic illustration of anterograde labeling in fibers projecting to the NI/MVL. e Schematic illustration of
anterograde labeling in fibers projecting to the striatum. f Anterograde ChR2 expression in fibers projecting to the striatum following injections of AAV1-CAG-
ChR2. g Little anterograde ChR2 expression in the striatum following injections of AAV1-hSyn-ChR2. h Schematic illustration of ChR2 expression in the nucleus
rotundus, which is the main input region of the entopallium. i Extensive retrograde ChR2 expression in the nucleus rotundus following injections of AAV1-CAG-
ChR2 into the entopallium. j Scarce retrograde ChR2 expression in the nucleus rotundus following injections of AAV1-hSyn-ChR2. All scale bars represent 200
µm. Note that images f, g, i, j have been rotated 90° to the left. Abbreviations: Arco arcopallium, E entopallium, GP globus pallidus, LSt lateral striatum, MSt
medial striatum, MVL ventrolateral mesopallium, NI nidopallium intermedium, nRT nucleus rotundus, TrO tractus opticus.

4                                      COMMUNICATIONS BIOLOGY | (2021)4:100 | https://doi.org/10.1038/s42003-020-01595-9 | www.nature.com/commsbio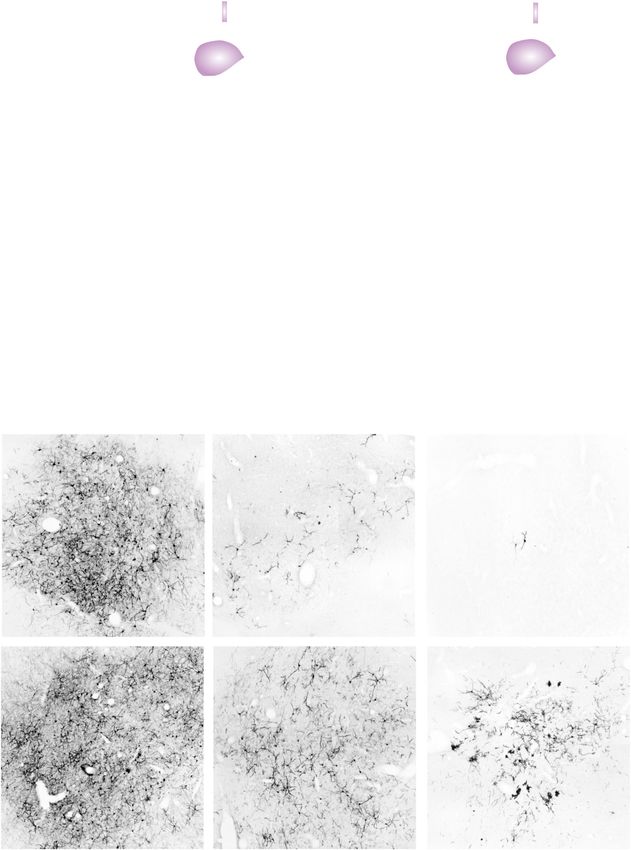
COMMUNICATIONS BIOLOGY | https://doi.org/10.1038/s42003-020-01595-9                                                                    ARTICLE

expression could be detected in NI and MVL following injections                 pallidus (Fig. 3d, f), the hyperpallium apicale (Fig. 3g, h), and the
of AAV1-hSyn-ChR2 (Fig. 2c, Supplementary Table 1, Supple-                      medial striatum (Fig. 3g, i).
mentary Figs. 3 and 4). A similar pattern of expression could be                   Since the CAG promoter can drive transgene expression in all
seen in the striatum (Fig. 2e), which is another target structure of            cell types, the extent to which ChR2 expressing cells were also co-
the entopallium. We found extensive ChR2 expression in fibers                    localized with a neuronal marker was investigated. Therefore, we
projecting to the striatum following injections of AAV1-CAG-                    performed combined immunohistochemical stainings against
ChR2 into the entopallium (Fig. 2f), which was weaker for AAV1-                 ChR2 and NeuN to visualize neurons (Fig. 4a–d). We found
hSyn-ChR2 injections (Fig. 2g, Supplementary Table 1, Supple-                   that AAV1-CAG-ChR2 led to significantly more transgene
mentary Figs. 5 and 6). The main input region to the entopallium                expression in neurons than in glial cells (neurons: 92.19% ±
is the diencephalic nucleus rotundus (Fig. 2h). Injections of both              1.99 SEM, n = 5; glial cells: 7.81% ± 1.99 SEM, n = 5; Z = −2.023,
AAV1-hSyn-ChR2 and AAV1-CAG-ChR2 into the entopallium                           p = 0.043, Fig. 4a–d). This quantification could not be performed
resulted in ChR2 expression in neurons in the nucleus rotundus                  for AAV9-CAG-ChR2 injections, as this serotype resulted in a
after 6 weeks of expression time (Supplementary Table 1,                        severe reduction of NeuN expression within the ChR2 expressing
Supplementary Figs. 7 and 8). However, retrograde ChR2                          area (AAV1-CAG: 1871 NeuN+ cells per mm2 ± 41 SEM, n = 6;
expression was more extensive after AAV1-CAG-ChR2 injections                    AAV9-CAG: 1102 NeuN+ cells per mm2 ± 77 SEM, n = 4;
(Fig. 2i) than after AAV1-hSyn-ChR2 injections (Fig. 2j),                       Z = −2.558, p = 0.01, Fig. 4e–h), suggesting neurotoxicity of this
especially after longer expression times of 6 months (Fig. 2i, j,               serotype. To further investigate the possible neurotoxicity of this
Supplementary Table 1, Supplementary Figs. 7 and 8).                            serotype, we performed combined stainings against ChR2 and
   The efficiency of AAV1-CAG-ChR2 was furthermore investi-                      glial fibrillary acidic protein (GFAP) for AAV9-CAG-ChR2 and
gated with single injections of 5 µl each in other regions of the               AAV1-CAG-ChR2, as GFAP is a marker for astrocyte activation
avian pallium to assess its brain-wide usefulness for optogenetic               after stress or injury to the brain45,46. We found that injections of
experiments in birds. AAV1-CAG-ChR2 was able to drive ChR2                      AAV1-CAG-ChR2 led to extensive ChR2 expression in the
expression in the hippocampus (Fig. 3a, b), the nidopallium                     injection area, while GFAP expression was low and occurred
caudolaterale (Fig. 3a, c), the entopallium (Fig. 3d, e), the globus            mainly around blood vessels (ChR2 expression: 8.5% ± 1.6 SEM,

                      a                                     b                                    c
                                     APH
                                                                                                                 NCL
                          HC                                                            APH
                                                                 HC

                                L2              NCL

                                               AA
                                                           200 µm
                                                                                      ChR2                                   ChR2

                      d                                    e                                     f
                           HA                                                                        MSt          GP          LSt

                                                                            E
                                           E
                                                                                                           LFB
                               MSt
                                     GP    LSt

                                                                                       ChR2                                  ChR2

                      g                                    h                                     i
                               HA                                      HA

                                           E                                                                           MSt

                               MS
                               MSt

                                                                                       ChR2                                  ChR2

Fig. 3 AAV1-CAG is efficient in driving transgene expression in various regions of the pigeon forebrain. a Schematic illustration of the hippocampus
(HC) and nidopallium caudolaterale (NCL). b ChR2 expression in HC. c ChR2 expression in NCL. d Schematic illustration of the entopallium (E) and globus
pallidus (GP). e ChR2 expression in E. f ChR2 expression in GP. g Schematic illustration of the hyperpallium apicale (HA) and the medial striatum (MSt).
h ChR2 expression in HA. i ChR2 expression in MSt. All scale bars represent 200 µm. Abbreviations: APH area parahippocampalis, E entopallium, GP
globus pallidus, HA hyperpallium apicale, HC hippocampus, LFB lateral forebrain bundle, LSt lateral striatum, MSt medial striatum.

COMMUNICATIONS BIOLOGY | (2021)4:100 | https://doi.org/10.1038/s42003-020-01595-9 | www.nature.com/commsbio                                           5
ARTICLE COMMUNICATIONS BIOLOGY | https://doi.org/10.1038/s42003-020-01595-9
a 100 * b AAV1-CAG c AAV1-CAG d AAV1-CAG
AAV1-CAG
ChR2+ cells in %
80
Neurons
Glia
60
40
20
50 µm
ChR2 NeuN Overlay
e 2200 f AAV9-CAG g AAV9-CAG h AAV9-CAG
** AAV1-CAG
AAV9-CAG
Neurons per mm2
1800
1400
1000
600
200 50 µm
ChR2 NeuN Overlay
12 AAV1-CAG ChR2 j AAV1-CAG k AAV1-CAG l AAV1-CAG
i
GFAP
10 i
Density in %
8
6
4
2
200 µm
ChR2 GFAP Overlay
m 12 AAV9-CAG ChR2 n AAV9-CAG o AAV9-CAG p AAV9-CAG
GFAP
10
Density in %
8
6
4
2
200 µm
ChR2 GFAP Overlay
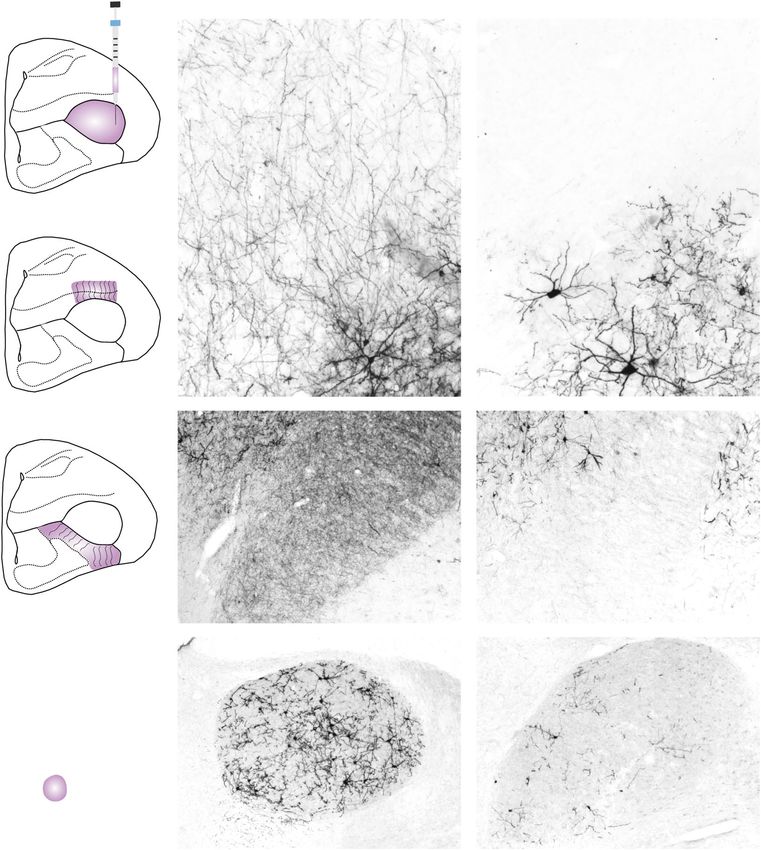
Fig. 4 Cellular tropism of AAV1-CAG and AAV9-CAG. a–d AAV1-CAG-ChR2 leads to ChR2 expression in significantly more neurons (pink bar) than glial
cells (green bar, n = 5 injections). b ChR2 expression after injections of AAV1-CAG. c NeuN expression in the corresponding injection site. d Overlay of
ChR2 and NeuN expression. e–h AAV9-CAG (green bar, n = 4 injections) leads to a significant reduction of NeuN in the injection site compared to AAV1-
CAG (pink bar, n = 5 injections). f ChR2 expression following injections of AAV9-CAG. g NeuN in the corresponding injection site. h Overlay of ChR2 and
NeuN expression indicating that AAV9-CAG injections result in reduced NeuN expression in the injection site. i–l AAV1-CAG leads to extensive ChR2
expression (pink bar), but only to weak GFAP expression (green bar, n = 3 injections). j ChR2 expression following injections of AAV1-CAG-ChR2. k GFAP
expression occurs mainly around blood vessels. l Overlay of ChR2 and GFAP expression. m AAV9-CAG injections lead to weak ChR2 expression (pink bar),
but increased GFAP expression (green bar, n = 3 injections) in the injection site. n ChR2 expression following injections of AAV9-CAG-ChR2. o GFAP
expression within the corresponding injection site. p Overlay of ChR2 and GFAP expression. All scale bars are specified within the microscopic images.
Error bars represent the standard error of the mean (SEM), dots represent the raw data. **p < 0.01, *p < 0.05.
n = 3; GFAP expression: 1.5% ± 0.5 SEM, n = 3; Fig. 4i–l, two pigeons in four hemispheres. The goal of these specific
Supplementary Fig. 9). In contrast to this, injections of AAV9- experiments was to preselect cells that were responsive to light and
CAG led to weak ChR2 expression, while GFAP expression was assess their characteristics. Therefore, a constantly repeated light
strong and occurred throughout the injection site (ChR2 pulse of 1 s duration was presented to evoke spikes during the
expression: 1.5% ± 0.6 SEM, n = 3; GFAP expression: 3.7% ± 0.9 advancement of the electrode. When a responsive cell was
SEM, n = 3; Fig. 4m–p, Supplementary Fig. 9). This supports the encountered, we used a sequence of blue light pulses (465 nm) of
idea of neurotoxicity for AAV9-CAG-ChR2. different durations (1, 10, 100, 200, and 500 ms; see Supplemen-
tary Table 2) for optical stimulation and repeated this sequence
(sweeps, Fig. 5a(i)) three times. In total, the neuronal responses of
Physiology of ChR2 expressing cells during optical stimulation nine cells were recorded during optical stimulation (Fig. 5, Sup-
investigated with in vivo electrophysiology and immediate plementary Figs. 10–17). In all preselected cells that were recor-
early gene expression. The physiology of ChR2 was assessed in ded, a significant number of action potentials could be evoked by
two experiments. In the first experiment, pigeons were anesthe- optical stimulation and all cells showed a significant response
tized, and extracellular single-unit recordings and optical stimu- when the duration of the stimulation was a least 10 ms (one-sided
lation were performed simultaneously within the entopallium of Wilcoxon rank-sum test, all p values < 0.05, for details, see
6 COMMUNICATIONS BIOLOGY | (2021)4:100 | https://doi.org/10.1038/s42003-020-01595-9 | www.nature.com/commsbioCOMMUNICATIONS BIOLOGY | https://doi.org/10.1038/s42003-020-01595-9 ARTICLE
a(i) 1st sweep 2ndsweep 3rd sweep Baseline b
200 mA
n.s.
20 trials
n.s.
100 µV
n.s.
10 sec
a(ii) 1 ms 10 ms 100 ms 200 ms 500 ms
20 spikes
200 mA
100 µV
5 sec 20 msec
a(iii) optical stimulation [465 nm] c
3rd sweep n.s.
(40 - 60) n.s.
20 trials
nd
2 sweep n.s.
(20 - 40) n.s.
1st sweep
(1 - 20) n.s. n.s.
20 spikes
20 spikes
20 msec 50 msec
d e
n.s. n.s.
10 trials
5 trials
n.s. n.s.
n.s. n.s.
20 spikes
20 spikes
100 msec 200 msec
Fig. 5 Single-cell responses upon optical stimulation (Cell 4). a(i) Stimulation protocol (upper trace) and the resulting evoked cellular responses (lower
trace). The stimulation protocol consisted of repeated light pulses of different durations (1, 10, 100, 200, and 500 ms) and was repeated three times
(sweep 1–3, indicated by the gray/white background). The baseline-firing rate of each neuron was assessed before/after the light stimulation protocol.
a(ii) A single sweep (i.e., sweep 2) of the optical stimulation protocol. The 10 ms optical stimulation is highlighted and further analyzed in (a(iii)). Raster
plot (upper part) and peri-stimulus time histogram (PSTH; lower part) of the cell response. The raster plot characterizes the cellular response aligned with
the onset of the optical stimulation (465 nm at 300 mA; blue shaded area). Each line represents one optical stimulation. Each dot within that line
represents an evoked action potential. For each repetition of the stimulation, a new line is added to the plot. The gray/white background of the raster plot
indicates the blocks of repetition (sweep 1–3). To assess the variability of the evoked responses, the sweeps were statistically compared. In the case of this
cell, no statistical differences were found (indicated by the abbreviation n.s. next to the raster plots). The PSTH represents the summed responses within a
certain time window (bin). In case of the 10 ms stimulus presentation, the bin width is 2 ms. b Raster plot (upper trace) and PSTH (lower trace) for the 1 ms
stimulus duration (bin width: 2 ms). c Raster plot (upper trace) and PSTH (lower trace) for the 100 ms stimulus duration (bin width: 4 ms). d Raster
plot (upper trace) and PSTH (lower trace) for the 200 ms stimulus duration (bin width: 10 ms). e Raster plot (upper trace) and PSTH (lower trace) for the
500 ms stimulus duration (bin width: 10 ms).
Supplementary Table 3). To assess the variability of the evoked The recorded cells differed in their overall response properties
neuronal responses, we compared the spikes evoked during these (Supplementary Figs. 10–18). We found cells that responded
sweeps using a nonparametric analysis of variance throughout the entire optical stimulation period with a constant
(Kruskal–Wallis test). If we found significant differences between amount of spikes, albeit showing a pronounced peak of activation
the sweeps a Bonferroni-corrected multiple comparison test was at the onset of light stimulation (Fig. 5, Supplementary Figs. 15
conducted. In only two out of the nine cells, significant differences and 17, Supplementary Fig. 18 cells 4, 7, and 9). Further, we
between sweeps in some conditions were detected (see Supple- found cells that weakened their responses over the course of
mentary Table 3). The differences were found in stimulation trials prolonged stimulation (Supplementary Figs. 10–12, Supplemen-
of longer duration (>100 ms). For stimulation durations below tary Fig. 18 cells 1–3). Another response pattern that was found
100 ms no significant differences could be detected (the sig- showed a sharp peak only during the onset of the stimulus
nificance is indicated in Supplementary Table 3 and in the single- (Supplementary Figs. 13, 14, and 16, Supplementary Fig. 18 cells
cell raster plots). Overall, the evoked responses were robust. 5, 6, and 8). After the electrophysiological experiments were
COMMUNICATIONS BIOLOGY | (2021)4:100 | https://doi.org/10.1038/s42003-020-01595-9 | www.nature.com/commsbio 7ARTICLE COMMUNICATIONS BIOLOGY | https://doi.org/10.1038/s42003-020-01595-9
a b 1000 c
2
C-Fos+ cells per 0.25 mm
800
620 nm 465 nm **
600
400
200
50 µm
Ento Wulst
Overlay
d e f
orange blue
200 µm 200 µm 50 µm
ChR2 ChR2 ChR2
g orange h blue i
200 µm 200 µm 50 µm
C-Fos C-Fos C-Fos
Fig. 6 Immediate early gene expression after stimulation of ChR2 expressing cells with blue light (465 nm). a Schematic drawing illustrating the
experimental procedure. In three animals, two sites of one hemisphere were stimulated with orange light (620 nm), while two sites in the other hemisphere
were stimulated with blue light (465 nm). b Quantification of c-Fos expression following orange and blue light stimulation in the stimulated entopallium
and a non-stimulated control area in the visual wulst. Significantly more c-Fos expression was observed in the blue light stimulated hemisphere (n = 6 sites,
blue) compared to the orange stimulated hemisphere (n = 5 sites, orange). However, in the non-stimulated visual wulst c-Fos activation was comparable.
c Overlay of ChR2 expression with c-Fos expression (fluorescence) indicating that blue light stimulation resulted in cellular activity in ChR2 expressing
cells. d ChR2 expression in the orange stimulated hemisphere. e, f ChR2 expression in the blue light stimulated hemisphere. g Little c-Fos expression
occurred in the orange stimulated hemisphere. h, i Extensive c-Fos expression occurred in the blue light stimulated hemisphere. Scale bars are specified
within the images. Error bars represent the standard error of the mean (SEM), dots represent the raw data. **p < 0.01.
finished, histology was performed to check for ChR2 expression were performed. The cellular activation was assessed at two
in the entopallium (Supplementary Fig. 19). stimulation sites in each hemisphere of three pigeons within
We decided to use a pulsed optical stimulation protocol of 40 the stimulated entopallium and in a control area within the
Hz in our behavioral experiments, as some cells exclusively unstimulated visual wulst to make sure that both hemispheres
showed a sharp onset peak and pulses of 10 ms durations show comparable levels of c-Fos expression in general. Blue
reliably evoked spikes in all recorded cells (pulse duration: 15 light stimulation resulted in increased c-Fos expression beneath
ms; inter-pulse interval: 10 ms). The physiological validity of the cannula within the entopallium (Fig. 6b, c, f, i) compared to
the applied protocol was further verified in an additional orange light stimulation (blue light stimulation: 515 cells ± 59
experiment. Here, we investigated the functionality of ChR2 SEM, n = 6; orange light stimulation: 12 cells ± 3 SEM, n = 5;
with immediate-early gene expression in awake pigeons (Fig. 6). Z = 2.739, p = 0.004, Fig. 6b, g, h), although both hemispheres
Following a sensory deprivation phase of one hour, pigeons showed reliable ChR2 expression (Fig. 6d–f). In the control area
were stimulated for a period of 30 min with alternating intervals within the visual wulst, there was no difference between orange
of 5 min 40 Hz stimulation and 5 min no stimulation with and blue light stimulation, indicating that staining intensities
orange light in one hemisphere and blue light in the other were similar between the two hemispheres (blue light stimula-
hemisphere (Fig. 6a). After that, the pigeons were sensory tion: 464 cells ± 107 SEM, n = 6; orange light stimulation: 585
deprived for a further 60 min to allow for adequate c-Fos cells ± 133 SEM, n = 5, Z = −0.548, p = 0.662, Fig. 6b).
expression and subsequently transcardially perfused with PFA.
Sensory deprivation before and after the experiment was
performed to reduce stimulation unrelated c-Fos expression. Transient activation of ChR2 expressing cells in the ento-
Subsequently, stainings against the immediate early gene c-Fos pallium reduces contrast sensitivity indicated by impaired
8 COMMUNICATIONS BIOLOGY | (2021)4:100 | https://doi.org/10.1038/s42003-020-01595-9 | www.nature.com/commsbioCOMMUNICATIONS BIOLOGY | https://doi.org/10.1038/s42003-020-01595-9 ARTICLE
465 nm 465 nm
a b
100
ChR2 + No Stim
ChR2 + 40Hz Stim
tdTomato + No Stim
Performance Correct %
Stimuli Class 1 (SC1) 90 tdTomato + 40Hz Stim
80
70
Stimuli Class 5 (SC5) *
60 **
Initialization
50
Initialization Stimulus Presentation Decision
Stimulation in 50 % of Trials SC 1 SC 2 SC 3 SC 4 SC 5
No Stimulation in 50 % of Trials Stimuli Class (SC)
c d
100 No Stimulation 100 No Stimulation
ChR2 + 40 Hz Stimulation *** tdTomato + 40 Hz Stimulation
Performance Correct %
Performance Correct %
90 ** 90
*
80 80
70 70
60 60
50 50
SC 1 SC 2 SC 3 SC 4 SC 5 SC 1 SC 2 SC 3 SC 4 SC 5
Stimuli Class (SC) Stimuli Class (SC)
e f
2500 No Stimulation 2500 No Stimulation
ChR2 + 40 Hz Stimulation tdTomato + 40 Hz Stimulation
Reaction Times in ms
Reaction Times in ms
2000 2000
1500 1500
1000 1000
500 500
SC 1 SC 2 SC 3 SC 4 SC 5 SC 1 SC 2 SC 3 SC 4 SC 5
Stimuli Class (SC) Stimuli Class (SC)
performance in a grayscale visual discrimination task. For all In every trial of a session, pigeons were confronted with two
behavioral experiments, AAV1-CAG was used to deliver the ion grayscale pictures that varied in their luminance. The grayscale
channel ChR2 or the fluorescent protein tdTomato into neurons picture pairs could belong to five different stimulus classes (SC),
of the entopallium. To investigate the behavioral effect of opto- depending on their luminance difference. SC1 consisted of
genetic stimulation, an experimental group expressing ChR2 and grayscale pictures with the lowest luminance difference (mean
a control group expressing tdTomato were bilaterally stimulated luminance difference 5.81 cd/m2, Supplementary Fig. 20). Thus,
in the entopallium during the whole stimulus presentation phase these stimuli were similar to each other and therefore hard to
or until the pigeon responded. Stimulation took place in 50% of discriminate. In contrast, grayscale picture pairs of the
the trials of a forced-choice visual discrimination task. The SC5 showed the highest luminance difference (mean luminance
remaining 50% of the trials were void of optical stimulation difference 30.39 cd/m2, Supplementary Fig. 20). Consequently,
(Fig. 7a). these stimuli were easier to discriminate (see more details in the
COMMUNICATIONS BIOLOGY | (2021)4:100 | https://doi.org/10.1038/s42003-020-01595-9 | www.nature.com/commsbio 9ARTICLE COMMUNICATIONS BIOLOGY | https://doi.org/10.1038/s42003-020-01595-9
Fig. 7 Transient 40 Hz activation of ChR2 expressing cells in the avian entopallium reduces contrast sensitivity. a Schematic illustration of the
experimental procedure. Pigeons were conditioned to discriminate grayscales of different stimulus classes (SC). SC1 consisted of grayscale pictures that
were difficult to discriminate and SC5 consisted of grayscale pictures that were easy to discriminate. Pigeons were bilaterally stimulated in half of the trials
in a given session and stimulation took place during the whole stimulus presentation phase or until the animal responded. b Visual discrimination
performance of the control (n = 6) and experimental group (n = 6) displayed in one graph. Experimental group data can be seen in more detail in panel (c)
and control group data can be seen in more detail in panel (d). The control and experimental group had comparable performances and a significant drop in
performance could only be seen for optogenetic stimulation in the experimental group in SC3 and SC5. c Visual discrimination performance of the
experimental group expressing ChR2 in the entopallium. Optogenetic stimulation reduced contrast sensitivity as indicated by a significant reduction of
discrimination accuracy for stimuli in SC3, SC4, and SC5, but unimpaired discrimination performance in SC2 and SC1. d Visual discrimination performance
of the control group expressing tdTomato in the entopallium. Optogenetic stimulation had no effect on contrast sensitivity as discrimination performance
was comparable between stimulated and unstimulated trials in all stimulus classes. e, f Reaction times for stimulated and unstimulated trials of the
experimental (n = 6) and control group (n = 6). There was no difference in reaction times between the different stimuli classes or between stimulated and
unstimulated trials for both groups. c–f Mean performances of all sessions are plotted for all pigeons in individual colors. Stimulated and unstimulated
performances within each pigeon have been connected with lines. Error bars represent the standard error of the mean (SEM), ***p < 0.001, **p < 0.01, *p <
0.05.
Table 2 Effects of optogenetic stimulation on grayscale visual discrimination.
SC1 SC2 SC3 SC4 SC5
All groups 57.86 ± 0.77 63.15 ± 0.73 69.57 ± 0.81 73.88 ± 1.45 79.97 ± 1.22
Exp. group
40 Hz stimulation 57.97 ± 1.19 61.32 ± 1.38 65.50 ± 1.19 69.66 ± 2.05 73.50 ± 2.46
No stimulation 56.03 ± 1.49 63.35 ± 1.66 69.69 ± 1.13 76.08 ± 2.66 82.23 ± 1.69
p Value 0.205 0.334 0.028* 0.006** 0.227; Fig. 7d, Supplementary Fig. 21,
0.647, ηp2 = 0.059). However, the discrimination performance for see Table 2 for mean values and SEM). Furthermore, Bonferroni
the five different SC differed significantly for all tested groups corrected pairwise comparisons revealed that the performance of
(main effect of SC F(4,40) = 181.015, p < 0.001, ηp2 = 0.948) and the experimental and control group differed significantly for
gradually increased from SC1 to SC5 (all Bonferroni corrected stimulated trials in SC3 (p = 0.007, Fig. 7b) and SC5 (p = 0.017,
comparisons p < 0.007, for mean values and SEM see Table 2). Fig. 7b). For SC4 there was a trend toward significance (p = 0.082,
Importantly, optical stimulation resulted in different effects for Fig. 7b).
each tested group (interaction of the between-subject factor group In the next step, we determined whether the drop in
and the within-subject factor 40 Hz stimulation, F(1,10) = 8.703, performance in the experimental group was associated with an
p = 0.015, ηp2 = 0.465). We found no impact of optical stimula- increase in reaction times that could have reflected attentional
tion on the behavioral performance of the animals in the deficits. Therefore, we measured the reaction times in all SC and
control group expressing the fluorescent protein tdTomato (no calculated a repeated-measures ANOVA with the same factors as
stim: 70.25% ± 1.23 SEM, stim: 70.22% ± 1.37 SEM, p = 0.970; described above.
Bonferroni corrected pairwise comparisons) indicating that blue We found that there was no main effect of the session (F(3,30)
light itself had no impact on visual discrimination performance. = 0.738, p = 0.538, ηp2 = 0.069), 40 Hz stimulation (F(1,10) =
10 COMMUNICATIONS BIOLOGY | (2021)4:100 | https://doi.org/10.1038/s42003-020-01595-9 | www.nature.com/commsbioCOMMUNICATIONS BIOLOGY | https://doi.org/10.1038/s42003-020-01595-9 ARTICLE
2.292, p = 0.161, ηp2 = 0.186) and SC (F(4,40) = 1.439, p = 0.239, responses in rodents as well as in primates45,46. Those studies
ηp2 = 0.126) on the reaction times. Furthermore, there was no concluded that AAV9 is able to transduce antigen-presenting cells
interaction between 40 Hz stimulation and SC (F(4,40) = 0.702, p (APC) and can trigger a cell-mediated immune response
= 0.595, ηp2 = 0.066, Fig. 7e, f, Supplementary Fig. 22) indicating depending on the immunogenicity as well as the expression level
that reaction times were comparable between stimulated and of the transgene45. Our finding that the inflammatory response
unstimulated trials as well as between all SC in the experimental only occurred when AAV9 was used in combination with the
and control groups (Fig. 7e, f). Furthermore, the groups did not CAG promoter, but not when used with the hSyn promoter,
differ significantly in their overall reaction times (no main effect supports this idea. This is the case as the CAG promoter drives
of group F(1,10) = 2.067, p = 0.181, ηp2 = 0.171, no interaction of strong transgene expression in various cell types, whereas the
stimulation, SC and group F(4,40) = 2.139, p = 0.094, ηp2 = 0.176, hSyn promoter has been shown to be neuron-specific25,34,49–51,
Supplementary Fig. 22). A different pulse protocol with 20 Hz making it unlikely that transgene expression occurred in APC.
stimulation was tested in five pigeons and was also able to impair Thus, it is still possible that AAV9 combined with other pro-
behavioral performance for stimuli in SC5 (see Supplementary moters provides a useful optogenetic tool. Indeed, several studies
Fig. 23). At the end of experimental testing, for both the conducted in zebra finches use scAAV9 in combination with
experimental and control group, coordinates of the cannula tips neurexin or CMV promoter in areas of the zebra finch song
were assessed and these were mainly located in the medial to system7,44. However, our results cannot easily be compared to
anterior entopallium (see Supplementary Fig. 24). these studies, as they used custom-built self-complementary
AAVs (scAAVs), which differed not only in the integrated pro-
moters but also in other aspects, as scAAVs do not require second
Discussion strand synthesis but are immediately ready for replication and
In the current study, we investigated the efficiency of three AAVs transcription.
(AAV1, AAV5, and AAV9) in combination with two different For our purposes, AAV1-CAG was the most efficient construct
promoter systems (hSyn and CAG) in their ability to drive ChR2 and was therefore tested in other areas of the pigeon brain to
expression in neurons within the entopallium, the first visual investigate its brain-wide usefulness for optogenetic experiments.
input structure of the avian forebrain. This comparison was We found that AAV1-CAG was effective in driving transgene
performed to determine the optimal viral construct for optoge- expression in cells of the visual wulst, the entopallium, the globus
netic experiments in the visual system of birds. We found that pallidus, the hippocampus, the striatum, and the nidopallium
AAV1 was the most efficient viral vector regardless of the pro- caudolaterale. Importantly, ChR2 expression following injections
moter system as this vector transduced the greatest number of of AAV1 combined with the unspecific CAG promoter occurred
cells and showed the highest transfection density compared to the mainly in neurons indicating that AAV1 has a natural tropism for
other AAV constructs. When AAV1 was used in combination this cell type. That AAV1 transfects mainly neurons has already
with the CAG promoter, we observed extensive anterograde as been reported in other studies38 supporting the idea that this
well as retrograde labeling that was weaker when AAV1 was serotype is a useful tool for optogenetic experiments.
combined with the hSyn promoter. Since several studies have In birds, AAV1 has not been used in the visual system so far.
reported difficulties in producing behavioral effects with opto- However, AAV1 has recently been used in zebra finches in the
genetic stimulation in primates, we furthermore wanted to con- song system to study how optogenetic stimulation of ventral
firm that stimulation of ChR2 could produce physiological as well tegmental area (VTA) axon terminals can guide learned chan-
as behavioral effects in pigeons. The physiological effect of ChR2 ges in song43. This study reported anterograde labeling in Area
was verified with combined optical stimulation and electro- X following injections of AAV1-CAG into the VTA43. This is in
physiological recordings as well as with immediate-early gene line with our finding that injections of AAV1-CAG result in
expression. The behavioral effect was investigated in a grayscale extensive anterograde ChR2 expression in well-described target
visual discrimination task. We could show that contrast sensi- structures of the entopallium such as the NI, MVL, and the
tivity decreased when neural activity was temporarily increased in striatum52. In addition, our study observed extensive retrograde
the entopallium. This finding provides causal evidence for the ChR2 expression in input structures of the entopallium such as
involvement of the entopallium in contrast perception as well as a the nucleus rotundus53. The projection from the diencephalic
proof of principle for optogenetics in pigeons. nucleus rotundus into the telencephalic entopallium is well
The finding that AAV1 was the most efficient construct in known and ideal to test the retrograde properties of a viral
transducing cells in the entopallium of pigeons is in line with vector as those two structures are located in different parts of
several studies showing that this construct is also highly efficient the brain54. Thus, it is impossible that the retrogradely labeled
in primates36, cats39, mice38, and rats34,37. Nevertheless, in cells that have been observed in the nucleus rotundus are the
primates25,36 and rodents34 AAV5 seems to be even more effi- result of injection leakage from the entopallium. The finding
cient indicating differences in viral transfection between species, that AAV1 in combination with the CAG promoter leads to
as AAV5 transduced only few cells in pigeons and has been retrograde ChR2 expression is in line with transduction studies
shown to be completely ineffective in cats39. While AAV9 is performed in mice and rats that have reported similar prop-
widely used in rodents, especially because of its capacity to cross erties for this viral vector55,56. Retrograde properties of AAV1
the blood–brain barrier47–49, and has also been used in zebra in birds have, to the best of our knowledge, so far not been
finches7,44, our study indicates that AAV9 combined with the reported. However, in the song system of zebra finches, AAV9
hSyn promoter was completely inefficient in driving transgene has been used to transduce cells retrogradely44. Our findings
expression in cells of the entopallium in pigeons. In contrast to indicate that AAV1 in combination with the CAG promoter
this, AAV9 combined with the CAG promoter led to moderate provides a useful alternative for those who depend on com-
transgene expression in the entopallium, but also to a severe mercially available products. Identifying anterograde as well as
reduction of NeuN and activation of astrocytic cells indicating retrograde properties of AAVs in birds is crucial since this is a
neurotoxicity of this serotype. The interpretation that the cell loss way of gaining specificity, which can be used for detailed circuit
occurred as a consequence of an inflammatory response is cor- analyses.
roborated by other transfection studies showing that AAV9 We found that 20 Hz as well as 40 Hz blue light optical sti-
encoding nonself proteins can result in cell-mediated immune mulation of ChR2 expressing neurons within the entopallium
COMMUNICATIONS BIOLOGY | (2021)4:100 | https://doi.org/10.1038/s42003-020-01595-9 | www.nature.com/commsbio 11ARTICLE COMMUNICATIONS BIOLOGY | https://doi.org/10.1038/s42003-020-01595-9
resulted in impaired grayscale visual discrimination, while the The finding that this area governs brightness perception fur-
same manipulations in control birds expressing tdTomato did thermore suggests a functional similarity of the entopallium to
not result in any behavioral effects. This indicates that the blue mammalian V165.
light stimulation itself had no effect on visual discrimination With our finding, we furthermore provided, to the best of our
accuracy and that the discrimination deficit in the experimental knowledge, the first proof of principle for the functionality of
group can be traced back to the changed physiology of cells optogenetics in pigeons. Since the functional implementation of
within the entopallium. Furthermore, these findings suggest that optogenetics in other species, especially on a behavioral level, has
the entopallium is involved in contrast perception/visual dis- been challenging24,27, the establishment of this method in a novel
crimination of luminance, which is well in line with lesion stu- species is interesting in itself. While attempts to drive behavior in
dies that have been performed in the entopallium and other areas primates with optical stimulation of the motor cortex have
of the avian collothalamic pathway17,19,20,57. For example, failed25, the production of saccadic eye movements with stimu-
lesions of the entopallium have been shown to reduce the ability lation of V1 was successful66. Based on this, it has been suggested
to categorize stimuli into bright and dim19 or to discriminate that, especially for unspecific optogenetic stimulation of both
between pictures of varying patterns and luminance20. However, inhibitory and excitatory cell types, manipulations within sensory
in most cases, the lesions were not confined to the entopallium, areas are more effective in driving behavior than manipulations
complicating the attribution of the observed perceptual and within motor structures66. This is the case as unspecific stimu-
behavioral deficits to the functionality of the entopallium alone. lation is not able to produce finely tuned action plans that are
Using optogenetics, a stronger claim for the role of the ento- necessary to drive motor behavior58, whereas unspecific stimu-
pallium in contrast perception can now be made, as we selec- lation of visual areas can produce artificial percepts that attract
tively increased the firing rates of entopallial cells. This attention, therefore, changing behavior66. The idea of artificial
procedure has been shown to be a suitable approach for dis- percepts and their attentional effects might also apply to our
rupting behaviors that rely on heterogeneous as well as time- finding that stimulation of the primary visual area in the pigeon
varying population coding7,58,59. Visual processing depends on brain impaired contrast perception in a grayscale discrimination
such adaptive coding mechanisms since neurons within the task. However, as the reaction times in this task did not differ
sensory system vary their responses dynamically according to the between stimulated and unstimulated trials it is unlikely that our
input60. In visual discrimination tasks, where one stimulus needs findings are simply the results of averted attention but rather of
to be selected over the other, cells in higher visual areas code for deficient contrast coding within the entopallium.
this discrimination by selectively increasing and decreasing their However, the fact that unspecific stimulation is not able to
firing rates for the selected and nonselected stimuli, respectively. produce finely tuned action plans that are necessary to drive
The difference in firing rates of these cells represents the dis- motor behavior58 also indicates the importance of cell type or
criminative information, which is greater for simple compared to projection specific approaches when investigating behaviors that
complicated discriminations61. Since the optogenetic manipula- rely on tightly regulated mechanisms. In order to investigate the
tion within the entopallium was not cell type-specific, the dis- function of the columnar and laminar organization of the bird
criminative information of these cells was probably disrupted by brain that has been proposed by several studies13,67,68, projection
elevating the firing rates of all cells, thereby reducing their specific approaches are needed. With projection specific optoge-
contrasts. This reduced contrast in neural representations might netics, the role of specific visual circuits between layers can be
have led to impaired discrimination accuracy. Thus, for cell type investigated to establish circuit–function relationships that high-
unspecific optogenetics during visual discrimination, excitatory light general principles of brain organization. With our finding
optogenetic tools might offer advantages over inhibitory opto- that AAV1 in combination with the CAG promoter is able to
genetic tools, as excitation creates a new signal that can disturb drive ChR2 expression anterogradely as well as retrogradely, we
the population dynamics more intensely than inhibition, which provided a useful tool for future studies that can use this serotype
might result in floor effects62. Although excitatory optogenetic to investigate whether the conserved principle of a columnar and
tools offer the above-mentioned advantages and might yield laminar organization in avian sensory areas also translates to
comparable effects to temporal lesions63, it needs to be noted similar functions. With the viral comparison study, we further-
that these tools might have knock-on effects on connected circuit more provided the groundwork for various other methods that
areas of the entopallium such as the NFL, NI, and MVL64. Thus, rely on viral gene transfer, such as DREADDS24, genetic abla-
to further substantiate the role of contrast perception to the tions69, calcium imaging69, or local genetic knock-in/out studies5,
entopallium, similar experiments using inhibitory tools or that can from now on be applied in the pigeon brain and can
pharmacology could be performed. Moreover, future optogenetic vastly improve comparative research. Overall, we created the
studies could investigate the effect of optogenetic stimulation on foundations for a mechanistic understanding of the avian pallium
other entopallial functions such as motion, pattern, and color and demonstrated conserved principles of avian and mammalian
discrimination. In these tasks, functional segregation has been visual systems encouraging the use of avian model organisms for
described as lesions within the anterior entopallium affect the comparative and vision research in the future.
pattern, color, and form discrimination, whereas lesions of the
posterior entopallium impair motion processing18,21. Based on
these findings and comparable topographic projection patterns Methods
within the avian and mammalian tectofugal pathways, it has Experimental subjects. For this study, N = 35 adult homing pigeons (Columba
been proposed that the motion-sensitive posterior entopallium is livia) of undetermined sex were obtained from local breeders. The pigeons were
between 1 and 4 years of age. They were individually caged and placed on a 12-h
comparable to area MT, whereas the color/form/pattern sensitive light–dark cycle. During the time period of training and testing, the birds were
anterior entopallium is comparable to V2, V3, and IT in mam- maintained at approximately 85% of their free-feeding weight. All experiments
mals21. As brightness sensitive neurons of the nucleus rotundus were performed according to the principles regarding the care and use of animals
primarily project to the anterior entopallium, brightness pro- adopted by the German Animal Welfare Law for the prevention of cruelty to
animals as suggested by the European Communities Council Directive of
cessing has also been linked to this subdivision21. Although not
November 24, 1986 (86/609/EEC) and were approved by the animal ethics com-
showing a functional segregation, our study confirms that the mittee of the Landesamt für Natur, Umwelt und Verbraucherschutz NRW, Ger-
anterior entopallium is involved in brightness perception as our many. All efforts were made to minimize the number of animals used and to
neuronal manipulation was primarily focussed on this region. minimize their suffering.
12 COMMUNICATIONS BIOLOGY | (2021)4:100 | https://doi.org/10.1038/s42003-020-01595-9 | www.nature.com/commsbioCOMMUNICATIONS BIOLOGY | https://doi.org/10.1038/s42003-020-01595-9 ARTICLE
Viral vector injections/cannula implantations. The anesthesia was initiated with complex (Vector Laboratories-Vectastain Elite ABC kit; 1:100 in PBST). Following
a 7:3 mixture of Ketamine (Ketavet 100 mg/ml, Zoetis GmbH, Berlin Germany) further rinsing (3 × 10 min), slices were incubated in DAB solution. The solution
and Xylazine (20 mg/ml Rompun, Bayer Vital GmbH, Leverkusen Germany). comprised 5 ml distilled water, 100 µl of DAB stock solution, 84 µl of a nickel
Pigeons received intramuscular injections of 0.075 ml for each 100 g bodyweight. solution, and 84 µl of buffer stock solution (Vector Laboratories, DAB Substrate Kit
This translates to 52.5 mg Ketamine per kg body weight and 4.5 mg Xylazine per kg SK-4100). All slices were incubated in 12-well plates, with each well containing
body weight. Following that, the anesthesia was sustained with a consistent flow of 1 ml of this working solution. After adding 6 µl H2O2 to each well the reaction
Isoflurane (Forane 100%, Abbott GmbH & Co. KG, Wiesbaden, Germany). Prior to started and was stopped after 2 min by transferring the slices into 12-well plates
the surgical procedure, the feathers on top of the head covering the target area were containing PBS. Subsequently, slices were rinsed (2 × 5 min in PBS) and then
cut. As soon as the pigeons no longer showed any pain reflexes, they were posi- mounted on gelatin-coated slides. Finally, slices were dehydrated in alcohol and
tioned in a stereotactic apparatus. At first, the skin covering the head was incised to coverslipped with depex (Fluka, Munich, Germany)70.
expose the cranial bone. Then, craniotomies were performed to uncover the brain For the fluorescent stainings, slices were first rinsed (3 × 10 min in PBS) and
tissue. Craniotomies were performed at different locations depending on the target then incubated in 10% NHS (Vector Laboratories-Vectastain Elite ABC kit) to
structure (entopallium: A + 9.5, L ± 5.5, DV −4.5; hippocampus: A + 6.0, L ± 1.0, block unspecific binding sites. After blocking and rinsing (3 × 10 min), the slices for
DV −1; wulst: A + 11, L ± 1.0, DV −1.5; globus pallidus: A + 9.0, L ± 4.5, DV −6; the single ChR2 stainings were incubated with a monoclonal mouse anti-ChR2
NCL: A + 5.5, L ± 7.0, DV −2.5; medial striatum: A + 11.0, L ± 1.5, DV −6.054). antibody (1:1000 in PBST, PROGEN Biotechnik GmbH, Heidelberg, Germany).
After the removal of the dura mater injections were made at the specific locations. For the combined ChR2 and NeuN stainings, slices were incubated in a mixture of
For the viral transfection study 5 µl of each viral vector (AAV1.hSyn.hChR2 a monoclonal mouse anti-ChR2 antibody (1:1000 in PBST, PROGEN Biotechnik
(H134R)-eYFP, AAV1.CAG.hChR2(H134R)-mCherry.WPRE.SV40, AAV5.hSyn. GmbH, Heidelberg, Germany) and a polyclonal rabbit anti-NeuN antibody (1:500
hChR2(H134R)-eYFP, AAV5.CAG.hChR2(H134R)-mCherry.WPRE.SV40, AAV9. in PBST, EMD Millipore, Darmstadt, Germany). For the combined ChR2 and c-
hSyn.hChR2(H134R)-eYFP, AAV9.CAG.hChR2(H134R)-mCherry.WPRE.SV40 Fos stainings, slices were incubated in a mixture of a monoclonal mouse anti-ChR2
(all vectors were obtained from Addgene, Watertown, USA, all titer were ≥1 × 10¹³ antibody (1:1000 in PBST, PROGEN Biotechnik GmbH, Heidelberg, Germany)
vg/ml)) were pressure injected into at least five separate hemispheres of three and a polyclonal rabbit anti-c-Fos (1:500 in PBST, Santa Cruz Biotechnology, TX,
pigeons. Therefore, 5 µl were pipetted on parafilm and drawn into a glass pipette USA). For the combined ChR2 and GFAP stainings, slices were incubated in a
with a 25 µm tip. The total volume was distributed over a range of 500 µm dorsal/ mixture of a monoclonal mouse anti-ChR2 antibody (1:1000 in PBST, PROGEN
ventral. For the behavioral and electrophysiological experiments, 10 µl of AAV1. Biotechnik GmbH, Heidelberg, Germany) and a monoclonal rat anti-GFAP (1:500
CAG.hChR2(H134R)-mCherry.WPRE.SV40 (Addgene, Watertown, USA, all in PBST, Invitrogen, Darmstadt, Germany). All primary antibodies were incubated
titer ≥ 1 × 10¹³ vg/ml) was injected bilaterally into the entopallium (5 µl at A + 9.5, overnight at 4 °C. The next day, after rinsing (3 × 10 min), the slices for the single
L ± 5.5, DV −4.5 and 5 µl at A + 10.5, L ± 6.0, DV −4.5). The control pigeons ChR2 stainings were incubated with a goat anti-mouse antibody AlexaFluor594
received injections of AAV1-CAG-tdTomato (Addgene, Watertown, USA) instead. (1:500 in PBST, Invitrogen, Darmstadt, Germany). The slices for the combined
The pigeons used in behavioral experiments were furthermore bilaterally implanted ChR2/NeuN and ChR2/c-Fos stainings were incubated in a mixture of a goat anti-
with dual fiberoptic cannula (DFC_200/245-0.53_12mm_GS0.7_FLT, Doric Lenses mouse AlexaFluor594 antibody (1:500 in PBST, Invitrogen, Darmstadt, Germany)
Inc, Quebec, Canada). Therefore, stainless-steel screws (Small Parts, Logansport, and a goat anti-rabbit AlexaFluor488 antibody (1:200 in PBST, Invitrogen,
USA) were fixed to the skull to serve as anchors for the dental cement. After that, Darmstadt, Germany). The slices for the combined ChR2 and GFAP stainings were
the cannulas were inserted vertically into the entopallium (A + 9.5, L ± 5.5, DV incubated in a mixture of a goat anti-mouse AlexaFluor594 antibody (1:500 in
−4.5). Finally, the cannula was attached to the head with dental cement. After the PBST, Invitrogen, Darmstadt, Germany) and a goat anti-rat AlexaFluor488
surgery was completed, pigeons received analgesics for three consecutive days antibody (1:200 in PBST, Invitrogen, Darmstadt, Germany). All secondary
(0.5 ml 10 mg/ml Rimaldyl, Pfizer GmbH, Münster, Germany). The recovery antibodies were incubated for 1 h at room temperature. After further rinsing (3 ×
period lasted 14 days, in which the pigeons had access to food and water ad libitum. 10 min), the slices were mounted onto glass slides (Superfrost® Plus, Thermo
After the recovery period, the pigeons continued training to get accustomed to the Scientific) in PBS, and embedded with DAPI Fluoromount-G® (SouthernBiotech,
patch chords. Birmingham, USA), with minimal light exposure to preserve as much fluorescence
as possible. Primary antibody specificity was either evaluated with western blots,
based on previously published literature or investigated with immunohistochemical
Perfusion. Animals in the viral transfection study were perfused 6 weeks after the stainings in negative control samples. All stainings were performed twice with
injections to ensure that ChR2 expression was already stable (see Supplementary separate brain series to qualitatively confirm the reproducibility of the stainings.
Fig. 25), whereas pigeons from the behavioral paradigm were perfused after all
experimental tests were completed. We found that ChR2 expression was stable up
to 12 months (see Supplementary Fig. 26). After pigeons had been deeply anes-
thetized with Equithesin (0.45 ml per 100 g body weight), the transcardial perfu- Microscopic analysis. For the quantitative analysis of ChR2 expression, all slices
sion was initiated with 0.9% sodium chloride (NaCl) and followed by cold (4 °C) that contained ChR2 expressing cells were imaged bilaterally with 200× magnifi-
4% paraformaldehyde (PFA) in 0.12 M phosphate buffer (PB; pH 7.4). After the cation using a ZEISS AXIO Imager.M1 with a camera (AxioCam MRm ZEISS 60N-
blood had been successfully exchanged with PFA, the brain was removed from the C 2/3”0.63×). All sections containing the entopallium between A + 8.0 and A +
skull and stored in a postfix solution (4% PFA with 30% sucrose) at 4 °C for the 11.25 of one brain series (every tenth slice) were analyzed. For the quantification of
next 2 h. After that, all brains were stored in a 30% sucrose solution in phosphate- somata, every ChR2 expressing soma within the whole entopallium was highlighted
buffered saline (PBS; pH 7.4) for at least 24 h to remove water for cryoprotection. in ZEN 2.3 lite and later automatically counted by the program. For all viral
Before slicing, brains were embedded in 15% gelatin/30% sucrose and stored in vectors, this analysis was performed in one-tenth of the brain sections and the
postfix for 24 h. Finally, brains were cut in a coronal plane in 40 µm-thickness number of all ChR2 expressing soma was summed up for further statistical
using a freezing microtome (Leica, Wetzlar, Germany). analysis.
Furthermore, the density of the stained area was determined with ZEN 2.3 pro
Image analysis tool wizard. For this, the whole entopallium was selected as an
Immunohistochemistry. All stainings were performed with free-floating sections analysis frame and parameters for segmentation were adjusted (smooth: none,
and every tenth slice was used for the immunohistochemistry. The counterstaining sharpen: none, minimum area 1 pixel, threshold: Otsu threshold, separate: none).
was performed to allow for an equal comparison between the serotypes, as ser- Following this, the size of all stained particles within the analysis frame was
otypes with the hSyn promoter were tagged with eYFP, whereas serotypes with the automatically measured in µm2. In the same sections, the size of the entopallium
CAG promoter were tagged with mCherry. Moreover, the amount of transgene was measured in µm2 by delineating the borders. The same analysis was performed
expression can be underestimated when analyzing native fluorescence, as the signal in images with 100× magnification to determine the density of ChR2 and GFAP
increases with counterstainings (see Supplementary Fig. 1). expression within the injection site for all cases used in the tropism experiment. For
For the 3,3 diaminobenzidine (DAB) reaction, slices were first rinsed (3 × the quantification of NeuN signals in the neuron loss analysis upper and lower
10 min in PBS) and then incubated in 0.3% hydrogen peroxide (H2O2) in distilled thresholds were also adjusted with Otsu’s method. However, parameters for
water for 30 min to block endogenous peroxidases. After that, slices were rinsed segmentation were adjusted and set to (smooth: none, sharpen: delineate,
(3 × 10 min) and then transferred into 10% normal horse serum (NHS; Vector threshold: 0, size: 6, minimum area: 96 pixels, separate: morphology, count: 20).
Laboratories-Vectastain Elite ABC kit) in PBS with 0.3% Triton-X-100 (PBST) for Likewise, the c-Fos signal was quantified in the entopallium and wulst, with the
30 min to block unspecific binding sites. For the comparative viral transduction only difference being that the minimum area was adjusted to 24 pixels. For the
analysis and for the assessment of anterograde and retrograde transport, slices were quantification of anterograde and retrograde transport, the target area was
incubated with a monoclonal mouse anti-ChR2 antibody (1:1000 in PBST, delineated and intensity values were determined. For anterograde transport cases
PROGEN Biotechnik GmbH, Heidelberg, Germany) at 4 °C overnight. For the were classified into + little, ++ moderate and +++ extensive (+ signal was 12% darker than the background). For retrograde transport cases
overnight. The following day, all slices were rinsed in PBS (3 × 10 min) and then were classified into + little, ++ moderate and +++ extensive (+ signal was 4% darker than the background). All quantifications were
Vector Laboratories-Vectastain Elite ABC kit) for 1 h. Subsequently, slices were performed blinded with the experimenter not being aware of the serotype
rinsed (3 × 10 min in PBS) and then transferred into an avidin–biotin-peroxidase investigated.
COMMUNICATIONS BIOLOGY | (2021)4:100 | https://doi.org/10.1038/s42003-020-01595-9 | www.nature.com/commsbio 13You can also read