INTERACTIONS BETWEEN NUMBER AND SPACE IN PARIETAL CORTEX
←
→
Page content transcription
If your browser does not render page correctly, please read the page content below
REVIEWS

                                      INTERACTIONS BETWEEN NUMBER
                                      AND SPACE IN PARIETAL CORTEX
                                      Edward M. Hubbard, Manuela Piazza, Philippe Pinel and Stanislas Dehaene
                                      Abstract | Since the time of Pythagoras, numerical and spatial representations have been
                                      inextricably linked. We suggest that the relationship between the two is deeply rooted in the
                                      brain’s organization for these capacities. Many behavioural and patient studies have shown
                                      that numerical–spatial interactions run far deeper than simply cultural constructions, and,
                                      instead, influence behaviour at several levels. By combining two previously independent lines
                                      of research, neuroimaging studies of numerical cognition in humans, and physiological
                                      studies of spatial cognition in monkeys, we propose that these numerical–spatial interactions
                                      arise from common parietal circuits for attention to external space and internal
                                      representations of numbers.

INTRAPARIETAL SULCUS
                                     The history of mathematics is traversed by a deep              So far, these two lines of research have been
(IPS). A long, deep fissure that     connection between numbers and space. From the             largely independent, as most studies of numerical
cuts through the parietal lobe,      most elementary aspects of mathematics, such as            cognition have been conducted in humans using
dividing the superior and            the notion of measurement, all the way up to the con-      functional imaging, whereas most studies of spatial
inferior parietal lobules. This
                                     cepts of the real number line, Cartesian coordinates,      processing have been conducted in monkeys using
sulcus is present in both humans
and non-human primates, and          the complex plane and even the proof of Fermat’s Last      single-unit electrophysiology. However, this division
accumulating data indicate that      Theorem, metaphors by which numbers are made to            is breaking down, as single-unit data has revealed
its organization might be            correspond to spatial positions permeate mathematical      ‘number neurons’ in the IPS, and many recent neuro-
partially conserved in evolution.    thinking1–3. The evolution of these culturally-defined     imaging studies in humans have focused on estab-
LATERAL INTRAPARIETAL
                                     representations of numbers has been crucial to the         lishing human–monkey homologies in the parietal
(LIP). A region of the lateral       development of mathematics. In this review, we             lobe. We conclude by combining data from these
bank of the IPS that is involved     discuss the neural mechanisms that might underpin          complementary lines of research to suggest several
in visual representations of space   these cultural achievements. We begin by reviewing         testable predictions that concern the anatomical
in an eye-centred coordinate
                                     recent behavioural and patient data that show that         localization and neural mechanisms of numerical–
frame. This region is crucial for
attention, intention to make         certain aspects of numerical understanding depend          spatial interactions.
saccadic eye movements and           on spatial representations. We then turn to neuro-
spatial updating.                    imaging data in humans, which indicate that the deep       Behavioural studies
                                     connection between numbers and space might be              Many behavioural protocols have shown a close con-
                                     mediated by the neural circuitry in the parietal lobe.     nection between numbers and space, in which small
                                     Drawing on recent work in monkey physiology and            numbers are represented on the left side of space, and
Inserm Unit 562 ‘Cognitive
Neuroimaging’, Service               neuroimaging studies that established tentative mon-       large numbers on the right. In this section, we consider
Hospitalier Frédéric Joliot,         key–human homologies, we then present a refined            three important questions that have guided research
4 place du Général Leclerc,          hypothesis about the specific neural regions in the        in this area. First, how automatic is this association
F94101 Orsay, France.                INTRAPARIETAL SULCUS (IPS) that might be involved in       between numbers and space? Second, what level of
Correspondence to E.M.H.
e-mail:                              these numerical and spatial processes, including the       spatial representation is involved? And, third, what
ehubbard@gmail.com                   LATERAL INTRAPARIETAL (LIP) and VENTRAL INTRAPARIETAL      role do cultural factors play in the orientation of these
doi:10.1038/nrn1684                  (VIP) regions.                                             numerical–spatial associations?

NATURE REVIEWS | NEUROSCIENCE                                                                                               VOLUME 6 | JUNE 2005 | 435
                                                               © 2005 Nature Publishing Group
REVIEWS
a SNARC effect 40
reaction time difference (ms)
20
Right–left hand
0
1 2 3 4 5 6 7 8 9
–20
–40
Number presented
–60
b Attention bias effect 440 440
Small number Large number
420 420
Reaction time (ms)
8 +
400 400
380 380
8 360 360
+ +
340 Right 340 Right
1 Irrelevant number 2 Attentional bias 3 Target detection Left Left
320 320
0
0
0
0
0
0
0
0
0
0
50
50
10
20
30
40
50
10
20
30
40
50
Delay (ms) Delay (ms)
c Line bisection effect d
70 70
Close number
reaction time differences (ms)
reaction time differences (ms)
6 6
Far number
50 50
Right–left visual field
Right-left visual field
30 30
10 10
Close number
–10
Far number
–10
TWOTWOTWOTWOTWOTWO NINENINENINENINENINENINE
–30 –30
–50 –50
–70 –70
Figure 1 | Behavioural studies showing numerical–spatial interactions. a | The spatial–numerical association of response
codes (SNARC) effect. Participants are asked to judge whether a number is even or odd. Responses to larger numbers are faster
on the right side of space whereas those for smaller numbers are faster on the left side. The graph represents the response-time
difference between right-hand and left-hand key presses. Values greater than 0 indicate a left-hand advantage, whereas values less
than 0 indicate a right-hand advantage. b | In the attention bias effect, presentation of a non-informative digit at fixation leads to an
automatic shift of attention to the left or right, which results in faster subsequent responses to visual targets. The graphs indicate
detection of a visual target on the left or right side of space as a function of whether the cue was a small or large number. Blue
symbols indicate left-sided targets, which induce a faster response after the presentation of small numbers, whereas pink symbols
represent right-sided targets, which induce a faster response after the presentation of large numbers. c | The line bisection effect.
When asked to point to the midpoint of a line (red x), participants are approximately accurate when the line is composed of ‘x’s.
However, when the line is composed of the words two or nine, pointing deviates leftwards or rightwards from the midpoint.
d | When a number is presented in one visual field during a number comparison task, an interaction between numerical distance
and visual field is observed. Numbers that are smaller than the standard (left graph) show an advantage for left visual field/right
hemisphere presentation, whereas numbers that are larger than the standard (right graph) show an advantage for right visual field/
left hemisphere presentation. This effect is further modulated by numerical distance. Numbers that are close to the standard show
only small advantages with lateralized presentation. Panel a modified, with permission, from REF. 4 © (1993) American
VENTRAL INTRAPARIETAL
Psychological Association; panel b modified, with permission, from REF. 10 © (2003) Macmillan Magazines Ltd; panel c modified,
(VIP). A region in the ventral
with permission, from REF. 11 © (2005) Elsevier Science; panel d modified, with permission, from REF. 23 © (2004) Elsevier Science.
portion of the IPS that is
responsive to motion in visual,
auditory and tactile modalities
with head-centred receptive The simplest demonstration of a connection between In one series of experiments, participants were
fields. Recent studies indicate numbers and space is the SPATIALNUMERICAL ASSOCIATION asked to perform an orientation-discrimination task
that number-selective neurons 4
OF RESPONSE CODES (SNARC) EFFECT . When subjects are on a triangle or line superimposed on a digit, and
are located in or near this
region. asked to classify numbers as even or odd (parity judge- to respond with the left or right hand. In this task,
ment), the responses to larger numbers are quicker a SNARC effect was observed6,7, which showed that
SPATIALNUMERICAL when responses are made on the right side of space, numerical magnitude is processed automatically. This
ASSOCIATION OF RESPONSE
whereas responses to smaller numbers are quicker effect was reduced or absent when participants were
CODES EFFECT
(SNARC effect). The finding when the responses are made on the left (FIG. 1a). This asked to report the colours of the digits or to iden-
that subjects respond more association of numbers and space occurs despite the tify a shape (circle or square) superimposed on the
quickly to larger numbers if the fact that the task itself has nothing to do with numerical digits. The authors suggest that this reduction in the
response is on the right side of magnitude. Indeed, the SNARC effect can occur with SNARC effect is attributable to the reduced amount
space, and to the left for smaller
numbers, which indicates
non-numerical tasks, such as judging phonemic content of overlap between neural circuits for number and
automatic spatial–numerical of number words5, or even in tasks in which the digit colour or shape compared with those for number and
associations. itself is completely irrelevant to the task6,7. orientation. Although plausible, recent data indicate
436 | JUNE 2005 | VOLUME 6 www.nature.com/reviews/neuro
© 2005 Nature Publishing Group
REVIEWS

                         that the parietal lobe is also involved in colour and          representation that is shared by the programming of a
                         form tasks8, 9 and so this interpretation remains open         hand, eye or attention movement). However, so far, no
                         to further tests.                                              study has sufficiently shown whether these reference
                             Even the simple presentation of a digit automati-          frames are eye- or world-centred.
                         cally draws attention to either the left or right visual           Another related question concerns the stage of
                         field (LVF/RVF) according to the relative size of the          processing at which spatial–numerical interactions
                         number10. Fisher et al. presented single digit numbers         arise; do they occur during stimulus comprehension,
                         (1, 2, 8 or 9) at fixation, followed by a target in either     response selection or response execution? A recent
                         the LVF or RVF, which participants responded to as             study using a dual-task paradigm showed that the
                         quickly as they could (detection reaction time). The           presentation of a stimulus digit is not necessary for
                         presentation of the number preferentially influenced           the SNARC effect to emerge. When participants were
                         the direction of the allocation of attention, and, there-      asked to verbally respond ‘one’ or ‘two’ to different
                         fore, the detection reaction time (FIG. 1b). The presenta-     stimuli, the automatic activation of numerical infor-
                         tion of digits 1 and 2 automatically directed attention to     mation interfered with responding to the orientation of
                         the LVF and so facilitated the response to stimuli in the      an arrow (backward compatibility effect)20. This study
                         LVF, whereas the opposite was true for 8 and 9, even           indicates that spatial–numerical interactions occur
                         though the digit was non-informative and completely            at a task- and modality-independent level. Another
                         irrelevant to the detection task.                              recent study showed that the SNARC effect is not
                             In a third demonstration of automatic numerical–           simply due to spatial stimulus-response compatibility
                         spatial interactions, line bisection can be biased when        (Simon effect), because it has a different time course
                         the lines are composed of numbers11,12. When asked to          and does not interact with the Simon effect21. Event-
                         indicate the midpoint of a line composed of ‘x’s, partici-     related potential (ERP) evidence also points to an inter-
                         pants are, on average, accurate. However, when asked           mediate level of processing as the neural basis of the
                         to indicate the midpoint of a line composed of either          SNARC effect. The SNARC effect best correlates with
                         the digit 9 or the French word ‘neuf ’ (nine) participants     the response-locked (as opposed to stimulus-locked)
                         deviate to the right. When the line is composed of the         ERPs, and begins to emerge at a response selection
                         digit 2 or the word ‘deux’ (two) participants deviate          stage, before response preparation or execution22.
                         to the left (FIG. 1c). The suggestion is that the numbers          Indeed, interference between numerical and spatial
                         automatically bias attention to the left or the right, and,    information can arise even from spatial congruity of
                         therefore, that the bisection of the lines deviates in the     the stimulus, rather than the response23 (FIG. 1d). The
                         same direction.                                                classic ‘numerical-distance effect’ in a number com-
                             A second issue that is relevant to this review is the      parison task is the finding that responses are increas-
                         determination of the coordinate frame in which the             ingly faster with increasing distance between the
                         SNARC effect arises. For example, it is known that             compared numbers24,25. However, when numbers are
                         the SNARC effect occurs even when the hands are                presented to the left (LVF) or right (RVF) of fixation, a
                         crossed4, which indicates that the effect depends on           distance-dependent effect of target location is observed:
                         eye- or world-centred coordinates, rather than hand-           numbers smaller than the standard show an advantage
                         centred coordinates. Similar data from cross-modal             for LVF presentation, whereas numbers larger than
                         visual–tactile attentional studies show that the deliv-        the standard show an advantage for RVF presentation.
                         ery of non-informative tactile stimuli to either hand          This effect is highly reminiscent of the SNARC effect
                         improves detection thresholds on the same side of              (compare FIGS 1a and 1d). Taken together, these results
                         space even when the hands are crossed13. This indi-            indicate that numerical–spatial interactions arise at a
                         cates that similar mechanisms might underlie both              central level, independent of input modality or output
                         the spatial representation in the SNARC effect and             effector, and that they depend on spatial compatibility
                         in cross-modal spatial cuing. Neuroimaging studies             in both the input and output processes.
                         of these cross-modal cuing effects consistently find               Although these associations are automatic, and
                         parietal lobe activation14,15, and a recent patient study      depend on abstract representations of number and
                         indicated that the parietal cortex has a crucial role in       space, the direction of the effect — small numbers left,
                         mediating these effects16.                                     large numbers right — might be determined by cultural
                             Furthermore, the SNARC effect arises when indi-            factors. Spatial–numerical interactions might have been
                         viduals are asked to perform the parity judgement by           progressively shaped by cultural conventions, such as
                         pointing17 or by making a saccade, instead of a manual         the orientation of writing or the conventional orienta-
                         response18. It must also be remembered that non-               tion of mathematical graph axes. American children
                         informative digits can bias covert visuospatial attention10.   do not show a SNARC effect until age nine26, which
                         Finally, a recent study has shown that the size of grip        is compatible with this cultural-shaping hypothesis.
                         aperture also has a SNARC-like effect, in which small          Furthermore, the SNARC effect tends to be reversed
                         numbers are responded to more quickly by closing the           in adult Iranian individuals, who write from right-to-
                         hand, and large numbers by opening the hand19. Taken           left4. Studies of cultural influences on the SNARC effect
                         together, these results indicate that numerical–spatial        remain scarce, and are difficult because mathematical
                         interactions occur in effector-independent, stable             conventions are now essentially universal. For instance,
                         spatial-coordinate frames (that is, at a level of spatial      Japanese participants respond faster to small numbers

NATURE REVIEWS | NEUROSCIENCE                                                                                       VOLUME 6 | JUNE 2005 | 437
                                                      © 2005 Nature Publishing Group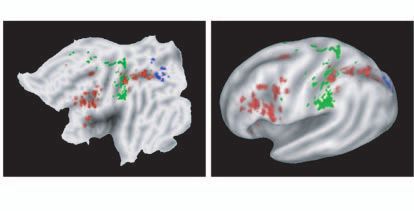
REVIEWS
with a lower response button and large numbers with an authors suggested that the common deficit linking the
upper response button27, despite the fact that Japanese symptoms in this patient was a deficit in visuospatial
people write either left-to-right (as for Western indi- manipulations, which is consistent with our hypothesis
viduals) or top-to-bottom (which would predict the of numerical–spatial interaction in the parietal lobe.
converse SNARC effect). It is possible that this is due to However, interpretation of such symptom-association
graphing conventions (in which small = bottom left). data remains complicated because it could be due to
Moreover, the SNARC effect seems to be subject to the mere anatomical proximity of functionally-dis-
contextual influences. In one experiment28, participants tinct systems. Indeed, many studies have questioned
were presented with a magnitude task (judging whether the unity of Gerstmann’s syndrome by showing that its
a number was larger or smaller than 5) after being defining features can be dissociated in both patient34
primed with an image of either a ruler or a clock. After and intracranial-stimulation studies36.
being primed with a ruler, the standard SNARC effect Another classic study that indicates a connection
was observed: participants responded to smaller num- between number and space is the work of Spalding
bers more quickly when the responses were made on and Zangwill37 on a patient who experienced number–
the left side of space, and responded to larger numbers form synaesthesia before he suffered a gunshot wound,
more quickly when responses were made on the right which entered near the right angular gyrus and lodged
(small-left, large-right). However, after being primed near the left temporal–parietal junction. Five years
with a clock-face, participants showed a reverse SNARC after injury he still complained of spatial problems and
effect (small-right, large-left), which is consistent with showed considerable difficulty with calculation tasks.
the representation of time on the clock face. In addition, the patient complained that his synaes-
In this context, it is particularly interesting to note thetic number form, as well as his spatial forms for
that not only numbers, but other culturally learned months, days of the week and letters of the alphabet,
sequences, such as month names or days of the week, can were no longer distinct.
also induce SNARC effects29,30. These findings also raise Recent studies38,39 that investigated distortions
the issue of whether it is the ordinal or cardinal semantic in number processing in patients with hemi-spatial
content of numbers that is crucial for the SNARC effect, neglect due to brain damage in the right hemisphere
a question that remains to be investigated. also support a fundamental connection between
Finally, we note that, although most subjects are number and space. Participants with neglect tend
unaware of spatial–numerical interactions, a small to ignore the contralesional (usually left) portion
group of people experience vivid images of spatially of space, particularly when contralesional stimuli
extended ‘number forms’ when they process numbers compete with ipsilesional stimuli. Furthermore,
BOX 1. In the future, studies of this particular form of neglect can extend to imagined representations of
synaesthesia for numbers, using rigorous psychophysi- space (representational neglect)40 (FIG. 2a). In a classic
cal and neuroimaging protocols, might further illumi- test of neglect, in which patients are asked to bisect
nate our understanding of the connections between a line, they neglect the left portion of the line, and
numbers and space31,32. so place the perceived midpoint of the line to the
In summary, various protocols indicate that num- right of centre41. In a recent study 38, patients with
bers automatically elicit task-, modality- and effector- neglect were asked to state the midpoint number of
independent spatial representations, even when these various numerical intervals (for example, to give the
spatial representations are not strictly relevant to the numerical midpoint of 3 and 12). Remarkably, they
task. Although cognitive and cultural factors clearly responded with numbers that deviated to the right,
have a part in the orientation of these effects, the that is, towards larger values, despite the fact that both
existence of numerical–spatial interference is robust. the problem input and the subject’s response were
Below, we relate these effects to monkey physiology given in a non-spatial spoken form. However, with
and human neuroimaging studies of parietal regions very small lines, and with small numerical intervals,
that are involved in the appropriate representation of a ‘cross-over’ effect was observed, in which patients
numbers and space. deviated to the left in line bisection, and towards
smaller numbers in numerical interval bisection.
Neuropsychological studies This numerical bias reflects a purely representational
Another source of evidence for numerical–spatial form of neglect40, and indicates that numerical bisec-
interactions comes from joint deficits of space and tion involves an internal stage of representation on a
number that are frequently observed in patients with spatially oriented ‘number line’. Patients with brain
lesions of the parietal lobes. Classic evidence for this damage in the right hemisphere but no neglect do
comes from studies of patients with Gerstmann’s syn- not show this pattern38. A second study showed that
drome, which often involves dyscalculia and spatial these representational deficits extend to the clock
problems, such as left–right confusion and finger agno- and ruler tasks described above39 (FIG. 2b). Wearing
sia33–36, and is classically associated with lesions to the leftward-adapting prisms tends to obviate both
left angular gyrus. Recently, a case of pure Gerstmann’s spatial42,43 and representational neglect44, including
syndrome due to a small lesion beneath the left angu- numerical neglect45, which further indicates that the
lar gyrus was identified35. After substantial testing neural mechanisms that underlie spatial abilities are
of all the elements of Gerstmann’s syndrome, the crucial for certain numerical tasks.
438 | JUNE 2005 | VOLUME 6 www.nature.com/reviews/neuro
© 2005 Nature Publishing Group
REVIEWS

                          Box 1 | Number forms
                          In 1880, Nature published two articles by Sir Francis               a
                          Galton entitled ‘Visualised numerals’ in which he
                          reported a peculiar phenomenon: to otherwise normal
                          people, numbers seemed to occupy very precise locations
                          in space, forming two- or three-dimensional objects of
                          different shapes and orientations146,147.
                            More than 120 years later, we identified a French
                          individual who was unaware that the phenomenon
                                                                                              b
                          existed in others, yet reported a number form similar to
                          one of Galton’s subjects. Galton’s subject’s number form is
                          shown in panel a. This number form shows cultural
                          influences, as the first section (1–12) clearly resembles
                          the face of a clock. Beyond 12, note the repeated volutes
                          for successive decades. Panel b shows the number form
                          reported by our French subject (M.P., P.P. and S.D.,
                          unpublished observations), which also shows a clock-like
                          organization for 1–12, and repeating volutes beyond that.
                            Such reports32 indicate that number forms are not mere
                          figments of the imagination, but a constrained experiential phenomenon, which is probably subject to both
                          neurobiological and cultural influences. Indeed, number forms often represent number as a continuous line, subject to
                          compression for larger numbers, similar to the ‘number line’ representation that can be inferred from chronometric and
                          neuroimaging data in people who do not report having an explicit number form. Some individuals even report that they
                          see days, months or other temporal sequences as having a spatial layout148 similar to spatial number forms, consistent
                          with the presence of a spatial–numerical association of response codes (SNARC) effect for these stimuli29,30. Introspective
                          reports indicate that the number forms are mentally represented as visual objects and can be subjected to visuospatial
                          transformations like rotation or zooming. Such individuals report that they can observe their forms from different
                          perspectives, sometimes situating themselves directly on the forms, and that they can zoom in and out on different
                          segments of these forms32,147. Self-reports also indicate that the number forms spontaneously arise at a young age.
                            Number forms might be considered to be a type of synaesthesia, which is a relatively rare condition (at least 1 in
                          2,000) in which stimulation of one sensory modality causes experiences in a second, unstimulated modality (for
                          reviews, see REFS 148,149). For instance, colour is frequently and automatically associated with sounds or visual
                          graphemes. Imaging studies have shown that colour-selective regions of the cortex are active when synaesthetes
                          experience colours, whether they are induced by tones150,151 or by graphemes152. Other recent data show increased
                          activity in the mirror neuron system of an individual who experiences ‘seen’ touches on others as ‘felt’ touches on the
                          corresponding body part153.
                            The extent to which number–form synaesthesia depends on the same mechanisms as the numerical–spatial
                          interactions described in non-synaesthetic observers remains an open question. However, it seems plausible that
                          number–form synaesthesia arises from similar brain mechanisms of genetically-mediated cross-activation, in this
                          case, between spatial and numerical representations in the parietal lobe. We propose that there might be an early
                          predisposition for seeing such forms, possibly due to the existence of exuberant random connections between the
                          cortical representations of numbers and space in these individuals1,148. However, the existence of recurrent themes
                          more than a century after Galton’s original report indicates that culture also has some influence on the shaping of
                          number forms in synaesthesia. Future research on number–form synaesthesia should use both rigorous
                          psychophysical and brain imaging methods to explore such properties as automaticity, spatial frames of reference
                          and cultural influences to reveal the underlying brain mechanisms. Panel a reproduced, with permission, from
                          REF. 146 © (1880) Macmillan Magazines Ltd.

                             Joint deficits of space and number can also be              of space. Conversely, in the case of the rTMS study,
                         induced by repetitive transcranial magnetic stimulation         stimulation over the left angular gyrus led to impaired
                         (rTMS) in healthy individuals. Performance on both a            performance on larger numbers, which are associ-
                         visuospatial search task and a numerical comparison             ated with faster responses on the right side of space.
                         task can be disrupted by rTMS over the left angular             Therefore, the lesion data and the reaction time data
                         gyrus, but not by rTMS over the left supramarginal              both indicate a left-to-right orientation for the mental
                         gyrus or corresponding sites in the right hemisphere46          number line.
                         (FIG. 2c). Importantly, these results, like those discussed        In general, these results indicate that numeri-
                         above in connection with the SNARC effect and lat-              cal manipulations crucially depend on intact spatial
                         eralized presentation (see FIGS 1a and 1d), show clear          representations, and that the neural mechanisms of
                         hemispheric and visual field asymmetries. In patients           numerical–spatial interactions might be the same as
                         with right hemisphere lesions, it is the smaller numbers        those that subserve spatial cognition in the intact brain.
                         that are associated with faster responses to the left side      One caveat is that both lesions and rTMS are likely to

NATURE REVIEWS | NEUROSCIENCE                                                                                          VOLUME 6 | JUNE 2005 | 439
                                                      © 2005 Nature Publishing Group
REVIEWS
a b Numerical bisection task The triple-code model of number processing48
proposes that numbers can be mentally represented
Error (absolute
2
magnitude)
1 in a visual system, a verbal system and a non-verbal
0
quantity representation, which depend on differ-
123456789
5 7 9 ent neural substrates. The visual system, in which
–1 Number distance numbers can be encoded as strings of Arabic numer-
Number comparison task als, probably depends on ventral occipito-temporal
2,000 structures. The verbal system, in which numerals are
Reaction time (ms)
represented lexically, phonologically and syntacti-
1,400
cally, probably depends on left frontal and temporal
800
language areas, much like other types of words. Most
important for our purposes here is the quantity
200 system, which provides a semantic representation
01 2 3 4 5 6 7 8 9 of the size and distance relations between numbers,
Number presented
c
is thought to be located in the parietal cortex, and
800 800 might be crucial for mediating the observed inter-
Reaction time (ms)
Reaction time (ms)
750 750 actions between numerical and spatial representa-
700 700
650 650
tions.
600 600 Functional MRI (fMRI) has been used to test
550 550 this model and to precisely localize the non-verbal
500 500 quantity system. The results indicate that numeri-
450 450
30 50 70 90 110 30 50 70 90 110 cal tasks typically involve a distributed network
Number presented Number presented of areas, including the frontal cortex and the left
Figure 2 | Lesion evidence for interference between numbers and space. a | Patients and right parietal lobes49–56. Here we focus on the
with right parieto-temporal lesions often neglect the left side of space, including that in internal role of the parietal cortex in these tasks. In some
mental images. When asked to report all the objects in their mental image, they tend to omit experiments, participants are asked to compare two
those on the left side of space. b | Neglect patients also show severe deficits in numerical numbers and decide which is larger50,51. An identical
comparison and bisection tasks. The image (right) represents a metaphor of neglect on the
behavioural distance effect is observed, regardless
mental number line. The first graph shows the deviation on a numerical bisection task, in which
subjects are asked to give the number closest to the middle of various numerical intervals, as a of whether the numbers are presented as digits or
function of interval size. For most intervals, patients with neglect deviate towards larger values as words. fMRI indicates that the activation of the
(those greater than 0), whereas for the smallest numerical interval, patients deviate towards left and right intraparietal sulci (IPS) shows a tight
smaller values, which is consistent with the ‘cross-over’ effect that is also observed in spatial correlation with the behavioural-distance effect. The
line bisection. The second graph shows the reaction times taken to decide whether a number activation signal in this region also shows an inverse
is less than or greater than 5. For target number 4, which is reported to be left of the midpoint,
relationship to the distance between the numbers
reaction times are differentially slowed, which indicates a difficulty in shifting attention to the left.
c | Participants with a ‘virtual lesion’ caused by repetitive transcranial magnetic stimulation
being compared. On the basis of this and other
(rTMS) show interference in both numerical comparison and visuospatial tasks. In particular, fMRI experiments of arithmetical tasks, such as
when rTMS is applied to the left angular gyrus (left graph; blue symbols), at a site selected comparison, calculation53, approximation49 or even
because its stimulation interferes with visual search, number comparison performance is the mere detection of digits54, a recent meta-analysis
slowed compared with the no stimulation condition (yellow symbols), particularly when indicated that the bilateral horizontal segment of the
responding to a number greater than the standard (red hashed region indicates significant IPS (HIPS) might have a particular role in the quan-
difference). A symmetrical, although nonsignificant, deficit was observed for numbers smaller
than the standard when stimulation was applied to the right angular gyrus (right graph).
tity representation57. In some cases, the activation
The brain image show the sites of stimulation by transcranial magnetic stimulation. Panel b extends to dorsal parietal sites that are thought to be
modified, with permission, from REF. 38 © (2002) Macmillan Magazines Ltd and REF. 39 involved in spatial attention orientation.
© (2004) Masson; panel c modified, with permission, from REF. 46 © (2001) Elsevier Science. Crucially, it should be noted that the quantity
system in the parietal lobe might be part of a broader
network of areas that are involved in non-numerical
affect several cortical regions and could, therefore, magnitude representation51,58. Pinel et al. recently
cause many independent impairments. This indicates measured parietal activation in response to three
the need for more fine-grained analysis of the neural tasks: luminance comparison, size comparison and
substrates of these functions, which would be possible numerical magnitude comparison50,51. Because all
if patients with small focal lesions were tested. three tasks show a distance effect, it was possible to
match task difficultly by varying the discriminability
The parietal basis of number processing of the stimuli for each individual. fMRI revealed a
The past 10 years have seen an explosion of interest in network of areas that were activated in each of the
the neural basis of basic mathematical processes such three tasks, with the IPS showing partial specificity,
as subitizing, addition, subtraction and multiplica- but also considerable overlap, among the three dimen-
tion1,47. One of the main suggestions from this line of sions. Interestingly, the amount of overlap predicted
research is that the neural circuitry that is crucial for the presence of cross-dimensional interference. In
abstract representations of quantity is housed in the particular, number and size activations overlapped
parietal lobe, in regions that overlap with the neural within the HIPS, and those dimensions interfered in
circuitry involved in spatial representations. behavioural response time measures.
440 | JUNE 2005 | VOLUME 6 www.nature.com/reviews/neuro
© 2005 Nature Publishing GroupREVIEWS
To further investigate the neural basis of the had been trained to perform a visual number match-to-
quantity system, Simon et al.59 used fMRI to examine sample task. Many neurons were tuned to a preferred
the topographical relationship of calculation-related numerosity; some responded preferentially to sets of
activation to other spatial and language areas in the one object, others to two objects, and so on, up to five
human parietal lobe. They found that manual tasks objects. The tuning was coarse, and became increas-
(grasping and pointing) activated a large overlapping ingly imprecise as numerosity increased. Importantly,
region in the anterior parietal cortex, with the greatest these neurons were originally observed in the dorso-
extent of activation seen for grasping, which activated lateral prefrontal cortex, but, more recently, another
an additional anterior parietal region bilaterally (pos- population of neurons with a shorter latency has been
sibly coinciding with the ANTERIOR INTRAPARIETAL area found in the parietal lobe69,70. These neurons, although
(AIP), see below). Posterior to this was a region that broadly distributed, were mostly clustered in the depths
was selectively activated by calculation alone (spe- of the IPS, a location that is a plausible homologue of
cifically in the IPS). The posterior parietal cortex was the human HIPS area, which is active during many
activated by all visuospatial tasks (grasping, pointing, number tasks47. However, it is worth noting that at most
saccades and spatial attention), which is consistent 18% of neurons in this region were tuned to numerosity.
with previous data60. Finally, calculation and pho- The intermixing of neurons from many unrelated types
neme detection jointly activated a portion of the IPS might explain a recent failure to observe human IPS
lying underneath the left angular gyrus. Overall, these activation in response to numerosity stimuli relative to
results indicate that calculation activates the fundus colour or shape tasks using fMRI76.
of the IPS, a region closely surrounded by a geometri- Recently, an adaptation method was used to inves-
cally reproducible array of areas that are involved in tigate whether such numerosity tuning also exists
manual, visuospatial and verbal tasks. in humans77, and so to link human fMRI responses
As described above, not only numbers, but also to those obtained with monkeys. During fMRI, we
other ordered sequences, such as days of the week repeatedly presented sets of a fixed number of dots
and months of the year, are able to induce the (for example, 16 dots). The purpose was to ‘adapt’ the
SNARC effect29,30. Another region that might be of neural population coding for this value, leading puta-
interest for mediating these behavioural effects is tive human number neurons to progressively reduce
the left angular gyrus57, which might be connected their firing rate, as observed in electrophysiological
with basic numerical representations in the IPS, and experiments with macaques78. We then presented
is also involved in verbal processing59. Given that occasional deviant numbers that ranged from half to
cardinal and ordinal information can be dissociated twice the adapted number. fMRI revealed that only
in patients with angular gyrus lesions61 it is possible two regions, the left and right IPS, responded to the
that, in addition to numerical representations in the change in numerosity by increasing their activation
IPS, linguistically-learned sequences in the angular in relation to the ratio between the adapted number
gyrus might be important for understanding the and the deviant one, regardless of the direction of the
origin of these numerical–spatial interactions. In change (more or less dots).
this respect, it might be interesting to test patients These human fMRI and monkey electrophysi-
who show such dissociations in the SNARC task and ological data yielded similar tuning profiles, which
other similar tasks to determine the extent to which suggests that humans and macaques have similar
numerical–spatial associations depend on cardinal populations of intraparietal number-sensitive neu-
and ordinal information. rons. In both the single-unit recording studies and
the human fMRI study, responses closely match
Number-sensitive neurons predicted responses from computational models79,80.
Several animal species spontaneously keep track of Specifically, the firing rates assume a Gaussian dis-
numerosity 62–64, and can be trained to use symbolic tribution only if plotted on a logarithmic scale. This
representations of numbers in a variety of tasks65–67. logarithmic compression is commonly seen in human
Furthermore, physiological recordings have shown numerical tasks81, and is reflected in the frequency
that there are neurons in the parietal cortex of cats68 of use of number words in many of the world’s lan-
and macaque monkeys69,70 that respond selectively guages82. Therefore, even the detailed properties of
to numbers (for a recent review, see REF. 71). Human numerical abilities can be related to the responses
infants also respond to numerosity72. These results of neurons in the parietal cortex.
indicate that there might be an evolutionary necessity
to keep track of the number of objects and events in Physiological studies of spatial cognition
the environment, and that, at least at a rudimentary In addition, recent work in both electrophysiology
ANTERIOR INTRAPARIETAL level, the ability to estimate numerosity might be and neuroimaging has begun to converge on specific
(AIP). A region in the anterior present in many non-human animals and in pre- cortical regions as the possible neural basis for the
portion of the IPS that is verbal human infants. It is thought that the adult com- spatial representations that interfere with number
involved in fine grasping petence for arithmetic arises from this fundamental processing. Spatial cognition depends on a network
behaviours. Neurons in this
area respond to both visual and
‘number sense’73. of frontal, parietal and hippocampal regions. In
tactile stimuli, with receptive Recently, Andreas Nieder and Earl Miller70,74,75 this review, we concentrate on parietal regions for
fields that move with the hand. recorded from single neurons in awake monkeys that two main reasons: specificity and proximity. First,
NATURE REVIEWS | NEUROSCIENCE VOLUME 6 | JUNE 2005 | 441
© 2005 Nature Publishing GroupREVIEWS
a On the basis of architectonic84, connectivity85,86 and
AIP LIP VIP Intraparietal sulcus physiological criteria87,88, the macaque IPS has been
divided into several subregions that represent space in
various frames of reference. Although a consensus is
emerging, considerable debate remains about the precise
boundaries and extent of these regions, which depend
on whether anatomical, connectivity or functional
criteria are used.
b Many neurons in macaque area LIP represent target
Subtraction task
position in an eye-centred frame of reference89 and are
highly active during memory-guided saccades90,91. That
Ocular saccade task is, when the eyes are directed to different locations in
the visual field, the position of the best visual stimulus
Grasping task moves the same amount. Furthermore, these neurons
are involved in spatial updating, even before an eye
movement is made89,92.
c
Regions medial to area LIP seem to be more
involved in coding the location of an intended reach
(parietal reach region; PRR)93,94, although still in an
eye-centred coordinate frame95, which indicates that
it could have a role in reach guidance and hand–eye
coordination. Whether these responses relate to the
specific intention to perform an action or to attention
to a spatial location is still being debated87,88.
Number habituation Shape habituation
Saccades Size distance effect Area VIP, on the other hand, represents targets in
Grasping Numerical tasks a head-centred frame of reference, or with receptive
Figure 3 | Location of numerical processing relative to the regions of the intraparietal fields that are partially shifting or gain-modulated
sulcus involved in space and grasping. a | Monkey anterior intraparietal (AIP), lateral by eye position96,97. That is, when the eyes are moved
intraparietal (LIP) and ventral intraparietal (VIP) regions based on the partitioning scheme of around in the visual field, the best stimulus location
Lewis and Van Essen84 on the flattened cortex (left) and inflated brain (centre). Black lines
either remains fixed relative to the position of the
indicate boundaries between regions. Yellow line (right) indicates the fundus of the
intraparietal sulcus (IPS). Produced using the Sums Database. b | Putative human head (head-centred) or shifts part-way between
homologues of the monkey regions described in (a)59. Colours indicate areas activated the position relative to the eyes and that relative to the
during performance of different tasks. Human reaching regions might correspond to monkey head (partially-shifting receptive fields). In addition,
area AIP, whereas human saccade regions might correspond to monkey area LIP, which unlike area LIP, which responds only to stimuli in the
shows that the overall organization of the monkey IPS is conserved in the human. On the visual modality, many VIP neurons have joint tactile
basis of these anatomical and functional landmarks, brain activation during arithmetic in the
and visual motion-determined receptive fields97, and
human roughly overlies area VIP in the monkey (see main text for more details). Monkey and
human brain renderings were produced using Caret software154,155 and the Sums Database.
are strongly driven by optic flow fields98,99. Finally, area
c | Horizontal slices that show, in more detail, the same posterior–anterior parietal LIP codes for far space, whereas area VIP codes for
organization across tasks in humans as described above. Placement of slices is shown on near (and even ‘ultra-near’) space91,96,100.
the right. As shown in (b), the regions involved in grasping lie in the most anterior area, and Area AIP represents space in hand-centred coor-
regions involved in saccades lie in the most posterior area59. Between these regions are dinates, and is crucial for fine grasping101,102. Neurons
many areas that are involved in visuospatial and numerical tasks57. Although tentative, it in this area are bimodal (visual–tactile)101,103,104, so that
seems that there is greater overlap for these tasks in the right hemisphere than in the left,
most strikingly in the right anterior IPS. Note the proximity of the posterior areas involved in
when the hand moves, the visual receptive field remains
saccade tasks and numerical tasks. Each coloured outline represents the extent of activation in a fixed position relative to the hand. Neurons in
in each study. See colour code for tasks used in each study. Number and shape habituation this area, in combination with the CAUDAL INTRAPARIETAL
data taken from REF. 77; size distance effect data from REF. 51. (CIP) area, which extracts three-dimensional shape,
are crucial for correctly reaching and grasping three-
dimensional objects105,106 and tools107–109.
although frontal regions are involved in both spatial
and numerical tasks, such overlap seems nonspecific Neuroimaging studies of spatial cognition
and is found in a broad variety of tasks83. By way of Recent neuroimaging studies have identified puta-
comparison, parietal activations are related to a more tive human homologues of macaque IPS regions110
restricted set of cognitive processes. Second, the close (FIG. 3). Such homologies are highly tentative, both
proximity of spatial and numerical representations in because the parietal (and frontal) cortex is differen-
CAUDAL INTRAPARIETAL
(CIP). A region at the posterior the parietal lobe increases the probability that there tially expanded in humans compared with similar
end of the IPS that is involved in are neural interactions that might mediate the behav- regions in macaques111, especially in the region of the
the analysis of three- ioural interactions described above. Hippocampal inferior parietal lobule and mid-IPS59, and because
dimensional shapes. Signals and parahippocampal regions, although clearly direct comparisons between monkey and human fMRI
from area CIP are sent to area
AIP, where they are integrated
involved in spatial cognition, are not known to con- responses to the same stimuli have revealed important
to plan the grasping of three- tain numerical representations that might support differences112,113. Nevertheless, the overall pattern of
dimensional objects. such behavioural interactions. posterior-to-anterior organization, with a systematic
442 | JUNE 2005 | VOLUME 6 www.nature.com/reviews/neuro
© 2005 Nature Publishing GroupREVIEWS
a d Area LIP. Sereno et al.118 have identified a region of
the posterior IPS that is thought to be homologous to
Right LIP
Right LIP monkey area LIP. This region is active when humans
make saccades to targets in different locations in space.
By presenting the targets in a fixed order, around the
perimeter of an imaginary circle, it is possible to dem-
onstrate that this region shows retinotopic responses in
the human similar to those seen in the monkey119.
In addition, recent studies have shown that this
region responds in an effector-independent man-
Left LIP
Left LIP ner120,121. For example, Astafiev et al. report that the
b e anterior IPS is jointly active for attending, pointing
Left-left Before 1st saccade After 1st saccade and making saccades to peripheral targets120 (for con-
verging data, see REF. 59). Using a surface-based warp-
ing procedure, they then aligned human anatomical
landmarks with macaque anatomical landmarks. The
Left-right
activity in this study overlapped considerably with
anatomically-defined LIP in the warped macaque
50 ms
On Off atlas, which indicates homology between macaque
c Stimulus f Left LIP Right LIP area LIP and this region in humans. Interestingly, this
1.2 0.8
1
effector independence differs from the distinction
0.6 between area LIP and PRR described in macaques93,94.
0.8
% bold
0.6 0.4 This might be due to the lower resolution of fMRI, to
0.4 0.2 species differences (for example, increased hand–eye
0.2 coordination in humans) or to the fact that fMRI and
0
0 single-unit physiology tap into different physiologi-
Saccade beginning 1st 2nd
–0.2 1st 2nd –0.2
Left-right
cal mechanisms (that is, local field potential versus
Left-left
spikes)122,123. Future studies will need to investigate
Figure 4 | Spatial updating in the lateral intraparietal area. In monkeys89,92 and humans124,125,
this issue in more detail.
the spatial updating of attention to a target location leads to increased activation even when there
is no physical stimulus. a | Approximate location of macaque lateral intraparietal (LIP) area is
Another parallel between macaque and human area
indicated by the red hashed region. The posterior intraparietal sulcus (IPS) is indicated in green. LIP is the involvement of these areas in spatial updat-
Brain rendering and automatic sulcus identification were performed using BrainVisa/Anatomist ing124,125. In a recent study124, participants were asked to
software. b | In this experiment, monkeys were shown a target (red star) and a reference point perform a double-saccade task (FIG. 4). Each trial started
(black dot) (top left panel). Single-unit physiological studies show that neural activity continued with participants fixating a central cross and two periph-
even after the stimulus had been turned off, which indicates that the monkeys were able to eral targets (a cross and a spot). Participants performed a
remember the location of the target in relation to the reference point (top right panel). c | Crucially,
when the monkey makes an eye movement that will bring a target into the neuron’s receptive
saccade to the peripheral cross, and then prepared a sec-
field (dashed circle in the top left panel), neural activity increases, even prior to the onset of the ond saccade to the final target (the spot). However, on
saccade. Initially, there is no stimulus in the neuron’s receptive field, and, correspondingly, neural half the trials, after the first saccade the spot reappeared
activity is low in area LIP. However, just before making a saccade that brings the stimulus location on the opposite side of the cross from its initial position.
within the receptive field, neural activity increases, which shows that the memory of the target has Using event-related fMRI, it was possible to show that
been updated to reflect the new position in eye-centred coordinates. d | Approximate location of when the position of the target moved, the neural activ-
human area LIP is indicated by the red hashed region, with the posterior IPS indicated in green.
ity in area LIP also shifted, to represent the new spatial
The anterior IPS is indicated in yellow. e | In a double saccade paradigm, participants see a red
cross, then a brief green target. Participants first make a saccade to the position of the red cross, location of the target in eye-centred coordinates.
and then, only after a delay, to the remembered location of the green target. Crucially, on half the
trials, when participants make the first eye movement to the red cross, the target changes sides, Area VIP. As it is known that monkey area VIP
for example, from the left to the right side of fixation (left-right trial). Therefore, participants must responds well to motion in any sensory modality,
re-map the position of the target in eye-centred coordinates. f | The presentation of the initial regions of the human IPS that respond multimodally
target to the left of fixation leads to increased activity in right area LIP. When the remembered
to motion might be plausible homologues of monkey
saccade target remains to the left of fixation (left-left trial), activity in right area LIP remains high.
However, when the remembered saccade target shifts to the right of fixation (left-right trial),
area VIP. Following this logic, Bremmer et al. tested
activity in right area LIP decreases, and activity in left area LIP correspondingly increases, which for regions that were conjointly activated by visual,
shows spatial re-mapping. Panels b and c modified, with permission, from REF. 92 © (1992) tactile and auditory motion126. Only one such region
American Association for the Advancement of Science; panels e and f modified, with permission, was identified in the fundus of the IPS, anterior to
from REF. 124 © (2003) Society for Neuroscience. area LIP, consistent with the known organization in
the monkey. However, given the increased area of the
mid-IPS that is described above, this is perhaps the most
transformation from sensory to effector-specific pro- tentative homology, and further studies will be required
perties, presents a striking parallel with that observed to confirm this proposed connection.
in previous studies of monkey physiology114. Three
of these putative homologues — areas LIP, VIP and Area AIP. Neurons in monkey area AIP respond in a
AIP — are of particular relevance here, although other hand-centred manner and are involved in fine grasp-
potential homologues have been identified115–117. ing, but not necessarily in the transport phase of the
NATURE REVIEWS | NEUROSCIENCE VOLUME 6 | JUNE 2005 | 443
© 2005 Nature Publishing GroupREVIEWS
a b
Right functional landmarks Left cortical flat map Right cortical flat map
RH Quantity estimation task
Number comparison task
LH
Approximate addition task
Left functional landmarks
AIP-related areas
LIP-related areas Subtraction task
VIP-related areas
CIP-related area
MIP-related area
Figure 5 | Numerical tasks and intraparietal regions. a | Flattened human left (LH) and right (RH) hemispheres showing
the peaks of various studies aimed at identifying human homologues of macaque regions. The regions shown are the lateral
intraparietal (LIP) area59,118,121,124 (dark blue), the ventral intraparietal (VIP) area126 (red), the anterior intraparietal (AIP)
area59,106,127–133 (green), the medial intraparietal (MIP) area115 (turquoise) and the caudal intraparietal (CIP) area116 (purple). Brain
renderings were produced using Caret software. b | Overlaid onto these maps is the activation shown in four different types of
numerical study — addition57, subtraction53, estimation52 and comparison51. Estimation and comparison activated fairly
circumscribed regions, roughly overlapping with the human homologue of area VIP, which is consistent with macaque
physiology data. In the left hemisphere, numerical activations tend to overlap more with area VIP, whereas in the right
hemisphere, numerical activations tend to extend more anteriorly towards area AIP, which indicates possible hemispheric
asymmetries in these tasks. However, addition and subtraction activated larger networks, extending posteriorly towards area
LIP. Although tentative, these results are consistent with our hypothesis that numerical operations might also depend on
VIP–LIP circuitry and interactions.
action. Several studies have used these properties to consistent with the localization of monkey numerosity-
try to identify a human homologue of area AIP116,127. tuned neurons in the fundus of the IPS, close to the
Others have used different properties, such as men- anatomically-defined monkey area VIP (FIG. 5). We
tal rotation128, bimodal responses129 and responses to speculate that overlap between comparison processes
tools130. In the first study of this type, regions of the IPS and spatial networks in the IPS might account for
that were activated when individuals grasped objects the behavioural interactions between representations
were identified131. Interestingly, the region identified of number and space (for a similar proposal, see REF.
overlapped almost completely with a region that was 134). At present, however, this overlap remains only
damaged in a patient who showed a selective impair- tentative, given that these regions have been defined
ment in fine-grasping behaviour131. Other studies iden- only on the basis of average foci of brain activation in a
tified a region of the anterior IPS that responded more normalized template space. Future studies should con-
strongly to grasping than to reaching127 or to finger centrate on higher resolution studies in which human
pointing59. Other studies have shown that this region homologues of areas LIP, VIP and AIP can be identified
is activated by action observation132,133. As expected in individual subjects. Once these regions have been
from monkey maps, activations in these putatively identified on an individual subject basis, the activation
homologous regions to area AIP are consistently seen in relation to number processing can be compared
located anteriorly to the activations identified in the with these predefined regions of interest.
putative human homologues of areas LIP and VIP.
Area LIP and the mental number line
Numerical tasks and IPS regions. Crucially, the HIPS On the basis of the above, we speculate that shifts of
region that has been shown to be consistently activated attention along the mental number line might be
in arithmetical tasks in humans roughly coincides with mediated by shifts of attention in area LIP in the same
the putative human area VIP. Such a co-localization is manner that shifts of attention in the external world are
444 | JUNE 2005 | VOLUME 6 www.nature.com/reviews/neuro
© 2005 Nature Publishing GroupYou can also read


