An assessment of Urban Ngahere (Forest) cover
 and distribution within the Ōtara-Papatoetoe
                  Local Board
←
→
Page content transcription
If your browser does not render page correctly, please read the page content below
An assessment of Urban Ngahere (Forest) cover
and distribution within the Ōtara-Papatoetoe
Local Board
Overview
The Ōtara-Papatoetoe Local Board has provided Local Development Initiative funding to complete a
program of work to develop a detailed Ngahere (Forest) Knowing report. Councils’ Senior Urban
Forest Advisor, Parks Sport and Recreation has managed the work program.

The reports detail is based on the analysis of urban tree data from 2013; to determine a baseline
measure of the tree cover in the local board area. An updated comparison of this canopy cover
assessment work is going to be presented to council in September 2019, and following on from this,
an update will be presented to the local board on change findings and included in this report as an
updated chapter.

‘Urban Ngahere’, or ‘urban forest’, comprises all the trees within a city – including parks, coastal cliffs,
stream corridors, private gardens, and street trees – both native and naturalised (i.e. exotic). For the
purposes of this report, urban forest is defined as all of the trees and other vegetation three metres
or taller in stature, and the soil and water systems that support these trees. A healthy urban forest
provides a multitude of benefits for ecosystems, the economy, and community health and well-being.

Auckland’s urban forest is remarkable and special, and likely to be the largest and most varied
collection of amenity trees on public and private land in the country. However, rapid population
growth and recent legislative change to the Resource Management Act is leading to significant
changes in the urban landscape, which is reflected in the scale, maturity, and size of the urban forest.

The report aims to highlight the need for consideration of, a recommended ongoing annual funding
program for new tree plantings on local parks, reserves and streets to increase the tree canopy
coverages. The necessity of increasing tree plantings to increase overall tree cover in the local board
area is highlighted by the statistic of a current canopy cover of 9.1%. This is the second lowest
percentage of tree cover across any board in the Auckland region.

The current pressure on land use and the enabling of development growth presents serious issues
around tree protection and trying to preserve larger trees in an area that already has low tree cover.
Significant work is necessary by council, the local board, other government agencies, developers and
land owners in the area to look at better opportunities to enable funding of new tree plantings. New
tree plantings for and by the communities of the right trees in the right places will help provide long
term benefits for the growing community in Ōtara-Papatoetoe.
EXECUTIVE SUMMARY

This report outlines the distribution, ownership, and protection status of urban tree cover within the
Ōtara-Papatoetoe Local Board area. The report aims to provide a detailed evidence-based approach
to ensure decision-makers are well-informed on the scale, health and diversity of the urban trees in
their local board area. This information will enable the development of a sound and structured
approach to help urban forest management for future decision makers in the Ōtara-Papatoetoe Local
Board. The details help provide background information direction and context to the need to fund
and develop ongoing an urban forest Growing programme in the Ōtara-Papatoetoe Local Board area.

One of the most critical issues relating to urban forest in Auckland, and likely one of the most
important unknowns, is the rate of change in the urban forest canopy extent, including the numbers
and sizes of trees being removed per annum across the Auckland region. Prior to the analysis
presented in this report, the Council had no reliable information on the extent, ownership, and
protection status of Auckland’s urban forest assets.

The data presented in this report includes a snap-shot of urban forest cover from 2013, sourced
through a measure of canopy distribution and height within the Ōtara-Papatoetoe Local Board area.
The data presented in this report is based on an analysis of 2013 LiDAR (Light Detection and Ranging)
data captured jointly by NZ Aerial Mapping and Aerial Surveys Limited for Auckland Council. Auckland
Council has undertaken a second aerial LiDAR survey of a similar nature, completed in 2017, which is
currently being analysed to determine possible changes in urban forest cover and associated
attributes. A report on this regional analysis work is going to be presented to council Environment
Committee in September 2019, it is expected that early results will be available on the changes that
are taking place in the tree cover of the region.

Based on the 2013 dataset, urban forest covers approximately 9.1% of the local board area, including
6.4% of roads, 13.1% of public parks, and 8.4% of private land. Total coverage is low when compared
to other urban local boards within the Auckland metropolitan area. Approximately 37% of the urban
forest cover has some form of statutory protection. There are over 180 records of Notable Trees or
groups of trees on the Unitary Plan Scheduled within the local board area.

The Auckland Urban Forest Strategy aims to encourage tree plantings across the region to achieve an
average cover of 30%, with no individual local board having less than 15% cover. A goal that achieves
an even coverage of urban tree cover across the whole board area is recommended to give the
community increased opportunity to interact with the Ngahere in their local area. As one of the aims
of the local board is to help support local community, annual tree planting and restoration projects,
along with looking at incentives to retain existing trees, could be concentrated in areas where known
gaps exist.

There are some obvious gaps in tree cover throughout the Ōtara-Papatoetoe Local Board area, mainly
in commercial and industrial centres and larger recreational reserves. This presents multiple
opportunities to plant more specimen park and street trees. Engaging with local communities to help
with greening in their local areas helps to strength the ownership of local trees, along side education
it is hoped that more trees will survive, as current rates of vandalism of new plantings in streets and
parks are very high.

                                                   i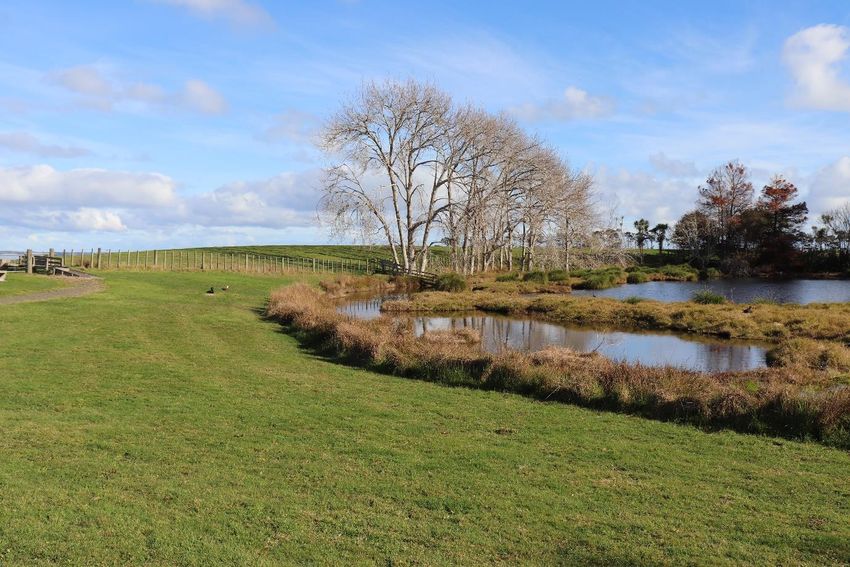
Public land is identified as a good place to focus additional urban forest planting as this offers the best
opportunities for long-term sustainable management due to the lower chance of conflict with future
housing intensification, less infrastructure conflicts (which is often an important negative associated
with street tree plantings), more considered selection of appropriate species and location for
plantings, better arboricultural management, and a coherent policy for ongoing planting of
replacement trees.

The benefits of taking a Local Board-wide approach to increasing urban forest cover includes more
considered selection of appropriate species and location for plantings, better arboricultural
management, and a coherent policy for ongoing planting of replacement trees. Public parks are also
better able to accommodate the types of large trees which provide a disproportionate amount of
many of urban forest benefits. The wider accessibility of trees on public parkland also means that the
benefits they provide (e.g. better shade and increased emotional well-being for park users) apply to a
larger number of people, which is a major positive in terms of overall cost-benefit outcomes. With the
targeted study on tree cover within parks and around playgrounds, it is possible to obtain a clear view
on where to plant more trees that will in time benefit the local community and users of open spaces.

The data presented in this report gives a good baseline on what is current and will enable comparative
change analysis to urban forest over time, which can be tracked and analysed ongoing to direct trees
planting efforts within the Ōtara-Papatoetoe area. A study of the changes and trends that are
occurring will be completed when the latest data is released, it is anticipated this will be in September
2019. Potential additional analysis of LiDAR data could be undertaken to enable better forecasting of
the possible future changes in urban forest cover and height distributions as a result of increased
population growth and intensification. The space for large trees on privately owned land is expected
to become less as the Unitary Plan enables further development intensification.

Other future areas for funding, research, and action on improving urban tree cover should look to
focus on concentrating efforts in parts of the local board with greater population densities and higher
numbers of children. Moving forward this will ensure these groups have better access to urban trees
and nature, and will adopt the approach to deliver a ngahere for a flourishing future.

                                                    ii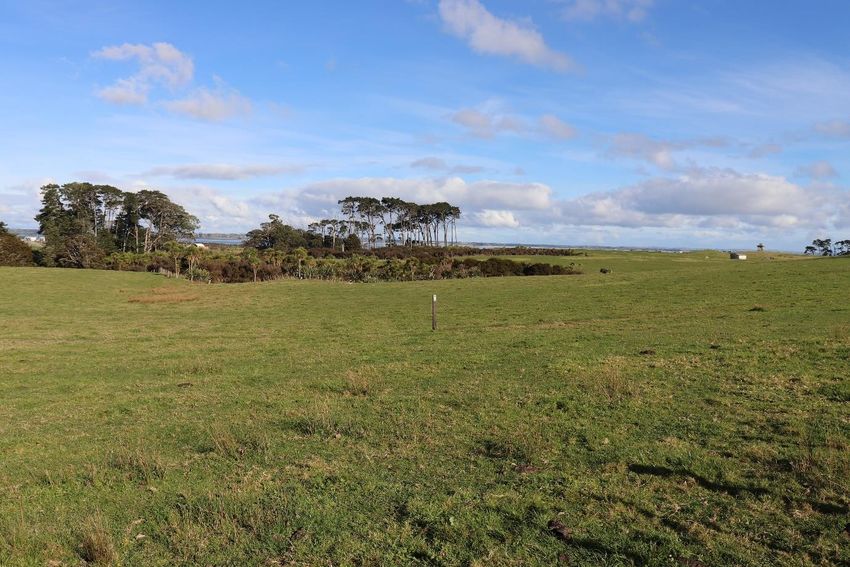
TABLE OF CONTENTS

1.0     PREFACE ...................................................................................................................................... 1
2.0     INTRODUCTION ........................................................................................................................... 2
  2.1      Overview ................................................................................................................................. 2
  2.2      What is Urban Ngahere (Forest)? ........................................................................................... 2
  2.3      Why do we want Urban Ngahere?.......................................................................................... 3
  2.4      What is the Rationale Behind Studying Urban Ngahere? ....................................................... 4
3.0     RESEARCH THEMES ..................................................................................................................... 6
4.0     ŌTARA-PAPATOETOE LOCAL BOARD INTRODUCTION AND CONTEXT ....................................... 8
5.0     METHODS .................................................................................................................................. 12
  5.1      Methodology Overview ........................................................................................................ 12
  5.2      Urban Forest Structure ......................................................................................................... 13
  5.3      Urban Forest Tenure ............................................................................................................. 13
  5.4      Urban Forest Protection Status ............................................................................................ 14
  5.5      Urban Forest in Relation to Socio-Economic Factors............................................................ 16
  5.6      Change in Urban Forest Cover 2013 – 2016 ......................................................................... 17
6.0     RESULTS..................................................................................................................................... 18
  6.1      Overview ............................................................................................................................... 18
  6.2      Urban Forest Structure ......................................................................................................... 19
  6.3      Urban Forest Tenure ............................................................................................................. 20
  6.4      Urban Forest Protection Status ............................................................................................ 24
      6.4.1        Significant Ecological Areas ........................................................................................... 24
      6.4.2        Notable Trees ................................................................................................................ 27
      6.4.3        Protection Status by Suburb ......................................................................................... 28
  6.5      Urban Forest in Relation to Socio-Economic Factors............................................................ 29
      6.5.1        Population ..................................................................................................................... 29
      6.5.2        Health ............................................................................................................................ 31
      6.5.3        Income .......................................................................................................................... 33
7.0     DISCUSSION............................................................................................................................... 34
  7.1      Urban Forest Cover 2013 Overview ...................................................................................... 34
  7.2      Urban Forest Structure ......................................................................................................... 37
  7.3      Urban Forest Tenure ............................................................................................................. 38
  7.4      Urban Forest Protection Status ............................................................................................ 40
  7.5      Urban Forest in Relation to Socio-Economic Factors............................................................ 41

                                                                         iii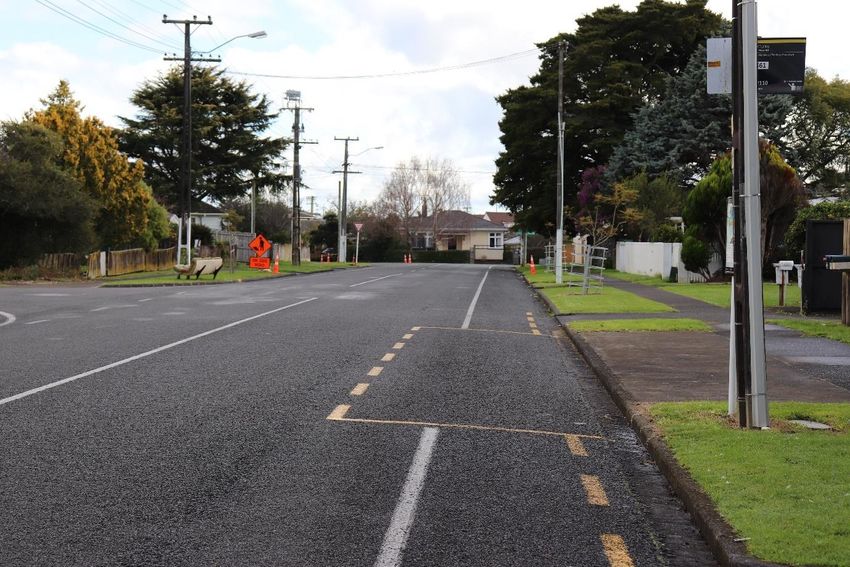
8.0     PROPOSED FUTURE INVESTIGATION AND FOCUS .................................................................... 42
  8.1      Priority Areas for Increasing Urban Forest ........................................................................... 42
  8.2      Utilising Native Species for Growing Urban Forest ............................................................... 43
  8.3      Analysis of Urban Forest Changes 2013-2016 ...................................................................... 45
  8.4      Safe-guarding Urban Forest through New Zoning and Development Potential ................... 46
9.0     FUTURE DIRECTIONS FOR GROWING URBAN FOREST IN ŌTARA-PAPATOETOE ...................... 48
10.0    ACKNOWLEDGEMENTS ............................................................................................................. 50
11.0    REFERENCES .............................................................................................................................. 51

                                                                       iv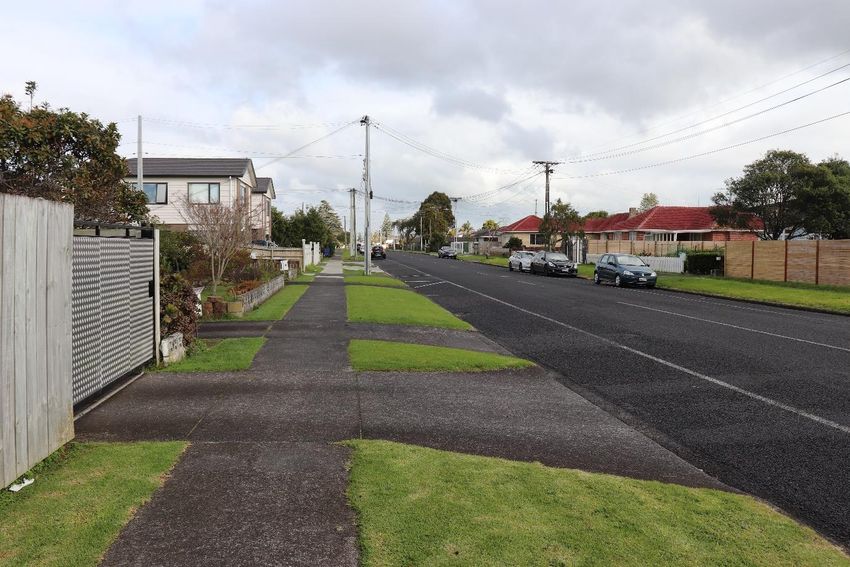
1.0     PREFACE

Auckland is New Zealand’s largest city, and plantings of exotic and native trees have taken place as
the region has developed since the mid-19th century. Early Māori settlers would have planted trees
such as karaka, pūriri and totara to indicate a special place or to mark a celebration. Early European
settlers would have planted trees that were familiar and provided a sense of place. London Plane,
English oak, and European lime trees were some of the earliest recorded plantings in Auckland, and
fruit tree species such as olive, citrus, and a range of stone fruits were also often commonly planted
during settlement by Europeans. The north-western part of Auckland around the Kaipara Harbour still
contains some of the earliest plantings of domestic plum and apple trees.

When European settlers arrived to Auckland, the gullies of the isthmus were filled with raupō, edged
with a varied growth of sedges and other moisture loving plants; and slopes of gullies covered with
karamu and cabbage trees. Numerous ferns and low-growing plants amongst blocks of scoria were
described as having a luxuriance of growth (Kirk 1870)). By the late 19th century, nearly all the land
within the Ōtara-Papatoetoe area was under cultivation with a large number of introduced plants,
including areas of pasture. Along with residential development, these actions have now restricted
indigenous forest cover within the Ōtara-Papatoetoe Local Board to small fragments in local reserves.

The Ōtara-Papatoetoe Local Board has provided funding to Auckland Council’s Urban Forest Advisor
in the Parks, Sports and Recreation Department to develop an analysis of the tree cover in its area of
responsibility. This report is the result of a program of work across Auckland Council to develop
detailed analysis of urban forest cover on public and private land, identifying opportunities to nurture,
grow and protect urban trees in the local board area. The analysis work is directed by the Council’s
Urban Forest Strategy 2019, which has 18 key objectives to help Council and Local Boards to deliver a
healthy ngahere for a flourishing future.

                                                   1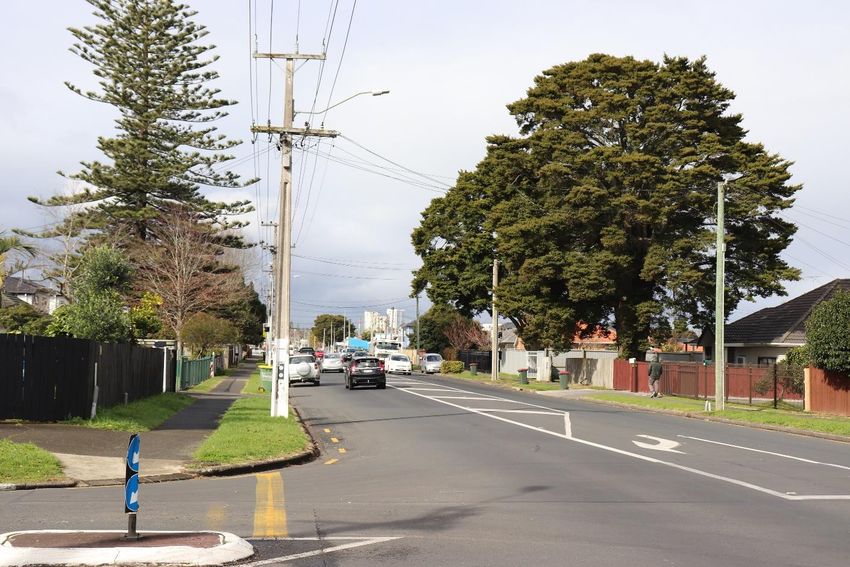
2.0     INTRODUCTION

2.1     Overview
This report summarises the distribution, size-class structure, ownership, and protection status of trees
and urban forest within the Ōtara-Papatoetoe Local Board area. The report has been prepared to
provide a detailed stock take of the tree cover on public and private land along with identifying some
key areas where opportunities exist to further enhance, nurture and grow the ngahere for local
benefits.

The data presented in this report is based on an analysis of 2013 Light Detection and Ranging (“LiDAR”)
data captured for Auckland Council by NZ Aerial Mapping and Aerial Surveys Limited. The LiDAR
dataset was supplied in raw above ground point classified form for vegetation at least three metres
tall. Points in the data set classified as ‘vegetation’ were used to form the foundation of an ‘Urban
forest’ layer for further analysis and interpretation with ArcGIS10.2 spatial software, in conjunction
with other spatial datasets.

2.2     What is Urban Ngahere (Forest)?
‘Urban forest’ comprises all the trees within a city – including parks, coastal cliffs, stream corridors,
private gardens and streets – both native and naturalised exotic species. This comprehensive
definition is sourced from the North American view of urban forest (Miller et al. 2015, Wilcox 2012),
rather than the European one, which instead defines urban forest as natural enclaves of forest within
the city limits (Cliffin 2005, Carreiro and Zipperer 2008).

                                                   2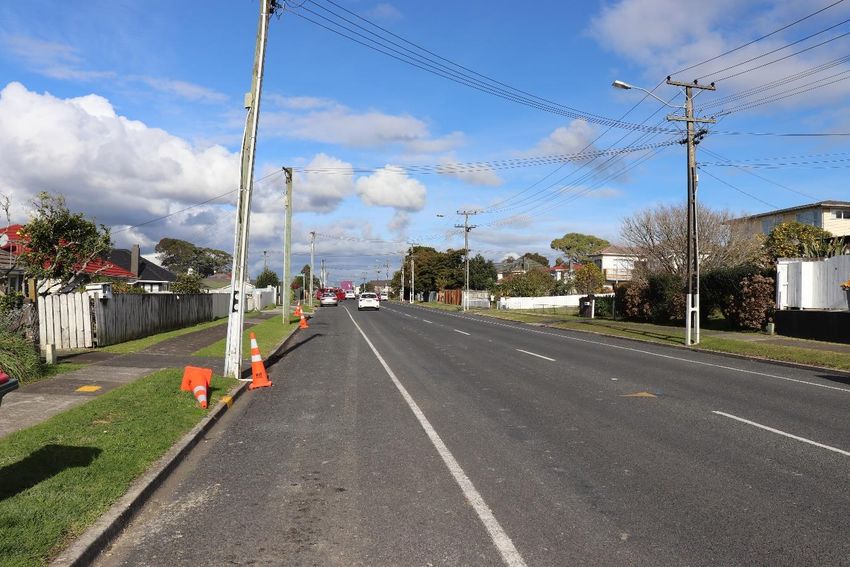
For the purposes of this report, ‘Urban ngahere/forest’ is defined as all the trees and other vegetation
three metres or taller in stature within the Ōtara-Papatoetoe Local Board, and the soil and water
systems that support these trees. This urban forest definition encompasses trees and shrubs in streets,
parks, private gardens, stream embankments, coastal cliffs, rail corridors, and motorway margins and
embankments. It also includes both planted and naturally established plants, of both exotic and native
provenance.

The ngahere in the local board area may not represent a forest as an image of the kauri forests of
Northland might. However, the scale of the tree and shrub cover across the area is sufficiently
extensive on both public and private land to make a meaningful contribution to the liveability and
sense of place for its residents.

The photograph below shows large well established native and exotic trees in an urban area, the value
of these trees are not well recognised. The large trees help filter air and trap vehicle pollutants and,
in this instance, would be providing residents with multiple benefits. The number of trees of this size
across the local board area is low, improvements are needed to grow more trees and wherever
possible retain large trees.

                                                   3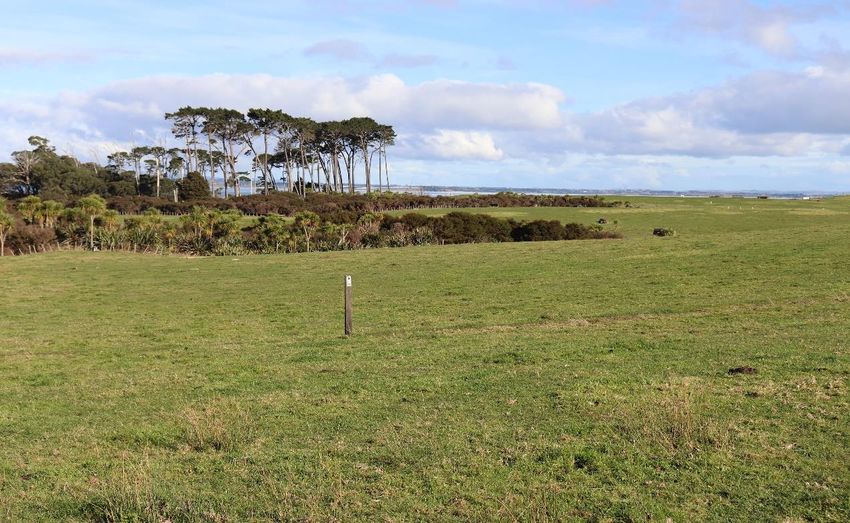
2.3    Why do we want Urban Ngahere?
The benefits of the ngahere are well documented, with Figure 1 adapted from the Councils’ Urban
Ngahere Strategy showing the range of benefits provided by urban trees.

   Figure 1: Examples of the multitude of benefits of urban forest (from Auckland Council 2019)

In addition, many of the native ecosystems within Auckland’s urban boundary are unique in their own
right, being representative examples of naturally rare or unique ecosystems that have largely been
cleared to make way for urban growth. Urban forest also provides habitat for other biodiversity,
including native birds, reptiles, and insects.

2.4    What is the Rationale Behind Studying Urban Ngahere?
Section 35(2) of the Resource Management Act 1991 (“RMA”) required councils to monitor the
efficiency and effectiveness of any policy statements and plans prepared under the RMA. However,
prior to the analysis presented in this report, Auckland Council had no reliable information on the
extent, ownership, and protection status of Auckland’s urban forest assets.

Baseline information about Auckland’s urban forest is particularly important in light of the recent
changes to the RMA which have removed the ability of Auckland Council to use general tree protection
rules to protect urban forest over a certain size. Sections 76(4A) and 76(4B) of the RMA were inserted
under the RMA (Simplifying and Streamlining) Amendment Act 2009 (RMAA09). This was amended
under the RMA Act 2013 (RMAA13) to align with the original policy intent of prohibiting blanket tree
protection rules in urban areas.

                                                  4
It was anticipated by the legislators that removal of general tree protection would occur in conjunction
with a systematic program to identify and protect important trees through their incorporation onto
the notable tree schedule, however in Auckland this has not been fully realised. Specifically, the
current list in Schedule 10 of the Auckland Unitary Plan (Operative in Part) 2016 (“Unitary Plan”) is not
entirely accurate and contains multiple errors of various types including grammatical, location, and
legal definitions. This Notable Tree list is therefore currently under review, with a Plan Change
underway this year, to fix some of the current errors.
However, the current legislative requirements for updating a regions planning document or schedule
means any changes to the current list will need to follow a public process of consultation and hearings
to update and make the necessary changes. Unfortunately, this can be a costly exercise for Council,
both on time and staff resources.
While the Unitary Plan offers various degrees of protection to urban forest and groups of trees
meeting specific characteristics (e.g. pre-identified significance, vegetation by coasts or streams),
other important urban forest assets have no statutory protection and can therefore be removed
without any consent. Council has no reliable mechanism at present to record the removal of trees on
an individual basis, in contrast to the previous blanket tree protection which required resource
consents for removal of individual trees over a specified size.
In the last five years, changes to the RMA has removed controls and enabled tree removal on private
property. The apparent increases in changes to local landscapes has resulted in concerns being
expressed to the Council by local board members, urban forest researchers, councillors, and local
community groups relating to the removal and loss of large trees in local suburbs. Dr Margaret Stanley
from the University of Auckland has presented detail on urban forest cover change and highlighted
the need for Auckland Council to look at better options for encouraging tree preservation (Stanley
2018). A number of articles have also been published in the media regarding tree losses in Auckland.
The Environmental Defence Society of New Zealand (“EDS”) stated in 2015, “While other cities have
targets of achieving 40% tree cover or more, Auckland is moving backwards with a minimalist
approach reliant on a cumbersome and costly scheduling process” (EDS 2015)1.
The recent changes to urban forest cover and the attention this has received highlights the need to
consider future management issues that arise with major projects such as infrastructure upgrades,
park redevelopments, and removal of aging stands of trees. The only viable method available to
Council to quantitatively track urban forest change is by LiDAR analysis, as outlined in this report. The
results of this report are to provide a starting point for the local board to determine where the urban
forest is located, where it could be increased, and what mechanisms could be utilised for this increase.
1
In contrast, many of the cities comparable to Auckland, which score consistently high on the various
international indices of liveability, have adopted urban forest strategies and targets. For example: Melbourne
has a 40% target for tree cover in the public realm by 2040, an almost doubling of urban forest cover in 2012;
Vancouver has a goal of planting 150,000 trees by 2020 (over 10 years) and increasing the cities tree canopy
cover; Sydney plans to increase its average total canopy cover from 16% (2013) to 23% by 2030, and then to
27% by 2050, through targeted programs for trees located in streets, parks and private property.
53.0 RESEARCH THEMES
This report is framed around the key principles of Council’s Urban Ngahere Strategy. The Ōtara-
Papatoetoe Local Board has provided feedback on, and funding for, a work programme following a
workshop in September 2018.
The key deliverables of the knowing phase are to determine:
1. The distribution and height-class composition of urban forest within the suburban zones of the
Ōtara-Papatoetoe Local Board.
2. The ownership distribution of the urban forest within the suburban zones of the Ōtara-Papatoetoe
Local Board, including the species composition and percentage age of trees within local parks and the
road corridor.
3. The protection status of the urban forest within the Ōtara-Papatoetoe Local Board, and the strength
of that protection as provided for in the Unitary Plan.
4. Whether the urban forest cover of the Ōtara-Papatoetoe Local Board varies between suburb areas
within the board, and how this is related to socio-economic factors.
5. Whether the urban forest within the Ōtara-Papatoetoe Local Board is appropriately located to
provide health benefits to residents, including the tree canopy cover in local parks and whether this
provides sufficient shade for children’s play spaces.
6. The overall status of the urban ngahere within the Ōtara-Papatoetoe Local Board, including
developing trends, and where there are pressures and opportunities.
No tree cover residential area adjoining main arterial
67. How the urban forest of the Ōtara-Papatoetoe Local Board is expected to change in the future,
including future priority areas for investigation and research.
For the Ōtara-Papatoetoe Local Board, particular challenges include the need to provide more
plantings within road corridors of industrial areas, and to work with private land owners to find areas
to plant trees for the collective benefit of people who work in these areas. It is anticipated that future
land use changes will see greater residential developments in areas currently dominated by industrial
and commercial activity, with these developments providing future opportunities to increase
accessible urban forest.
Mixed use area with no tree cover in the street environment and very low tree cover on adjoining
private land.
7Mixed use area with very low tree cover
4.0 ŌTARA-PAPATOETOE LOCAL BOARD CONTEXT
The Ōtara-Papatoetoe Local Board covers approximately 3,991 hectares (ha) on the southern part of
the Auckland isthmus. It is well connected to the Auckland Central Business District and other parts of
Auckland by both road (State Highway 1 and State Highway 20 motorways) and rail (Southern Line).
The Board includes residential suburbs such as Middlemore, Papatoetoe, Puhinui, Clover Park, Ōtara,
and Flat Bush, along with the Manukau Institute of Technology and AUT South Campuses, and the
industrial and commercial areas of Puhinui and Manukau Central. The population of the Local Board
is over 86,000 residents, and approximately 64% of the land cover is urban development.
The Local Board area spans from Tāmaki Estuary in the north to Manukau Harbour in the south, with
much of these coastal borders containing local parks and reserves. The board adjoins Māngere-
Ōtāhuhu Local Board to the west, Manurewa Local Board to the south, and Howick Local Board to the
north and east. The northern and eastern parts of the local board area are predominately residential,
while the southern board area includes the Manukau Central Business District (CBD). The south-
western local board remains in rural productive land, including agriculture and horticulture, however
this area is zoned for further development under the Auckland Unitary Plan.
Large scale sports facilities are present within the local board area, including The Grange and Auckland
Golf Clubs, Colin Dale Park, and Manukau Sports Bowl, along with larger sports fields at local parks
such as Hampton Park (Te Puke O Tara). Amongst the developed areas are approximately 110 local
parks, with some of the largest including Puhinui Reserve, Kohuora Park, Ngāti Otara Park, and
Rongomai Park. Overall, public parkland covers approximately 15% of the board’s total land area.
8Mixed exotic memorial plantings
In pre-human times, the primary land cover of Ōtara-Papatoetoe would have comprised mixed
podocarp-broadleaved and kauri forest, with smaller areas of broadleaved species and coastal forest,
volcanic boulderfields, freshwater wetlands and swamp forest, and minor areas of saltmarsh (Lindsay
et al., 2009). This indigenous vegetation cover has largely been lost through modification by clearing
from early Polynesian occupation, followed by conversion to agricultural and horticultural land, and
subsequent urban development.
At present, less than 2% of the land area of Manukau District remains under native vegetation cover
(Morphum Environmental Ltd, 2017). In Ōtara-Papatoetoe, only 1% of the original indigenous
vegetation cover is still present, and exotic plant species now account for approximately one quarter
of the land cover. This is attributed largely to grassed reserves and residential gardens, as well as exotic
specimen trees in parks and road corridors. Continuous tracts of urban forest in the local board area
are primarily limited to riparian and coastal vegetation, with mangroves being common in both the
upper reaches of the Manukau Harbour and within Ōtara Creek.
Puhinui Reserve is the largest open space within the local board, being nearly 200ha in size. The
Reserve was purchased by the former Manukau City Council in 1991 and previously farmed from 1845.
It occupies the southern portion of the Puhinui Peninsula between the tidal Puhinui Creek and the
Manukau Harbour. The reserve and its coastline comprise a rich diversity of habitat types such as
mangrove forest, saltmarsh, salt meadow, shellbanks, freshwater wetlands, and manuka scrub. Some
of the oldest mangroves in the harbour are found in the Puhinui Reserve (Jones and Wilcox, 2000).
9Puhinui Reserve Looking south west
The foreshore is an excellent feeding habitat for wading birds and the extensive sandflats support an
abundance of invertebrates. This coastal part of the reserve is one of six very important high tide roost
sites in the Manukau Harbour on the basis of numbers of birds. Threatened species recorded in the
area include New Zealand dotterel (Nationally Vulnerable), banded dotterel (Nationally Vulnerable),
wrybill (Nationally Vulnerable), Caspian tern (Nationally Vulnerable), and pied stilt (Declining). This
site is of international significance and forms part of the Manukau Harbour Sites of Special Wildlife
Interest (SSWI). The mouth of the Puhinui Creek is a designated Wildlife Refuge subject to the Wildlife
Act 1953.
Urban forest and wetland vegetation at Puhinui Reserve
10Another ‘hidden gem’ for biodiversity is the freshwater wetland located in Kohuora Park, Papatoetoe,
within the Kenderdine Catchment. Freshwater wetlands are uncommon in the Auckland Region and
Kohuora wetland is the only known freshwater wetland associated with a tuff ring left in the Tāmaki
Ecological District, meaning it is both a representative and unique ecological feature. The wetland
comprises a mosaic of indigenous wetland vegetation, crack willow forest, weedfield and rank
grassland. There is a modified stream channel flowing south through the reserve on the western
margin of the wetland. Despite its size and urban location, the site is utilised by a number of native
birds including one threatened species: pied shag (Nationally Vulnerable), black-backed gull,
kingfisher, pūkeko, silvereye, and spur winged plover. The wetland may also act as a stepping stone
for birds travelling between the Manukau and Waitemata harbours.
Aside from these areas, more than 60% of the remaining urban forest is found on private properties.
With large portions of the Local Board area now zoned for development intensification under the
Auckland Unitary Plan (Operative in Part) 2016, including Mixed Housing Urban and Terrace Housing
and Apartment Buildings, much of the urban forest is under threat from development, which could
potentially lead to irreversible changes in urban forest cover (Brown et al., 2015).
Urban living is changing, and land use is now maximising development opportunities in areas which
had traditionally been single story suburb dwellings. Apartment living enables higher population
density however the ability to have greenery or a connection to nature is almost impossible when the
apartment building has now space for trees or greenery. A simple green wall, a green roof or space
for plantings around the main development are all options that should have been considered. If we
want to have good quality urban spaces then the types of development need to include those that
have greens spaces and plantings within the development.
115.0 METHODS
5.1 Methodology Overview
The techniques considered for mapping Auckland’s urban forest at a high resolution included LiDAR,
along with manual digitisation (marking up) of aerial imagery and field-work with aerial imagery
followed by manual digitisation of field maps, or some combination of these methods. However, both
the latter approaches involved considerable man hours and were therefore too expensive to allow a
universal sample of urban forest within the Auckland urban area to be obtained.
Computer automatic classification of satellite imagery could have provided a universal sample, but the
resolution of this approach was insufficient in providing mapping and change data at the scale that
was required for this more detailed analysis work, being down to individual trees and shrubs. For these
reasons, LiDAR was considered the best method for obtaining a universal sample of the urban forest
for the purposes of this study.
The term LiDAR stands for Light Detection and Ranging. It is an airborne optical remote sensing
technology that measures scattered light to find a range and other information on a distant target.
The range to the target is measured using the time delay between transmission of a pulse and
detection of a reflected signal. This technology allows for the direct measurement of three-
dimensional features and structures and the underlying terrain. The ability to measure height of
features on the ground or above the ground is the principle advantage over conventional optical
remote sensing technologies such as aerial imagery.
LiDAR data that is suitable for urban forest analysis has been made available for the year 2013, and
the processing of 2016 data is underway. Final 2016 results for the Ōtara-Papatoetoe Local Board were
not available at the time when this report was being prepared, and the Local Board will be updated
later this year when the results become available.
The 2013 urban forest data presented in this report was created from airborne LiDAR sensor data
collected between 17/07/2013 and 23/11/2013. The classified Raw Point Cloud data, that the urban
forest layer was created from, is at least 1.5 points per square metre over open ground. Vertical
accuracy is +/-0.1m @ 68% confidence. Data-points classified as ‘vegetation’ were extracted to form
the foundation of an urban forest layer for further analysis and interrogation within the ArcGIS 10.2
geospatial software through combination with other spatial datasets (Table 1).
The initial urban forest layer underwent some quality control checks to eliminate obvious errors found
in the supplied classified point cloud data. During this process we removed misclassified areas of man-
made materials and other non-vegetation surfaces. Such errors are symptomatic of classification
functions which classify surface objects of varying composition based on the strength of the LiDAR
pulse return. Objects with similar reflectivity to vegetation, such as transparent materials (glass) and
power lines, were common sources of these errors.
12Table 1: List of data sources and descriptions used in analysis
Organisation
Data Description Retrieved
source
Ōtara-Papatoetoe Local Board area. A political
division of the Auckland Council that includes
Local Board the suburbs of Middlemore, Papatoetoe, Clover Statistics NZ January 2016
Park, Otara, Flat Bush, Puhinui, and Manukau
Central.
This includes roads (both formed and
unformed), public parks administered by the RIMU,
Public Owned November
Auckland
Land (parcel level) Auckland Council and land administered by 2015
central government agencies (e.g. Department Council
of Conservation and Ministry of Education).
Private Parcels (all Current land parcel polygons with associated
primary parcels descriptive data (Land information New Zealand, LINZ January 2016
except above) 2010). This dataset does not include parcels that
have been vested in council for roading.
See Table 3. Covers land within open space
Protected Land zones or protected in the Proposed Auckland RIMU August 2016
Unitary Plan (e.g. as part of a Significant
Ecological Area or Outstanding Natural Feature).
Recent census data including information on
Census Data population, households, and income for Statistics NZ January 2019
different Census Area Units.
5.2 Urban Forest Structure
LiDAR data includes a height component and we used this information to set a cut-off point for urban
‘forest’ vegetation at 3m. That is, LiDAR data-points classified as vegetation that were 3m+ in height
were used to derive the urban forest layer. The output of this was extracted and then visually
developed using GIS software into an urban forest layer.
To be clear on the vegetation classification process, the 3m cut-off point means that low-lying
vegetation such as mown grassland, low stature hedges, and gardens are not included in the urban
forest layer. It also means that that new restoration and street tree plantings that have taken place
since 2013 will not be visible in this analysis, as the majority of these would still be less than 3m in
height.
5.3 Urban Forest Tenure
To determine the tenure of urban forest, the data points were compared to the zoning of different
land parcels within the Ōtara-Papatoetoe Local Board. The zoning as corresponding to land tenure
classification is summarised in Table 2.
13Table 2: Classification of land parcels in relation to land tenure assessment
Tenure
Detail on classification in relation to zoning and land ownership
Category
Trees within the roading network, located in road reserves (ie along footpaths and
Street Trees
berms) and within the motorway corridor2.
Private Land Private residential land and privately owned businesses and commercial space.
Publicly owned land accessible to the public for recreational and conservation
Public Parks
purposes, including all public parks.
All publicly owned land that is not classified as a public park, including tertiary
Other Public
campuses, schools, road reserves without formed roads on them, and Council
Land
owned commercial spaces.
5.4 Urban Forest Protection Status
The level of urban forest protection was determined through an analysis of the underlying zones and
protection layers in the Unitary Plan. Five different protection levels were assigned (shown in Table 3)
based on the rules applying to vegetation clearance in the Unitary Plan, or other practical constraints
to vegetation clearance for different zones and land uses as based on past experience. These
protection levels are somewhat arbitrary and do not correspond to any legal weighting, however
provide a means to determine the likelihood of each tree or urban forest area being cleared in the
future.
For the Notable Trees, the list consulted for this study is the operative list in Schedule 10 of the
Auckland Unitary Plan. This list is dated February 2017, so does not include the latest plan updates. It
is noted this list set is recognised to include some anomalies, such as trees that have been removed
since being scheduled, errors in individual vs group listings, and entries that have not been ground-
truthed. However, on the whole, the list provides a useful tool for examining the distribution of
Notable Trees throughout the Local Board area. GIS maps consulted showing the spatial distribution
of the trees have been based on the same schedule.
2
Note that the motorway corridor is actually owned and managed by the New Zealand Transport Agency
(NZTA). The Council has no control over the motorway corridor greenspace and trees planted here are not
covered by the street tree rules in the Auckland Unitary Plan.
14Table 3: Level of protection assigned to urban forest based on Unitary Plan zone and overlay rules
Protection
Detail on rules and restrictions
zone
0 – no There is no statutory protection for urban forest and/ or rules preventing tree or
protection vegetation clearance in this location
Within an open space active recreation zone or a road corridor. For both these areas
restricted discretionary resource consents are required to clear trees > 4m in height.
1 – some However, development pressures are often high in these locations and trees are
protection often regarded as incompatible with the main land uses. The proposed Auckland
Unitary Plan rules for street trees are more permissive in terms of what utilities can
do around and to trees – including pruning as permitted activity.
Within a coastal natural character area, or an area zoned as ‘Open Space Informal
Recreation’ (restricted discretionary consent needed to remove trees/ vegetation
2 – low
4m+ in height). The proposed Auckland Unitary Plan rules for park trees are more
protection
permissive in terms of what utilities can do around and to trees – including pruning
as permitted activity.
Including the following:
- Outstanding Natural Feature (restricted discretionary consent needed to remove
25m2+ of contiguous indigenous vegetation)A,
- Outstanding Natural Landscape (restricted discretionary consent needed for
alteration or removal of 50m2+of any contiguous indigenous vegetation)A,
- Coastal yard (restricted discretionary consent needed to remove native trees/
33 – vegetation 3m+ in height)A
moderate - Open Space Conservation (restricted discretionary consent needed to remove
protection trees/ vegetation 4m+ in height)
- Historic heritage (discretionary consent needed to remove trees/ vegetation 3m+
in height)
- Riparian yard (restricted discretionary consent needed to remove any trees or
shrubs)
- Lake protection zone (restricted discretionary consent needed to remove any trees
or shrubs)
Significant Ecological Areas (“SEA”) (discretionary consent needed to remove any
4– high
trees or vegetation), Notable trees (discretionary consent needed to remove any
protection
notable tree or shrub)
A
= vegetation protection in these areas is restricted to indigenous species and does not cover exotic
plants. In some cases (e.g. coastal zone) the removal of exotic vegetation is specifically mentioned as
a permitted activity. Exotic trees can provide many of the same benefits as native species so this is a
negative in terms of protection of urban forest values.
Placeholder for Photo – suggestions of Coastal vegetation along Otara Lake
3
The protection classification work from the PAUP generated 5 broad levels of protection. The protection
classes 3&4 were combined as the differences between these were seen to be very minimal. This results in a 4
tier classification for the protection classes as outlined in the table above.
155.5 Urban Forest in Relation to Socio-Economic Factors
To further analyse the urban forest data and potential influencing factors, the data (including total
canopy, tenure, size class distribution, and protection status) was categorised into Census Area Units
(CAU) for the Ōtara-Papatoetoe Local Board. The CAU covered by the Local Board area are shown in
Figure 2, with 18 units being present in total. Where CAU within the Ōtara-Papatoetoe area cross over
the Local Board boundary (e.g. Aorere CAU), they are covered in this report, unless the area of overlap
is very small.
Figure 2: Census Area Units (2013) of the Ōtara-Papatoetoe Local Board (FIGURE TO INSERT)
The socio-economic census data included in this report has been sourced from the 2013 New Zealand
census records. This includes data on resident population, age distribution, income, and number of
cars.
In addition, a desktop analysis of high-resolution aerial imagery was undertaken to understand tree
canopy cover and the number of trees in community parks, and whether shade was provided to
playgrounds in each park. This work was completed to show where opportunities exist for
improvements to the numbers of trees in local parks that can provide future health benefits for
individuals, groups, and the wider community.
The factors recorded in the desktop analysis, and methods used, are:
• Park selection and type of park maintenance (ie maintained or unmaintained)
- All parks in the Ōtara-Papatoetoe Local Board were assessed. Parks were identified
using the Auckland Council GeoMaps Geospatial Information System (“GIS”), which
records whether the park is maintained or unmaintained under the Council facility
maintenance contract. For reference, unmaintained parks are often stormwater
ponds or narrow esplanade strips in areas that are no easily accessible, or unpopular,
with little to no infrastructure.
• Size of park
- The Auckland Council GIS system provided the area of each park in square metres.
• Number of trees present and percentage of canopy cover
- Digital photo interpretation through visual estimate of high-resolution aerial imagery
was used to estimate the number of trees and the percentage of canopy cover. If
there were less than twenty trees an accurate figure could be obtained, while higher
tree numbers were estimated4. For the tree to be counted, the majority of the tree
needed to be within the park boundary. Visual estimations of the percentage of
canopy cover extent versus land areas were also made, with an example shown in
Figure 3.
• Playground or sports field presence
- The Auckland Council GIS system, including infrastructure layers, was used to record
presence.
4
For consistency and validity, the same person carried out all estimations of tree numbers and the percentage
of canopy cover.
16• Amount of shade provided to playground, if present
- Visual estimation of the amount of shade on playgrounds provided by trees was
recorded within three different categories: ‘trees provide some shade to the
playground’; ‘trees provide a little shade to the playground’; and ‘trees provide no
shade to the playground’.
Figure 3: Examples
showing methods
used to estimate
tree canopy cover
within park areas
using aerial photos
and GIS. The blue
line shown is the
park boundary,
and the red areas
are the digitised
areas of canopy
extent
5.6 Change in Urban Forest Cover 2013 – 2016
The data set resulting from the most recent LiDAR survey (2016/2017) produced 88 billion data points
for the region and was then assessed for quality and accuracy by Auckland Council staff prior to
release. The data has now been released from the quality control process, enabling Council staff to
undertake processing of the data to produce a vegetation or canopy extent layer that can then be
used to develop the metrics for tree sizes, heights, and a range of other factors including canopy
coverage.
A comparison of this data set to the 2013 data set, once finalised, will be provided in a subsequent
report update on progress of the ngahere work for the local board. The Urban Forest Strategy will
report back to Council’s Environment Committee in August 2019 will a full update on this, and on other
areas where Council is implementing and operationalising the strategy’s objectives.
176.0 RESULTS
6.1 Overview
Figure 4 shows urban forest cover within the Ōtara-Papatoetoe Local Board, as represented by 2013
LiDAR data. Overall, urban forest covers approximately 9.1% of the local board area, including 6.4% of
roads, 13.1% of public parks, and 8.4% of private land.
Public parks in total account for approximately 15% of the Local Board area. Approximately 110 parks
are present within the Local Board, with most of these being regularly maintained by Council
contractors. Most of the parks within the local board area contain urban forest.
Total urban forest cover within the Local Board is low when compared to other urban local boards
within the Auckland metropolitan area, having a slightly higher coverage than Mangere-Otahuhu, as
shown in Table 4. Urban forest cover within public space is the lowest in Ōtara-Papatoetoe out of all
the urban local boards. Urban forest within road reserves is also relatively low.
Table 4: Percentage cover of urban forest in Auckland’s urban local board areas: data includes
percentages for different land tenures and the overall cover within each board
Public open
Urban Local BoardA Private land Roads Overall
space
Kaipatiki 63 25 12 30
Puketapapa 44 17 11 20
Albert - Eden 30 19 18 20
Orakei 25 20 14 20
Waitemata 39 16 15 19
Whau 30 17 12 17
Devonport - Takapuna 23 17 10 16
Henderson - Massey 31 14 7 15
Manurewa 25 11 6 12
Maungakiekie - Tamaki 22 9 10 11
Otara - Papatoetoe 13 8 6 9
Mangere - Otahuhu 17 7 7 8
A
= A number of local boards have been excluded from this table as they contain significant pockets of
rural land (i.e. Hibiscus and Bays, Upper Harbour, Howick and Papakura local boards) or are largely
rural in character (i.e. Waitakere, Franklin, Rodney, Great Barrier and Waiheke local boards)
186.2 Urban Forest Structure
The height class distribution of the urban forest canopy within Ōtara-Papatoetoe Local Board is
displayed in Figure 5. As shown, approximately one quarter of the forest is between 3-5m tall, one
half between 5-10m tall, and the remaining quarter represents trees taller than 10m.
This data shows only low presence of large trees within the local board area, with trees taller than
15m representing approximately 14% of the total urban forest assessed. When broken down into
suburb areas (Figure 6), the same general trend is observed, with the exception of Middlemore
Hospital which has a slightly larger proportion of trees more than 10m tall than the remaining suburb
areas.
Place holder for GIS figure showing structure?
6% 1%
8%
26%
17%
3 - 5m (87.4ha) 5 - 10m (141.5ha)
10 - 15m (58.1ha) 15 - 20m (25.7ha)
42%
20 - 30m (19.2ha) 30m + (2.3ha)
Figure 5: Height class distribution of urban forest canopy within Ōtara-Papatoetoe Local Board
19100%
90%
80%
PERCENTAGE OF TOTAL URBAN FOREST
70%
60%
50%
40%
30%
20%
10%
0%
Clover Park Manukau Middlemore Hospital Otara Papatoetoe
SUBURB
3 to 5m 5 to 10m 10 to 15m 15 to 20m 20 to 30m 30m +
Figure 6: Height class distribution of urban forest canopy per suburb
6.3 Urban Forest Tenure
The tenure distribution of urban forest canopy within the Ōtara-Papatoetoe Local Board is displayed
in Figures 7 and 8. Slightly over half (53%) of the urban forest is located on private property, for
example within private gardens and lawn areas. Public Parks and other publicly owned land (e.g.
schools) contain a similar proportion of urban forest, being 22% and 16% of the total urban forest
cover, respectively. Public parks have the highest coverage of urban forest out of all the land tenures,
as shown in Figure 9, while road reserves have the lowest coverage.
Figure 10 displays the distribution of height classes by land tenure, in relation to the total urban forest
in each tenure category. This figure shows that both Private Land and Public Parks have the widest
distribution of height classes out of all the land tenures, and the highest proportion of taller trees.
Trees more than 20 metres tall are poorly represented in the Other Public Land and Street Tree land
tenures.
There is some variation in tenure of urban forest throughout the Ōtara-Papatoetoe Local Board area,
as shown in Figures 11 and 12. Ōtara and Papatoetoe have overall the highest total urban forest, with
a high proportion of this forest being on private land. Clover Park, Manukau and Middlemore Hospital
have a very small amount of urban forest overall, with Middlemore Hospital having very little urban
forest on roadsides or in public parks. For all suburbs, Private land has the highest proportion of forest
cover of the land tenures.
20To recognise that each suburb has different areas of land in each tenure, for example Papatoetoe has
820ha of private land, while Middlemore Hospital only has 52.9ha, the forest tenure proportions in
Figure 12 are relative to land area.
This figure shows a similar spread across the different land tenures between suburbs, with 4-10% of
road reserves being covered in urban forest, 4-25% of private land, and 7-21% of other public land.
For public parks, Middlemore Hospital, Manukau and Ōtara had the highest, similar proportions of
urban forest with 29%, 26% and 22% respectively, with the remaining suburbs having 15% and 14%.
Middlemore Hospital also has the highest urban forest cover overall relative to land area, while Clover
Park, Manukau, Ōtara and Papatoetoe had similar cover.
[INSERT GIS IMAGE OF LOCAL BOARD AND URBAN FOREST COVER BY LAND TENURE]
Figure 7: Urban forest cover within the Ōtara-Papatoetoe Local Board boundary showing the
tenure/ownership of urban forest
9%
22%
53%
Street Trees (31.9ha)
Public Parks (72.3ha)
16%
Other Public Land (53.0ha)
Private Land (176.9ha)
Figure 8: Tenure of urban forest canopy within Ōtara-Papatoetoe Local Board
2113%
Percentage covered in urban forest
10%
8%
6%
Street Trees Public Parks Other Public Land Private Land
Land Tenure
Figure 9: Percentage cover of urban forest within different land tenures of Ōtara-Papatoetoe Local
Board
3 to 5m 5 to 10m 10 to 15m 15 to 20m 20 to 30m 30m +
200
180
160
140
TOTAL URBAN FOREST (HECTARES)
120
100
80
60
40
20
0
Other Public Land Public Parks Private Land Street Trees
LAND TENURE
Figure 10: Height class distribution of urban forest within different land tenures of Ōtara-
Papatoetoe Local Board
22140
Other Public Land
120
Public Parks
Total urban forest (hectares)
100
Private Land
80 Street Trees
60
40
20
0
Clover Park Manukau Middlemore Hospital Otara Papatoetoe
Suburb
Figure 11: Tenure of urban forest within main suburbs of the Ōtara-Papatoetoe Local Board
80% Other Public Land
Proprotion of land area of each tenure occupied by
70% Public Parks
60% Private Land
Street Trees
50%
urban forest
40%
30%
20%
10%
0%
Clover Park Manukau Middlemore Otara Papatoetoe
Hospital
Suburb
Figure 12: Tenure of urban forest within main suburbs of the Ōtara-Papatoetoe Local Board
relative to land area
236.4 Urban Forest Protection Status
In terms of protection status under the assigned scale, analysis shows (Figure 13) that over half (63%)
of the urban forest cover within the Local Board has no degree of protection. Approximately 8% of the
urban forest cover has the highest degree of protection. About a quarter of the urban forest has
intermediary degrees of protection, with the next largest protection category being ‘some’ protection,
which represents trees located in street corridors.
8%
13%
No Protection (211.5ha)
5% Some Protection (36.9ha)
63% Low Protection (17.4ha)
11%
Moderate Protection (42.4ha)
High Protection (28.5ha)
Figure 13: Protection status of urban forest within the Ōtara-Papatoetoe Local Board
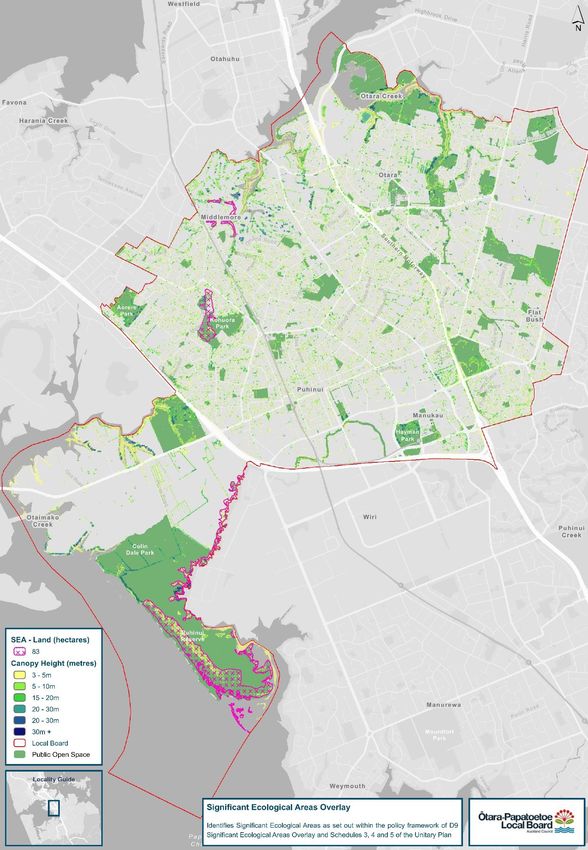
6.4.1 Significant Ecological Areas
For SEAs (High Protection Class), these have been identified in the Auckland Unitary Plan resulting
from a specialist study assessing areas of vegetation against five significance criteria. The terrestrial
SEA extent within the Ōtara-Papatoetoe Local Board is shown in Figure 145. Whilst there is
approximately 83ha of SEA within the local board, the amount qualifying as urban forest is
considerably lower. This is due to the majority of SEA being terrestrial wetland areas, primarily within
Puhinui Reserve and Kohuora Park. Taller trees are limited to along Puhinui Stream and around the
Auckland Golf Club, where riparian vegetation protects watercourse flowing into the upper reaches of
the Tāmaki Estuary. Urban forest identified in the SEA overlay is absent from the central and eastern
parts of the local board.
5
The current SEA overlay is based on the Operative Unitary Plan, whereas the data used in this study in
relation to protection status is from the Proposed Unitary Plan (as of 2013). There is a slight variation between
the two versions of the plan relating to submissions to the Proposed overlay and consequent
removals/additions, with the main removal having occurred over exotic tree stands in northern Cornwall Park.
However overall the overlay within the Maungakiekie-Tāmaki Local Board has stayed more or less the same.
24You can also read