FOREST FIRE AND DEGRADATION ASSESSMENT USING SATELLITE REMOTE SENSING AND GEOGRAPHIC INFORMATION SYSTEM
←
→
Page content transcription
If your browser does not render page correctly, please read the page content below
FOREST FIRE AND DEGRADATION ASSESSMENT
USING SATELLITE REMOTE SENSING AND
GEOGRAPHIC INFORMATION SYSTEM

P.S. Roy*
Indian Institute of Remote Sensing (NRSA)
Dehra Dun

       Abstract : India, with a forest cover of 20.55% of geographical area, contains a variety
       of climate zones, from the tropical south, north-western hot deserts to Himalayan
       cold deserts. Enriched with ample diversity of forests bloomed with a rich array of
       floral and faunal life forms. With increasing population pressure, the forest cover of
       the country is deteriorating at an alarming rate. Along with various factors, forest
       fires are a major cause of degradation of Indian forests. According to a Forest Survey
       of India report, about 50 per cent of forest areas in the country are prone to fire. It is
       estimated that the proportion of forest areas prone to forest fires annually ranges
       from 33% in some states to over 90% in others. While statistical data and geospatial
       information on forest fire are very weak or even not available. About 90% of the
       forest fires in India are started by humans. The degree of forest fire risk analysis and
       frequency of fire incidents are very important factors for taking preventive measures
       and post fire degradation assessment. Geospatial techniques are proving to be powerful
       tools to assess the forest fire risk and degradation assessment. The present paper
       describes the present state of forests, methodology, models and case studies of forest
       fire risk and degradation assessment in context to Indian forests.

INTRODUCTION

     Fire has been a source of disturbance for thousand of years. Forest and wild
land fires have been taking place historically, shaping landscape structure, pattern
and ultimately the species composition of ecosystems. The ecological role of
fire is to influence several factors such as plant community development, soil
nutrient availability and biological diversity. Forest and wild land fire are
considered vital natural processes initiating natural exercises of vegetation

* Present address : National Remote Sensing Agency, Hyderabad, 500037, India

Satellite Remote Sensing and GIS Applications in Agricultural Meteorology
pp. 361-400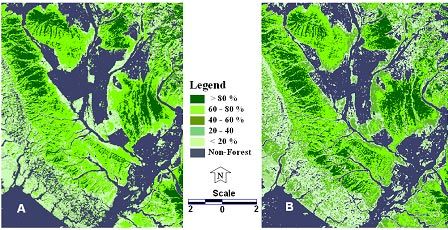
362                                        Forest Fire and Degradation Assessment

succession. However uncontrolled and misuse of fire can cause tremendous
adverse impacts on the environment and the human society.

     Forest fire is a major cause of degradation of India’s forests. While statistical
data on fire loss are weak, it is estimated that the proportion of forest areas
prone to forest fires annually ranges from 33% in some states to over 90% in
others. About 90% of the forest fires in India are started by humans. Forest
fires cause wide ranging adverse ecological, economic and social impacts. In a
nutshell, fires cause: indirect effect on agricultural production; and loss of
livelihood for the tribals as approximately 65 million people are classified as
tribals who directly depend upon collection of non-timber forest products from
the forest areas for their livelihood.

     A combination of edaphic, climatic and human activities account for the
majority of wild land fires. High terrain steepness along with high summer
temperature supplemented with high wind velocity and the availability of high
flammable material in the forest floor accounts for the major damage and wide
wild spread of the forest fire. Figure-1 shows triangle of forest fire. The
contribution of natural fires is insignificant in comparison to number of fires
started by humans. The vast majority of wild fires are intentional for timber
harvesting, land conversion, slash – and- burn agriculture, and socio-economic
conflicts over question of property and landuse rights. In recent years extended
droughts (prolonged dry weather), together with rapidly expanding exploitation

                            Figure 1: Triangle of forest fire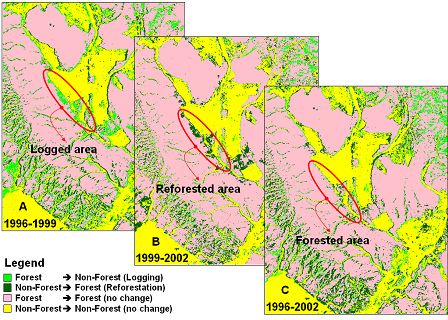
P.S. Roy                                                                           363

of tropical forest and the demand for conversion of forest to other land uses,
have resulted in significant increase in wild fire size, frequency and related
environmental impacts.

     Recent wild fires have an immense impact in Indonesia, Brazil, Mexico,
Canada, USA, France, Turkey, Greece, India and Italy. Large-scale fires and fire
hazards were also reported in eastern parts of the Russian Federation and in
China northeastern Mongolia autonomous region. There has been a continuous
increase of application of fire in landuse system in forest of South East Asian
region. This has resulted in severe environmental problems and impacts on
society. Wild fires often escape from landuse fire and take unprecedented shape
causing problems of transboundary pollution. The paper analyzes the forest
and wild land fires issues with particular reference to South East Asia and
emphasizes on development of national and regional fire management plans
considering the complexity and diversity of fire. The paper also attempts to
assess the current status of application of satellite remote sensing for fire detection,
monitoring and assessment. According to a classification of forest fires by type
and causes, three types of forest fires are prevalent;

a) Ground fires: Ground
   fires occur in the humus
   and peaty layers beneath
   the litter of un-
   decomposed portion of
   forest floor with intense
   heat but practically no
   flame. Such fires are
   relatively rare and have
   been            recorded
   occasionally at high
   altitudes in Himalayan fir
   and spruce forests (Fig. 2).                    Figure 2: Ground fire

b) Surface fires: Surface fires occurring on or near the ground in the litter,
   ground cover, scrub and regeneration, are the most common type in all
   fire-prone forests of the country (Fig. 3).

c) Crown fires: Crown fires, occurring in the crowns of trees, consuming foliage
   and usually killing the trees, are met most frequently in low level coniferous
   forests in the Siwaliks and Himalayas (NCA Report, 1976) (Fig. 4).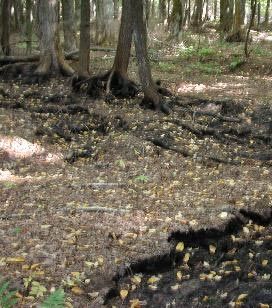
364                                    Forest Fire and Degradation Assessment

                                                 Impact of the Forest Fire on the
                                                 Global Environment

                                                  Forest fires controlled or
                                                 uncontrolled have profound
                                                 impacts on the physical
                                                 environment         including:
                                                 landcover,             landuse,
                                                 biodiversity, climate change
                                                 and forest ecosystem. They also
                                                 have enormous implication on
                                                 human health and on the
              Figure 3: Surface fire             socio-economic system of
                                                 affected countries. Economic
                                                  cost is hard to quantify but an
                                                  estimate by the economy and
                                                  environment can be provided.
                                                  The fire incidence problem for
                                                  South East Asia put the cost
                                                  of damages stemming from
                                                  the Southeast Asian fires (all
                                                  causes) at more than $4
                                                  billion. Health impacts are
                                                  often serious. As per one
                                                  estimate 20 million people are
                                                  in danger of respiratory
              Figure 4: Crown fire                problems from fire in
                                                  Southeast Asia.

    Most pronounced consequence of forest fires causes their potential effects
on climate change. Only in the past decade researchers have realized the
important contribution of biomass burning to the global budgets of many
radiatively and chemically active gases such as carbon dioxide, carbon monoxide,
methane, nitric oxide, tropospheric ozone, methyl chloride and elemental carbon
particulate. Biomass burning is recognized as a significant global source of
emission contributing as much as 40% of gross Carbon dioxide and 30% of
tropospheric ozone (Andreae, 1991).

   Most of the world burnt biomass matter is from savannas, and because
   rd
2/3 of the earth savannas are in Africa, that continent is now recognized as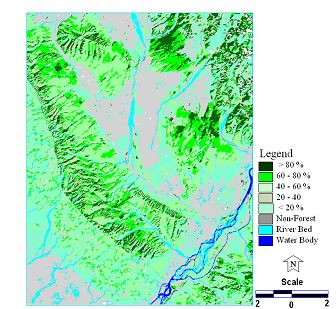
P.S. Roy                                                                                     365

“burnt center” of the planet. Biomasss burning is generally believed to be a
uniquely tropical phenomenon because most of the information we have on its
geographical and temporal distribution is based on the observation of the tropics.
Because of poor satellite coverage, among other things, little information is
available on biomass burning in boreal forests, which represent about 29% of
the world’s forests.

Table 1. Global estimates of annual amounts of biomass burning and resulting
release of carbon into the atmosphere

    Source of burning                     Biomass burned               Carbon released
   (Tg dry matter/year)                                                 (TgC/year)

   Savannas                                     3690                          1660
   Agricultural waste                           2020                           910
   Tropical forests                             1260                           570
   Fuel wood                                    1430                           640
   Temperate and boreal forests                 280                            130
    Charcoal                                     20                             30
    World total                                 8700                          3940

                   4000

                   3500

                   3000

                   2500                                Biomass burned (Tg dry matter/year)
       Tg / year

                   2000                                Carbon released (Tg C/year)

                   1500

                   1000

                    500

                      0
                          1   2        3        4           5         6
                                   Source of Burning

Figure 5: Global estimates of annual amounts of biomass burning and of the resulting release
of carbon into the atmosphere (Andreae et al., 1991). Where, 1. Savannas; 2 Agricultural
waste; 3. Tropical Forests; 4. Fuel Wood; 5. Temperate & Boreal Forest and 6. Charcoal.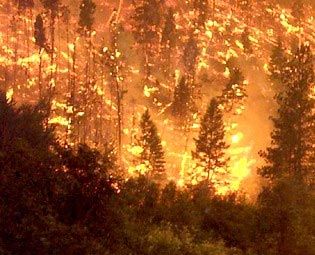
366                                         Forest Fire and Degradation Assessment

     Knowledge of the geographical and temporal distribution of burning is
critical for assessing the emissions of gases and particulates to the atmosphere.
One of the important discoveries in biomass burning research over the past
years, based on a series of field experiments, is that fires in diverse ecosystems
differ widely in the production of gaseous and particulate emissions. Emissions
depend on the type of ecosystem; the moisture content of the vegetation; and
the nature, behavior and characteristics of the fire.

     Fire regimes in tropical forests and derived vegetation are characterized and
distinguished by return intervals of fire (fire frequency), fire intensity (e.g.
surface fires vs. stand replacement fires) and impact on soil. Basic tropical and
subtropical fire regimes are determined by ecological and anthropogenic (socio-
cultural) gradients.

    Lightning is an important source of natural fires which have influenced
savanna-type vegetation in pre-settlement periods. The role of natural fires in
the “lightning-fire bioclimatic regions” of Africa was recognized early (e.g.
Phillips 1965; Komarek 1968). Lightning fires have been observed and reported
in the deciduous and semi-deciduous forest biomes as well as occasionally in
the rain forest. Today the contribution of natural forest to the overall tropical
wildland fire scene is becoming negligible. Most tropical fires are set intentionally
by humans (Bartlett 1955, 1957, 1961) and are related to several main causative
agents (Goldammer 1988) :

z     deforestation activities (conversion of forest to other land uses, e.g.
      agricultural lands, pastures, exploitation of other natural resources);
z     traditional, but expanding slash-and-burn agriculture;
z     grazing land management (fires set by graziers, mainly in savannas and
      open forests with distinct grass strata [silvopastoral systems]);
z     use of non-wood forest products (use of fire to facilitate harvest or improve
      yield of plants, fruits, and other forest products, predominantly in deciduous
      and semi-deciduous forests);
z     wildland/residential interface fires (fires from settlements, e.g. from cooking,
      torches, camp fires etc.);
z     other traditional fire uses (in the wake of religious, ethnic and folk traditions;
      tribal warfare) and
z     socio-economic and political conflicts over questions of land property and
      land use rights.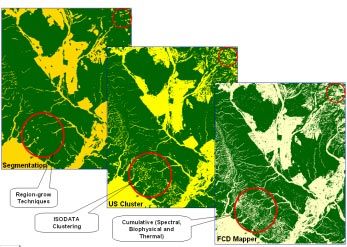
P.S. Roy                                                                     367

     Comparatively little is known empirically about the vegetation fire regime
of Southeast Asia when viewed at larger scales. This is despite the importance
of fire as an agent of regional land cover change and in modifying atmospheric
chemistry. Fire is widely used in rice cultivation in Asia where 94 % of the
world’s crop is grown (Nguyen et al., 1994). It also has a high incidence within
forests in tropical Asia (Hao and Liu, 1994) where it is mainly associated with
shifting cultivation (McNeely et al., 1991). As with the tropics and the African
tropics, Southeast Asian tropical forests are of considerable ecological and
economic importance and make up about 20% of the world’s tropical forest
resource (after FAO, 1993). Information on biomass burning within the Indo-
Malayan region is needed to assist in the modelling of large-scale atmospheric
pollution and climate change phenomena and for regional use by landuse
managers, habitat conservationists, and national and regional policy makers.
Mainland Southeast Asia is the focus of the Southeast Asian fire, since it is
more strongly seasonal and less humid than many parts of insular South-east
Asia (Nix, 1983) and thus both favour the use of fire as a land management
tool and support more fire-prone ecosystems (54% of forest formations are
tropical seasonal forest compared to 4% within insular regions, FAO, 1993).
The mainland Southeast Asian product offers an analysis of the spatial and
temporal distribution of vegetation fire in mainland Southeast Asia using
AVHRR 1 km resolution data for the period of single dry season (that chosen is
from November 1992 to April 1993).

The Socio-Economic and Cultural Background of Forest Fires

     While many of the publications cited above contain information on fire
causes, there are only few in-depth studies available on the socio-economic and
cultural aspects of managing the fire problem. The forest fire management
system in Thailand has its strong base on a fire prevention approach which is
being realized by a close cooperation with the local population (cf. Contribution
by S. Akaakara, this volume). The same refers to the IFFM approach in Indonesia
(cf. Contribution by H. Abberger, this volume; see also the work of Otsuka
[1991] on forest management and farmers in East Kalimantan). A basic study
on the socio-economic and cultural background of forest fires in the pine forests
of the Philippines was conducted in the late 1980s and reveals the usefulness
of such surveys for further management planning (Noble, 1990).

    Despite the initial efforts it must be stated that there is a tremendous gap
of expertise and available methodologies of socio-economic and cultural
approaches in integrating people into operational fire management systems.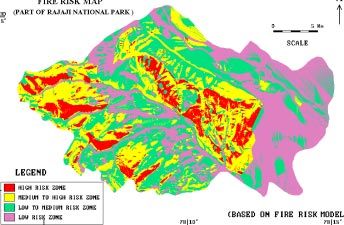
368                                        Forest Fire and Degradation Assessment

According to the IFFN (2002) the ecological and socio-economic consequences
of wild land fires in India include -

z     Loss of timber, loss of bio-diversity, loss of wildlife habitat, global warming,
      soil erosion, loss of fuelwood and fodder, damage to water and other natural
      resources, loss of natural regeneration. Estimated average tangible annual
      loss due to forest fires in country is Rs.440 crore (US$ 100 millions
      approximately).

z     The vulnerability of the Indian forests to fire varies from place to place
      depending upon the type of vegetation and the climate. The coniferous
      forest in the Himalayan region comprising of fir (Abies spp.), spruce (Picea
      smithiana), Cedrus deodara, Pinus roxburghii and Pinus wallichiana etc. is
      very prone to fire. Every year there are one or two major incidences of forest
      fire in this region. The other parts of the country dominated by deciduous
      forests are also damaged by fire (see Table 1).

    Various regions of the country have different normal and peak fire seasons,
which normally vary from January to June. In the plains of northern and central
India, most of the forest fires occur between February and June. In the hills of
northern India fire season starts later and most of the fires are reported between
April and June. In the southern part of the country, fire season extends from
January to May. In the Himalayan region, fires are common in May and June.

Table 2. Susceptibility and vulnerability of Indian forests to wildfire (IFFN,
2002)

       Type of Forests            Fire Frequent (%)         Fire Occasional (%)
       Coniferous                          8                        40
       Moist Deciduous                    15                        60
       Dry Deciduous                       5                        35
       Wet/Semi-Evergreen                  9                        40
       North-Eastern Region               50                        45

Fire Policy and Legal Aspects

   The issue of a fire policy and relevant legislation and regulations are the
most important prerequisites for any fire management activities. A fire policy,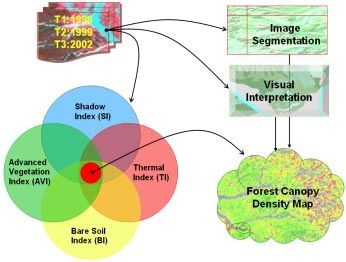
P.S. Roy                                                                     369

which would be a basic commitment to the fire problem and the definition of
a national concept of policies to encounter fire-related problems, needs to
embrace the following basic considerations (if not at national level, a policy
may also be formulated at the regional or district level):

a. A general statement on the role and impacts of fire in the most important
   forests and other vegetation of the country (or management unit).

b. A general statement regarding how to counter the negative impacts of fire.

c. Definition of an overall fire management strategy. Definition of fire
   management policy in the various geographic regions in accordance with
   vegetation type, demographics and land uses.

d. Definition of the role of the population in participating in fire management
   activities, especially in fire prevention.

     A variety of legal aspects needs to be considered for the implementation of
a fire policy and for coherent fire management planning, in general e.g. :

a. Clear definition of landownership and availability of a landownership
   register.

b. Development of a landscape plan in which clear definitions are given of the
   land uses permitted or practiced on a defined area of land.

c. Regulations concerning construction in forests and wildlands, especially
   on burned areas.

d. Clear definition of fire management responsibilities as related to the various
   types of land ownerships and different tasks in fire management, e.g. fire
   prevention, fire detection, and fire suppression (including coordination
   and cooperation).

e. Rehabilitation of burned lands.

f.   Law enforcement.

Regional Co-operation in Forest Fire Management

    Beginning in 1992, as a consequence of the regional smog problems caused
by land-use fires, member states of the Association of South East Asian Nations
(ASEAN) created joint activities to encounter problems arising from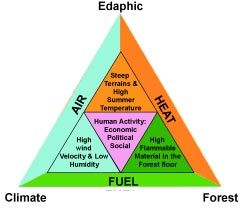
370                                       Forest Fire and Degradation Assessment

transboundary haze pollution. ASEAN workshops held in Balikpapan (1992)
and Kuala Lumpur (1995) summarized the problems and urged appropriate
initiatives. The ASEAN Conference on “Transboundary Pollution and the
Sustainability of Tropical Forests” is one of the first important steps to materialize
the conceptual framework proposed during the past years.

   Most important in future regional ASEAN-wide cooperation in fire
management will be the sharing of resources. The foci will be :

z     predicting fire hazard and fire effects on ecosystems and atmosphere;

z     detection, monitoring and evaluating fires; and

z     sharing fire suppression technologies.

     The ASEAN Fire Forum during this meeting will provide important
recommendations on joint future actions. The ASEAN region will potentially
serve as a pilot region in which resource sharing will be based on the fact that
two distinct fire problem seasons exist within the region. While within Indonesia
the fire season is mainly during the months of September to November (southern
hemisphere dry season), the fire season in monsoon-influenced SE Asia is
between January and May. Sharing resources means that hard and software
technologies and required personnel can concentrate on the hemispheric fire
problems, and even costly fire suppression equipment, e.g. airplanes, can be
used more economically throughout the whole year.

Forest Degradation & Fire Disasters in India during the Past Few Years

     The normal fire season in India is from the month of February to mid June.
India witnessed the most severe forest fires in the recent time during the summer
of 1995 in the hills of Uttar Pradesh and Himachal Pradesh in the Himalayas
in northern part of India. The fires were very severe and attracted the attention
of whole nation. An area of 677, 700 ha was affected by fires. The quantifiable
timber loss was around US$ 45 million. The loss to timber increment, loss of
soil fertility, soil erosion, loss of employment, drying up of water sources and
loss to biodiversity were not calculated by the Committee appointed by the
Government to enquire into the causes of fires, as these losses are immeasurable
but very significant from the point of view of both economy as well as ecology.
The fires in the hills resulted in smoke in the area for quite a few days. The
smoke haze, however, vanished after the onset of rains. These fires caused changes
in the micro-climate of the area in the form of soil moisture balance and increased
P.S. Roy 371
evaporation. Lack of adequate manpower, communication and, water availability
in the hills helped this fire spread rapidly reaching the crown level. The thick
smoke spread over the sky affecting visibility up to 14,000 feet.
Assessment of Forest Degradation
The statistics on forest fire damage are very poor in the country. In the
absence of proper data, it is difficult to arrive at the accurate losses from the
forest fires. Moreover, the losses from fires in respect of changes in biodiversity,
carbon sequestration capability, soil moisture and nutrient losses etc are very
significant from the point of view of ecological stability and environmental
conservation. To a certain extent, the loss due to forest fires can be estimated
based on the inventories made by the Forest Survey of India (FSI) as reported
in the state of forest report 1995 and subsequent field observations conducted
by them. The statistics of losses from forest fires from the various states of the
union is still very sketchy and fragmented. Much of the data available does not
reflect the ground situation and is grossly under reported. The total reported
loss from the states of the union is around US$ 7.5 million annually.
The Forest Survey of India data indicate 50% of the forest areas as fire
prone. This does not mean that country’s 50% area is affected by fires annually.
Very heavy, heavy and frequent forest fire damage are noticed only over 0.8%,
0.14% and 5.16% of the forest areas respectively. Thus, only 6.17% of the
forests are prone to severe fire damage. In absolute terms, out of the 63 million
ha of forests an area of around 3.73 million ha can be presumed to be affected
by fires annually. At this level the annual losses from forest fires in India for the
entire country can be moderately estimated at US$ 107 million. This estimate
does not include the loss suffered in the form of loss of biodiversity, nutrient
and soil moisture and other intangible benefits. Based on the UNDP project
evaluation report of 1987, if 40 million ha of forests are saved annually from
forest fires due to implementation of modern forest fire control methods, the
net amount saved at todays’ prices would come to be US$ 6.8 million.
Remote Sensing & Geographic Information System
Satellite observations providing a global survey of the composition of biomass
burning plumes and their dispersal in the global atmosphere will become
available by the middle to late 1990s and will be an important contribution to
this task. Global mapping of CO and O3 columns can be achieved by the
Global Ozone Monitoring Experiment (GOME) and Scanning Imaging372 Forest Fire and Degradation Assessment
Fire Affected Areas
Figure 6: Map f India showing the districts with regular interval of forest fire (Source: Forest
Survey of India, Dehra Dun)
Absorption Spectrometer for Atmospheric Chartography/Chemistry
(SCIAMACHY) sensor, scheduled for inclusion on the ESA ERS-2 (European
Space Agency Remote Sensing Satellite) in 1993-94 and/or later launches.
Global mapping CO is available on the EOS-A platform in the late 1990s,
using the MOPPITT (Measurement of Pollution in The Troposphere) or
TRACER sensors. The sensor TES, planned for launching on the EOS-B
platform, will provide horizontal and vertical mapping of a number of trace
species including CO, O3, NOX and HNO3.
Potentials of Satellite Remote Sensing
The inability to detect wild land fires during initial stages and take rapid
aggressive action on new fires is perhaps the most limiting factor in controllingP.S. Roy 373
such wild land fires. This is especially true for fires in areas with limited access.
Providing an effective response to wildland fires requires four stages of analysis
and assessment:
z Determining fire potential risk
z Detecting fire starts
z Monitoring active fires
z Conducting post-fire degradation assessment
The technological advancement in space remote sensing has been widely
experimented in last three decades to obtain the desired information.
Fire Potential
Fire potential depends on the amount of dead and live vegetation and
moisture contents in each. The amount of dead and live vegetation is estimated
from a high quality landcover map derived from (ideally) a high resolution
sensor, such as the IRS, Landsat TM or SPOT multispectral scanner or from
lower resolution sensor such as NOAA-AVHRR or NASA Moderate Resolution
Imaging Spectrometer (MODIS). These satellites can be used to monitor changes
in the vegetation vigor, which is correlated with the moisture of the live
vegetation. The moisture in the dead vegetation is estimated from knowledge
of local weather conditions. Thus, a baseline land cover map and immediate
estimate of vegetation condition are needed.
The research project FIRE in global Resource and Environmental monitoring
(FIRE) was initiated in 1994 by the Monitoring of Tropical Vegetation unit
(MTV) of the Commission of the European Union Joint Research Centre in
order to address such issues. A key objective of this initiative was the
documentation of vegetation fire patterns for the entire globe and the analyses
of such patterns in relation to land use/land cover dynamics in tropical and
inter-tropical regions. Obviously, such vegetation fires represent only part of
the overall biomass burning activity, which also includes the burning of domestic
fuels, occurring at the surface of the Earth. Due to both the characteristics of
the phenomenon and to the multiscale objective, the fire monitoring system
under development in the MTV Unit relies on remote sensing techniques as
the main source of information. This is the case since earth observation from
space provides systematic and consistent measurements of a series of parameters374 Forest Fire and Degradation Assessment
related to fire and fire impacts, and, consequently, is an ideal medium for the
study of vegetation fire. The AVHRR on the NOAA satellites is the main source
of data for the studies done by the FIRE project. For the 5 km GAC (Global
Area Coverage) data, historical archives exist that extend back to 1981 and
consist of daily images covering the entire globe. More limited data sets, from
the same AVHRR sensor but at 1 km resolution also exist at global, continental
and regional level. A mobile AVHRR data receiving station is also used by the
FIRE project.
Fire Detection
Satellite-borne sensors can detect fires in the visible, thermal and mid-
infrared bands. Active fires can be detected by their thermal or mid-infrared
signature during the day or by the light from the fires at night. For their
detection the sensors must also provide frequent overflights, and the data from
the overflights must be available fast. Satellite systems that have been evaluated
for fire detection include AVHRR, which has a thermal sensor and makes daily
overflights, the Defense Meteorological Satellite Program (DMSP) Optical
Linescan System (OLS) sensor, which makes daily overflights and routinely
collects visible images during its nighttime pass, and the NOAA Geostationary
Operational Environmental Satellite (GOES) sensor, which provides visible
and thermal images every 15 minutes over the United States and every 30
minutes elsewhere. Therefore AVHRR has been used most extensively for
detecting and monitoring wildfires.
Fire Monitoring
Fire monitoring differs from fire detection in timing and emphasis rather
than in the methods used to process the satellite image information. Satellite
sensors typically provide coarse resolution fire maps which show the general
location and extent of wildland fires. Detailed fire suppression mapping requires
the use of higher resolution airborne thermal infrared sensors to accurately
map small fire hot-spots and active fire perimeters. Higher-resolution fire maps
are needed to deploy fire suppression crews and aerial water or retardant drops.
Fire Assessment
Once fires are extinguished, a combination of low resolution images
(AVHRR) and higher-resolution images (SPOT, Landsat and Radar) can be
used to assess the extent and impact of the fire. Radar has proved effective inP.S. Roy 375
monitoring and assessing the extent and severity of fire scars in the boreal forests
(Kasischke et al., 1994), for quantifying biomass regeneration in tropical forests
(Luckman et al., 1997) and for modeling ecosystem recovery in Mediterranean
climates (Vietma et al., 1997). Low resolution visible and infrared sensors such
as AVHRR have proved useful for automated fire mapping (Fernandes et al.,
1997) and for evaluating the impact of fire on long-term land cover change
(Ehrlich et al., 1997). Multi-resolution studies incorporating both AVHRR
and Landsat images reveal the scale-related influences of analyzing post-fire
vegetation regeneration (Steyaert et al., 1997).
Information related to new fire scars and vegetation succession within the
scars can be used to update the baseline vegetation map used for fire prediction.
Continued monitoring of the fire scars provides extensive information on land
cover transitions involving changes in productivity and biodiversity, which in
turn influence fire potential. Knowledge of the extent and intensity of fire scars
provides important information for the rehabilitation of the burn areas.
Globally no reliable statistics about the exact location and annual areas
burnt by forest fire are available. The information required and what can be
achieved using Remote Sensing data are presented as Table 3.
Table 3. Forest Fire Assessment
Class of Information Type of Information
a) alpha type Fire : start and end dates, location, size and cause
b) beta type Fuels biome classification and fuel loading forest
inventory (number), age class, size class
c) gamma type Fire characterisation (crown, surface etc.), fuel
consumption and structural involvement (wildland
urban interface)
d) delta type Number of fires, areas burnt (by forest type), cause of
fires (number)
e) epsilon type Gas and aerosol emission data
f) eta type Total expenditure of fire programme, total fire
suppression costs and total direct losses of merchantable
timber, structure losses376 Forest Fire and Degradation Assessment
Detection and Monitoring of Fire
Space borne remote sensing technologies have improved the capability to
identify fire activities at local, regional and global scales by using visible and
infrared sensors on existing platforms for detecting temperature anomalies, active
fires, and smoke plumes. Geosynchronous satellites such as GOES and polar
orbiting sensors such as the NOAA AVHRR have been used successfully to
establish calendars of vegetation state (fire hazard) and fire activities. Other
satellites with longer temporal sampling intervals, but with higher resolution,
such as Landsat and SPOT, and space borne radar sensors, deliver accurate
maps of active fires, vegetation state and areas affected by fire. Fire scar (burned
area) inventories for emission estimates are difficult to conduct, especially in
the region of the Maritime Continent in which cloud cover inhibits ground
visibility of many sensors. Radar sensors such as SAR offer good potential
application in fire scar characterisation. ASEAN scientists (candidate
institutions: ASEAN Specialized Meteorological Centre (ASMC) and the
Indonesian National Institute of Aeronautics and Space (LAPAN) should
consider appropriate research.
Table 4. Different sensors and possible potential applications to study forest
fires
Sensors : Potential Applications
Video Images : Fire characterisation, burnt area estimation, fire
propagation, estimate of fire density and burnt
scars
IRS PAN : Exact location of forest fires, extent of fires and
types of land cover of fires, impact of human
activities on incidence of forest fire
IRS LISS III Landsat TM : Land cover characterisation and forest non forest
mapping
IRS WiFS AVHRR-HRPT : Fire characterisation, land cover characterisation
and monitoring
AVHRR-GAC : Characterisation, land cover characterisation,
seasonal variations in land cover, inter annual
variation in land cover, land cover change and
burnt area estimation
ERS-ATSR : Burnt area estimationP.S. Roy 377
The fire episode of 1997 in Indonesia has clearly demonstrated that the
“hot spot” information generated by the NOAA AVHRR is of limited value.
New sensors are currently developed which are specifically aimed to satisfy the
demands of the fire science and management community, e.g., the BIRD satellite
project of the Deutsche Forschungsanstaltfur Luft- und Raumfahrt (DLR) (with
a two-channel infrared sensor system in combination with a wide-angle
optoelectronic stereo scanner) and the envisaged fire sensor component FOCIS
on the International Space Station (Briess et al., 1997; DLR 1997). Indonesia’s
Ministry for Research and Technology (BPPT) is interested to collaborate with
the DLR in testing and validating the BIRD satellite.
Fire Weather and Fire Danger Forecasts
Weather forecasts at short to extended time ranges and global to regional
space scales can be utilized for wildland fire management, e.g. the recent proposal
by the US National Centre for Environmental Prediction (NCEP). The
Normalized Difference Vegetation Index (NDVI) has been successfully used
for estimating fire danger. A recent (not yet published, 1997) report of the
IDNDR (IDNDR 1997) gives an overview on a series of candidate systems for
early warning of fire precursors which should investigated by Indonesian
scientists.
The proposed Canadian project “Fire Danger Rating System for Indonesia
: An Adaptation of the Canadian Fire Behavior Prediction System” will be an
important contribution towards improving the basic knowledge on the weather-
fuel-fire/fire behaviour relationships.
The fire danger rating systems which are already in use in some parts of
Indonesia (IFFM-GTZ), however, may be more readily available to produce a
regional early warning system within a relatively short time period of a few
months. The ministry of Environment of Singapore has indicated interest to
test the system at ASEAN level.
The ASEAN Fire Weather Information System (ASFWIS) is a co-operation
between ASEAN and the Canadian Forest Service. It provides maps describing
the current fire weather situation in South East Asia. This system is based
upon the Canadian Forest Fire Danger Rating System (CFFDRS) (for further
information to the CFFDRS refers to ASFWIS). Studies have shown that the
CFFDRS is applicable outside of Canada. Currently it is also used in a modified
form in New Zealand. In New Zealand the Fire Weather Indices Fine Fuel378 Forest Fire and Degradation Assessment
Moisture Code (FFMC) and the Initial Spread Index (ISI) represent the fire
danger in the scrublands. The Duff Moisture Code (DMC) is also applicable
in South East Asia, because it potentially describes the moisture state of the
upper peat layers in peat and peat swamp forests. All three parameters may
serve as a suitable indicator of forest fire danger in South East Asia.
CASE STUDIES
Forest Fire Assessment
Forest Fire Prone Area Mapping – A Case Study in GIR-Protected Area
The following study had been carried out in GIR forest which is located in
the Saurashtra Peninsula of Gujarat. It is the largest biologically intact contours
tract of forest and the only abide of the Asiatic Lion in the world. The main
objective of the study is to design, develop and demonstrate RS/GIS based
approach in order to prepare region/type level fire danger rating system taking
into consideration risk, hazard, meteorological parameters and human
interventions and also to prepare forest fire risk area/disaster map for GIR forest
Gujarat. Two types of data are used in the study i.e. spatial and non spatial.
Spatial data mainly includes Remote Sensing data, forest block, compartment
boundaries, road/railway network and the most important existing water bodies
in that area where the non-spatial data pertains to meteorological data on
temperature, relative boundary, rainfall, wind, socio-economic data.
The methodology adopted was visual, digital and hybrid method for Remote
Sensing data analysis. IRS 1C/1D LISS III FCC’s were used for visual
interpretation for classification of vegetation in the entire GIR-PA region. To
identify fire scars digital data of IRS 1C/1D WiFS had been used. WiFS data
had also been used to delineate water bodies and fire scars. The parameters
used for modelling the fire risk zone were –
z Fire occurrence maps for three or more seasons
z Classified vegetation map (two seasons)
z Road network (Proximity analysis)
z Maximum temperature
z Relative humidityP.S. Roy 379
z Rainfall data
z Forest block compartments
z Rivers, streams and water bodies
z Settlements location map (Proximity analysis)
All these parameters have direct/indirect influence on the occurrence of fire
and were integrated using GIS and a multi parametric weighted index model
has been adopted to derive the ‘fire-risk’ zone map. It is classified into 6 risk
zones. It was observed that very high and high zones are mostly at the fringe of
the protected area or within 100 m of the roads passing through the region
with temperature above 40oC and humidity less than 35%. Apart from human
interference the analysis has shown that vegetation type and meteorological
parameters have vital importance for hazard zonation.
Spatial Modelling Techniques for Forest Fire Risk Assessments
The study attempted to give insight in the use of RS and GIS for fire
management. Spatial modelling and analysis have been done in GIS environment
for identification of areas prone to fire risk and subsequently response routes
were suggested for extinguishing forest fires (Jain et al., 1996 and Porwal et al.,
1997). Some of the necessary components contributing to the fire behaviour
viz., fuel (vegetation types), topography (slope and aspect etc.) and the causes
of fire (i.e., roads and settlements) have been given due weightages.
The study has been done in part of Rajaji National Parks covering an area
of approximately 115 km2. The topography is variable within the altitude
ranging between 300-700 m above msl. The climate is subtropical type with
the temperature varying from 13.1oC in January to 38.9oC in May & June.
The area is dominated by moist Siwalik sal forest, moist mixed deciduous forest,
dry mixed deciduous forest, chirpine and shrubs.
Landsat TM false colour composite (FCC) and SPOT images on 1:50,000
scale have been visually interpreted to obtain primary map layers viz. Forest
cover type map, density map etc. The contour map, road network settlement
etc. have been obtained from Survey of India toposheets. This spatial data in
the form of map was digitized and transformed in machine-readable form for
integration of thematic information. However, before their integration (Fig. 7)
these were converted into index map viz., fuel type index maps from forest380 Forest Fire and Degradation Assessment
cover type map, aspect and slope index map from the slope and aspect map and
distance index from the road map.
Figure 7: Fire risk zonation model
Spatial modelling has been done to obtain the combined effect of fuel type
index, elevation index, slope index, aspect index and the distance/accessibility
index. Weightages have been assigned as per the importance of particular variable
contributing in fire environment. In this case the highest weightage has been
given to fuel type index because fuel contributes to the maximum extent because
of inflammability factor. The second highest weightage has been given to aspect
because sun facing aspects receives direct sun rays and makes the fuel warmer
and dry. The model output i.e., cummulative fire risk index (CFRISK) value
map was obtained by integrating in ILWIS.
CFRISK = FUI * 4 + ASI * 3 + SLI * 2 + ACI + ELI1
Where FUI, ASI, SLI, ACI and ELI are the fuel type index, aspect index,
slope index, accessibility index and elevation index. The fire risk index values in
this map were ranging from 12-66. Based on statistics this map was reclassified
and final fire risk zone map was obtained.
In another study in Dholkhand range integration of various influencing
factors has been done by following a hierarchical system on the basis of experience
and the opinion of experts in the field and weightages were assigned to different
variables on a 1-10 scale.P.S. Roy 381
FR = [10Vi = 1-10 (5Hj = 1-4 + 5Rk = 1-5 + 3 Sl = 1-4)
Where FR is the numerical index of fire risk, Vi the vegetation variable (with 1-
10 classes), Hj indicates the proximity to human habitation (with 1-4 classes),
Sl indicates slope factor (with 1-4 classes) and Rk is road/fire line factor (with 1-
5 classes). The subscripts i, j, k, l indicate sub-classes based on importance
determining the fire risk.
After obtaining the fire risk map (Fig. 8) in Motichur range (part of Rajaji
National Park) attempt was made to suggest response routes for extinguishing
forest fires. The forest type maps obtained by using Remote Sensing data have
been used to assign non-directional costs under different vegetation category
and digital elevation model was used for giving directional costs using
GDIRGRAD programme compatible to be used in ILWIS. Finally the
GROUTES programme was used to trace final response route plan from the
source i.e., forest range head quarter to high fire risk areas (Porwal, 1998). A
final map showing response routes planned and dropped out fire risk map
obtained in the beginning was developed.
Figure 8: Fire Risk Map (part of Rajaji National Park)382 Forest Fire and Degradation Assessment
Forest fires cause significant damage to the forest ecosystem. In Central
Himalayan region forest fires occur between April to June annually when the
weather is hot and dry. Usually the south facing slopes are prone to fire due to
direct sun insulation and inflammable litters of pine and dry deciduous trees
at the forest floor. The presence of habitation, roads, footpaths etc., and their
distance from such sites indicate an additional yardstick for the occurrence of
forest fires. Extensive forest area during summer of 1995 in the Western and
Central Himalaya drew wide attention of the forest managers and
environmentalists. This study attempts to provide estimates about forest fire
damaged areas using digital satellite remote sensing data in the Tehri district of
Garhwal Himalaya (Pant et al., 1996).
The study area is characterized by hilly and mountainous terrain supporting
varied forest types and composition controlled by altitude, variety of land use/
land cover types along with perpetual snow cover on the mountain peaks. Pine
is the dominant forest type and is most susceptible to fire almost every year
particularly near habitation.
The Indian Remote Sensing Satellite-1B, LISS-II (IRS-B, LISS-II) data of
pre-fire and post fire period (1993-95) were studied and analysed digitally in
the IBM RS/6000, EASI/PACE computer system. The supervised per pixel
classification and digital enhancement approaches have been used to identify
the forest fire affected areas along with other cover types. Prior to this digital
geometric correction of satellite images have been done using 1:250,000 scale
Survey of India topographical sheets and both the images were masked with
respect to district boundary. Digital enhancement techniques facilitated to
choose correct training sets for supervised classification technique using maximum
likelihood classifier. The training sets were assigned based on the ground truth
information collected from fire burnt areas and surrounding cover types. Out
of the various enhancement techniques the best result has been obtained by
making the colour composite image of IR, NDVI and intensity under equal
stretching.
The total area affected under forest fire has been estimated as 910.01 km2
or 20.58% of total geographical area of 4421.26 km2. This includes forest
burnt area as 168.88 km2 or 3.38% of total geographical area, partially burnt
forest area (area under active fire) as 473.69 km2 or 10.71% of total geographical
area and the partially burnt fallow land/grassland/scrub land as 267.44 km2 or
6.05%. The forested area identified under smoke plumes has been estimatedP.S. Roy 383
as 130.96 km 2 or 2.96% of total forests area. The overall accuracy of
classification has been assessed as 88%.
FOREST DEGRADATION ASSESSMENT
Deforestation Monitoring
The pressure on forests is greatest in the developing countries. The primary
causes of deforestation are encroachment of forest area for agricultural production
and exploitation of forest cover for meeting housing and industrial needs.
Deforestation leads to an increase in the loading of CO2 in the atmosphere.
Increased albedo and change in aerodynamic roughness over deforested areas
alter the energy balance bearing implications on atmospheric circulation patterns
and rainfall statistics. Deforestation leads to soil erosion and gradual loss of
biodiversity.
The amount of vegetation loss/deforestation due to encroachment can be
estimated by the use of remote sensing technique. The impact of slash and
burn during and after the ‘jhumming’ (slash and burn agriculture) operations
is clearly visible from remote sensing imageries. The representative relationship
between the population density and the percent of forest cover provides
information about the rate of deforestation and thereby helps in formulating
the mitigation plan. Utilization of remote sensing tool for stock mapping and
growing stock estimation for forest management improves reliability. Assam is
well known for its large forest tracts. The recorded forest area in Assam is 39.15%
of the geographical area. These forests are repositories of a rich biological diversity.
At the same point there is tremendous pressure on these forest lands. There has
been an overall decrease of 1,031 sq. km of dense forest from 1997 to 1999 in
Assam. This decrease is more pronounced in the Brahmaputra valley in the
areas like Sonitpur and others. This study was undertaken after large-scale
deforestation was observed in above district by IIRS team of scientists working
in Arunachal Pradesh. The objective was to assess the large-scale deforestation
and loss in biodiversity.
This study covers the entire Sonitpur district (5,103 km2) located in upper
Assam valley. Land use within the area is divided primarily among tropical
semi-evergreen forest, moist deciduous forest, riverain forest, pasture land,
agriculture and tea gardens. Good quality Landsat-TM and IRS-1C LISS-III
false colour composites of dry season pertaining to 1994, 1999 and 2001 periods
were used to monitor the loss of biodiversity. All scenes were radiometrically384 Forest Fire and Degradation Assessment
and geometrically corrected and on-screen visually interpreted into forest and
non-forest cover classes. The total number of plant species, species diversity,
economically important and endemic species in similar forests in Assam were
worked out in field to understand the type of loss incurred due to large scale
deforestation.
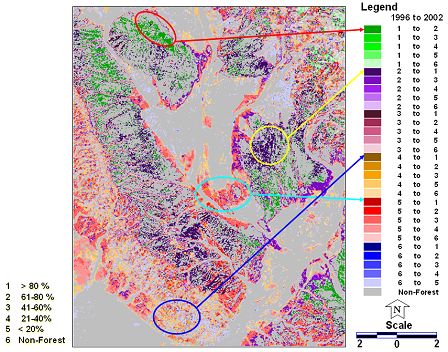
The forest cover type of 1994, 1999 and 2001 are shown in Fig. 9. All
three types of forests viz., semi-evergreen, moist deciduous, and riverain could
be mapped from three data sets of different time periods. Results indicate that
moist deciduous forests occupy the maximum area followed by tropical semi-
evergreen and riverain. A loss of 86.73 km2 (1.68%) was observed between
1994-99 and 145.44 km2 between 1999-2001. An increase of 5.0 km2 area
was observed in moist deciduous forest. The loss in semi-evergreen forests was
found to be 0.52 km 2 (0.01%) from 1994 to 1999 while between 1999-
2000/2001 it was 2.04 km2 (0.04%). There was no loss in case of riverain
forests. Table 5 gives the area under different forest types during different
periods.
Figure 9: Deforestation monitoring in Sonitpur District of Assam
The results of field survey show that moist deciduous forests possess highest
biodiversity (Shannon and Wiener Index -6.49) followed by evergreen (5.60)
and semi-evergreen (5.45) forests.P.S. Roy 385
Table 5. Area (km2) under different forest and non-forest categories in Sonitpur
Land cover 1994 1999 2001 Net change
Moist deciduous 743.00 656.76 513.36 (-)229.64
Semi-evergreen 59.71 59.19 57.15 (-)2.56
Riverain 7.65 7.65 7.65 No change
Grassland 249.03 251.07 250.56 (+)1.53
Tea garden 383.24 385.28 384.77 (+)1.53
River 658.80 658.80 658.80 No change
Non-forest 3001.58 3084.25 3230.71 (+)229.13
Total 5103.00 5103.00 5103.00 No change
The spatial distribution of different forest types from 1994 to 2001 shows
that forest cover in the Sonitpur district undergoing massive reduction with
time. The rate of deforestation in the district worked out to be 10.7% from
1994 to 1999 and 20% from 1999 to 2001. The overall rate of forest degradation
was estimated to be 28.65% between 1994 and 2001, which may be the
highest rate of deforestation anywhere in the country. The findings of the field
survey suggest that we have lost very invaluable moist deciduous and semi-
evergreen forests in the ongoing deforestation in Sonitpur district. Ironically,
these forests happen to be the climax vegetation in the region, known for their
immense ecological and economic value.
Forest Canopy Density Assessment
Forest cover is of great interest to a variety of scientific and land management
applications, many of which require not only information on forest categories,
but also tree canopy density. Forest maps are a basic information source for
habitat modelling, prediction and mapping of forest insect infestations, and
plant and animal biodiversity assessment. Foresters and forest managers
especially require information for gap filling activities to restore forest wealth.
Forest managers require accurate maps of forest type, structure, and seral state
for fire (Roy, et al., 1997) and insect damage assessment and prediction
(Chandrasehkhar et al., 2003), wildlife habitat mapping, and regional-scale
ecosystem assessment (Blodgett et al., 2000). Few attempts have been reported
to stratify the forest density using satellite remote sensing digital data (Roy et
al. 1990). Previous efforts to estimate tree canopy density as a continuous386 Forest Fire and Degradation Assessment
variable have utilized linear spectral mixture analysis or linear regression
techniques (Iverson et al., 1989; Zhu and Evans, 1994; DeFries et al., 2000).
Other techniques such as physically based models and fuzzy logic have also
been explored but are probably premature for use over large areas (Baret et al.,
1995; Maselli et al., 1995). International Tropical Timber Organisation (ITTO)
and Japan Overseas Forestry Consultants Association (JOFCA) while working
on project entitled “Utilization of Remote Sensing” developed methodology
wherein biophysical spectral indices were developed to stratify forest density
(Anon., 1993 and Rikimaru, 1996). In this study the methodology has been
validated on an Indian test site.
Study Area
The study site is selected keeping in view the area covering different forest
types, structure and undergrowth conditions. Southern part of the Doon valley
of the Dehra Dun district of Uttaranchal state (lat. 30° 00' to 30° 16' N; long.
78° 00' to 78° 18' E) was selected for the study. The terrain of the area is
irregular and undulating. The summer temperature varies from 38.5°C to 16.7°C
and in winters it ranges from 23.6°C to 5.4°C. Precipitation varies from 175
cm to 228.6 cm per annum. The slope ranges from moderate to little bit steep
towards the stream lines. The climate is relatively moist tropical. The forest
types are mainly North Indian tropical moist Sal forest, North Indian tropical
dry deciduous forest, khair and sissoo dominated riverine forest, scrub and
degraded forests.
Materials and Methods
The Landsat Thematic Mapper (Landsat-TM) data was taken as an input
for the FCD (Forest Canopy Density) model. The FCD model comprises bio-
physical phenomenon modeling and analysis utilizing data derived from four
indices: Advanced Vegetation Index (AVI), Bare Soil Index (BI), Shadow Index
or Scaled Shadow Index (SI, SSI) and Thermal Index (TI). It determines FCD
by modeling operation and obtaining from these indices. Landsat-TM (Path-
Row 146-039) of 14-09-1996 and Enhanced Thematic Mapper (ETM+) data
(Path-Row 146-039) of 14-10-2002 has been used for the digital analysis of
forest canopy density. Phenology of the vegetation is one of the important
factors to be considered for effective stratification of the forest density. Optimum
season for the assessment of forest canopy density in the present study is August
– November months of the year. Pre-processing is done in Erdas Imagine to
enhance spectral signature of digital data and then enhanced image is imported
into BIL format to make it compatible with FCD mapper.P.S. Roy 387
The Forest Canopy Density (FCD) model combines data from the four
indices (VI, BI, SI and TI) (Fig. 10). The canopy density is calculated in
percentage for each pixel. Vegetation index response to all of vegetation cover
such as the forest, scrub land and the grass land was computed. Advanced
vegetation index (AVI) reacts sensitively the vegetation quantity. Shadow index
increases as the forest density increases. Thermal index increases as the vegetation
quantity increases. Black colored soil area shows a high temperature. Bare soil
index increases as the bare soil exposure degree of ground increase. These index
values are calculated for every pixel.
Figure 10: Approach used in the forest canopy density stratification
Note that as the FCD value increases there is a corresponding increase in
the SI value. In other words where there is more tree vegetation there is more
shadow. Concurrently, if there is less bare soil (i.e. a lower BI value) there will
be a corresponding decrease in the TI value. It should be noted that the VI is
“saturated” earlier than SI. This simply means that the maximum VI values
that can be regardless of the density of the trees or forest. On the other hand,
the SI values are primarily dependent on the amount of tall vegetation such as
tree which casts a significant shadow.388 Forest Fire and Degradation Assessment
Vegetation Density is calculated using vegetation index and bare soil index
as a prime inputs. It is a pre-processing method which uses principal component
analysis. Because essentially, VI and BI have high negative correlation. After
that, set the scaling of zero percent point and a hundred percent point. The
shadow index (SI) is a relative value. Its normalized value can be utilized for
calculation with other parameters.
The SSI was developed in order to integrate VI values and SI values. In
areas where the SSI value is zero, this corresponds with forests that have the
lowest shadow value (i.e. 0%). Areas where the SSI value is 100, correspond
with forests that have the highest possible shadow value (i.e.100%). SSI is
obtained by linear transformation of SI. With development of SSI one can now
clearly differentiate between vegetation in the canopy and vegetation on the
ground. This constitutes one of the major advantages of the new methods. It
significantly improves the capability to provide more accurate results from data
analysis than was possible in the past. Integration of VD and SSI means
transformation for forest canopy density value. Both parameters have dimension
and percentage scale unit of density. It is possible to synthesize both these
indices safely by means of corresponding scales and units of each
½-1
FCD = (VD+SSI+1)
Forest canopy stratification is carried out using object oriented image analysis.
In this approach, the tone and texture are considered for the base level
segmentation. Segmented objects are again put into hierarchical stratification
by selecting the test and training area based on the ground truth. Finally,
forest densities have been stratified using standard nearest neighbour
classification scheme. Semi-conventional onscreen visual interpretation of digital
data is carried out to map the forest canopy density. Details about the
methodology and techniques used for visual interpretation are discussed else
where (Roy et al., 1989).
Results and Discussion
The output FCD map generated from the semi-expert system (Fig. 11) is
sliced in to five density classes and same density stratification is also followed
in object oriented image analysis (image segmentation) (Fig. 12) and visual
image interpretation of digital data. Details of each density class are shown in
the Table 6. Overall analysis of forest canopy density in all the cases indicates
that majority of the forests in the study area have canopy closure of 40% toP.S. Roy 389 80%. However, some deviation has been observed between these techniques, class I (> 80 %) shows very high per cent difference, it is also observed that the deviation is reduced with decrease in the canopy density (Table 6 and Fig. 13). Figure 11: FCD map derived from Landsat TM and ETM+ (A: 14 Sep. 1996 and B: 16 Oct. 2002) Figure 12: Forest canopy density map derived from object oriented image segmentation
390                                         Forest Fire and Degradation Assessment

Table 6. Forest canopy density classes and area comparison between different
techniques

   Density strata    Visual              FCD Mapper Semi-           Object oriented
                     Interpretation (ha) expert (ha)                Image Analysis (ha)

   > 80%               8493.21                2917.73                   3435.30
   60 to 80%          11411.82               12803.76                  10421.25
   40 to 60%          15002.10               10808.26                   6284.70
   20 to 40%           8506.53               10832.58                  12718.16
   < 20%               7715.52                4966.11                   7012.98
   Non-forest         13701.40               26103.78                   3088.08
   Riverbed            3599.64                       —                 25472.70
   Total              68430.22               68432.22                  68433.17

 Figure 13: Variation in forest canopy density classes extracted from different techniques

    The accuracies of density maps generated from all the methodologies have
been assessed to validate the technique. Comparison of the density stratification
accuracies have been carried out with reference to ground control points and
You can also read